
Predicting occurrence tendency of Leptocybe invasa in China based on MaxEnt
-
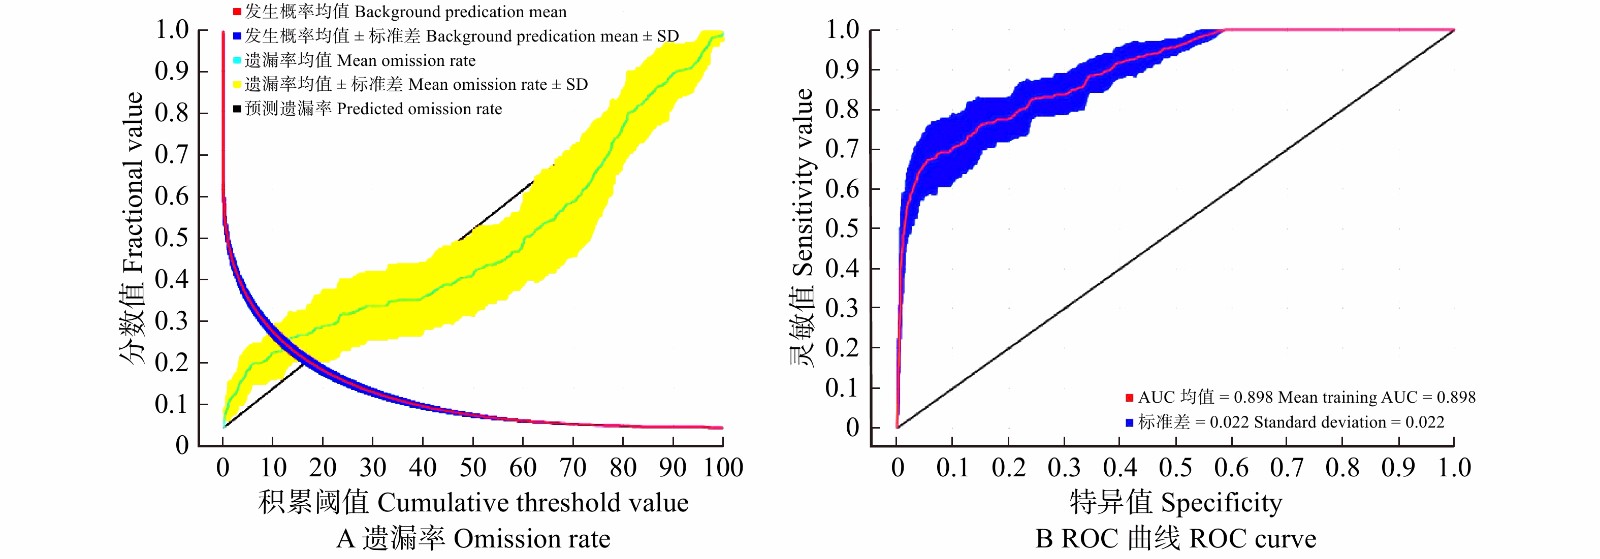
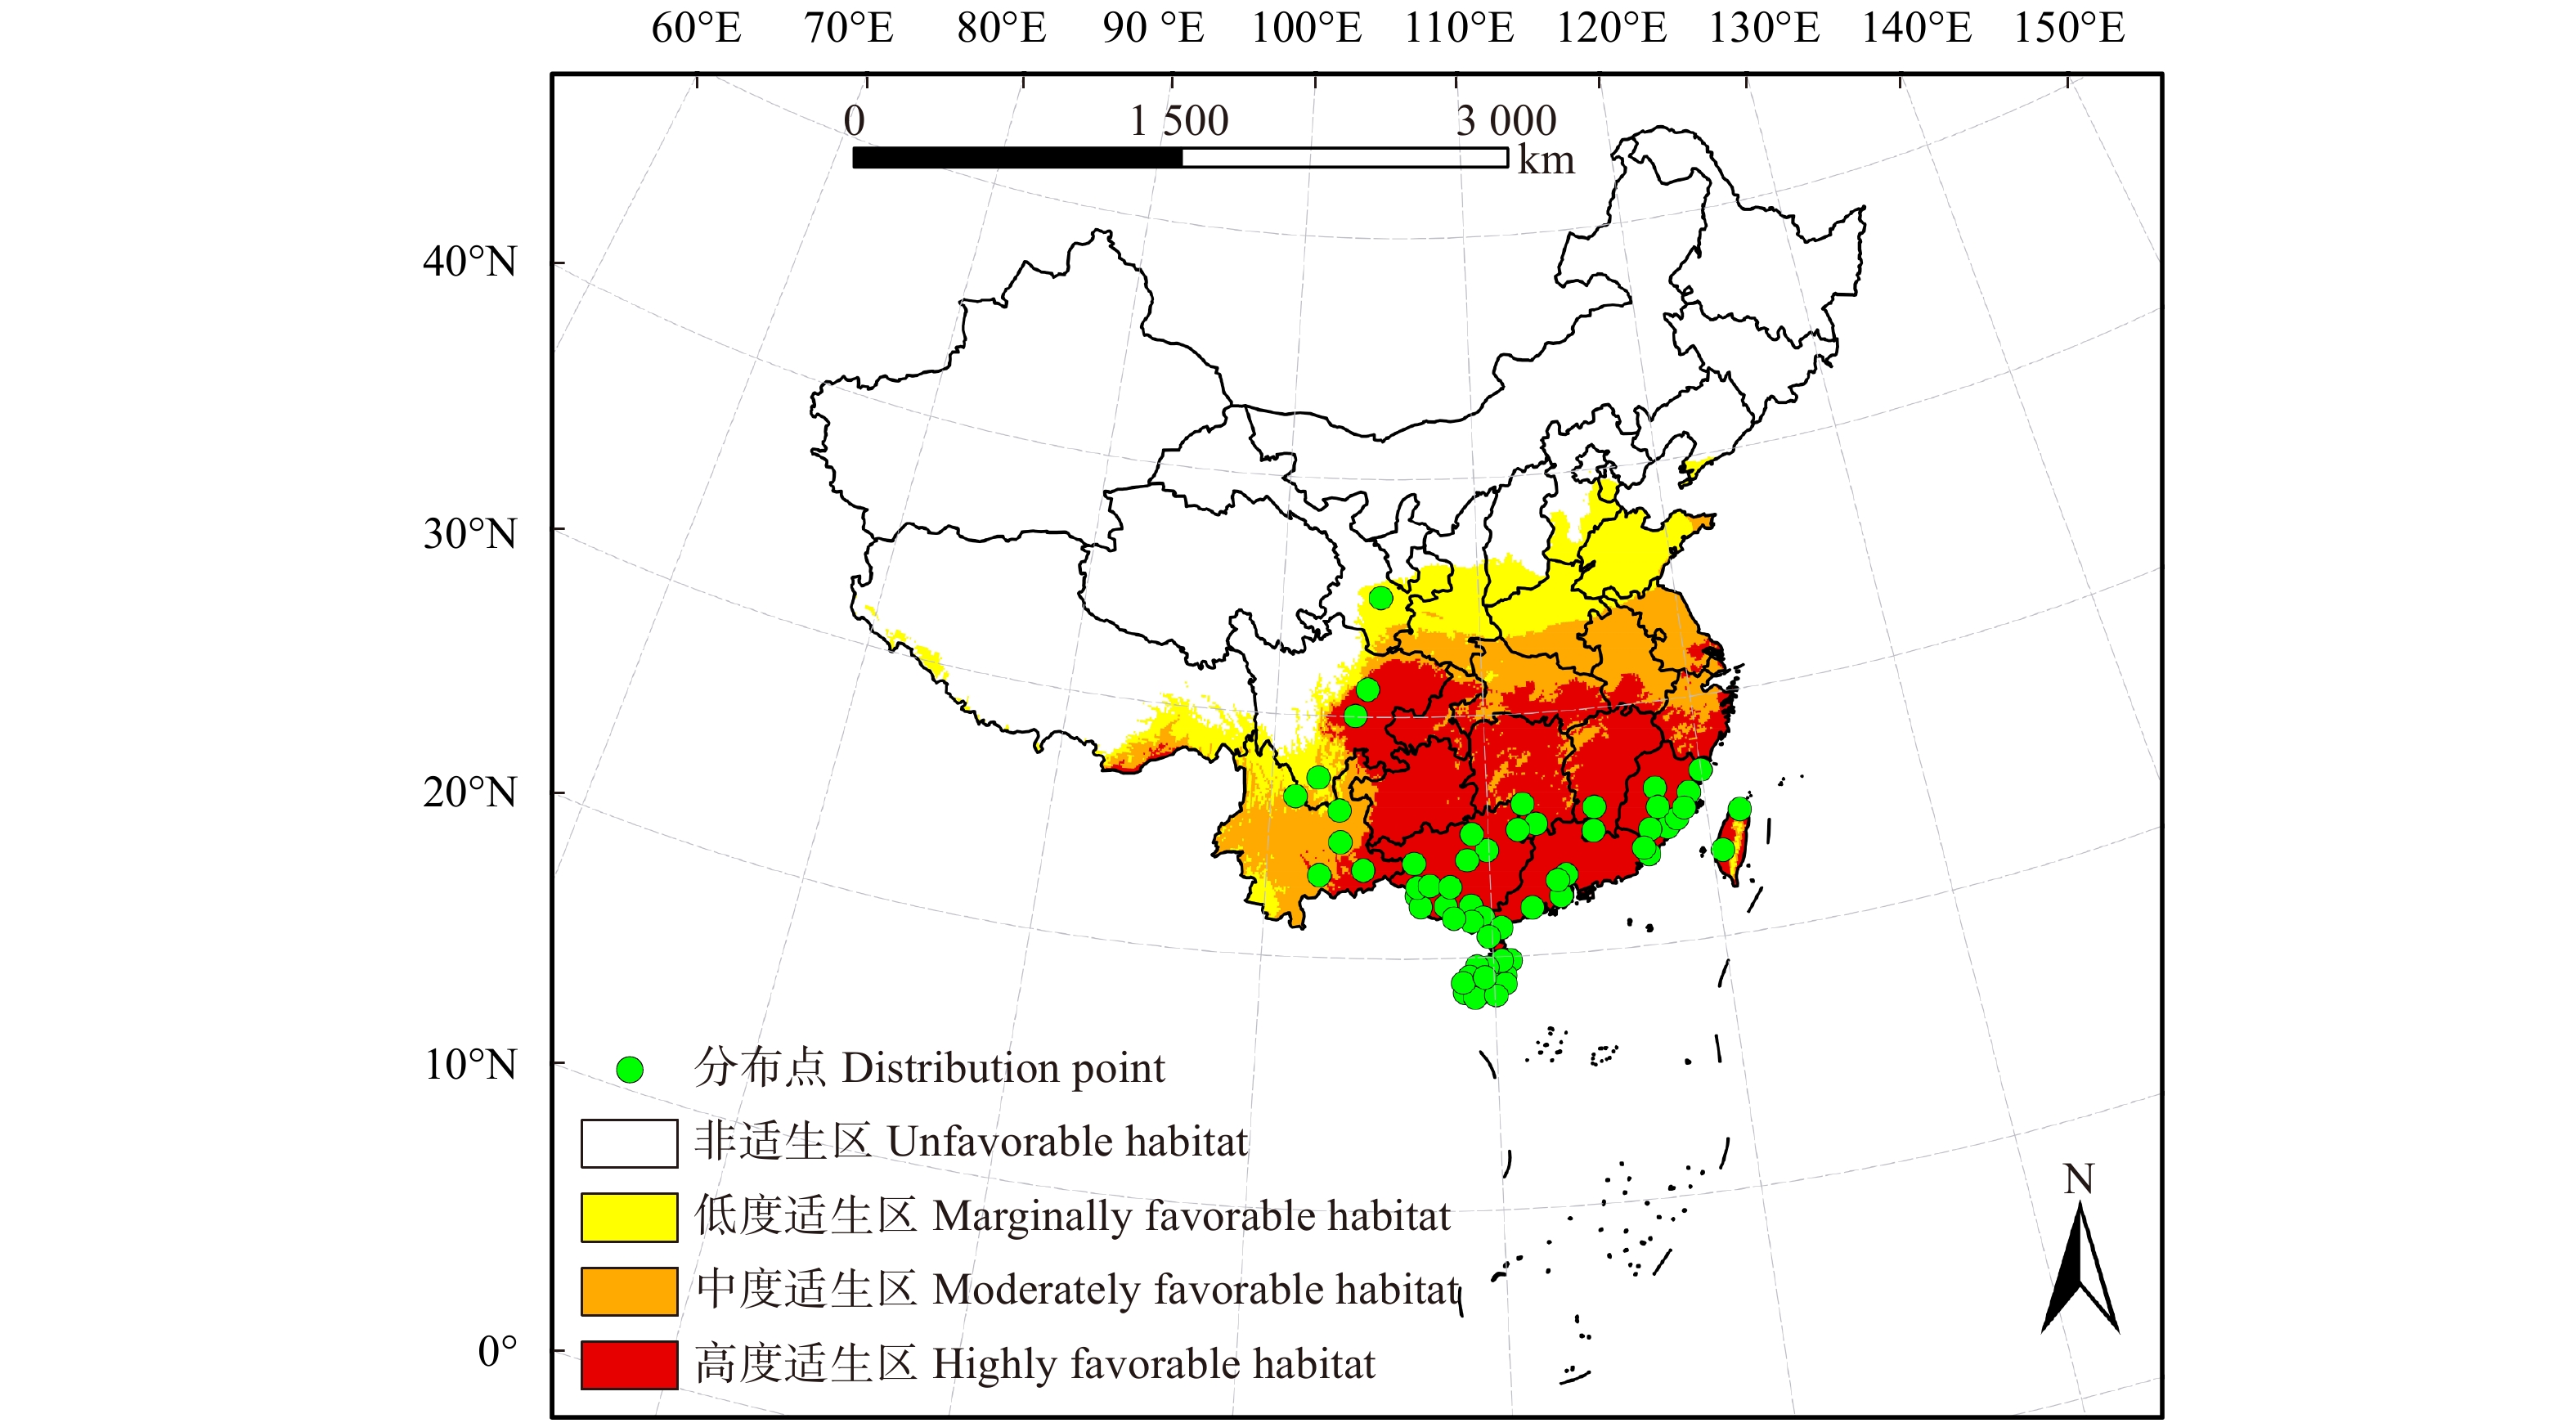
摘要:目的 桉树枝瘿姬小蜂是我国一种入侵性小蜂,自2007年传入我国广西省,在短短几年时间内危害了我国南部的桉树种植地,造成严重经济损失。本研究利用MaxEnt模型对桉树枝瘿姬小蜂在中国现在和未来的适生区进行预测,以了解桉树枝瘿姬小蜂在温度变化的影响下其适生地范围的变化。方法 采用MaxEnt预测模型—最大熵模型,通过收集桉树枝瘿姬小蜂在中国报道的分布地数据、调查最新发生地危害轻重程度对该蜂在中国的适生区现在以及未来RCP8.5气候情景下的适生区进行模拟并检测模拟结果的精准度。结果 模型模拟结果的测试遗漏率与理论遗漏率基本吻合。AUC 值为0.898,标准差为0.022,表明所使用的数据无空间自相关,模型筛选的参数结果可靠且准确度高。MaxEnt模型预测得到桉树枝瘿姬小蜂在中国的最佳适生区主要分布在长江以南的福建、广东、广西、海南等地,在RCP8.5气候情景下其未来中度适生区面积有小范围的下降,但整体适生区范围显著增加。结论 通过适生地范围预测结果的分析,本研究对桉树枝瘿姬小蜂的监测以及潜在危险入侵地区制定有效的防治手段具有重要的理论指导意义。Abstract:Objective Leptocybe invasa is an invasive wasp common to China, which was first introduced into the Guangxi Province of southern China in 2007. It had endangered the eucalyptus plantations in southern China within just a few years, causing serious economic and ecological losses. This study employed the MaxEnt latest prediction model, a novel maximum entropy model to firstly analyze this invasive wasp distribution in China under current and future climate conditions. The results will be helpful to understand the range dynamic change of L. invasa under the influence of temperature change.Method Data were collected on the current locations of this wasp, along with the damage incurred to eucalyptus. These data were used to create a forecast model for the present and future trends of the favorable habitat under the RCP 8.5 climate scenario. And model will test the accuracy of simulation results.Result The test omission rate of simulation results was basically consistent with that of theory. The value of AUC was 0.898 while a standard deviation of 0.022. The verification results showed that the test and training data were not independent and the constructed model was highly reliable and accurate. MaxEnt model predicted that the potential distribution for L. invasa was mainly concentrated at the south of the Yangtze River in the provinces of Fujian, Guangdong, Guangxi and Hainan. The RCP 8.5 scenario predicted a small-scale potential reduction of moderately favorable habitat, but the whole favorable habitat increased.Conclusion Based on the analysis of the predicted scope of this invasive wasp distribution, this study has established the grounds for the effective formulation of preventive and control measures for the monitoring of L. invasa and the prediction of its possible colonies, which is a significant theoretical reference on its own.
-
Keywords:
- Leptocybe invasa /
- MaxEnt /
- RCP8.5 /
- favorable habitat
-
土壤有机碳(soil organic carbon,SOC)是植物和微生物生长所必需的物质能量来源,是影响土壤肥力、生产力和养分有效性的关键因素,对土壤理化特性具有重要调节作用[1]。SOC储量分布特征是其长期累积的结果,与土壤剖面的发育密切相关。人工林生态系统具有较强的碳汇和增汇潜能[2],被认为是实现“双碳”目标最经济、最安全的有效途径之一[3]。人工林大面积营建改良了土壤质量,改变了土壤有机质的输入与分解方式,利于SOC贮存和积累[4],人工林土壤碳库库容较大,能维持较稳定的碳储量[5−6]。然而,人工林SOC的贮存受土壤理化性质、植被类型和地形等诸多因素的影响[7−8],关于不同人工林下SOC分布特征尚未达成共识。大量研究基于土壤表层或单一林分,吴慧等[9]研究得出热带山地雨林次生林在0 ~ 50 cm垂直方向上土壤有机碳质量分数随土壤深度增加而减小;王越等[10]通过文献整合分析得出油松(Pinus tabuliformis)林0 ~ 20 cm有机碳储量最高,20 ~ 60 cm稳定且保持较低水平;张智勇等[11]认为陕北黄土区沙棘林有机碳储量优于草地和油松林。据《全球森林评估》报道,我国人工林面积居世界前列[12],人工林生态系统对森林生态系统碳储量增加的贡献较大[13],因此阐明不同人工林SOC储量的分布特征在宏观方向上研究森林碳汇尤为重要。
黄土高原生境脆弱,水土流失严重。随着“退耕还林还草”生态工程的实施,黄土高原植被覆盖大幅增加[14],不同人工林土壤固碳问题逐渐成为研究者们关注的热点问题[15]。土地利用变化的改变增强了土壤碳汇功能[16]。Zhang等[17]研究得出退耕后土壤有机碳储量在0 ~ 20 cm以36.67 g/(m2· a)的速率发生巨大的变化,包玉斌[18]研究了2000—2010年陕北黄土高原退耕年间,其退耕地土壤碳固存总量增加。目前,关于黄土高原SOC储量的研究多集中在大尺度空间分布[19]、单一人工林[20]、模型拟合[21]和浅层土壤(0 ~ 100 cm)[11]。这些研究仅是土地利用前后或退耕后单一林地与草地或农田之间的对比研究,而对于退耕后不同人工林及深层土壤SOC储量的研究较少。相关研究表明,土壤是一个不均匀且不连续的时空变异体[22],其演化过程十分复杂。土壤碳库的分布特征,因缺乏连续、可靠、统一的土壤剖面资料,区域SOC储量实测及代表性数据贫乏[23],存在明显的不确定性[24]。因此,准确评估退耕后小尺度不同人工林SOC储量的分布特征,对森林土壤有机碳库的精确估算以及土壤碳汇研究具有重要意义。
鉴于此,本研究以黄土丘陵区典型同一退耕年限的人工油松林、山杏(Armeniaca sibirica)林、沙棘(Hippophae rhamnoides)林和天然草地0 ~ 200 cm土壤为研究对象,探究不同人工林SOC储量的垂直分布特征,以期为准确计算黄土高原有机碳储量提供数据支撑,为建立黄土高原土壤碳库,优化人工林土壤固碳格局提供理论依据。
1. 研究区概况与研究方法
1.1 研究区概况
研究区位于陕西省吴起县(107°38′57″ ~ 108°32′49″ E,36°33′33″ ~ 37°24′27″ N),海拔高度1 233 ~ 1 809 m,是典型的黄土高原丘陵沟壑区。吴起县地处中温带半湿润—半干旱区域,温带大陆性季风气候特征明显,年均温7.8 ℃,年平均降水量483.4 mm,时空分布不均,主要集中在7—9月,年无霜期146 d。主要土壤类型为黄绵土,结构疏松、持水力低、易侵蚀。自1999年坡耕地转变为林地以来,形成了刺槐(Robinia pseudoacacia)、油松、侧柏(Platycladus orientalis)、山杏、沙棘、柠条(Caragana sinica)、白莲蒿(Artemisia stechmanniana)、达乌里胡枝子(Lespedeza daurica)等以及自然恢复草地为主的乔灌草植物群落,全县林草覆盖率显著增加,生态环境得以改善。
1.2 土壤样品采集与处理
于2020年9月进行样品采集,在研究区选择相同退耕年限的典型人工油松林、山杏林、沙棘林和天然草地,分别布设25 m × 25 m大样方,利用GPS采集地理信息数据,样地基本信息如表1。使用内径6 cm的土钻,在样方内,采用五点采样法,以0 ~ 20 cm、20 ~ 40 cm、40 ~ 60 cm、60 ~ 100 cm、100 ~ 150 cm、150 ~ 200 cm分层采集土壤样品,带回实验室进行分析。待土壤样品风干后,研磨、过筛,进行理化性质测定。土壤密度采用环刀法测定,土壤有机碳采用重铬酸钾稀释热法测定,全氮采用半微量凯式定氮法测定,全磷采用硫酸−高氯酸消煮−钼锑抗比色法定,全碳通过元素分析仪测定,无机碳根据全碳、有机碳之间关系获得,碱解氮采用碱解扩散法测定,速效磷采用钼锑抗比色法测定,土壤粒度组成使用激光粒度分析仪(Mastersize-zer 3000)测定[25]。
表 1 样地基本信息Table 1. Basic information of the sample plots人工林
Plantation海拔
Elevation/m坡度
Gradient/(°)坡向
Aspect平均高度
Average
height/m平均胸径
Average DBH/cm郁闭度或盖度
Crown density or
coverage林下优势种
Dominant understory
species油松 Pinus tabuliformis 1 362.6 20 SFS 8.5 11.3 0.65 MO, LB, ASB 山杏 Armeniaca sibirica 1 459.7 21 SFS 7.3 10.4 0.62 ASB, PS, LB, PC 沙棘 Hippophae rhamnoides 1 389.9 6 NFS 2.9 3.5 0.71 LS, ASW, LB 草地 Grassland 1 376.7 33 SFS 0.86 LB, LS, SC 注:SFS. 阳坡;NFS. 阴坡;MO. 草木犀;LB. 胡枝子;ASB. 白莲蒿;PS. 败酱;PC. 委陵菜;LS. 赖草;ASW. 猪毛蒿;SC. 针茅。Notes: SFS, south-facing slope; NFS, north-facing slope; MO, Melilotus officinalis; LB, Lespedeza bicolor; ASB, Artemisia stechmanniana; PS, Patrinia scabiosaefolia; PC, Potentilla chinensis; LS, Leymus secalinus; ASW, Artemisia scoparia; SC, Stipa capillata. 土壤有机碳储量计算公式为
SOC储量=wSOCi×ρBDi×Di×0.01 式中:SOC储量表示土壤有机碳储量(g/m2),wSOCi表示第i层的土壤有机碳含量(g/kg),ρBDi表示第i层的土壤密度(g/cm3),Di表示第i层的土层厚度。
1.3 数据处理
应用SPSS26.0对数据进行统计分析,采用单因素方差分析(ANOVA)对比不同人工林、不同土层深度有机碳储量之间的差异;应用Origin2018对土壤有机碳储量与土壤理化性质、不同人工林、地形等影响因素之间的关系强弱和作用机理进行PCA分析并绘图;应用R4.2.1对土壤有机碳储量和各环境变量的贡献关系进行冗余分析。
2. 结果与分析
2.1 有机碳储量分布特征
研究区0 ~ 200 cm土层平均SOC储量由大到小为山杏(16.190 g/m2) > 草地(15.403 g/m2) > 沙棘(11.449 g/m2) > 油松(10.188 g/m2)(表2)。不同人工林SOC储量变异系数在10% ~ 30%,为中等程度变异,表现为沙棘(0.219) > 山杏(0.136) > 油松(0.124) > 草地(0.115)。变异系数表征了SOC储量的空间异质性,沙棘的SOC储量空间异质性最大,草地的SOC储量空间异质性最低。
表 2 不同人工林土壤有机碳储量描述统计Table 2. Description statistical characteristics of soil organic carbon stocks content in different plantations人工林
Plantation土层 Soil
layer/cm平均值
Mean value/(g·m−2)最大值
Max. value/(g·m−2)最小值
Min. value/(g·m−2)标准差
Standard deviation变异系数
Variation coefficient占比
Proportion油松
Pinus tabuliformis0 ~ 20 11.658 12.197 10.627 0.893 0.077 0.191 20 ~ 40 7.009 9.253 4.457 2.412 0.344 0.115 40 ~ 60 7.691 8.506 7.267 0.706 0.092 0.126 60 ~ 100 10.246 12.052 8.016 2.051 0.200 0.167 100 ~ 150 13.491 13.844 13.040 0.411 0.030 0.221 150 ~ 200 11.035 11.050 11.010 0.022 0.002 0.180 0 ~ 200 10.188 13.490 7.008 1.082 0.124 山杏
Armeniaca sibirica0 ~ 20 19.049 20.198 16.988 1.789 0.094 0.196 20 ~ 40 13.201 17.450 10.940 3.683 0.279 0.136 40 ~ 60 11.359 12.901 10.199 1.390 0.122 0.117 60 ~ 100 19.106 23.617 15.815 4.041 0.211 0.197 100 ~ 150 20.097 22.132 19.009 1.764 0.088 0.207 150 ~ 200 14.332 14.670 14.033 0.320 0.022 0.147 0 ~ 200 16.190 20.097 11.359 2.184 0.136 沙棘
Hippophae rhamnoides0 ~ 20 19.692 24.417 16.385 4.199 0.214 0.287 20 ~ 40 9.659 13.084 7.616 2.984 0.309 0.141 40 ~ 60 5.912 8.583 4.269 2.333 0.395 0.086 60 ~ 100 8.850 10.196 7.530 1.333 0.151 0.128 100 ~ 150 13.247 15.749 11.861 2.171 0.164 0.193 150 ~ 200 11.333 12.417 10.544 0.971 0.086 0.165 0 ~ 200 11.449 19.691 5.912 2.331 0.219 草地 Grassland 0 ~ 20 19.906 22.351 16.274 3.208 0.161 0.215 20 ~ 40 10.066 11.177 8.118 1.692 0.168 0.109 40 ~ 60 9.256 10.564 8.160 1.216 0.131 0.100 60 ~ 100 14.409 15.494 12.767 1.446 0.100 0.156 100 ~ 150 20.021 20.836 18.609 1.228 0.061 0.217 150 ~ 200 18.760 20.178 17.629 1.299 0.069 0.203 0 ~ 200 15.403 20.021 9.255 1.681 0.115 在不同人工林中(图1),在0~200 cm剖面上SOC储量呈现出山杏(97.145 g/m2) > 草地(92.418 g/m2) > 沙棘(68.695 g/m2) > 油松(61.130 g/m2)的分布格局,山杏的SOC储量与油松、沙棘差异显著(P < 0.05)。人工油松林,山杏林,沙棘林与天然草地0 ~ 60 cm SOC储量占整个剖面的43.11%、44.89%、51.33%、42.45%,表层碳储量高。垂直分布上,油松、山杏、沙棘的SOC储量自表层向下随深度增加变异系数先增大后减小,在20 ~ 40 cm土层变异系数达到最大,草地的SOC储量自表层向下随深度增加变异系数减小。在不同深度土层中,油松的SOC储量与山杏、沙棘、草地在0 ~ 20 cm、20 ~ 40 cm、150 ~ 200 cm土层差异显著(P < 0.05),沙棘的SOC储量与山杏、油松、草地在40 ~ 60 cm、60 ~ 100 cm土层差异显著(P < 0.05),油松、沙棘的SOC储量与山杏、草地在100 ~ 150 cm土层差异显著(P < 0.05)。
![]() 图 1 不同人工林土壤有机碳储量的垂直分布Figure 1. Vertical distribution of soil organic carbon stocks in different plantations
图 1 不同人工林土壤有机碳储量的垂直分布Figure 1. Vertical distribution of soil organic carbon stocks in different plantations2.2 环境因素对典型人工林土壤有机碳储量的影响
典型人工林SOC储量空间变异的主成分分析如下(图2),第一轴和第二轴解释值分别为39.70%和22.70%。第一主成分与部分环境指标的相关系数在0.37以上,其中,PC1与粉粒、黏粒、坡度正相关,与砂粒负相关,第一主成分主要包含了土壤物理性质信息;第二主成分与部分环境指标的相关系数0.5以上,其中PC2与全碳、碱解氮、全氮正相关,主要包含了土壤化学信息,第一和第二主成分反映的信息量占总信息量的62.40%。
![]() 图 2 土壤有机碳储量与土壤环境因子的主成分分析TP. 全磷;TN. 全氮;TC. 全碳;SIC. 土壤无机碳;AP. 速效磷;AN. 碱解氮;Clay. 黏粒;Silt. 粉粒;Sand. 砂粒;ELE. 海拔;SA. 坡向;SG. 坡度。下同。PC1. 第一主成分;PC2. 第二主成分。TP, total phosphorus; TN, total nitrogen; TC, total carbon; SIC, soil inorganic carbon; AP, available phosphorus; AN, alkali-hydrolyzable nitrogen; Clay, clay; Silt, silt; Sand, sand; ELE, elevation; SA, slope aspect; SG, slope gradient. The same below. PC1, the first principal component; PC2, the second principal component.Figure 2. Principal component analysis of soil organic carbon stocks and soil environmental factors
图 2 土壤有机碳储量与土壤环境因子的主成分分析TP. 全磷;TN. 全氮;TC. 全碳;SIC. 土壤无机碳;AP. 速效磷;AN. 碱解氮;Clay. 黏粒;Silt. 粉粒;Sand. 砂粒;ELE. 海拔;SA. 坡向;SG. 坡度。下同。PC1. 第一主成分;PC2. 第二主成分。TP, total phosphorus; TN, total nitrogen; TC, total carbon; SIC, soil inorganic carbon; AP, available phosphorus; AN, alkali-hydrolyzable nitrogen; Clay, clay; Silt, silt; Sand, sand; ELE, elevation; SA, slope aspect; SG, slope gradient. The same below. PC1, the first principal component; PC2, the second principal component.Figure 2. Principal component analysis of soil organic carbon stocks and soil environmental factors2.3 环境因素对土壤剖面有机碳储量垂直分布的影响
不同环境因素对SOC储量垂直变化的贡献度不同(图3)。土壤化学性质、土壤物理性质、地形和植被群落分别对0 ~ 200 cm土壤剖面中SOC储量分布差异的影响约占51.84%、13.58%、30.71%和3.87%。在土壤化学性质中,0 ~ 200 cm SOC储量的变化受全磷影响最大(11.99%),受全氮影响最小(5.64%);在土壤物理性质中,0 ~ 200 cm SOC储量的变化受砂粒影响最大(5.65%),受黏粒影响最小(2.89%);在地形因素中,0 ~ 200 cm SOC储量的变化受海拔影响最大(19.66%),受坡向影响最小(4.97%);植物群落对0 ~ 200 cm SOC储量变化影响较小。
![]() 图 3 土壤化学性质、土壤物理性质、地形和植物群落对土壤有机碳储量变化的相对贡献SCP. 土壤化学性质;SPP. 土壤物理性质;Topo. 地形;PT. 植物群落。SCP, soil chemical property, SPP, soil physical property, Topo, topography, PT, phytocoenosium.Figure 3. Relative contribution of soil chemistry, soil physical properties, topography and phytocoenosium to changes in soil organic carbon stocks
图 3 土壤化学性质、土壤物理性质、地形和植物群落对土壤有机碳储量变化的相对贡献SCP. 土壤化学性质;SPP. 土壤物理性质;Topo. 地形;PT. 植物群落。SCP, soil chemical property, SPP, soil physical property, Topo, topography, PT, phytocoenosium.Figure 3. Relative contribution of soil chemistry, soil physical properties, topography and phytocoenosium to changes in soil organic carbon stocks3. 讨 论
3.1 不同人工林土壤有机碳储量分布差异的对比
本研究发现SOC储量富集在土壤表层,呈现出明显的“表聚性”,这与王文静等[26]的研究结论一致。不同植被群落在土壤浅层聚集了大量的根系和凋落物,凋落物分解产生有机质归还于土壤,通过养分的循环进入土壤[27],因此,大量的有机碳在土壤表层形成和累积。
本研究中,山杏林表现出最优的土壤固碳效益,草地次之,油松林最差,这与李龙波等[28]对乔灌草固碳效益效果的研究结果不一致。植被类型和植被生长间的差异会导致土壤温度、湿度、凋落物数量和根系分泌物等的显著不同[29],进而影响土壤的固碳效益。本研究中草地植被覆盖度高于油松和沙棘林下植被覆盖度(表1),单位面积的植被残体、根系分泌物、枯枝落叶量多,有机质输入量更高,同时,适宜的土壤温度和湿度促进了微生物的生长代谢,提高了植被残体的分解速率,使得草地土壤固碳效率提高。不同人工林中,植物生产力和质量的巨大差异导致SOC储量空间分布的显著差异[30]。且有研究表明,在年平均降水量 < 510 mm区域,草地比灌木和林地积累更多的有机碳[31],本研究区位于黄土丘陵区,年降水量483.4 mm,草地SOC储量高于沙棘和油松。落叶乔木在增加枯落物归还量方面明显优于常绿乔木,这在诸多研究中均有报道[32]。本研究中山杏SOC储量远高于油松,是因为落叶阔叶乔木比常绿针叶乔木产生更多的枯落物凋落量[32],山杏林表层枯落物多,根密度大,不断更替的根系结合不断积累的地表枯落物,不仅改变了土壤腐殖质,也改善了土壤质地,增加了土壤有机碳的积累,因此山杏林具有较高的土壤碳储量,碳汇功能表现较强。
3.2 土壤有机碳储量空间差异的主要影响因素和作用机制
本研究中,不同人工林土壤有机碳储量与黏粒、粉粒和坡度正相关,砂粒与土壤有机碳储量负相关,这阐释了土壤粒径及坡度与土壤有机碳储量之间的关系,这与李顺姬等[33]的研究结果一致。土壤结构是影响有机质分解的主导因素[34],黏粒对土壤有机碳有很好的保护作用,砂质土壤有机碳的矿化更为迅速[33]。当土壤黏粒含量较高时,具有较大的表面积,易形成较多的毛细管,有较强的毛管作用,完整的土壤孔隙为有机碳自表层向下层传输提供了通道,促进深层土壤有机碳固存[35],具有较强的固碳能力。而当土壤砂粒含量较高时,有效土层薄,土壤生物作用弱,土壤有机碳矿化作用较弱,微生物群落质量较低,土壤固碳能力较低。黄土丘陵区“退耕还林还草”工程对土壤机械组成产生一定的影响,使土壤物理性质发生变化。土壤机械组成影响土壤孔隙度、密度,改变土壤的透气性和持水能力,改变植物根系的生长发育及微生物活动条件,进而影响有机碳的储存[36]。坡度显著影响土壤有机碳固存,坡度通过影响水分运移、植被分布及土壤机械组成等间接影响土壤有机碳储量。
本研究中,土壤化学性质对SOC储量的影响较大,全氮、碱解氮、全磷对土壤有机碳储量正向效应显著,阐释了土壤有机碳与土壤养分之间的关系。土壤全氮和碱解氮对土壤有机碳的转化和固存有重要作用。全氮对有机碳储量起正向效应,较高的全氮可以降低凋落物中的碳氮比,避免微生物与植物的“争氮”现象,利于凋落物矿化分解[37],促进土壤有机碳储存。这与王越等[10]研究得出全氮对土壤有机碳呈显著正效应的结果一致。有研究表明,地形显著影响土壤发育、迁移等活动,从而影响土壤碳的输入输出过程[38]。黄土丘陵区水土流失导致了流域内水土资源的重新分配,冗余分析表明,海拔对土壤剖面有机碳储量贮存起主要贡献(图3),通过调控水热条件,进而影响土壤有机碳的积累[39]。
4. 结 论
(1)研究区不同人工林土壤碳储量不同,表现为山杏 > 草地 > 沙棘 > 油松。因此,在黄土高原地区进行人工林营建时,可优先配置山杏林与适宜草种,以增加黄土高原土壤固碳。
(2)研究区不同人工林土壤有机碳储量与土壤机械组成和土壤养分显著相关,黏粒、粉粒、砂粒、全氮、碱解氮是影响黄土丘陵区不同人工林土壤有机碳储量空间分布的主导因子。
(3)研究区人工林土壤有机碳储量在土壤剖面中差异较大,土壤有机碳储量的垂直分布主要受地形的影响。其中,海拔通过影响有机碳的转化与固存对土壤有机碳储量的贮存起主要贡献作用。
-
![]()
图 1 气候因子相关性分析和聚类分析
bio1. 年平均温度;bio2. 温差月均值;bio3. 等温性;bio4. 温度季节变化;bio5. 最热月最高温;bio6. 最冷月最低温;bio7. 年温差;bio8. 最湿季平均温度;bio9. 最干季平均温度;bio10. 最热季平均温度;bio11. 最冷季平均温度;bio12. 年降水量;bio13. 最湿月降水量;bio14. 最干月降水量;bio15. 降水量季节性变动系数;bio16. 最湿季降水量;bio17. 最干季降水量;bio18. 最热季降水量;bio19. 最冷季降水量。下同。bio1, annual mean temperature; bio2, mean diurnal range; bio3, isothermality; bio4, temperature seasonality; bio5, maximum temperature of the warmest month; bio6, minimum temperature of coldest month; bio7, temperature annual range; bio8, mean temperature of the wettest quarter; bio9, mean temperature of the driest quarter; bio10, mean temperature of the warmest quarter; bio11, mean temperature of the coldest quarter; bio12, annual precipitation; bio13, precipitation of wettest month; bio14, precipitation of the driest month; bio15, precipitation seasonality (coefficient of variation); bio16, precipitation of the wettest quarter; bio17, precipitation of the driest quarter; bio18, precipitation of the warmest quarter; bio19, precipitation of the coldest quarter. The same below.
Figure 1. Correlation analysis and cluster analysis of climatic variables
![]()
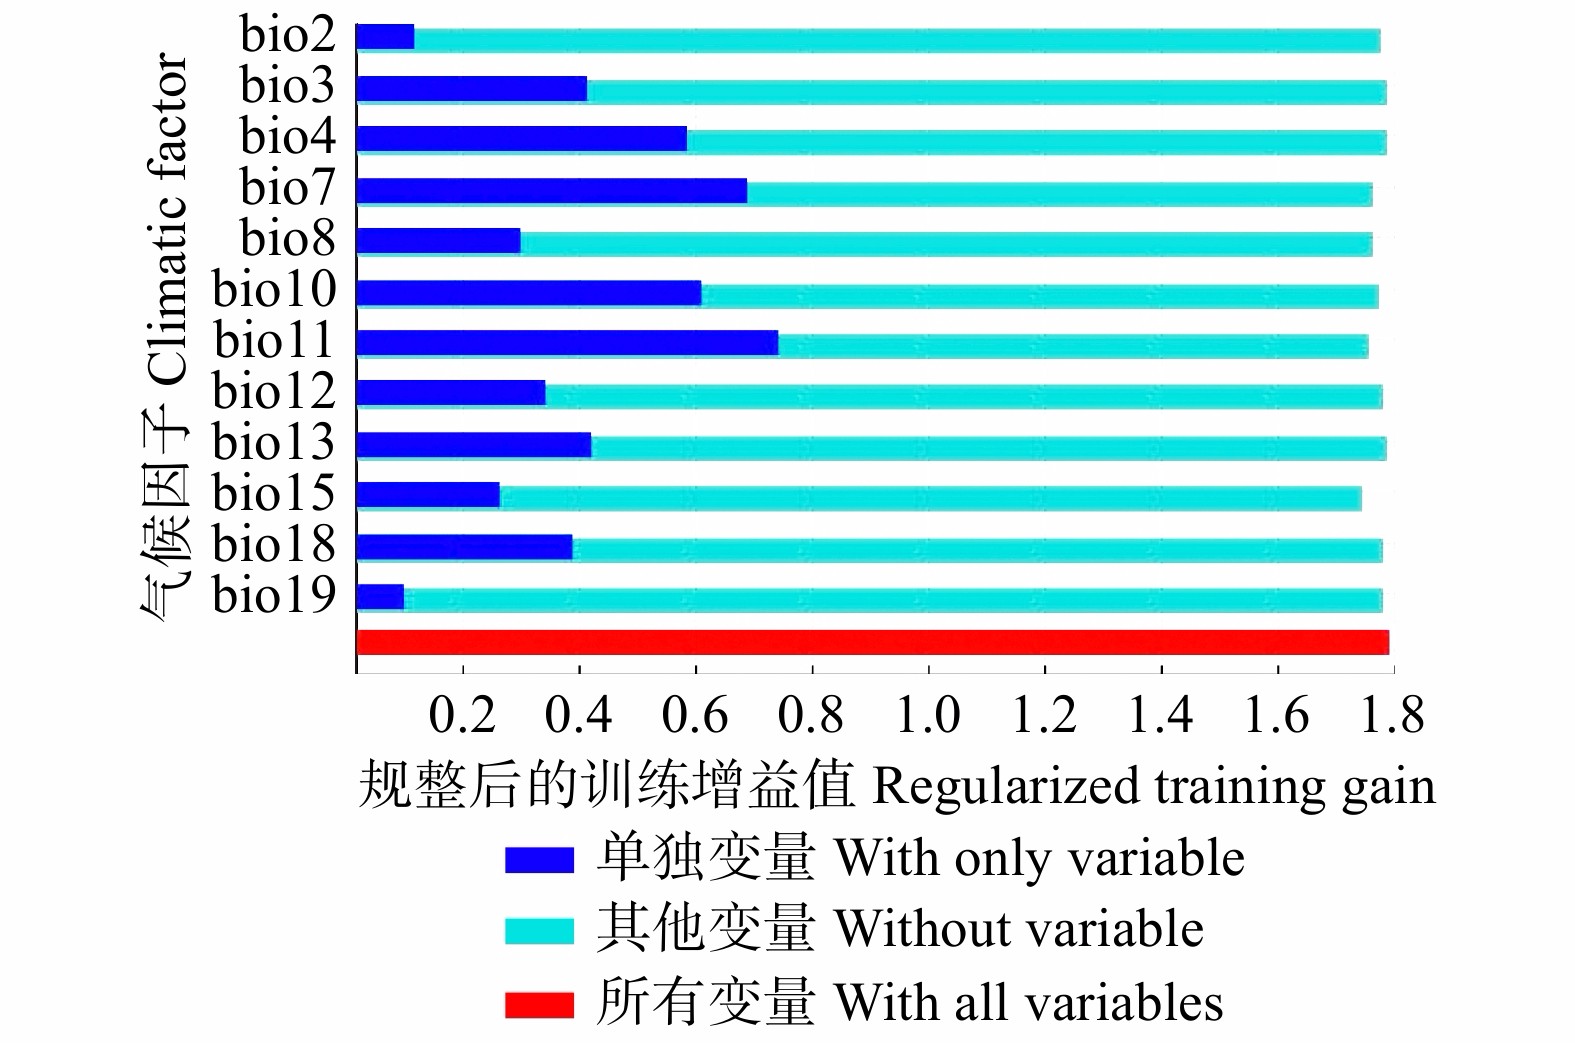
图 3 筛选后的气候因子对MaxEnt模型的贡献值
Figure 3. Contribution values of selected climate factors to MaxEnt model
![]()
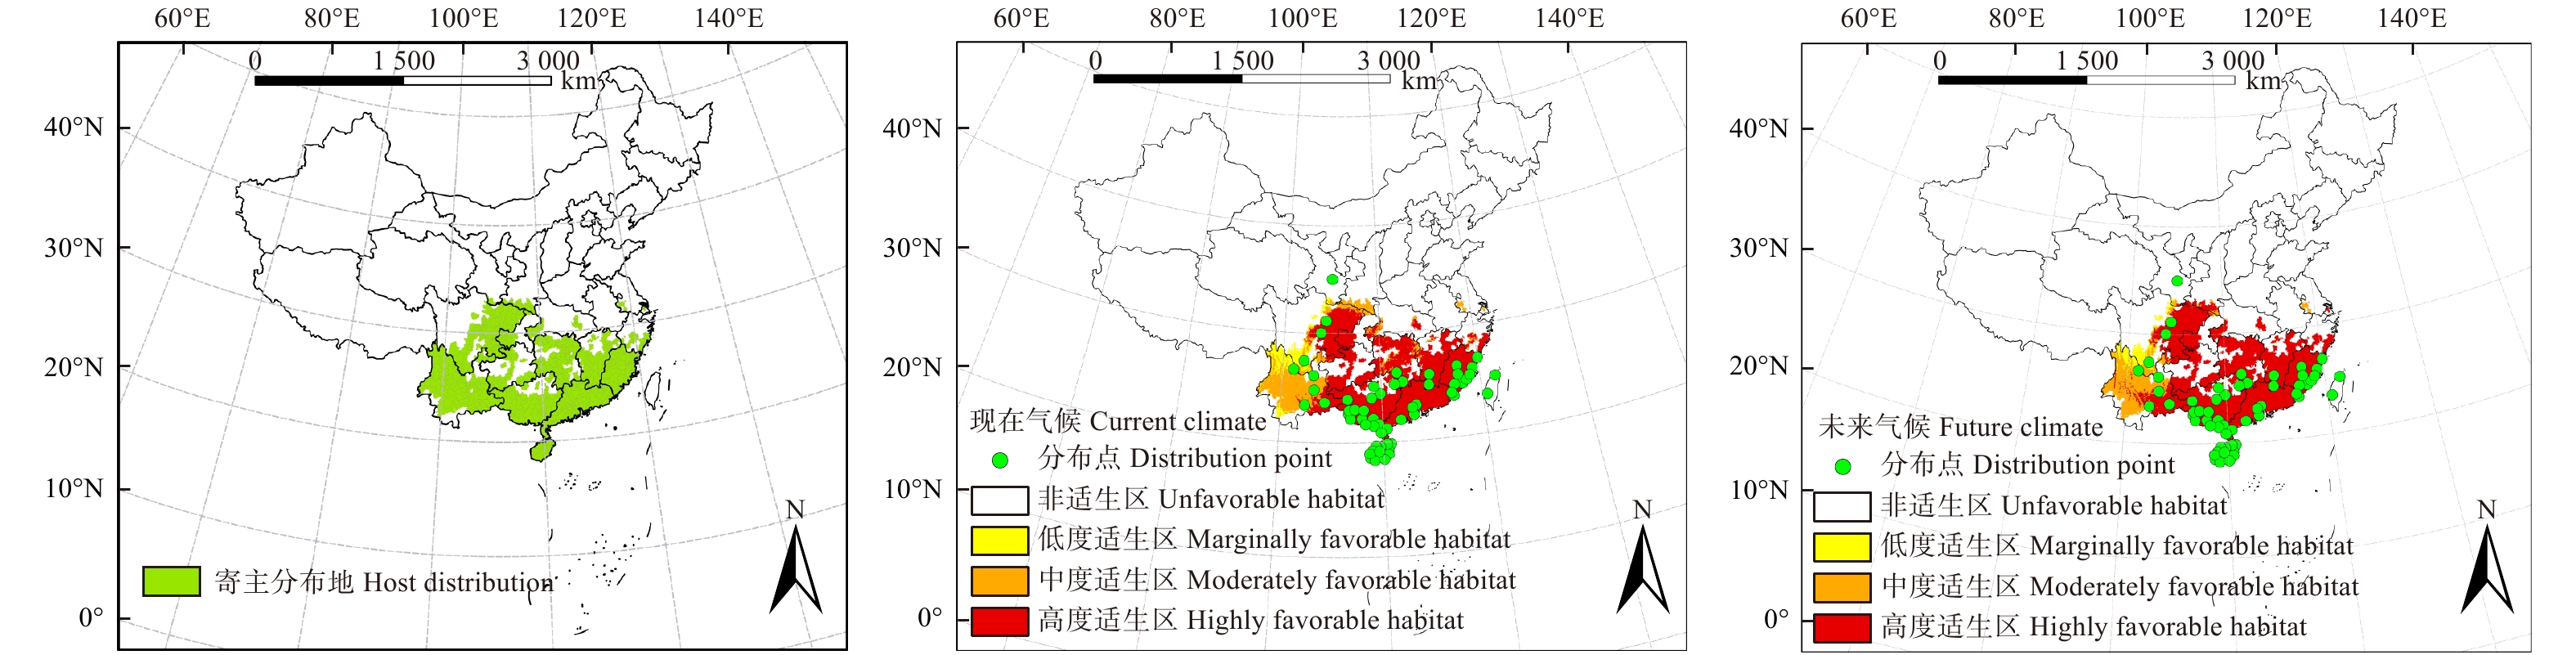
图 5 桉树枝瘿姬小蜂在现在气候条件下的全国预测分布图
Figure 5. Predicted potential distribution of Leptocybe invasa in China under current climate conditions
![]()
图 6 桉树枝瘿姬小蜂在未来气候条件下的全国预测分布图
Figure 6. Predicted potential distribution of L. invasa in China under future climate conditions
![]()
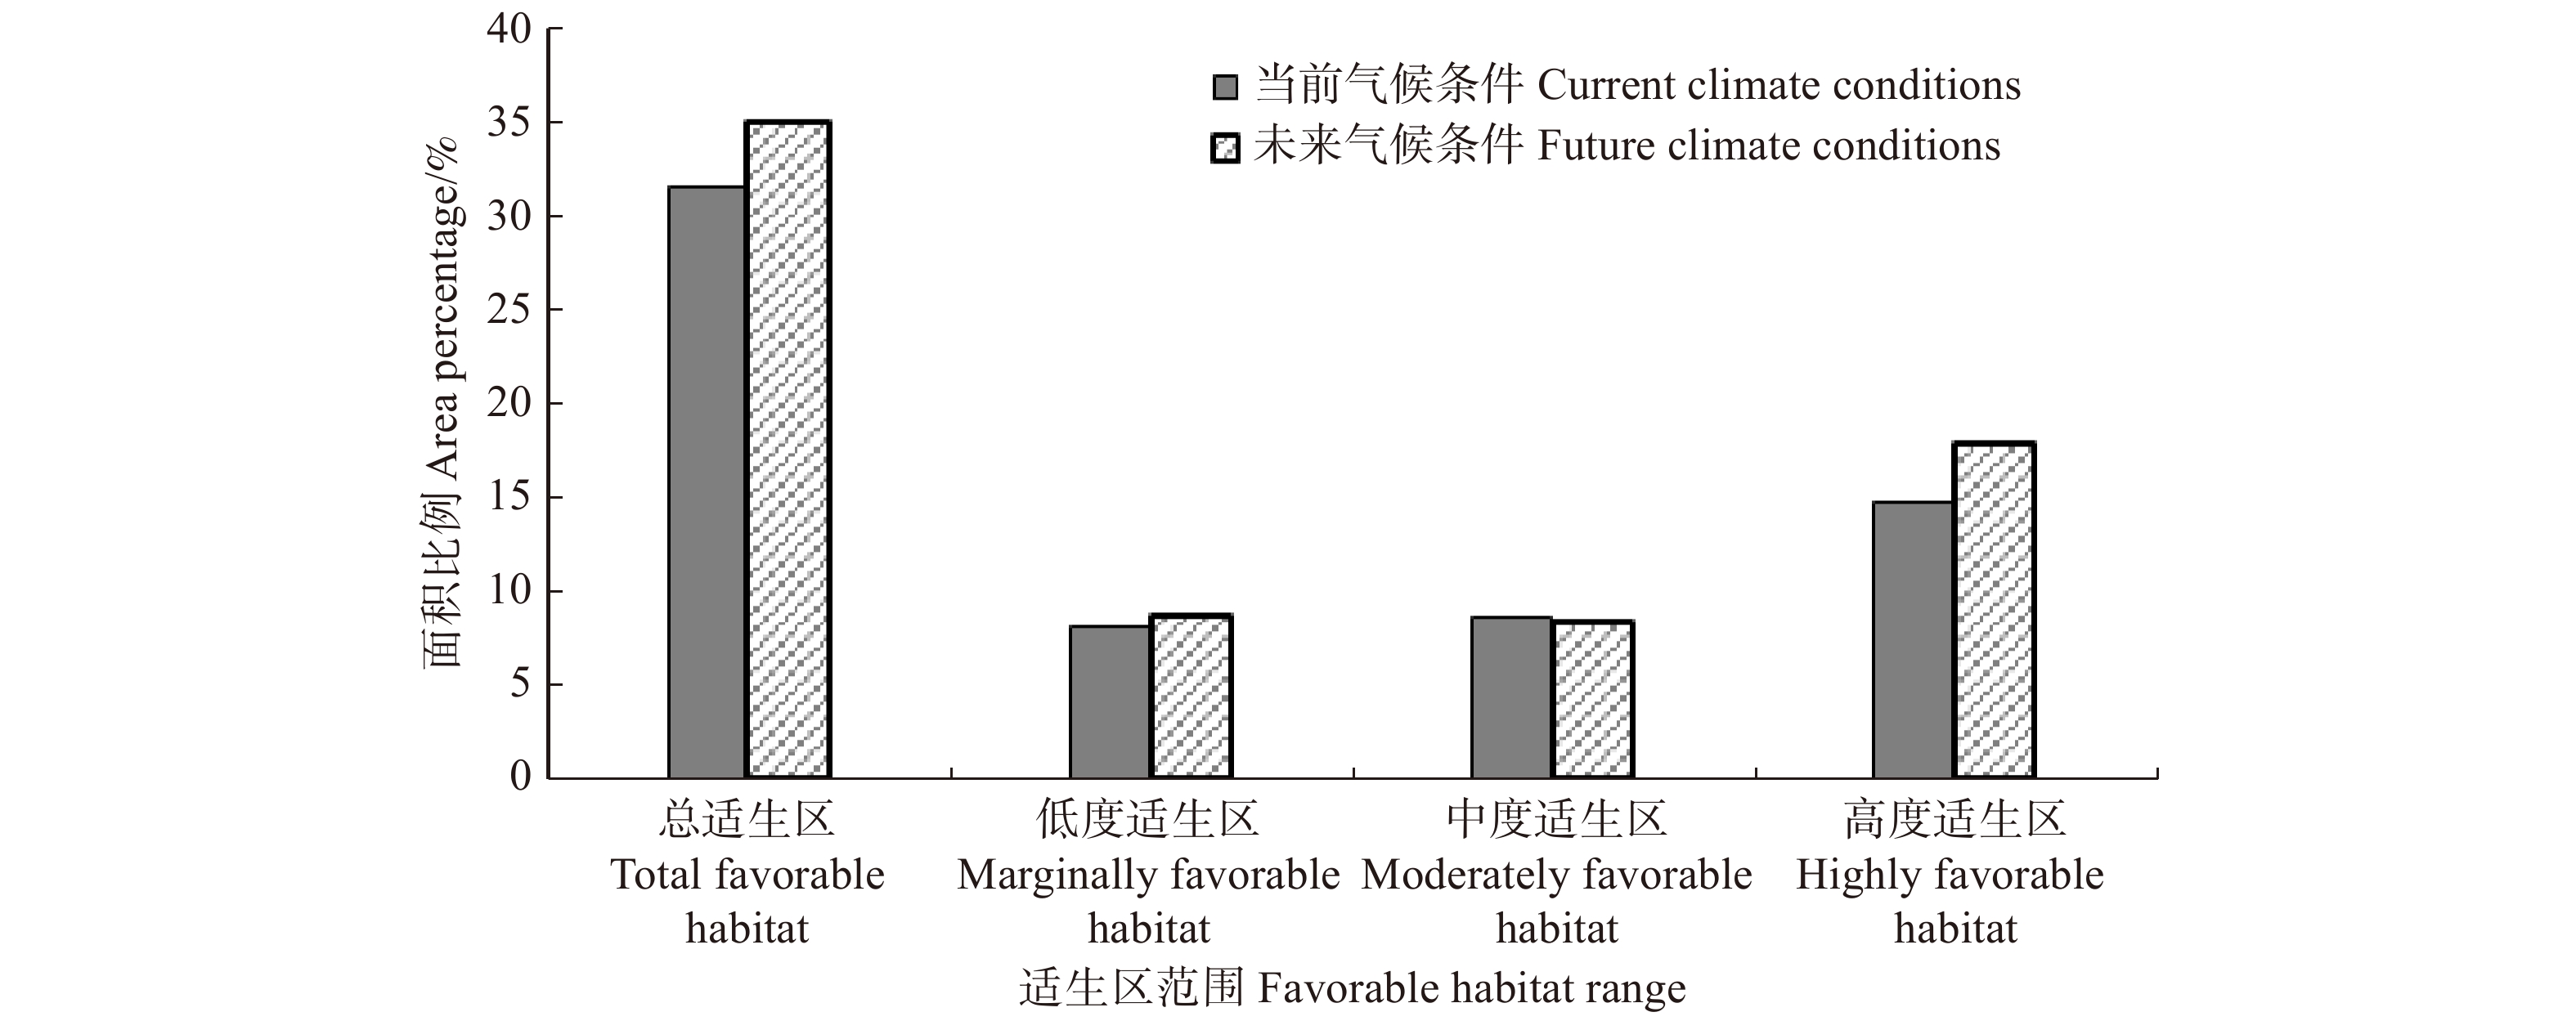
图 7 桉树枝瘿姬小蜂在当前和未来气候条件下不同适生范围占全国面积的比例
Figure 7. Area proportion of different ranges for L. invasa under current and future climate conditions
![]()
图 8 寄主分布区与预测分布区叠加后的分布图
Figure 8. Superposition diagram of host distribution area and predicted distribution area
表 1 MaxEnt 参数设置值
Table 1 Parameter setting values of MaxEnt
选项 Option 参数 Parameter 默认值 Default value 设置值 Setting value 随机选取测试集比例 Randomly selected test set percentage 0 25 正则化乘数 Regularization multiplier 1 2 重复迭代次数 Number of iterations repeated 1 10 最大重复次数 Maximum number of repetitions 500 5 000 应用阈值规则 Applying threshold rules 无 None 10%训练值验证 10% training value verification  下载: 导出CSV
表 2 筛选的12个气候因子及其贡献率
Table 2 Screening 12 climatic variables and their contribution rates
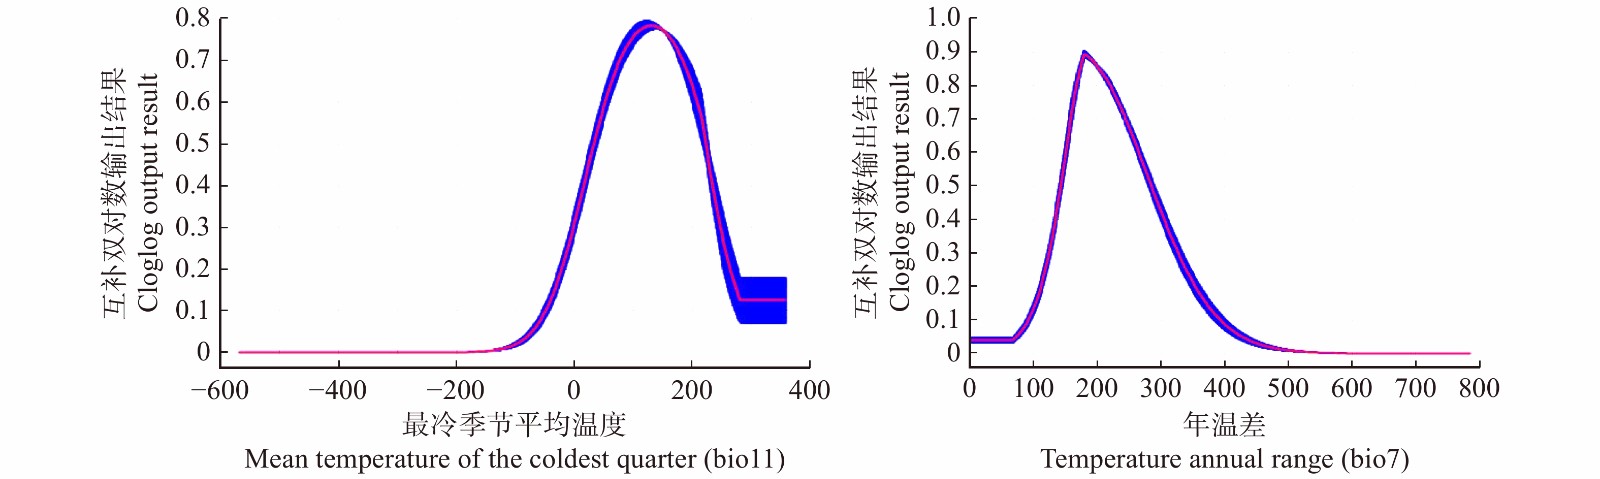
序号 No. 数据简称 Data abbreviation 气候因子 Climatic factor 贡献率 Contribution rate/% 1 bio11 最冷季平均温度 Mean temperature of the coldest quarter 38.9 2 bio4 温度季节变化 Temperature seasonality 5.4 3 bio10 最热季平均温度 Mean temperature of the warmest quarter 3.9 4 bio12 年降水量 Annual precipitation 0.8 5 bio3 等温性 Isothermality 2.5 6 bio2 温差月均值 Monthly mean temperature difference 13.4 7 bio15 降水量季节性变动系数 Precipitation seasonality (coefficient of variation) 9.8 8 bio8 最湿季平均温度 Mean temperature of the wettest quarter 1.0 9 bio7 年温差 Temperature annual range 4.1 10 bio19 最冷季降水量 Precipitation of the coldest quarter 4.8 11 bio13 最湿月降水量 Precipitation of the wettest month 11.7 12 bio18 最热季降水量 Precipitation of the warmest quarter 3.7
下载: 导出CSV
-
[1] Mendel Z, Protasov A, Fisher N, et al. Taxonomy and biology of Leptocybe invasa gen. & sp. n. (Hymenoptera: Eulophidae), an invasive gall inducer on Eucalyptus[J]. Australian Journal of Entomology, 2004, 43: 51−63.
[2] Udagedara S K, Karumaratne I P. Biology, damage and parasitoids of the Eucalyptus gall wasp, Leptocybe invasa (Hymenoptera: Eulophidae), infesting Eucalyptus camaldulensis (Myrtaceae) in Maragamuwa plantation, Sri Lanka[J]. International Journal of Tropical Insect Science, 2014, 34(3): 179−189.
[3] Vanegas-Rico J M, Lomeli-Flores J R, Guez-Leyva E R, et al. First record of eucalyptus gall wasp Leptocybe invasa (Hymenoptera: Eulophidae) in Mexico[J]. Revista Mexicana de Biodiversidad, 2015, 86: 1095−1098.
[4] 谢耀坚. 我国桉树种质资源现状及育种目标探讨[J]. 桉树科技, 2012, 29(2):33−39. doi: 10.3969/j.issn.1674-3172.2012.02.007 Xie Y J. Study on Eucalyptus selection objectives and current situation of genetic resources in China[J]. Eucalypt Science & Technology, 2012, 29(2): 33−39. doi: 10.3969/j.issn.1674-3172.2012.02.007
[5] 郑嘉琪, 陈少雄. 我国桉树用途概述[J]. 桉树科技, 2017, 34(3):42−46. doi: 10.3969/j.issn.1674-3172.2017.03.008 Zheng J Q, Chen S X. A discussion on utilization of eucalyptus in China[J]. Eucalypt Science & Technology, 2017, 34(3): 42−46. doi: 10.3969/j.issn.1674-3172.2017.03.008
[6] 朱方丽, 邱宝利, 任顺祥. 桉树枝瘿姬小蜂连续世代种群生命表[J]. 生态学报, 2013, 33(1):97−102. Zhu F L, Qiu B L, Ren S X. The continuous life-table of Leptocybe invasa[J]. Acta Ecologica Sinica, 2013, 33(1): 97−102.
[7] 魏初奖, 张华峰, 陈德兰, 等. 福建省桉树枝瘿姬小蜂发生现状与防控对策[J]. 中国森林病虫, 2017, 36(4):44−46. doi: 10.3969/j.issn.1671-0886.2017.04.012 Wei C J, Zhang H F, Chen D L, et al. Hazard situation and control measures of Leptocybe invasa in Fujian Province[J]. Forest Pest and Disease, 2017, 36(4): 44−46. doi: 10.3969/j.issn.1671-0886.2017.04.012
[8] 韦建林, 何震, 梁一萍, 等. 桉树枝瘿姬小蜂危害林巨园桉DH201-2近自然生长研究[J]. 农业研究与应用, 2013(5):1−4. doi: 10.3969/j.issn.2095-0764.2013.05.001 Wei J L, He Z, Liang Y P, et al. Studies on the damage of Leptocybe invasa to near-natural growth of (Eucalyptus grandis × E. tereticornis) DH201-2[J]. Agricultural Research and Application, 2013(5): 1−4. doi: 10.3969/j.issn.2095-0764.2013.05.001
[9] 武海卫, 贾薪玉, 黄焕华, 等. 五种桉树对桉树枝瘿姬小蜂的抗性研究[J]. 环境昆虫学报, 2009, 31(2):132−136. doi: 10.3969/j.issn.1674-0858.2009.02.006 Wu H W, Jia X Y, Huang H H, et al. Studies on the resistance of five Eucalyptus species to Leptocybe invasa Fisher & La Salle[J]. Journal of Environmental Entomology, 2009, 31(2): 132−136. doi: 10.3969/j.issn.1674-0858.2009.02.006
[10] 张开存, 李晓艳, 朱琼, 等. 云南东川桉树枝瘿姬小蜂危害调查[J]. 安徽农业科学, 2017, 45(8):163−166. doi: 10.3969/j.issn.0517-6611.2017.08.055 Zhang K C, Li X Y, Zhu Q, et al. Damage Investigation of Leptocybe invasa Fisher & La Salle in Dongchuan District in Yunnan Province[J]. Journal of Anhui Agricultural Sciences, 2017, 45(8): 163−166. doi: 10.3969/j.issn.0517-6611.2017.08.055
[11] 常润磊, 周旭东. 我国桉树枝瘿姬小蜂研究现状[J]. 桉树科技, 2010, 27(1):75−78. doi: 10.3969/j.issn.1674-3172.2010.01.014 Chang R L, Zhou X D. Research status of Leptocybe invasa Fisher & La Salle in China[J]. Eucalypt Science & Technology, 2010, 27(1): 75−78. doi: 10.3969/j.issn.1674-3172.2010.01.014
[12] Pachauri R K, Meyer L A. Climate change, fifth assessment synthesis report [R/OL]. Geneva: IPCC, 2014 [2019−02−13]. http://www.ipcc.ch/report/ar5/syr/.
[13] Chejara V, Kriticos D, Kristiansen P, et al. The current and future potential geographical distribution of Hyparrhenia hirta[J]. Weed Research, 2010, 50(2): 174−184.
[14] Phillips S J, DudÍk M. Modeling of species distributions with MaxEnt: new extensions and a comprehensive evaluation[J]. Ecography, 2008, 31: 161−170.
[15] Phillips S J, Robert P A, DudÍk M, et al. Opening the black box: an open-source release of MaxEnt[J]. Ecography, 2017, 40: 887−893.
[16] Guevara L, Gerstner B E, Kass J M, et al. Toward ecologically realistic predictions of species distributions: a cross-time example From tropical montane cloud forests[J]. Global Change Biology, 2018, 24: 1511−1522.
[17] Riahi K, Rao S, Krey V, et al. RCP 8.5-A scenario of comparatively high greenhouse gas emissions[J]. Climatic Change, 2011, 109: 33−57.
[18] Tebaldi C, Wehner M F. Benefits of mitigation for future heat extremes under RCP4.5 compared to RCP8.5[J]. Climatic Change, 2018, 146: 349−361.
[19] Zhao Z C, Luo Y, Wang S W, et al. Science issues on global warming[J]. Journal of Meteorology and Environment, 2015, 31(1): 1−5.
[20] Bao J, Feng J, Wang Y. Dynamical downscaling simulation and future projection of precipitation over China[J]. Journal of Geophysical Research Atmospheres, 2015, 120(16): 8227−8243.
[21] Sa E, Martins H, Ferreira J, et al. Climate change and pollutant emissions impacts on air quality in 2050 over Portugal[J]. Atmospheric Environment, 2016, 131: 209−224.
[22] 朱耿平, 刘强, 高玉葆. 提高生态位模型转移能力来模拟入侵物种的潜在分布[J]. 生物多样性, 2014, 22(2):223−230. Zhu G P, Liu Q, Gao Y B. Improving ecological niche model transferability to predict the potential distribution of invasive exotic species[J]. Biodiversity Science, 2014, 22(2): 223−230.
[23] Zhong Q, Zhang J E, Ditommaso A, et al. Predicting invasions of Wedelia trilobata (L.) Hitchc. with MaxEnt and GARP models[J]. Journal of Plant Research, 2015, 128: 763−775.
[24] 李志辉, 杨民胜, 陈少雄, 等. 桉树引种栽培区区划研究[J]. 中南林学院学报, 2000, 20(3):1−10. Li Z H, Yang M S, Chen S X, et al. Study on regionalization for Eucalyptus introduction cultural area in China[J]. Journal of Central South Forestry University, 2000, 20(3): 1−10.
[25] 邓利和, 王丕振. 海南省桉树种质资源分布调查及分析[J]. 热带林业, 2018, 46(2):47−51. doi: 10.3969/j.issn.1672-0938.2018.02.013 Deng L H, Wang P Z. Investigation and analysis on distribution of germplasm resources of Eucalyptus sinensis in Hainan Province[J]. Tropical Forestry, 2018, 46(2): 47−51. doi: 10.3969/j.issn.1672-0938.2018.02.013
[26] Huang M Y, Ge X Z, Shi H L, et al. Prediction of current and future potential distributions of the Eucalyptus pest Leptocybe invasa (Hymenoptera: Eulophidae) in China using the CLIMEX model[J]. Pest Managemant Science, 2019, 75(11): 2958−2968.
[27] 翟薇, 李肖霞. BCC_CSM1.1全球-模式中极端气温变化的归因分析[J]. 气象与环境科学, 2014, 37(4):25−32. doi: 10.3969/j.issn.1673-7148.2014.04.004 Zhai W, Li X X. Attribution analysis of the extreme temperature change in BCC_CSM1.1 global pattern[J]. Meteorological and Environmental Sciences, 2014, 37(4): 25−32. doi: 10.3969/j.issn.1673-7148.2014.04.004
[28] 周鑫, 李清泉, 孙秀博, 等. BCC_CSM1.1模式对我国气温的模拟和预估[J]. 应用气象学报, 2014, 25(1):95−106. doi: 10.11898/1001-7313.20140110 Zhou X, Li Q Q, Sun X B, et al. Simulation and projection of temperature in China with BCC_CSM1.1 model[J]. Journal of Applied Meteorological Science, 2014, 25(1): 95−106. doi: 10.11898/1001-7313.20140110


计量
- 文章访问数: 1356
- HTML全文浏览量: 406
- PDF下载量: 75
