Vegetation coverage information extraction of mine dump slope in Wuhai City of Inner Mongolia based on visible vegetation index
-
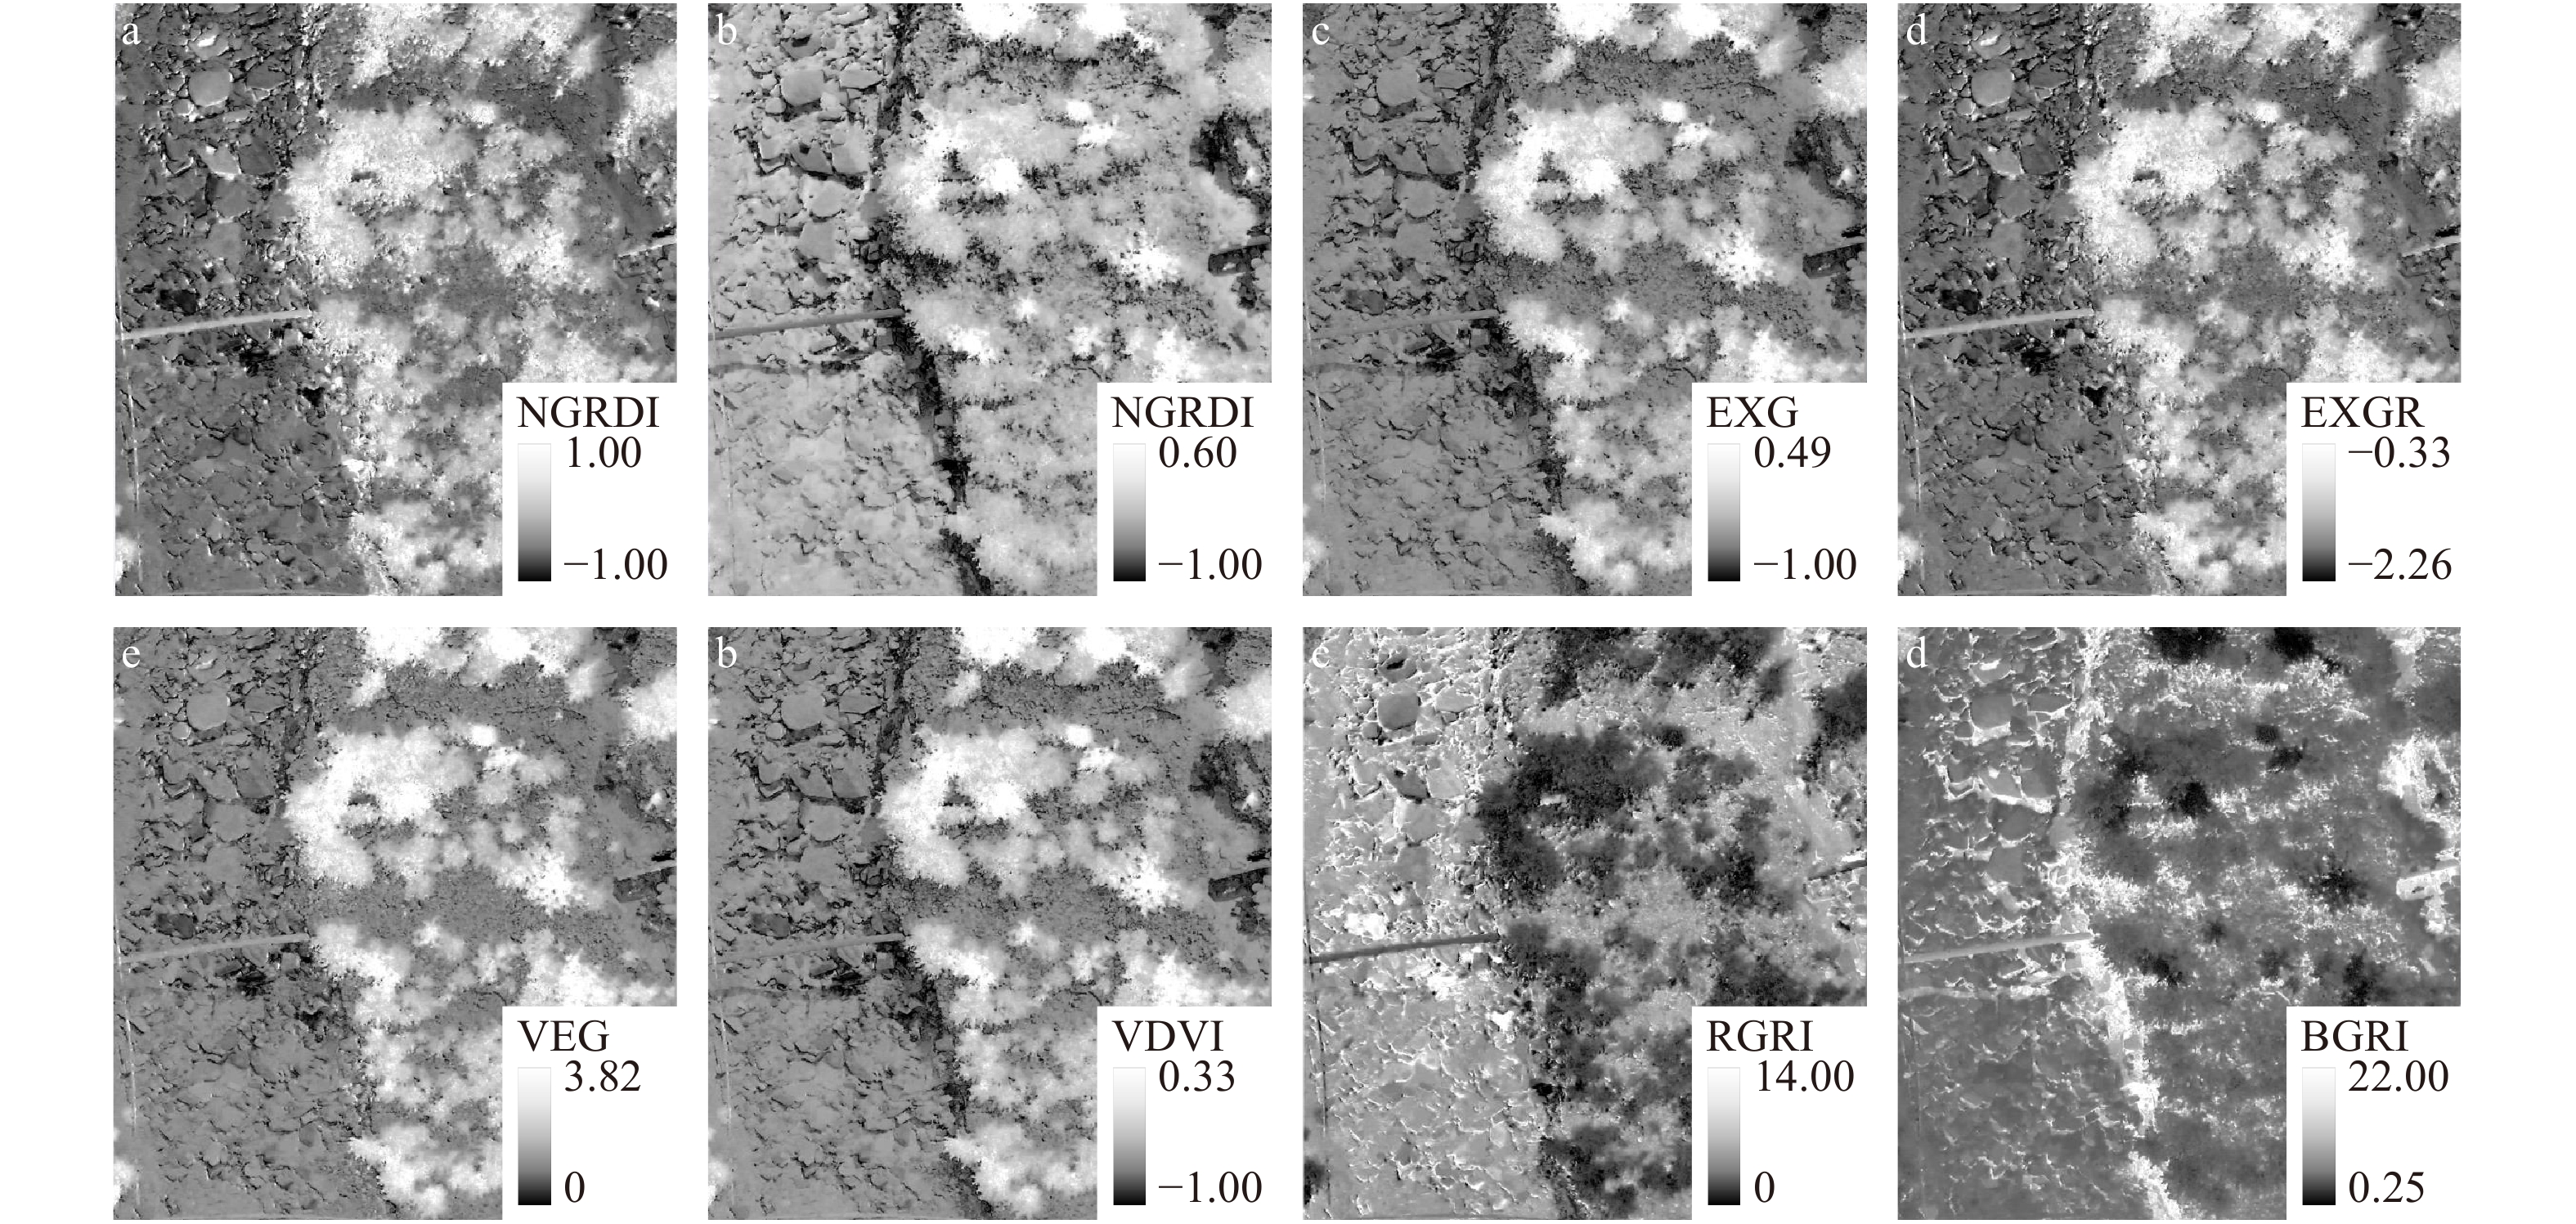
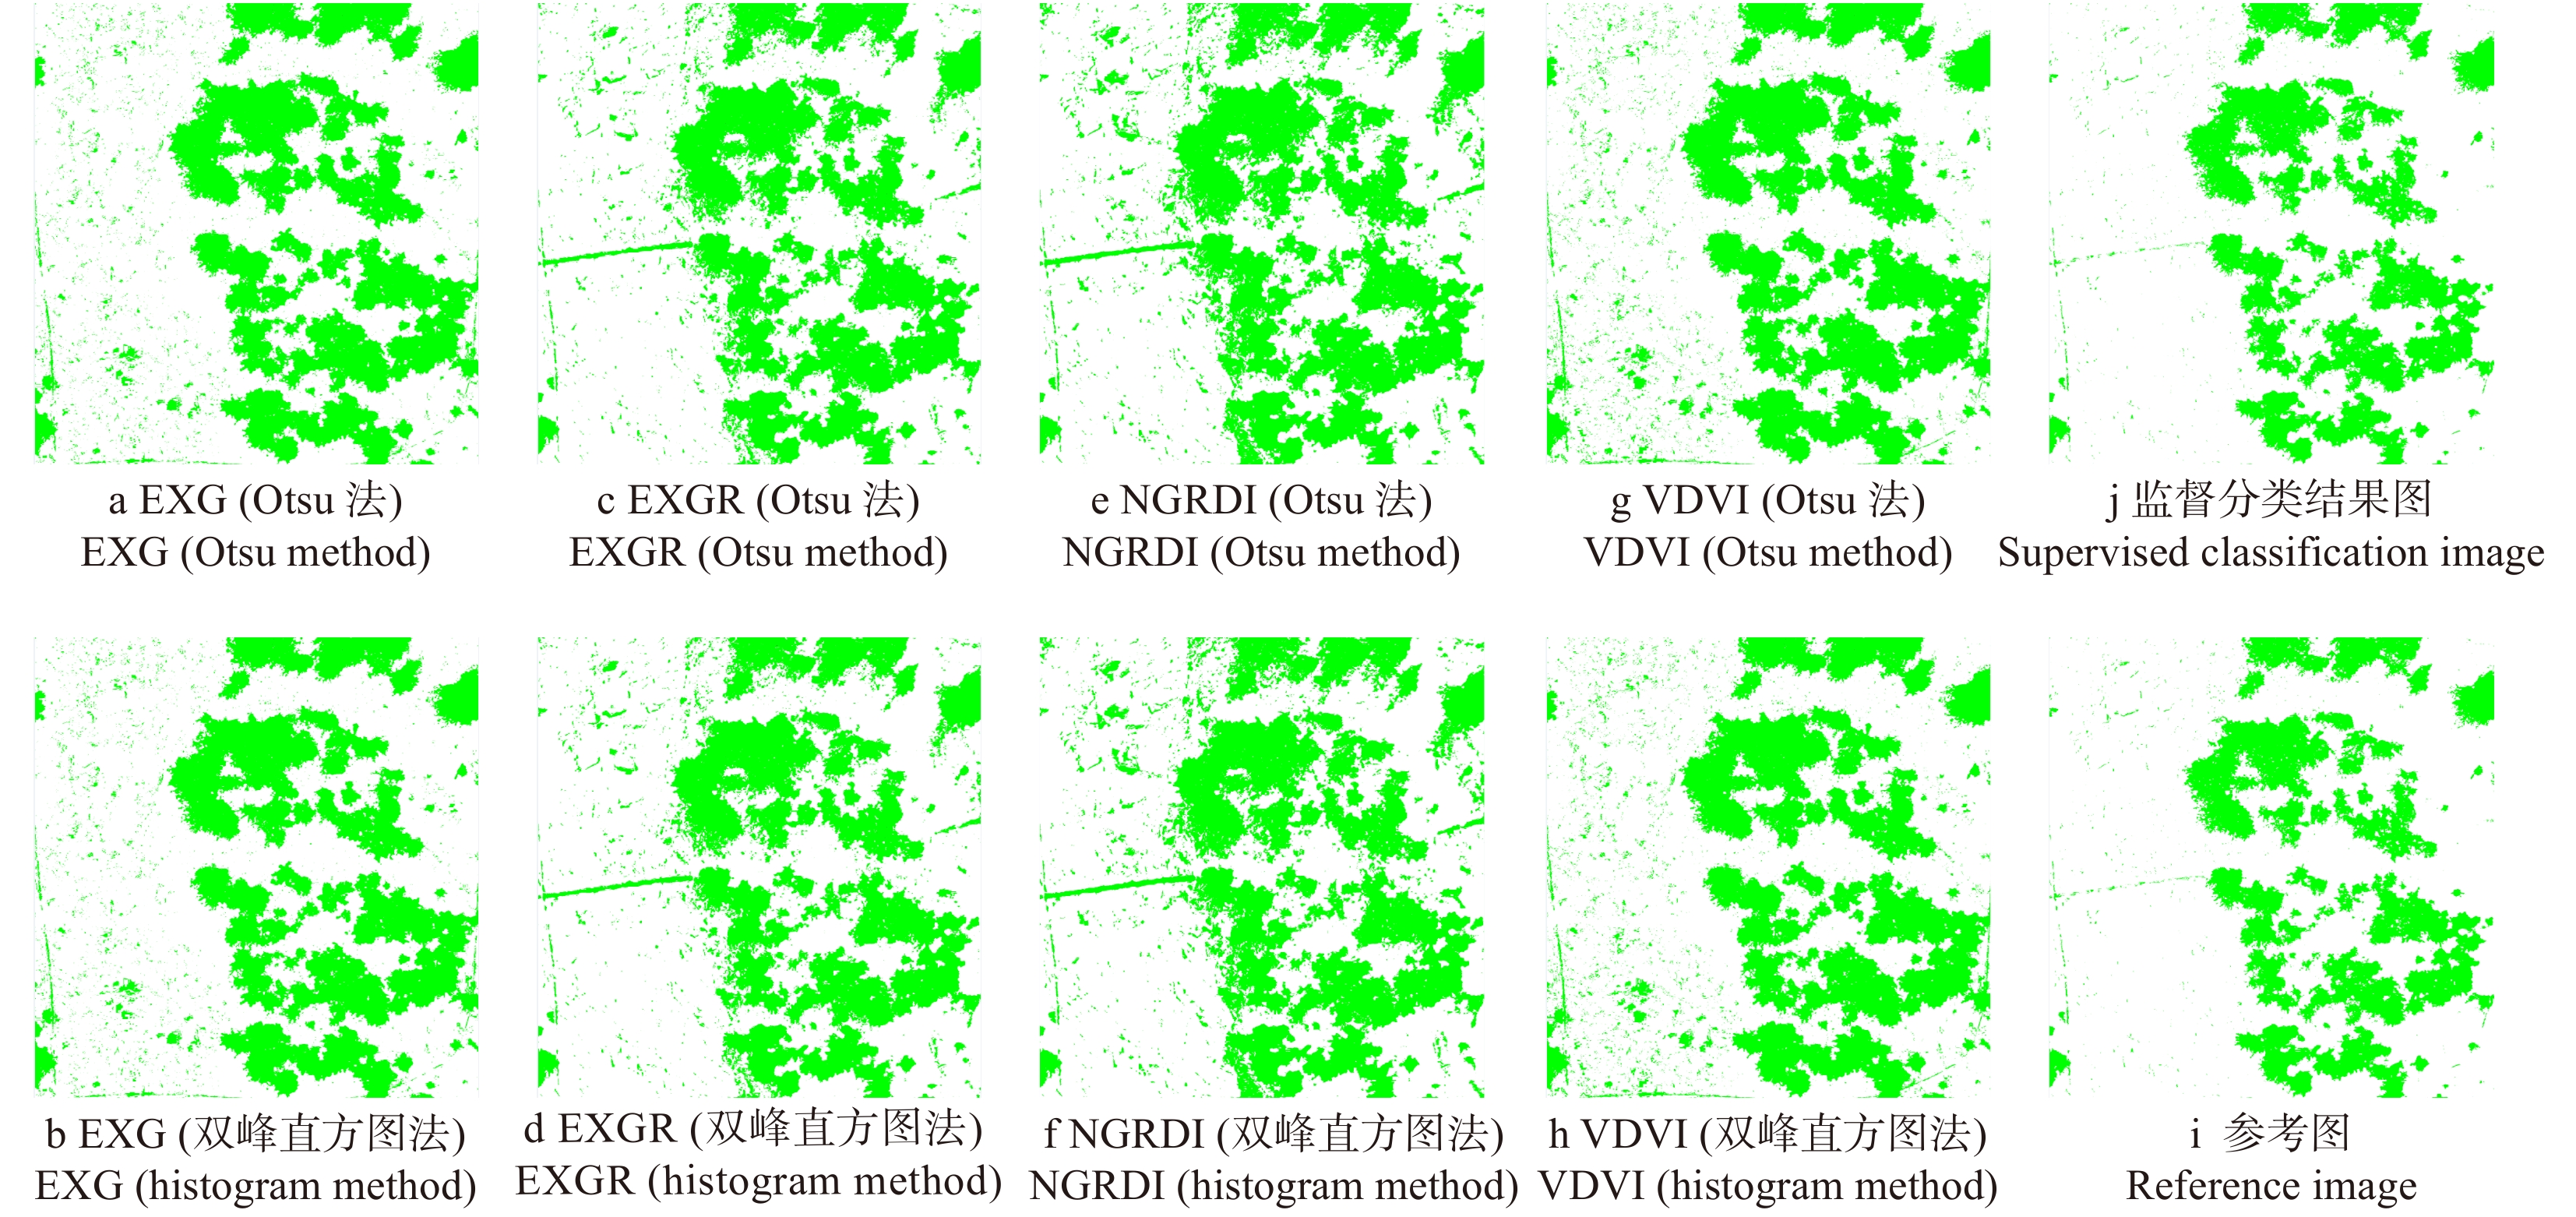
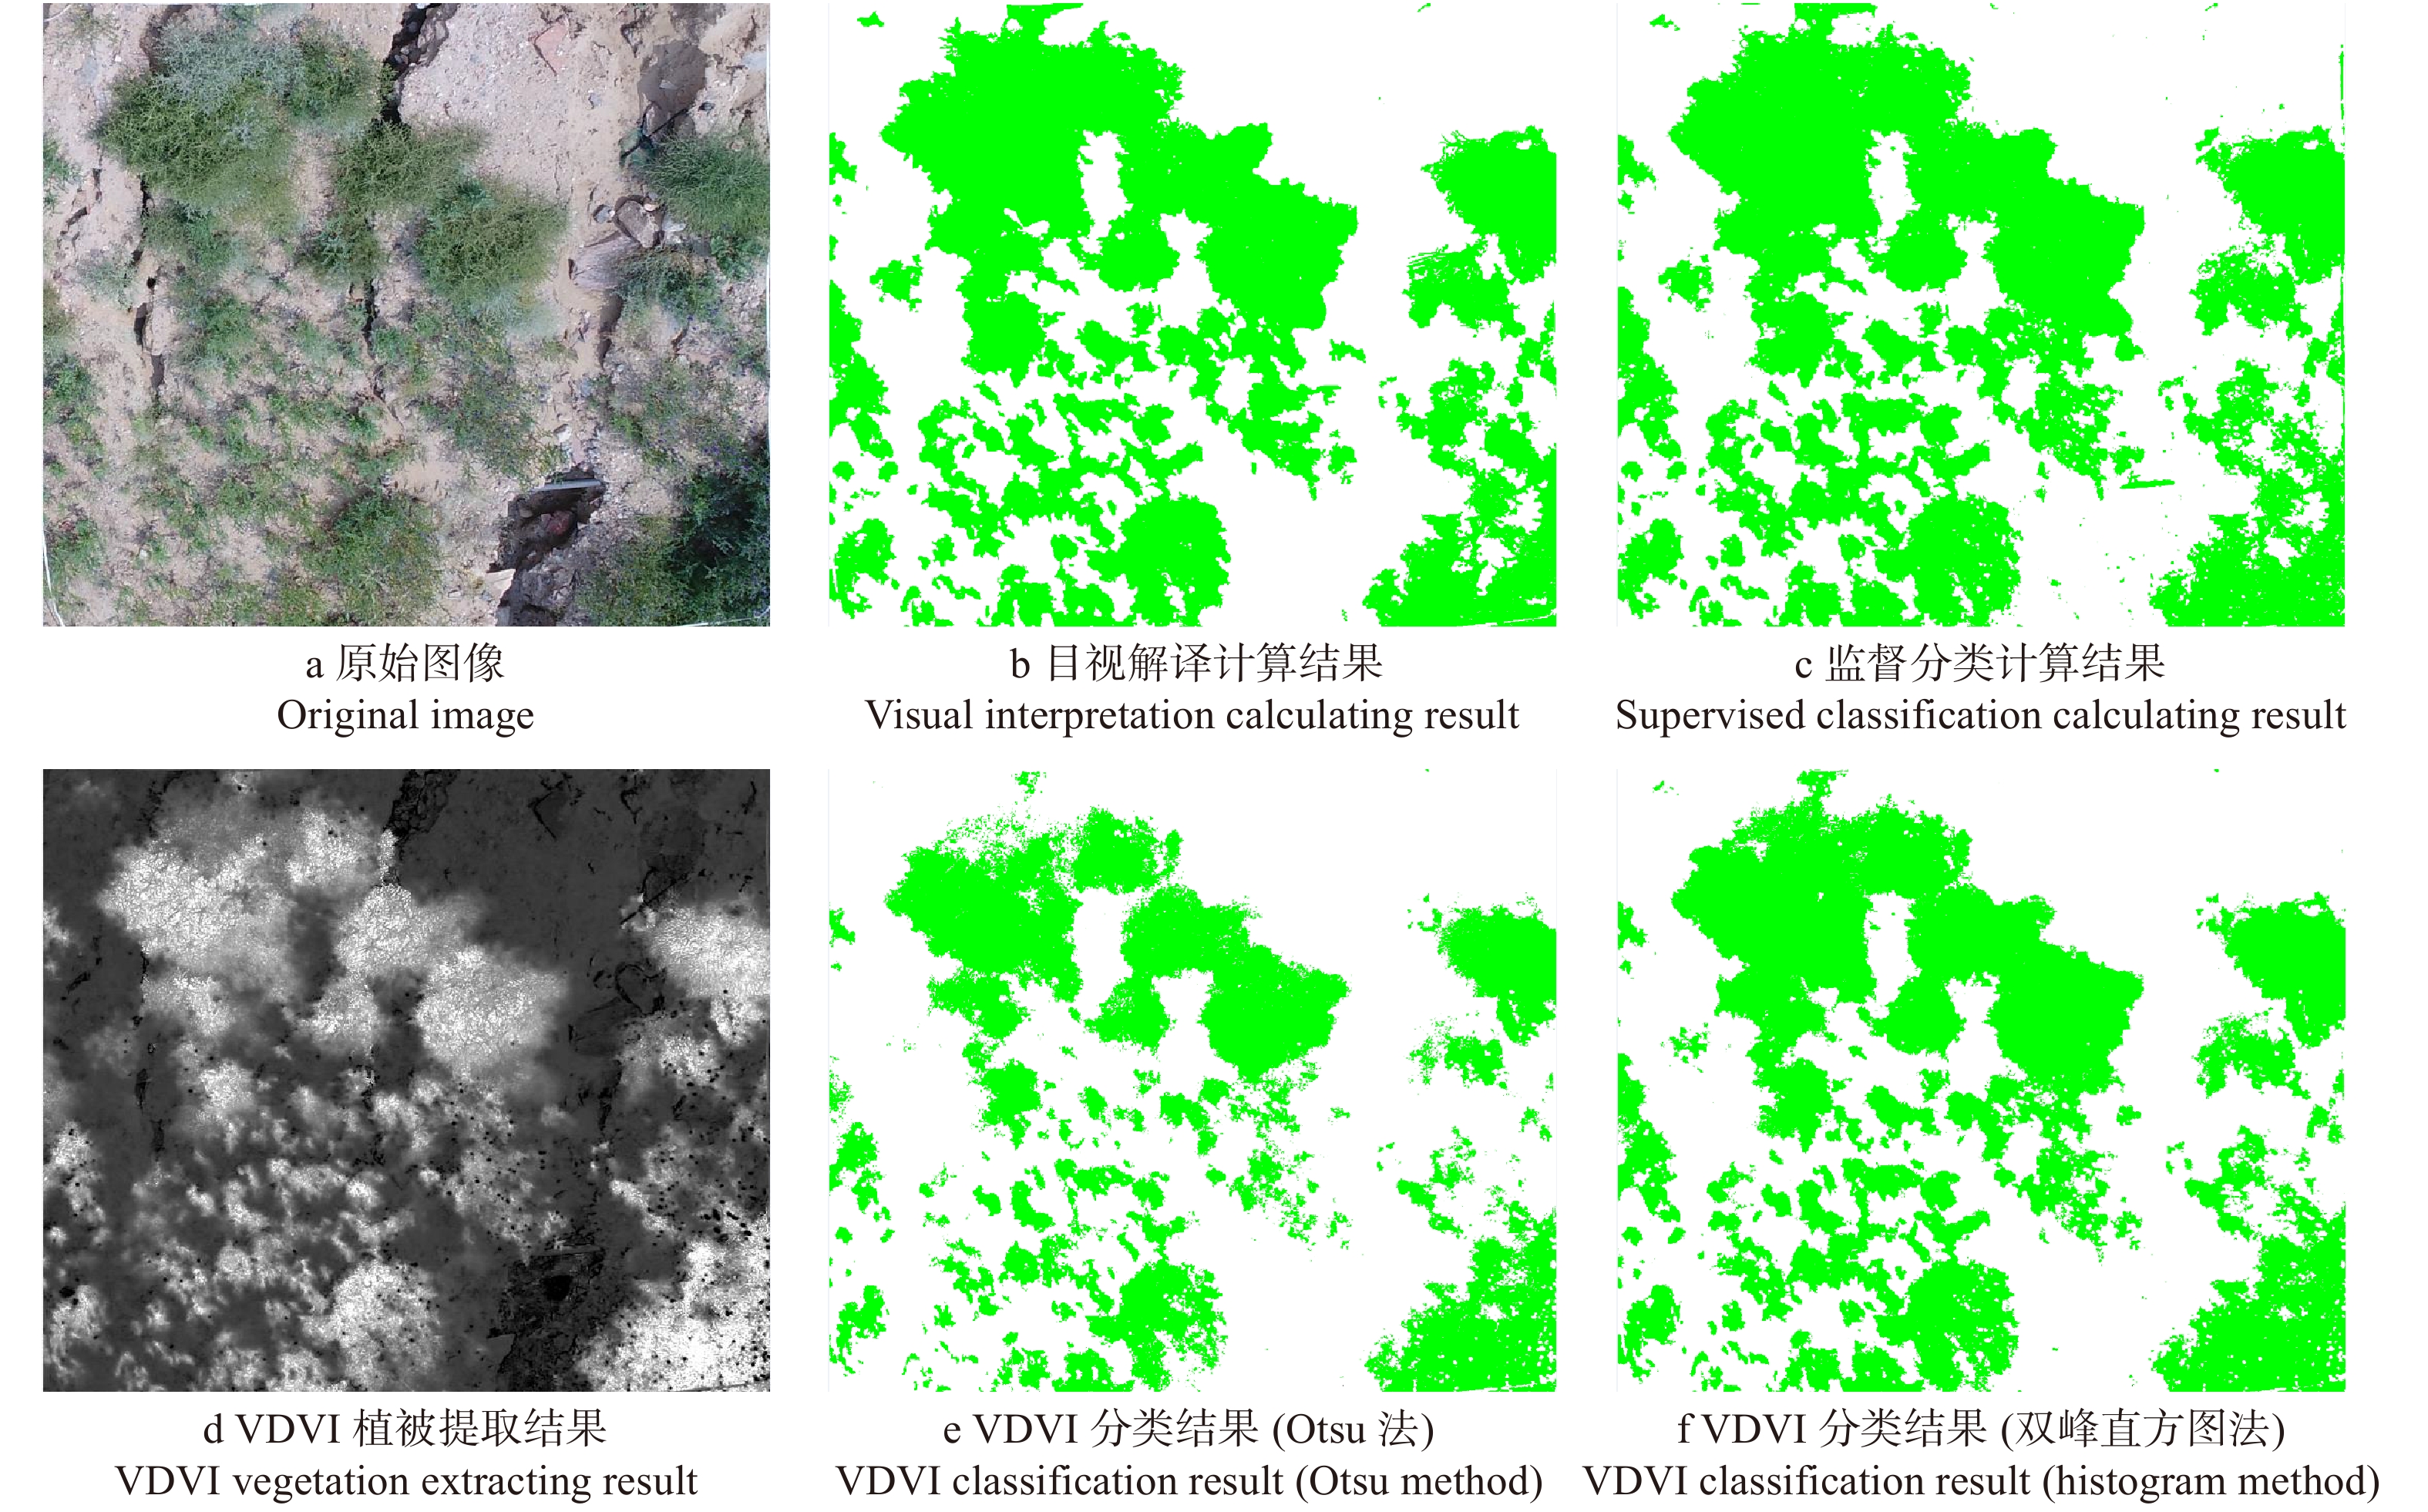
摘要:目的利用可见光植被指数快速准确获取矿山排土场坡面植被盖度,为乌海矿区排土场坡面植被调查提供有效方法。方法选取乌海市典型矿山排土场,通过样方调查法、无人机遥感及可见光植被指数计算筛选适于研究区排土场坡面植被提取的可见光植被指数,并估算其植被盖度,试为排土场坡面植被盖度提取提供新方法。结果结果表明:(1)不同可见光植被指数提取植被效果存在一定差异,其中绿红比值指数(RGRI)和绿蓝比值指数(BGRI)的灰度图中越暗的部分代表植被指数越大,而其他常见可见光植被指数是越亮的部分代表植被指数越大。(2)研究区中不同可见光植被指数灰度图像特征值基本分布在[− 1,1]范围内,由蓝、绿波段构建的归一化绿蓝差异指数(NGBDI)和绿蓝比值指数(BGRI)的灰度图中植被与裸地像元值范围有较大重叠,即存在部分混淆。(3)常见可见光植被指数中,可见光波段差异植被指数(VDVI)可以快速准确提取研究区排土场坡面植被,通过人工目视解译及误差矩阵得到VDVI植被指数提取结果平均识别精度在93.4%,表明VDVI植被指数更加适用于乌海市矿山排土场坡面植被提取,优于其他常见可见光植被指数,利用该方法估算可得研究区坡面植被盖度约20.4%。结论可见光植被指数作为一种非监督分类方法,无需人工选择参考地物即可提取植被,可以作为矿山排土场坡面植被盖度调查的一种新方法,具有广阔的应用前景,同时研究表明VDVI植被指数在提取乌海市矿山排土场坡面植被盖度时具有较高提取精度,对指导当地矿山排土场植被恢复具有实际意义。Abstract:ObjectiveThis paper aims to use visible vegetation index to get the slope vegetation coverage of mine dump quickly and accurately, and to provide an effective method for the vegetation investigation of slope in Wuhai mining area, Inner Mongolia of northern China.MethodThis study selected one of the typical mine dumps in the Wuhai City to choose a suitable visible vegetation index for local research, estimate the dump vegetation coverage, and furthermore try to provide a new method for extracting the dump slope vegetation coverage by means of Quadrat survey, UAV remote sensing and visible vegetation index.Result(1) Different visible vegetation indexes had varied vegetation extraction effects. Among them, the darker part of red-green ratio index (RGRI) and blue-green ratio index (BGRI) represented the larger vegetation index, while the brighter part of other common visible vegetation indexes represented the larger vegetation index. (2) Gray image feature values of different visible vegetation indexes mainly distributed in range of [− 1, 1] in the research area. There was a big overlap of pixel value between vegetation and land in the gray image of normalized green-blue difference index (NGBDI) and BGRI constructed from blue and green bands, which means some partial confusion between them. (3) Visible-band difference vegetation index (VDVI) can extract slope vegetation quickly and accurately among common visible vegetation indices. The average recognition accuracy of VDVI vegetation index was 93.4% by manual visual interpretation and error matrix, showing that VDVI vegetation index could be more suitable for the vegetation extraction on the mine dump in Wuhai City, and was better than the vegetation index of other common visible light. The vegetation coverage of the study area was approximately 20.4% by this method.ConclusionVisible vegetation index, an unsupervised classified method, could be a new method for investigating vegetation coverage of mine dump slope without selecting reference features by people but extract slope vegetation coverage directly and has a broad application prospect. The study also indicates that VDVI shows higher extraction accuracy of extracting vegetation coverage of mine dump slope in the Wuhai City, which means a practical significance to guide the vegetation restoration in local mine dump.
-
Keywords:
- unmanned aerial vehicles /
- visible-bands /
- vegetation index /
- dump /
- Wuhai City
-
近年来,以全球变暖为主要标志的气候变化给生态系统带来了巨大的压力[1-4],陆地生态系统的生产力以及水分利用也受到了严重的影响[5-7]。而树木水分利用效率(water use efficiency,WUE)可以反映生态系统对全球气候变化的响应和描述不同生态系统的碳水循环关系 [8]。因此研究WUE不仅可以揭示生态系统对气候变化响应机理,还可以为区域气候变化对生态系统碳水耦合关系的影响提供科学的评价依据。
因研究目的、对象不同,WUE一般可分为生态系统、群体、叶片、以及个体4个方面。生态系统WUE是指植物消耗单位质量水分所固定的二氧化碳或生产干物质的量,因研究尺度、研究领域及获取数据手段的差异,不同的研究对生态系统WUE的计算往往存在一定的区别[9]。群体水平WUE是植物累计一段时期的干物质积累量与作物耗水量的比值,在植物群体水平上研究WUE时,其测算需要在大田试验中进行,工作复杂繁琐,计算出来的WUE不够准确[10]。叶片尺度上的WUE定义为单位通过蒸腾作用消耗单位水量时光合作用形成的有机物量[11],在叶片尺度上研究植物的WUE,只能测得叶片尺度瞬时值,缺乏长时间尺度WUE的研究。而基于树木年轮稳定碳同位素的水分利用效率研究可以反映植物个体的长期WUE[12],已有研究表明这一方法的可行性 [13-15],并且该方法采样破坏性小,测定简单且不受时间和季节的限制[16]。目前国内外学者也进行了许多关于树木年轮稳定碳同位素方法研究植物WUE对气候变化响应的工作,如路伟伟等[17]研究北京山区油松(Pinus tabuliformis)WUE发现,区域整体WUE年际变化与温度呈显著负相关关系,与降水量呈正相关关系。Kannenberg等[18]研究美国西部灌木丛和森林的WUE发现,随着气候变得越来越干燥,美国西南部植物的WUE快速增加。Gagen等[19]利用树轮δ13C研究北芬诺斯干地亚植物的WUE发现,樟子松(Pinus sylvestris)WUE随着CO2浓度的升高而升高,但随着CO2浓度逐渐升高,樟子松WUE的升高出现了阈值。由于生态系统植被类型的多样性以及水分利用的有效性,气候因子对不同生态系统WUE的影响存在较大的差距,不同生态系统WUE的变化特征以及对气候变化的响应也不同。为此针对不同区域生态系统树木WUE进行研究是非常有必要的。
日本柳杉(Cryptomeria japonica)是庐山植被类型的重要树种组成部分,主要分布在海拔700 m以上的常绿针叶人工林,在水源涵养、净化大气环境、森林游憩等生态功能上发挥了重要的作用[20],并且有着较高的生态效益和经济效益。因此本文以庐山日本柳杉作为研究对象,基于树木年轮和稳定碳同位素方法,分析气候变化背景下庐山日本柳杉WUE的变化特征以及庐山日本柳杉WUE与主要气候因子之间的关系,有助于庐山日本柳杉的碳汇能力评估以及提升森林的经营管理水平,对评估庐山日本柳杉的碳水耦合关系提供科学的理论支持。
1. 研究方法与数据来源
1.1 研究区概况
庐山位于江西省九江市(115°51′ ~ 116°07′E,29°30′ ~ 29°41′N),东偎鄱阳湖,海拔25.0 ~ 1 473.8 m,是著名的避暑胜地,气温适度,年平均最高温度32 ℃,最低气温−16.8 ℃,全年平均温11.4 ℃,全年平均降雨量1 917 mm,属湿润气候区(图1)。充足的水热条件及海拔的差异,共同造就了庐山丰富的植被资源[21]。高达40种植物在庐山地区首次被发现或者以庐山(牯岭)来命名。在植被类型区域划分上虽然属于亚热带常绿阔叶林,由于海拔高度具有较大的差异,因此植被类型上又极具多样性。海拔在1 000 m以下多为常绿或者是常绿落叶混交林,海拔在1 000 ~ 1 300 m为落叶阔叶林带[22]。生长在海拔较低处的植被由于受到人为活动的影响,植被破坏较为严重,而海拔较高处植被生长相对较好,对生态系统水源涵养的调节具有一定的作用[23]。
1.2 树木年轮的采集与碳同位素的测定
本研究根据国际树木年轮数据库的采样准则[24],于2019年7月份在庐山3个不同海拔点取样(采样点1、2、3,见图1),海拔分别为800、950和1 150 m,平均树高为18.6、20.0和19.5 m,平均胸径为29.2、30.5和30.1 cm,林分密度为780 株/hm 2,郁闭度 0.6。每个样点取40个样芯。3个采样点的庐山日本柳杉生长良好,受人类活动以及自然灾害影响较小。
通过对日本柳杉样品进行交叉定年[25],选取其树轮无生长异常、年轮宽度变化趋势较为一致、早晚材年轮界限明显的树芯用于稳定同位素的δ13C测定。具体步骤:用不锈钢刀由外而内逐年剥取全木,某些极窄年份的剥取在显微镜的辅助下进行精确切割,将不同树芯的相同年份合并在一起,置于80 ℃的烘箱中烘干至恒质量,枝剪剪碎之后的木材碎屑用高通量组织研磨仪研磨粉碎,过100目筛后装于5 mL离心管中,用于碳同位素测定分析,然后将样品粉末置于V(苯)∶V(乙醇) = 2∶1混合溶液中抽提24 h,除去树脂、树蜡及单宁类等有机物[26]。天平(精度0.001 mg)称取(0.20 ± 0.05) mg抽提好的样品包裹于锡杯中,在赛默飞稳定同位素质谱仪(delta v advantange)中将样品高温燃烧转换为气体,测量精度0.01‰,试验误差小于0.2‰[27],测得稳定碳同位素的比值,即13C丰度(δ13C),每测定10个样品插入1个标样来测定仪器的稳定性(处理的树轮样品在江西农业大学森林培育重点实验室内进行分析测定),根据国际标准进行校正后得到日本柳杉稳定碳同位素δ13C值。
1.3 数据来源及处理
本文所用的气象数据来源于中国气象数据网(http://data.cma.cn/site/index.html)的庐山站日气象数据(庐山站的位置见图1),主要包括1968—2018年的平均气温(T)、最高温度、最低温度、相对湿度、降水量(W)、日照时数、平均风速(Ws)等日值数据。
参考1998年联合国粮农组织推荐的计算公式,利用日照时数数据作为输入参数计算庐山多年的太阳辐射(Rs),详细计算步骤可具体参阅文献[28]。为更准确量化庐山干旱严重程度,使用标准化降水蒸散指数(standardized precipitation evapotranspiration index,SPEI)、标准化降水指数(standardized precipitation index,SPI)以及湿度指数(wet index,WI)来表示庐山地区的干旱情况。SPEI和SPI的计算步骤具体参阅文献[29],WI的计算计算步骤具体参阅文献[30]。利用树木年轮稳定碳同位素值、大气CO2中碳同位素比值和WUE关系来估算庐山日本柳杉1969—2018年的水分利用效率变化,根据Farquhar[13]推荐的公式计算δ13C。
δ13C=(13C/12C)sample−(13C/12C)PDB(13C/12C)PDB×1000‰ (1) 式中:(13C/12C)sample是测试样品13C/12C的摩尔比率; (13C/12C)PDB是标样13C/12C的摩尔比率,δ13C是树木年轮稳定碳同位素比值。
WUE可通过Δ与Ca值之间的关系计算获得[31]。
Δ=δ13Cp−δ13C1+δ13Cp (2) WUE=Ca×(b−Δ)1.6×(b−a) (3) 式中:δ13Cp是大气CO2碳同位素比值,Δ是指树木叶片和空气在光合作用期间同位素水平的差异δ13C的判别值;a是CO2扩散过程中的同位素分馏,取4.4‰,b为CO2羧化过程中的同位素分馏,取27.4‰,此外,系数1.6表示空气中水蒸气与CO2的扩散率之比。Ca为大气二氧化碳浓度,大气二氧化碳浓度由全球系统研究实验室(https://ngdc.noaa.gov/ftp.html)提供。
1.4 统计方法
本文采用一元线性回归模型分析1969—2018年庐山日本柳杉WUE的动态变化趋势[32-33]。并采用曼−肯德尔(M-K)突变分析方法,研究庐山日本柳杉WUE的突变年份[34]。
为预测庐山日本柳杉水分利用效率未来变化趋势,利用Hurst指数(H)进行计算,H是定量描述时间序列的自相似性以及长程依赖性的方法,常采用R/S分析法[35]。本研究中R表示50年日本柳杉WUE序列的极差,S为该时间段WUE的标准差,R/S为极差与标准差的比值,ln为对数函数,τ为偶数序列。当0.5 < H < 1,表明时间序列变化具有持续性的序列,未来的变量与过去的变量是一致的关系;H = 0.5,说明时间序列为相互独立,不存在相互影响的随机序列;0 < H < 0.5,表明时间序列变化具有反持续性的序列,未来的变量与过去的变量是完全相反的序列。其中R2越接近1,显著性越强。植物在生长过程中,气候因子对其生长通常表现出一定的“滞后效应”[36],树木生长不仅受当年生长季气候因子的影响,还会受到上一年生长季后期气候因子变化的影响。因此,本研究选取上一年7月至当年12月共18个月份的气象数据进行相关性分析和多元回归分析。
2. 结果与分析
2.1 庐山地区各气候因子动态变化
通过对庐山1968—2018年各月气候因子的统计分析得到如图2的结果。从图2可以看出,干旱指数SPEI、WI以及SPI月变化基本一致。大致从2月到6月表现出下降的趋势,呈干旱趋势发展,SPEI和SPI在7月到10月波动较平缓,WI波动较大;干旱指数SPEI、WI以及SPI在12月呈上升趋势(图2a)。月平均气温从1月到7月呈上升趋势,最高气温出现在7月,为22.5 ℃;从8月到12月呈下降趋势,最低气温出现在1月,为0.3 ℃(图2b)。庐山地区的月平均太阳辐射和月平均风速最高出现在7月,为590.37 MJ/m2和4.94 m/s,月平均太阳辐射最低在1月,为285.72 MJ/m2,月平均风速最低在12月,为 3.53 m/s(图2c)。月平均降水量从1月到6月呈上升趋势,降水量最高出现在6月,为299.54 mm,最低出现在12月,为58.33 mm(图2d)。
2.2 庐山日本柳杉年轮稳定碳同位素值以及大气二氧化碳同位素值变化规律
如图3a所示,本研究中树轮δ13C序列没有因幼龄效应而表现出明显的趋势变化。日本柳杉δ13C序列变动范围在−23.09‰ ~ −25.67‰,年平均−24.55‰。这与O’Leary等[37]的研究得出自然条件下生长的陆地C3植物碳稳定同位素变化范围在−22‰ ~ −34‰的结论是相符的。庐山日本柳杉的δ13C总体呈递减趋势,平均每10年下降0.34‰。线性回归方程的相关系数R2 = 0.59,δ13C下降趋势显著。但在2001年后有小幅度上升趋势,最大值达到−24.35‰,在2010年呈下降趋势发展,最小值为−25.67‰。庐山δ13Cp序列(1969—2018)变动范围在−7.29‰ ~ −8.93‰(图3b),在1969—2018年总体上是逐年递减的趋势,线性回归方程的相关系数R2 = 0.98,下降趋势显著,平均每10年下降0.32‰。
2.3 庐山日本柳杉水分利用效率的变化特征
如图4a所示,1969—2018年间,庐山日本柳杉的WUE变动范围在91.06 ~ 118.89 μmol/mol,年平均值102.37 μmol/mol,总体呈现上升趋势,平均每10年上升5.2 μmol/mol,2013年出现最大值,为118.89 μmol/mol,最小值出现在1985年,为91.06 μmol/mol。为明确庐山日本柳杉WUE的年际变化特征,本研究对WUE进行了M-K突变分析和Hurst指数分析。从图4b的M-K突变分析可知:WUE呈低−高的趋势走向。1969—1987年,UF呈下降趋势,表明在这一时期,庐山日本柳杉WUE呈下降趋势,1988—2018年,UF呈上升趋势,表明庐山日本柳杉WUE呈上升趋势。庐山日本柳杉WUE的UF、UB交点出现在2004年(图4b),但庐山日本柳杉的WUE交点并不在±1.96临界线值范围内,没有通过0.05的检验,因此该年份的WUE交点上升不具有突变性。在双对数坐标系可以拟合得到年际庐山日本柳杉WUE的时间序列ln(R/S)与ln(τ/2)线性关系图(图4c)。由图4c可知,R/S趋势预测点之间存在良好的线性关系,R2 = 0.91,接近1,模型可行度高,线性拟合效果好。线性拟合的斜率为0.816 8,即Hurst指数估计值为0.816 8,表明庐山日本柳杉的WUE时间序列具有持续性关系,在未来变化中与过去存在较强的相关性,因此未来庐山日本柳杉的WUE呈现上升趋势。
![]() 图 4 庐山日本柳杉水分利用效率的变化特征及趋势WUE. 水分利用效率; UB.逆序时间序列变化;UF.顺序时间序列变化;R.极差;S.标准差;τ.偶数序列;ln.对数函数。WUE, water use efficiency; UB, inverse-order time series variation; UF, sequential time series variation; R, range; S, standard error; τ, even sequences; ln, logarithmic function.Figure 4. Variation characteristics and trends of water use efficiency of Cryptomeria japonica
图 4 庐山日本柳杉水分利用效率的变化特征及趋势WUE. 水分利用效率; UB.逆序时间序列变化;UF.顺序时间序列变化;R.极差;S.标准差;τ.偶数序列;ln.对数函数。WUE, water use efficiency; UB, inverse-order time series variation; UF, sequential time series variation; R, range; S, standard error; τ, even sequences; ln, logarithmic function.Figure 4. Variation characteristics and trends of water use efficiency of Cryptomeria japonica2.4 庐山日本柳杉水分利用效率与气候变化的相关分析以及多元回归模型解释
从庐山日本柳杉WUE序列与月气候变化的相关性分析(图5)可知:庐山日本柳杉WUE与各月气温大多呈正相关关系,与上年的7月、9—11月和当年的2—6月、9—11月呈显著正相关系,其中与上年的9月和当年的3—5月以及9月温度达到极显著正相关系;庐山日本柳杉WUE与各月太阳辐射大多呈负相关,但相关性不显著;WUE与干旱指数上年7—12月份、当年1—12月份干旱指数SPEI、SPI以及WI均呈负相关,但相关性不显著;庐山日本柳杉WUE与上年7—12月、当年1—12月风速均呈极显著负相关关系;WUE与上年7—12月至当年1—12月降水均无显著关系。在庐山日本柳杉的生长过程中, T和Ws在很大程度上驱动了日本柳杉水分利用效率的变化。通过多元线性回归方法将相关气候因子数值进行标准化来描述庐山日本柳杉水分利用效率与月气候因子之间的关系,回归过程选用逐步回归。得到庐山日本柳杉水分利用效率的回归方程。
![]() 图 5 庐山日本柳杉WUE与月气候变化的相关性P 为上年月份,C 为当年月份。**表示在置信度(双侧)为0.01时相关性显著;*表示在置信度(双侧)为0.05时相关性显著。P represents the month in previous year, C represents the month in current year. ** indicates a significant correlation at a confidence level (bilateral) of 0.01, * indicates that the correlation is significant at a confidence level (bilateral) of 0.05.Figure 5. Correlations between WUE of Cryptomeria japonica and monthly climate change in Lushan Mountain
图 5 庐山日本柳杉WUE与月气候变化的相关性P 为上年月份,C 为当年月份。**表示在置信度(双侧)为0.01时相关性显著;*表示在置信度(双侧)为0.05时相关性显著。P represents the month in previous year, C represents the month in current year. ** indicates a significant correlation at a confidence level (bilateral) of 0.01, * indicates that the correlation is significant at a confidence level (bilateral) of 0.05.Figure 5. Correlations between WUE of Cryptomeria japonica and monthly climate change in Lushan MountainWUE=58.349−3.733Ws1+1.487T3+1.690T9+1.667T−9−3.377Ws12(P<0.05,R2=0.65) 式中:WUE表示庐山日本柳杉水分利用效率,庐山日本柳杉水分利用效率主要与Ws1(当年1月风速)、T3(当年3月均温)、T9 (当年9月均温)、T−9(上年9月均温)、Ws12(当年12月风速) 相关。
3. 讨 论
3.1 干旱对日本柳杉水分利用效率的影响
水分利用效率是用来衡量植物个体或生态系统水平上碳水耦合关系的重要指标,能够揭示植物个体或生态系统WUE的变化特征[38]。WUE的影响因子随地区和尺度的不同而变化[39]。在本次研究中,本文选3个干旱指数进行庐山日本柳杉水分利用效率对干旱的响应验证发现,无论是SPEI、SPI还是WI,对庐山日本柳杉长期WUE的影响较小或者没有影响,均呈负相关关系(P > 0.05)。Song等[40]对西南亚热带常绿原生林水分利用效率研究表明亚热带常绿森林在干旱年的WUE呈增加趋势。一般认为,不同的生态系统WUE对干旱的响应是不同的。Liu等[41]对中国陆地生态系统水分利用效率与干旱响应研究发现在中国南方,中度和极端干旱会导致WUE下降,严重干旱往往导致WUE略有上升,而在东北和内蒙古中部地区轻微干旱通常会导致WUE增加。杜晓铮等[7]在研究陆地生态系统水分利用效率对气候变化的响应研究综述表明,在不同的气候区域干旱对WUE的影响有所差异,不同生态系统WUE对干旱的响应不同。有研究表明,干旱对植物的水分利用效率存在一定的滞后影响[42]。在本研究中发现,干旱对庐山日本柳杉WUE没有产生滞后影响。在湿润区,干旱发生的同时由于太阳辐射的射入,可能会加快植物的生长速度,同时蒸腾作用也会损失一部分的水分,造成植物WUE呈现出下降的趋势。在本次研究我们也发现,降水与 WUE呈负相关关系(P > 0.05),但相关性不显著。这可能是由于庐山地处湿润区,降水丰富,导致植物叶片气孔导度增大、蒸腾速率增强,造成了庐山日本柳杉水分利用效率的降低。
3.2 气温对日本柳杉水分利用效率的影响
温度对于植物水分利用的影响较为复杂。我们发现,气温对庐山日本柳杉的水分利用效率存在一定的滞后影响,上年的9月气温与庐山日本柳杉WUE呈显著正相关关系,当年的9月气温与庐山日本柳杉WUE也呈显著正相关关系。可能是由于气温适中,植物酶活性增强,从而影响植物水分利用。周佳等[43]利用树木年轮研究河南民权与陕西白水刺槐(Robinia pseudoacacia)水分利用效率对气候的响应表明,两地刺槐WUE与平均温度存在显著正效应关系。一定范围内,温度升高,叶片的气孔导度增加,植物的净光合速率大于蒸腾速率,造成植物WUE升高。崔茜琳等[44]利用MODIS数据研究青藏高原植被水分利用效率,青藏高原植被的WUE 与气温呈显著正相关关系,WUE的敏感性随气温的升高而增加。仇宽彪等[45]对陕西省各植被类型WUE研究时发现,在温度低于11 ℃的地区WUE和温度呈现显著正相关(P < 0.01),而高于11 ℃的地区两者之间没有显著关系(P > 0.05)。在不同的气候区, WUE对温度的响应存在着较大的差异。
3.3 风速对日本柳杉水分利用效率的影响
风会影响植物周围的环境,如降低空气的相对湿度和温度,并通过植物叶片遮挡影响太阳辐射的射入[46],同时会加速蒸腾速率而相应地降低植物的温度[47]。在不同的生态系统中,水分利用效率对Ws的响应幅度可能不同,甚至可能有完全不同的方向。王云霓[48]在研究宁夏六盘山典型树种水分利用效率中发现华北落叶松(Larix principis-rupprechtii)个体的WUE与Ws是正相关关系(P > 0.05)。在本次研究中发现,庐山日本柳杉WUE与Ws显著负相关关系,特别是当年的1月份和12月份的风速(P < 0.01),对庐山日本柳杉WUE产生了重要的影响。风速越大,植物的蒸腾作用会越强,植物体周围的空气湿度会降低,促使了植物体内的水分更快散失到大气中,造成植物WUE下降。在不同的地区,风速对于植物的WUE影响是有所差异的。庐山自然保护区风速呈现下降的趋势,平均每10年下降0.37 m/s,是日本柳杉WUE年际变化重要的影响因素之一。
3.4 太阳辐射对日本柳杉水分利用效率的影响
太阳辐射是植物光合作用所必须的重要元素之一,对植物WUE的变化也会产生重要影响。如徐晓桃[49]研究黄河源区植被的水分利用效率时发现,黄河源区的植被WUE与Rs是正相关关系。王云霓[48]研究宁夏六盘山典型树种华北落叶松时也发现WUE与Rs呈正相关关系,并且通过了显著性检验(P < 0.01)。一般认为,光照越强,植物的水分利用越高。但庐山日本柳杉WUE在本研究中与Rs未产生显著影响,这与他们的结果不同。一方面可能是由于太阳辐射增加时,植物的光合速率增大,但同时植物的蒸腾也在增大,WUE的变化难以确定。作为碳水循环的综合衡量指标,无论是植物个体的WUE或者是整个生态系统WUE,WUE的变化都是由多个相互作用的物理和生物过程决定,各个气候因子对WUE的变化具有相互协同作用。在评价树木WUE变化对气候因子的响应时,各个气候因子之间综合协同对WUE产生的影响还需进一步探究。
4. 结 论
本研究表明,1969—2018年期间,庐山日本柳杉树轮δ13C值呈下降趋势,WUE变化呈显著升高趋势。温度和风速是影响庐山日本柳杉WUE变化的主要气候因子,WUE与温度具有显著正相关关系,与风速具有显著负相关关系,并且温度对庐山日本柳杉WUE具有一定的滞后影响。而降水、太阳辐射以及干旱指数(SPI、SPEI、WI)对庐山日本柳杉年际WUE的变化未产生显著影响。本研究结果可为在全球气候变化下对庐山日本柳杉生长产生的影响提供理论依据,并且有助于庐山日本柳杉碳汇能力的评估以及提升杉木林的经营管理水平,同时为该地区杉木林生态系统的维护提供理论指导。
-
图 3 目视解译与监督分类结果
A-1、B-1、C-1分别为典型样方A、B、C的航拍原始图像;A-2、B-2、C-2分别为典型样方A、B、C的目视解译结果;A-3、B-3、C-3分别为典型样方A、B、C的最大似然监督分类结果。A-1, B-1, C-1 represent original images of quadrat A, B and C, respectively; A-2, B-2, C-2 represent visual interpretation results of quadrat A, B and C, respectively; A-3, B-3, C-3 represent maximum likelihood supervised classification calculating results of quadrat A, B and C, respectively.
Figure 3. Results of visual interpretation and supervised classification
表 1 常见的可见光植被指数
Table 1 Common vegetation indices of visible bands
可见光植被指数
Visible vegetation index全称 Full name 计算公式 Equation 参考文献Reference NGRDI 归一化绿红差异指数
Normalized green-red difference index(G − R)/(G + R) [20] NGBDI 归一化绿蓝差异指数
Normalized green-blue difference index(G − B)/(G + B) [21] EXG 超绿指数
Excess green index2g − r − b [22] EXGR 超绿超红差异指数
Excess green minus excess red indexEXG − 1.4r − g [23] VEG 植被指数
Vegetation indexg/r0.67b0.33 [24] VDVI 可见光波段差异植被指数
Visible-band difference vegetation index(2G − R − B)/(2G + R + B) [11] RGRI 绿红比值指数
Red-green ratio indexR/G [25] BGRI 绿蓝比值指数
Blue-green ratio indexB/G [26] 注:G. 绿光通道;R. 红光通道;B. 蓝光通道;g. 绿光通道标准化结果;r. 红光标准化结果;b. 蓝光标准化结果;Notes: G, green channel; R, red channel; B, blue channel; g, standardization of green channel; r, standardization of red channel; b, standardization of blue channel; g = G/(G + R + B),r = R/(G + R + B),b = B/(G + R + B). 表 2 地物在红、绿、蓝波段及各可见光植被指数波段的像元值差异表
Table 2 Differences in pixel values in red, green, blue bands and vegetation indices of land cover
波段类型 Band type 植被 Vegetation 裸地 Bare land 均值 Mean 标准差 Standard deviation 均值 Mean 标准差 Standard deviation 红光波段像元值 Pixel value for red band 164.470 26.898 212.602 21.997 绿光波段像元值 Pixel value for green band 177.432 27.016 204.327 19.403 蓝光波段像元值 Pixel value for blue band 159.941 30.192 205.148 17.529 BGRI像元值 Pixel value for BGRI 0.900 0.083 1.006 0.042 EXG像元值 Pixel value for EXG 0.063 0.036 −0.015 0.006 EXGR像元值 Pixel value for EXGR −0.750 0.020 −0.821 0.013 NGBDI像元值 Pixel value for NGBDI 0.055 0.046 −0.003 0.020 NGRDI像元值 Pixel value for NGRDI 0.039 0.016 −0.019 0.015 RGRI像元值 Pixels value for RGRI 0.925 0.029 1.039 0.030 VDVI像元值 Pixel value for VDVI 0.046 0.026 −0.011 0.005 VEG像元值 Pixel value for VEG 1.093 0.045 0.973 0.009 表 3 4种可见光植被指数分类结果精度评估
Table 3 Accuracy evaluation of four kinds of vegetation indices of visible bands
% 项目 Item EXG EXGR NGRDI VDVI 监督分类
Supervised
classificationOtsu法
Otsu method双峰直方图法
Histogram methodOtsu法
Otsu method双峰直方图法
Histogram methodOtsu法
Otsu method双峰直方图法
Histogram methodOtsu法
Otsu method双峰直方图法
Histogram method样方A Quadrat A 93.53 95.41 91.80 93.55 88.35 90.14 91.12 95.86 98.93 样方B Quadrat B 61.61 75.89 62.82 83.57 64.31 90.33 61.40 90.98 96.39 样方C Quadrat C 91.27 92.86 85.82 85.87 78.81 81.30 92.22 92.89 96.80 均值 Mean 82.14 88.05 80.15 87.66 77.16 87.26 81.58 93.24 97.37 表 4 样方D精度评估表
Table 4 Accuracy evaluation of quadrat D
分类数据
Classification data双峰直方图法 Histogram method Otsu法 Otsu method 植被Vegetation 非植被
Non-vegetation行总和
Row total用户精度
User accuracy/%植被
Vegetation非植被
Non-vegetation行总和
Row total用户精度
User accuracy/%植被 Vegetation 516 240 25 318 541 558 95.32 385 202 11 971 397 173 96.99 非植被 Non-vegetation 84 415 747 313 831 728 89.85 215 453 760 660 976 113 77.93 列总和 Column total 600 655 772 631 1 373 286 600 655 772 631 1 373 286 生产者精度
Producer accuracy/%85.95 96.72 64.13 98.45 -
[1] 李登科, 范建忠, 王娟. 陕西省植被覆盖度变化特征及其成因[J]. 应用生态学报, 2010, 21(11):2896−2903. Li D K, Fan J Z, Wang J. Change characteristics and their causes of fractional vegetation coverage (FVC) in Shaanxi Province[J]. Chinese Journal of Applied Ecology, 2010, 21(11): 2896−2903.
[2] Chen B, Xu G, Coops N C, et al. Changes in vegetation photosynthetic activity trends across the Asia-Pacific region over the last three decades[J]. Remote Sensing of Environment, 2014, 144: 28−41. doi: 10.1016/j.rse.2013.12.018
[3] 韩文霆, 邵国敏, 马代健, 等. 大田玉米作物系数无人机多光谱遥感估算方法[J]. 农业机械学报, 2018, 49(7):134−143. doi: 10.6041/j.issn.1000-1298.2018.07.017 Han W T, Shao G M, Ma D J, et al. Estimating method of crop coefficient of maize based on UAV multispectral remote sensing[J]. Transactions of the Chinese Society for Agricultural Machinery, 2018, 49(7): 134−143. doi: 10.6041/j.issn.1000-1298.2018.07.017
[4] 虞连玉, 蔡焕杰, 姚付启, 等. 植被指数反演冬小麦植被覆盖度的适用性研究[J]. 农业机械学报, 2015, 46(1):231−239. doi: 10.6041/j.issn.1000-1298.2015.01.033 Yu L Y, Cai H J, Yao F Q, et al. Applicability of vegetation indices to estimate fractional vegetation coverage[J]. Transactions of the Chinese Society for Agricultural Machinery, 2015, 46(1): 231−239. doi: 10.6041/j.issn.1000-1298.2015.01.033
[5] 孙刚, 黄文江, 陈鹏飞, 等. 轻小型无人机多光谱遥感技术应用进展[J]. 农业机械学报, 2018, 49(3):1−17. doi: 10.6041/j.issn.1000-1298.2018.03.001 Sun G, Huang W J, Chen P F, et al. Advances in UAV based multispectral remote sensing applications[J]. Transactions of the Chinese Society for Agricultural Machinery, 2018, 49(3): 1−17. doi: 10.6041/j.issn.1000-1298.2018.03.001
[6] 郭铌. 植被指数及其研究进展[J]. 干旱气象, 2003, 21(4):71−75. Guo N. Vegetation index and its advances[J]. Arid Meteorology, 2003, 21(4): 71−75.
[7] 罗亚, 徐建华, 岳文泽, 等. 植被指数在城市绿地信息提取中的比较研究[J]. 遥感技术与应用, 2006, 21(3):212−219. doi: 10.3969/j.issn.1004-0323.2006.03.008 Luo Y, Xu J H, Yue W Z, et al. A comparative study of extracting urban vegetation information by vegetation indices from thematic mapper images[J]. Remote Sensing Technology and Application, 2006, 21(3): 212−219. doi: 10.3969/j.issn.1004-0323.2006.03.008
[8] Groten S M E. NDVI:crop monitoring and early yield assessment of Burkina Faso[J]. Title Remote Sensing, 1993, 14(8): 1495−1515. doi: 10.1080/01431169308953983
[9] Neigh C S R, Tucker C J, Townshend J R G. North American vegetation dynamics observed with multi-resolution satellite data[J]. Remote Sensing of Environment, 2008, 112(4): 1749−1772.
[10] Piao S, Nan H, Hunting F C, et al. Evidence for a weakening relationship between inter annual temperature variability and northern vegetation activity[J/OL]. Nature Communications, 2014, 5: 5018 [2019−09−13]. https://www.nature.com/articles/ncomms6018.
[11] 汪小钦, 王苗苗, 王绍强, 等. 基于可见光波段无人机遥感的植被信息提取[J]. 农业工程学报, 2015, 31(5):152−159. doi: 10.3969/j.issn.1002-6819.2015.05.022 Wang X Q, Wang M M, Wang S Q, et al. Extraction of vegetation information from visible unmanned aerial vehicle images[J]. Transactions of the Chinese Society of Agricultural Engineering (Transactions of the CSAE), 2015, 31(5): 152−159. doi: 10.3969/j.issn.1002-6819.2015.05.022
[12] 毛智慧, 邓磊, 贺英, 等. 利用色调—亮度彩色分量的可见光植被指数[J]. 中国图象图形学报, 2017, 22(11):1602−1610. Mao Z H, Deng L, He Y, et al. Vegetation index for visible-light true-color image using hue and lightness color channels[J]. Journal of Image and Graphics, 2017, 22(11): 1602−1610.
[13] 周勇兵, 朱永清. 基于可见光波段的城市航空影像植被提取[J]. 绿色科技, 2016(16):247−250. doi: 10.3969/j.issn.1674-9944.2016.16.097 Zhou Y B, Zhu Y Q. Vegetation extraction in urban aerial image on the basis of visible light wave[J]. Journal of Green Science and Technology, 2016(16): 247−250. doi: 10.3969/j.issn.1674-9944.2016.16.097
[14] 邓继忠, 任高生, 兰玉彬, 等. 基于可见光波段的无人机超低空遥感图像处理[J]. 华南农业大学学报, 2016, 37(6):16−22. doi: 10.7671/j.issn.1001-411X.2016.06.003 Deng J Z, Ren G S, Lan Y B, et al. Low altitude unmanned aerial vehicle remote sensing image processing based on visible band[J]. Journal of South China Agricultural University, 2016, 37(6): 16−22. doi: 10.7671/j.issn.1001-411X.2016.06.003
[15] 丁雷龙, 李强子, 杜鑫, 等. 基于无人机图像颜色指数的植被识别[J]. 国土资源遥感, 2016, 28(1):78−86. doi: 10.6046/gtzyyg.2017.01.12 Ding L L, Li Q Z, Du X, et al. Vegetation extraction method based on color indices from UAV images[J]. Remote Sensing for Land and Resources, 2016, 28(1): 78−86. doi: 10.6046/gtzyyg.2017.01.12
[16] 张正健, 李爱农, 边金虎, 等. 基于无人机影像可见光植被指数的若尔盖草地地上生物量估算研究[J]. 遥感技术与应用, 2016, 31(1):51−62. Zhang Z J, Li A N, Bian J H, et al. Estimating aboveground biomass of grassland in zoige by visible vegetation index derived from unmanned aerial vehicle image[J]. Remote Sensing Technology and Application, 2016, 31(1): 51−62.
[17] 赵静, 杨焕波, 兰玉彬, 等. 基于无人机可见光图像的夏季玉米植被覆盖度提取方法[J]. 农业机械学报, 2019, 50(5):232−240. doi: 10.6041/j.issn.1000-1298.2019.05.027 Zhao J, Yang H B, Lan Y B, et al. Extraction method of summer corn vegetation coverage based on visible light image of unmanned aerial vehicle[J]. Transactions of the Chinese Society for Agricultural Machinery, 2019, 50(5): 232−240. doi: 10.6041/j.issn.1000-1298.2019.05.027
[18] 张泽民, 吕昌河, 谢苗苗, 等. 基于WorldView 2影像的矿区植被重建效果评估[J]. 生态学报, 2018, 38(4):1301−1310. Zhang Z M, Lü C H, Xie M M, et al. Evaluation of vegetation restoration effects in mining areas based on WorldView 2 images[J]. Acta Ecologica Sinica, 2018, 38(4): 1301−1310.
[19] 赵廷宁, 张玉秀, 曹兵, 等. 西北干旱荒漠区煤炭基地生态安全保障技术[J]. 水土保持学报, 2018, 32(1):1−5. Zhao T N, Zhang Y X, Cao B, et al. Eco-security technology for coal mining bases in the northwestern arid desert regions in China[J]. Journal of Soil and Water Conservation, 2018, 32(1): 1−5.
[20] Gitelson A A, Kaufman Y J, Stark R, et al. Novel algorithms for remote estimation of vegetation fraction[J]. Remote Sensing of Environment, 2002, 80(1): 76−87. doi: 10.1016/S0034-4257(01)00289-9
[21] Hunt E R, Cavigelli M, Daughtry C S T, et al. Evaluation of digital photography from model aircraft for remote sensing of crop biomass and nitrogen status[J]. Precision Agriculture, 2005, 6(4): 359−378. doi: 10.1007/s11119-005-2324-5
[22] Woebbecke D M, Meyer G E, Von Bargen K, et al. Color indices for weed identification under various soil, residue, and lighting conditions[J]. Transactions of the ASAE, 1995, 38(1): 259−269. doi: 10.13031/2013.27838
[23] 孙国祥, 汪小旵, 闫婷婷, 等. 基于机器视觉的植物群体生长参数反演方法[J]. 农业工程学报, 2014, 30(20):187−195. doi: 10.3969/j.issn.1002-6819.2014.20.023 Sun G X, Wang X C, Yan T T, et al. Inversion method of flora growth parameters based on machine vision[J]. Transactions of the Chinese Society of Agricultural Engineering (Transactions of the CSAE), 2014, 30(20): 187−195. doi: 10.3969/j.issn.1002-6819.2014.20.023
[24] Hague T, Tillett N D, Wheeler H. Automated crop and weed monitoring in widely spaced cereals[J]. Precision Agriculture, 2006, 7(1): 21−32. doi: 10.1007/s11119-005-6787-1
[25] Verrelst J, Schaepman M E, Koetz B, et al. Angular sensitivity analysis of vegetation indices derived from CHRIS/PROBA data[J]. Remote Sensing of Environment, 2008, 112(5): 2341−2353. doi: 10.1016/j.rse.2007.11.001
[26] Sellaro R, Crepy M, Trupkin S A, et al. Cryptochrome as a sensor of the blue/green ratio of natural radiation in Arabidopsis[J]. Plant Physiology, 2010, 154(1): 401−409. doi: 10.1104/pp.110.160820
[27] Otsu N. A threshold selection method from gray-level histograms[J]. IEEE Transactions on Systems, Man, and Cybernetics, 1979, 9(1): 62−66. doi: 10.1109/TSMC.1979.4310076
[28] 李了了, 邓善熙, 丁兴号. 基于大津法的图像分块二值化算法[J]. 微计算机信息, 2005, 21(24):76−77. doi: 10.3969/j.issn.1008-0570.2005.24.027 Li L L, Deng S X, Ding X H. Binarization algorithm based on image partition derived from Da-jin Method[J]. Control and Automation, 2005, 21(24): 76−77. doi: 10.3969/j.issn.1008-0570.2005.24.027
[29] 闫利, 莫楠, 费亮, 等. 倾斜影像整体变分模型阴影检测算法改进[J]. 遥感信息, 2017, 32(2):54−59. doi: 10.3969/j.issn.1000-3177.2017.02.009 Yan L, Mo N, Fei L, et al. Improved shadow detection algorithm based on total variation model using oblique images[J]. Remote Sensing Information, 2017, 32(2): 54−59. doi: 10.3969/j.issn.1000-3177.2017.02.009
[30] 卞雪, 马群宇, 刘楚烨, 等. 基于低空可见光谱的植被覆盖率计算[J]. 水土保持通报, 2017, 37(5):270−275. Bian X, Ma Q Y, Liu C Y, et al. Vegetation coverage calculation based on low altitude visible spectrum[J]. Bulletin of Soil and Water Conservation, 2017, 37(5): 270−275.
[31] 朱孟, 周忠发, 赵馨, 等. 基于无人机遥感的喀斯特高原峡谷区火龙果单株识别提取方法[J]. 热带地理, 2019, 39(4):502−511. Zhu M, Zhou Z F, Zhao X, et al. Recognition and extraction method of single dragon fruit plant in plateau-canyon areas based on UAV remote sensing[J]. Tropical Geography, 2019, 39(4): 502−511.
[32] 郭鹏, 武法东, 戴建国, 等. 基于无人机可见光影像的农田作物分类方法比较[J]. 农业工程学报, 2017, 33(13):112−119. doi: 10.11975/j.issn.1002-6819.2017.13.015 Guo P, Wu F D, Dai J G, et al. Comparison of farmland crop classification methods based on visible light images of unmanned aerial vehicles[J]. Transactions of the Chinese Society of Agricultural Engineering, 2017, 33(13): 112−119. doi: 10.11975/j.issn.1002-6819.2017.13.015
[33] 李莹, 于海洋, 王燕, 等. 基于无人机重建点云与影像的城市植被分类[J]. 国土资源遥感, 2019, 31(1):149−155. doi: 10.6046/gtzyyg.2019.01.20 Li Y, Yu H Y, Wang Y, et al. Classification of urban vegetation based on unmanned aerial vehicle reconstruction point cloud and image[J]. Remote Sensing for Land and Resources, 2019, 31(1): 149−155. doi: 10.6046/gtzyyg.2019.01.20
[34] 郭震冬, 顾正东, 许盛, 等. 利用无人机技术进行社区植被覆盖率调查[J]. 北京测绘, 2017(5):88−91. Guo Z D, Gu Z D, Xu S, et al. The design and function development of the rural land ownership data processing software[J]. Beijing Surveying and Mapping, 2017(5): 88−91.
-
期刊类型引用(3)
1. 陈彩云. 天然染料在鲜茧丝染色中的应用. 轻纺工业与技术. 2023(02): 145-147 .  百度学术
百度学术
2. 杨雨桐,张卿硕,符韵林,孙静. 巴里黄檀心材色素的提取及其抑菌活性. 东北林业大学学报. 2020(10): 100-103+119 .  百度学术
百度学术
3. 王敬贤. 木材染色技术研究进展. 林业科技. 2020(06): 42-47 .  百度学术
百度学术
其他类型引用(4)


 下载:
下载:


