Wind resistance of 25 landscape tree species in coastal area of Shanghai
-
摘要:目的 台风是我国东部沿海地区的主要气象灾害之一,近年来气候变化引发的风害发生的频度和成灾强度有不断上升的趋势,加强园林树种的抗风性研究直接关乎城市绿地体系的生态稳定性。方法 本文通过对上海常见的25种园林树种的静态拉力实验、树木形态稳定性评价、树木木材测试以及土壤紧实度测量,综合评价了各树种的抗风性特征。结果 实验结果显示,各树种的抗拉力矩与抗拉角度呈对数函数关系;稳定性指数随着树木高度、冠高比、树冠不对称性指标的上升而减小;树木树芯的抗压强度与抗压弯度呈线性关系。结论 将25种受试树种大致分为两大类:一类是以广玉兰、梧桐、金丝楸、枫香为中心的静态拉力较大、弯曲角度较小的刚性树种,另一类是以银杏为中心的静态拉力较小、弯曲角度较大的韧性树种。Abstract:Objective Typhoon is one of the main meteorological disasters in the east coast of China. The frequency and intensity of wind damage caused by climate change have been increasing in recent years. The study on wind resistance of landscape tree species is directly related to the ecological stability of urban green space system.Method The comprehensive evaluation was taken for the wind resistance of 25 tree species by the static tension test, morphological stability evaluation, timber property determination and soil compactness measurement.Result There was a logarithmic function relationship between the tensile torque and the tensile angle of each species; the stability index decreased with the increase of tree height, crown width/crown height, canopy size and asymmetry; there was a linear relationship between the compressive strength and the bending strength of tree cores.Conclusion Finally, 25 species were categorized into two groups: the first was a rigid tree with a large static tension and a small bending angle like Magnolia grandiflora, Firmiana simplex, Catalpa bungei ‘Jinsi’ and Liquidambar formosana. Another group was toughness trees with small static tension and large bending angle like Ginkgo biloba.
-
Keywords:
- wind resistance /
- landscape plant /
- tree species selection /
- climate change
-
削度方程是指描述树干直径随着树高的增加而不断变化的方程,用以描述树干形状,故也称为干曲线方程。一般是利用树木胸径、树高、截面高等易测量的林木特征因子作为自变量预测截面直径的多元线性或非线性回归方程[1]。削度方程可以准确预测树干任意高度处的直径,是现代森林清查和林业管理体系的重要工具[2],被广泛用于估算树干上部直径、计算商品材积和出材率,以及重建树干轮廓等研究中。
国外关于林木干形与削度模型的研究略早于国内,最早的干曲线概念由Kunze提出[3]。之后,削度模型不断发展,根据模型的研究方法,可以分为简单模型、分段模型[4]和可变指数模型。根据是否与材积相容,可分为一致性削度方程和非一致性削度方程。近年来,为了解决单木的自相关,又提出了混合效应模型和多元参数回归模型[5-9]。在不同形式方程的参数估计时,最常用的方法是最小二乘法(OLS)[10]。该方法是基于期望条件下的回归,需要严格的统计学假设条件,数据分布需要满足独立、正态和等方差,而树木生长具有连续性和相关性,难以满足这些要求[11]。另一方面,平均回归估计只能描述因变量的条件均值或中心效应,不能描述非中心条件下的数据结构[12]。
分位数回归是一种利用条件变量来构建模型的方法,可以选取多个分位点对数据结构进行分析,自1978年由Koenker等人提出以来就得到迅速的推广和发展[11]。该方法对研究数据的分布没有严格要求,而且几乎不受异常点的影响,对数据的拟合更为稳健,这对降低由于林木生长异常或数据测量失误等带来的误差具有重要意义。此外,分位数回归不仅可以描述均值条件下自变量与因变量的回归关系,还可以给出响应变量的完整条件分布[13-14],相较非线性回归更为灵活全面。近年来分位数回归开始应用到林业的研究中,如高慧淋等[15]分别基于分位数回归法、最小二乘法和最大似然法建立了长白落叶松(Larix olgensis)人工林最大密度线模型,发现分位数回归模型的参数估计结果更为稳定;赵梦草等[16]基于分位数回归研究针阔混交林中树高、胸径和活枝高的相关关系,分别构建了一元和二元线性分位数回归模型;张冬燕等[17]基于非线性分位数回归构建了混交林中树高预测模型,发现非线性分位数回归预测模型的精度更高。
杉木(Cunninghamia lanceolata)是我国南方主要的用材树种,具有速生优质的特性,建立精确的削度方程对杉木干形预测和材积计算具有重要意义。目前,已有利用分位数回归模拟樟子松(Pinus sylvestris)和落叶松(Larix spp.)干形的研究[10, 12, 18],但基于分位数回归估测杉木树干削度尚未见报道。本文以杉木为对象,选取4个具有不同参数个数的可变指数削度方程,基于5折交叉验证,采用分位数回归法构建不同分位点的杉木可变指数削度方程,并与非线性回归结果进行比较分析,为杉木干形的精确预测提供参考。
1. 材料与方法
1.1 数 据
本研究的杉木解析木数据来源于福建省将乐国有林场(117°05′ ~ 117°40′E,26°26′ ~ 27°04′N)。年均温度20 ℃左右,年均降水量约2 700 mm,气候温暖湿润,雨热同期,海拔约400 ~ 800 m,土壤肥沃深厚,主要树种组成有:杉木、马尾松(Pinus massoniana)、毛竹(Phyllostachys edulis
)等。 研究所用的杉木干形数据来自将乐国有林场不同年龄和不同林分的杉木人工林。伐倒样木前,测量树高(H)和胸径(D),按1 m区分段截取圆盘,不足1 m的区分段作为梢头。同时,在树干基部0.01 m和胸径1.3 m处也分别截取圆盘,然后测量每个圆盘东西、南北两个方向的直径,计算平均值作为对应高度处的直径。共计793组干形数据,样木的各调查因子统计情况见表1。
表 1 杉木调查因子统计表Table 1. Basic statistic information of sample trees项目 Item 最小值 Min. 最大值 Max. 平均值 Mean 中位数 Median 标准差 SD 变异系数 CV 树干直径 Stem diameter (di)/cm 0.96 54.00 11.81 11.43 5.987 4.490 树干高 Height along stem (hi)/m 0.0 25.0 8.0 7.0 5.980 3.141 胸径 DBH (D)/cm 4.90 28.40 17.23 17.12 5.003 1.365 树高 Tree height (H)/m 4.1 25.5 17.3 18.2 5.980 1.236 1.2 方 法
1.2.1 基础模型的选择
相较于简单削度方程和分段削度方程,可变指数方程的拟合精度更高[19],可以较精准地描述不同树干干形和同一林木不同高度的干形变化,是未来的发展方向[20]。根据前人研究选择4个具有不同参数个数、较适宜描述杉木干形的可变指数削度方程作为基础模型[1, 3, 21],方程的形式如下:
diD=(H−hiH−1.3)(b1+b2)(hiH)14+b3(hiH)12+b4(hiH) (1) di=D(b1+b2log(1−hiH)13)(1−e−b1b2) (2) di=b1Db2(1−hiH)b3(hiH)2+b4hiH+b5 (3) di=b1D(H−hi)b3Hb4 (4) 式中:di为树干直径,hi为树干高,D为胸径,H为树高;b1、b2、b3、b4、b5为参数。
1.2.2 分位数回归
分位数回归相当于将传统回归方法与条件分位数相结合,通过拟合任意分位点的数据,构建多个回归模型,从而描述完全条件分布下自变量与因变量之间的关系。其原理是把损失函数从传统的最小二乘法变成加权的最小二乘法,通过最小化加权离差的绝对值之和来获得方程参数。
QT=1n(∑i:Yi⩾ (5) 式中:QT为损失函数,n为样本数量,T为不同分位点,Yi为不同分位点的估计值,xi为实测值,
{\varepsilon _T} 是分位点为T时的观测值,{\hat f} ({x_i}) 是函数表达式。参数估计使损失函数QT最小,是基于非对称形式的绝对值残差最小化,给不同的Yi值不同的权重,T在0 ~ 1之间内任意取值,模型的参数随着T值的变化而变化。
当取分位点T = t时,权重分别是t和1−t,通过最小化分位数函数QT获得模型的参数,就可以得到该条件下的分位数模型。在不同的分位点下,得到QT函数的参数估计量不同,从而可以得到任意条件下的回归参数。由于分位数回归的损失函数采用加权的绝对离差思想,能有效克服最小二乘回归估计易受异常数据干扰的缺点,得到的回归估计更加稳健。
K折交叉验证是将所有数据分割成K个子样本,不重复的选取其中一个子样本作为测试集,其他K−1个样本用来训练。共重复K次,平均K次的结果作为最终的模型评价指标。使用K折交叉验证可以防止建模样本和检验样本选择不佳而导致模型的精度偏低,而且能够从同样的样本数据中尽可能获得更多的信息。
本文采用的是5折交叉验证。针对每个削度方程,用R 4.0.0的quantile包的nlrq()分别建立分位点为0.1、0.3、0.5、0.7和0.9的5个非线性分位数回归模型,用R4.0.0语言的nls()函数建立非线性回归模型,同时,对传统非线性回归采用自相关函数CAR(2)来消除自相关性。
1.2.3 模型的评价指标
本研究选择的模型评价指标是平均误差(ME)、调整后决定系数(R2)、均方根误差(RMSE)、相对误差(RE)和平均绝对误差(MAE)。具体计算公式:
{\rm{ME}} = \frac{{\displaystyle \sum\limits_{i = 1}^n {\left( {{y_i} - {{{\hat y} }_i}} \right)} }}{n} (6) {\rm{RMSE}} = \sqrt {\frac{{\displaystyle \sum\limits_{i = 1}^n {{{\left( {{y_i} - {{{\hat y} }_i}} \right)}^2}} }}{{ {n - m} }}} (7) {\rm{RE}} = \sum\limits_{i = 1}^n {\left| {\frac{{{y_i} - {{{\hat y} }_i}}}{{{{\bar y}_i}}}} \right|} \times 100 (8) {\rm{MAE}} = \frac{{\displaystyle \sum\limits_{i = 1}^n {\left| {{y_i} - {{{\hat y} }_i}} \right|} }}{n} (9) {R^2} = 1 - \frac{{\displaystyle \sum\limits_{i = 1}^n {{{\left( {{y_i} - {{{\hat y} }_i}} \right)}^2}} }}{{\displaystyle \sum\limits_{i = 1}^n {{{\left( {{y_i} - {{\bar y}_i}} \right)}^2}} }} \times \frac{{n - 1}}{{n - m}} (10) 式中:n为样本数,m为参数个数,yi为不同树高处直径的实测值,
\hat y 为预测值,{{\bar y}_i} 为观测值的均值。2. 结果与分析
2.1 非线性与分位数回归的参数估计
分别采用非线性回归和分位数回归构建杉木的削度方程,每个削度方程选取5个不同的分位点(t = 0.1,0.3,0.5,0.7,0.9)进行拟合,结果见表2。分位数回归选用不同的分位点时,各削度方程的参数均有所变动,会产生不同的估计结果;各削度方程参数的变动程度不同,没有表现出特定的规律;非线性回归参数均在分位数回归参数的变动范围内,说明分位数回归可以主观地选取任意分位值对数据进行拟合,所得到的回归模型会随着分位点的不同而产生不同的拟合结果,其稳健性要优于非线性回归。
2.2 模型拟合结果评价
根据表2所建立的削度方程,计算各方程的调整后决定系数(R2)、平均绝对误差(MAE)、均方根误差(RMSE)、相对误差(RE)和平均误差(ME)5个模型评价指标,比较分位数回归与非线性回归的拟合结果(表3)。可以看出,无论是采用非线性回归还是分位数回归,其R2均在0.90以上,RMSE在1 cm左右,说明这4个削度方程都能较好地描述杉木干形。比较不同分位点的拟合结果可以看出,不同分位点的拟合精度不同;4个削度方程都是分位点为0.5的拟合精度最高;中位数回归与非线性回归的拟合结果相近。其中,模型M1、模型M3和模型M4的拟合精度高于非线性回归,R2分别增加了0.03、0.02和0.04,RMSE分别降低了19.2%、1.36%和8.00%,其余模型评价指标MAE、RE和ME也比非线性回归模型更小。
表 3 基于非线性回归与分位数回归的各削度方程的拟合结果Table 3. Fit-goodness statistics of taper functions based on nonlinear regression and quantile regression模型 Model 建模方法 Modeling method 分位点 Quantile 模型的评价指标 Evaluation index of the model R2 MAE/cm RMSE/cm RE ME/cm M1 非线性回归 Nonlinear regression 0.972 0.635 0.990 3 379.627 0.018 分位数回归 Quantile regression 0.1 0.940 0.953 1.427 5 076.793 0.843 0.3 0.960 0.699 1.122 4 391.152 0.192 0.5 0.975 0.627 0.801 3 337.980 −0.017 0.7 0.970 0.702 1.067 3 738.042 −0.310 0.9 0.930 1.089 1.542 5 799.579 −0.922 0.960 0.830 1.172 4 421.905 0.016 M2 非线性回归 Nonlinear regression 0.971 0.704 1.022 3 749.541 0.017 分位数回归 Quantile regression 0.1 0.920 1.329 1.742 7 076.160 1.263 0.3 0.950 0.932 1.303 4 961.605 0.629 0.5 0.968 0.825 1.180 4 395.446 −0.012 0.7 0.950 0.940 1.320 5 003.610 −0.423 0.9 0.900 1.473 1.877 7 844.500 −1.292 M3 非线性回归 Nonlinear regression 0.972 0.731 1.090 3 892.878 0.032 分位数回归 Quantile regression 0.1 0.940 1.062 1.484 5 656.519 0.999 0.3 0.960 0.764 1.179 4 070.373 0.525 0.5 0.974 0.626 1.008 3 397.303 −0.013 0.7 0.970 0.785 1.102 4 182.318 −0.350 0.9 0.920 0.309 1.685 6 969.442 −1.180 M4 非线性回归 Nonlinear regression 0.975 0.734 1.022 3 949.541 0.170 分位数回归 Quantile regression 0.1 0.940 0.953 1.472 5 076.793 0.843 0.3 0.960 0.726 1.137 3 867.362 0.345 0.5 0.979 0.710 1.003 3 781.487 −0.017 0.7 0.960 0.800 1.165 4 259.591 −0.267 0.9 0.920 1.141 1.664 7 513.007 −1.184 表 2 非线性回归与分位数回归对各削度方程的参数估计结果Table 2. Parameter estimates of taper function based on nonlinear regression and quantile regression模型 Model 建模方法 Modeling method 分位点 Quantile 模型参数 Parameters of model b1 b2 b3 b4 b5 M1 非线性回归 Nonlinear regression 0.783 3 −3.151 0 1.841 7 1.158 8 分位数回归 Quantile regression 0.1 −0.181 2 −0.500 4 0.231 5 1.194 4 0.3 0.623 3 −2.716 6 1.659 8 1.155 7 0.5 0.788 4 −3.388 2 2.068 0 1.191 0 0.7 1.533 0 −5.229 0 3.185 1 1.143 0 0.9 1.947 9 −6.171 4 3.604 2 1.149 8 M2 非线性回归 Nonlinear regression 2.899 0 6.165 0 分位数回归 Quantile regression 0.1 3.024 9 7.133 1 0.3 2.868 6 6.263 2 0.5 2.817 7 5.880 6 0.7 2.769 8 5.519 8 0.9 2.901 9 5.677 5 M3 非线性回归 Nonlinear regression 1.446 6 0.914 6 1.182 4 −1.770 1 1.306 2 分位数回归 Quantile regression 0.1 1.353 6 0.918 7 1.109 7 −1.422 7 1.188 5 0.3 1.312 0 0.929 5 0.766 2 −0.963 6 0.974 8 0.5 1.366 9 0.920 3 0.918 1 −1.223 2 1.029 3 0.7 1.440 5 0.921 0 1.359 8 −1.960 8 1.317 8 0.9 1.516 5 0.925 0 1.179 5 −2.099 3 1.482 4 M4 非线性回归 Nonlinear regression 1.390 6 0.636 9 −0.727 4 分位数回归 Quantile regression 0.1 1.331 0 0.754 1 −0.836 5 0.3 1.294 7 0.677 3 −0.749 8 0.5 1.293 5 0.629 2 −0.700 0 0.7 1.323 9 0.574 5 −0.651 2 0.9 1.598 4 0.565 1 −0.684 9 注:M1、M2、M3和M4分别代表文中的公式(1)、公式(2)、公式(3)和公式(4)。下同。Notes: M1, M2, M3 and M4 represent formula (1), formula (2), formula (3) and formula (4), respectively. The same below. 2.3 不同分位数回归的杉木干形模拟
图1表示不同分位点回归模型对杉木干形的拟合结果,可以看出不同分位点下的树高和对应直径的关系有明显的独立趋势。基于不同分位点的曲线具有不同的形状,可以拟合的数据范围更广泛,无论是均值条件下的数据还是边缘数据,利用分位数回归方法都能进行拟合。分位数回归能更全面地描述杉木干形的变化,包含的信息也更为丰富,选取不同分位点能对整体的干形数据进行拟合,从而分析数据的整体结构。
2.4 模型检验
基于5折交叉验证对各削度方程的预测能力进行检验,比较非线性回归模型和中位数回归模型的预测精度,结果见表4。从表4可以看出,基于中位数回归构建的削度方程M1、M2和M3的预测精度高于非线性回归,其MAE分别降低了75.23%、75.12%和16.9%,R2分别增加了0.03、0.05和0.09,其他模型评价指标RMSE、RE和ME也表现优于非线性回归。对于削度方程M4,虽然中位数回归的RMSE比非线性回归略大,但是其MAE、RE和ME分别比非线性回归减少11.44%、2.80%和45.16%。总体来看,中位数回归的预测精度高于非线性回归的预测精度。
表 4 非线性回归模型与中位数回归模型的预测精度检验Table 4. Prediction statistics of nonlinear regression models and median regression models模型
Model非线性回归模型预测精度检验
Prediction statistics of non-linear regression中位数回归模型预测精度检验
Prediction statistics of median regressionR2 MAE/cm RMSE/cm RE ME/cm R2 MAE/cm RMSE/cm RE ME/cm M1 0.972 0.638 0.994 850.911 0.017 0.975 0.158 0.801 797.121 0.007 M2 0.961 0.832 1.180 1109.960 0.088 0.966 0.207 1.155 960.196 0.612 M3 0.970 0.177 1.028 945.102 0.015 0.979 0.174 1.031 926.861 0.011 M4 0.966 0.201 1.095 978.018 0.031 0.966 0.178 1.100 950.730 0.017 为了分析中位数回归与非线性回归对树干不同位置的预测能力,分别计算非线性回归模型和中位数回归模型在不同树干部位的平均绝对误差(MAE),结果见图2。各模型对树干中部(相对高度在0.1 ~ 0.7)的预测精度较高,而对树干基部(相对高度为0 ~ 0.1)和树干上部(相对高度为0.8 ~ 1.0)的预测效果稍差。对树干的绝大部分部位,中位数回归得到的平均绝对误差(MAE)小于非线性回归,且4个削度方程均有此表现,说明中位数回归对杉木干形的预测精度更高。
2.5 分位数回归模型应用
为了直观地检验中位数回归法对杉木树干不同部位的预测能力,利用上文建立的削度方程对杉木干形进行预测,结果见图3。可见,基于中位数回归法建立的4个可变指数削度方程对杉木干形均有较好的预测表现,预测值均匀地落在实测值的中部。削度方程M2对树干基部的预测效果偏差,削度方程M1、M3和M4的预测结果相近,但M1的预测值更为集中,说明M1方程更为稳健。
进一步分析不同分位点模型对树干不同部位的预测能力,以削度方程M1为例,计算各分位点模型的平均绝对误差(MAE),结果见图4。随着树干位置的变化,不同分位点模型对直径的预测精度不同,分位点0.7的削度方程对相对树高为0.9的位置处预测精度最高;分位点为0.9时则对相对树高1.0位置处的预测精度最高,其平均绝对误差(MAE)都小于1.0 cm;基于分位点0.3构建的削度方程对树干基部(相对树高为0 ~ 0.1)的预测精度最高,其平均绝对误差(MAE)约为0.75 cm;而基于分位点0.5构建的削度方程对树干绝大部分的预测精度更高。
3. 讨论与结论
3.1 讨 论
削度方程在编制材种出材率、木材交易方面具有广泛的实用价值,过去对杉木削度方程的研究多基于传统线性或非线性回归[22-25]。为了提高杉木干形的预测精度,同时避免数据的分布不满足非线性回归的假设条件,本研究引入了分位数回归法构建杉木的削度方程。本研究发现,当分位点为0.5时,分位数回归模型的拟合精度和预测精度最高, R2在0.96 ~ 0.97之间,这与辛士冬等[26]的研究结果一致。
基于多个分位点构建的杉木削度模型,既能够描述均值条件下干形数据的分布结构,也能够描述任意分位点树干高度与对应直径的关系。不同的分位条件下,树干高度和对应直径的关系有明显的独立趋势,不同分位点模型对树干不同位置的预测精度有所差别,说明分位数回归模型更具灵活性,付立华等[18]基于分位数回归对华北落叶松(Larix principis-rupprechtii)树干曲线的研究也有类似结论。本文的研究结果表明,分位点为0.9的模型更适宜描述梢头部分干形,分位点为0.3的模型则更适宜描述树干基部干形。由于传统回归对干形基部和梢头的拟合精度往往偏低[4],分位数回归可以通过构建不同分位点的回归模型,提高对树干不同位置的预测精度。
3.2 结 论
本文构建的分位点为0.1、0.3、0.5、0.7和0.9的模型,每个分位点都具有丰富的信息,能够全面地描述杉木树干削度的变化,预测多个分位水平下杉木树干的直径。整体来看,基于不同分位点构建的4个杉木可变指数削度方程均能收敛,其R2在0.9以上,都能较好地描述杉木干形。对本研究选取的4个可变指数削度方程来说,大部分方程基于中位数回归的拟合精度和预测精度高于非线性回归。基于中位数回归构建的削度方程,其稳健性优于非线性回归,而且不同分位点模型对树干不同位置的预测精度不同,通过构建不同分位点的削度模型,可以提高干形的预测精度。对于研究区的杉木来说,基于削度方程M1建立多分位点回归模型能更准确地估测其干形。
-
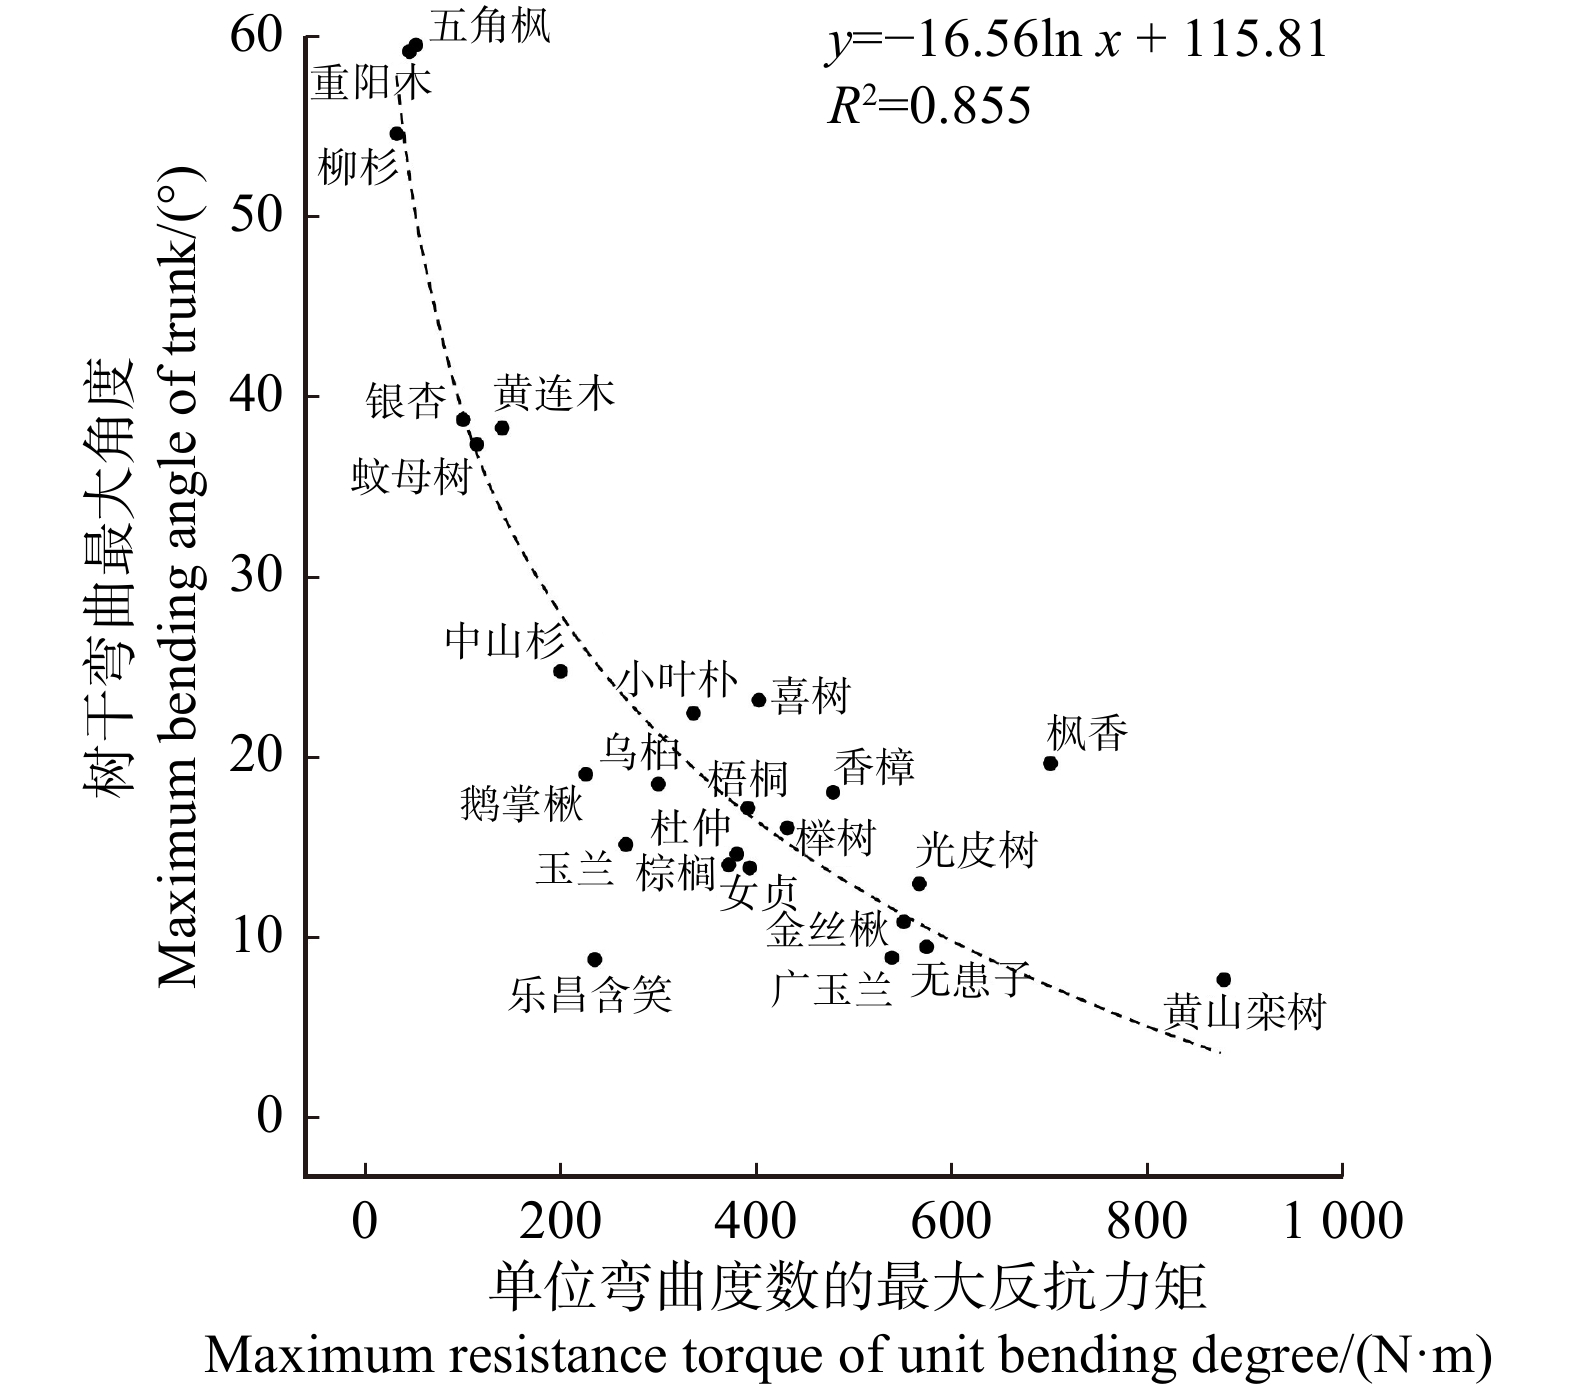
图 2 25种树种的最大反抗力矩与弯曲最大角度的关系
柳杉 Cryptomeria japonica var. sinensis,乐昌含笑 Michelia chapensis,香樟 Cinnamomum camphora,广玉兰 Magnolia grandiflora,女贞 Ligustrum lucidum,蚊母树 Distylium racemosum,棕榈 Trachycarpus fortunei,小叶朴 Celtis bungeana,榉树 Zelkova serrata,枫香Liquidambar formosana,中山杉 Taxodium ‘Zhongshanshan’,光皮树 Cornus wilsoniana,五角枫Acer pictum subsp. mono,乌桕 Sapium sebifera,黄连木 Pistacia chinensis,梧桐 Firmiana simplex,喜树 Camptotheca acuminata,银杏 Ginkgo biloba,无患子 Sapindus saponaria,黄山栾树 Koelreuteria paniculata ‘Integrifoliola’,金丝楸 Catalpa bungei ‘Jinsi’,杜仲 Eucommia ulmoides,鹅掌楸 Liriodendron chinense,玉兰 Yulania denudata,重阳木 Bischofia polycarpa. 下同 The same below
Figure 2. A logarithmic function relationship between the maximum resistance bending moment and bending angle of 25 tree species
表 1 25种实验树种的形态指标
Table 1 Shape indices of 25 selected tree species
序号
No.树种
Tree species树高
Tree height/m胸径
DBH/cm冠幅
Crown width/m冠高
Crown height/m冠高比
Crown width/
crown height1 杜仲 Eucommia ulmoides 5.65 ± 1.34 9.25 ± 1.20 2.65 ± 0.21 3.90 ± 1.56 0.68 ± 0.11 2 枫香 Liquidambar formosana 9.55 ± 0.07 11.4 ± 0.57 5.00 ± 0.71 6.90 ± 0.00 0.72 ± 0.01 3 光皮树 Cornus wilsoniana 8.50 ± 1.13 9.65 ± 2.33 4.00 ± 0.71 7.20 ± 1.13 0.85 ± 0.02 4 广玉兰 Magnolia grandiflora 7.05 ± 0.92 11.00 ± 0.00 5.05 ± 0.07 5.85 ± 0.92 0.83 ± 0.02 5 黄连木 Pistacia chinensis 8.10 ± 2.12 8.65 ± 0.21 4.60 ± 0.14 4.75 ± 0.92 0.59 ± 0.04 6 金丝楸 Catalpa bungei ‘Jinsi’ 9.35 ± 0.21 11.50 ± 0.14 5.20 ± 0.99 7.25 ± 0.21 0.78 ± 0.01 7 榉树 Zelkova serrata 10.30 ± 0.71 10.10 ± 0.42 4.00 ± 0.71 8.45 ± 0.35 0.82 ± 0.02 8 乐昌含笑 Michelia chapensis 5.20 ± 0.00 11.75 ± 1.91 3.60 ± 0.28 3.80 ± 0.14 0.73 ± 0.03 9 柳杉 Cryptomeria japonica var. sinensis 3.90 ± 0.71 10.00 ± 0.00 1.90 ± 0.28 2.95 ± 1.06 0.74 ± 0.14 10 黄山栾树 Koelreuteria paniculata ‘Integrifoliola’ 9.15 ± 0.49 12.50 ± 0.85 4.35 ± 0.07 5.90 ± 0.57 0.64 ± 0.03 11 鹅掌楸 Liriodendron chinense 8.55 ± 0.92 9.65 ± 0.92 3.70 ± 0.42 7.05 ± 0.64 0.83 ± 0.01 12 女贞 Ligustrum lucidum 5.45 ± 0.35 9.35 ± 0.07 2.85 ± 0.49 4.30 ± 0.28 0.79 ± 0.00 13 梧桐 Firmiana simplex 12.00 ± 4.10 11.10 ± 1.98 5.00 ± 1.13 8.65 ± 4.74 0.69 ± 0.16 14 蚊母树 Distylium racemosum 5.05 ± 1.06 9.25 ± 0.07 4.50 ± 0.14 3.40 ± 0.99 0.67 ± 0.06 15 乌桕 Sapium sebifera 10.10 ± 0.42 11.05 ± 0.49 4.70 ± 0.14 5.10 ± 0.57 0.50 ± 0.03 16 无患子 Sapindus saponaria 6.85 ± 1.48 11.20 ± 2.26 5.90 ± 0.14 5.75 ± 1.48 0.84 ± 0.04 17 五角枫 Acer pictum subsp. mono 5.05 ± 0.21 9.65 ± 1.16 3.20 ± 0.85 3.85 ± 0.07 0.76 ± 0.02 18 喜树 Camptotheca acuminata 8.50 ± 0.14 9.90 ± 1.27 3.50 ± 0.57 4.85 ± 0.49 0.57 ± 0.05 19 香樟 Cinnamomum camphora 7.90 ± 0.28 12.50 ± 1.41 4.70 ± 0.28 5.65 ± 0.07 0.72 ± 0.03 20 小叶朴 Celtis bungeana 7.00 ± 0.57 10.65 ± 0.49 4.10 ± 0.00 4.80 ± 0.14 0.69 ± 0.04 21 银杏 Ginkgo biloba 7.30 ± 2.12 9.20 ± 1.13 3.40 ± 0.42 4.75 ± 2.05 0.64 ± 0.10 22 玉兰 Yulania denudata 8.15 ± 4.88 8.30 ± 0.00 3.45 ± 0.07 6.15 ± 3.46 0.76 ± 0.03 23 中山杉 Taxodium ‘Zhongshanshan’ 9.70 ± 1.27 12.20 ± 0.57 3.35 ± 0.35 7.65 ± 0.78 0.79 ± 0.02 24 重阳木 Bischofia polycarpa 4.85 ± 0.21 9.65 ± 0.35 3.15 ± 0.21 2.75 ± 0.21 0.57 ± 0.07 25 棕榈 Trachycarpus fortunei 2.65 ± 0.78 13.75 ± 3.75 1.50 ± 0.00 1.00 ± 0.00 0.40 ± 0.12 总计 Total 7.43 ± 2.51 10.53 ± 1.21 3.89 ± 1.09 5.31 ± 2.11 0.70 ± 0.12 表 2 不同指标分级及评分表格
Table 2 Index classification and grading form
等级分值 Grade score 树高分级 Tree height grade/m 冠高比
分级
CR树冠不对称
度分级
CAI树冠不对称度图示 Diagram of CAI 1 < 5 < 0.33 R1 = R2 =
R3 = R4
2 5 ~ 10 0.34 ~ 0.5 R1 = R2,
R3 = R43 10 ~ 15 0.5 ~ 0.67 R1 > R2 or R1 < R2, R3 = R4 
4 15 ~ 20 > 0.67 R1 ≠ R2 ≠
R3 ≠ R -
[1] 林而达, 许吟隆, 蒋金荷, 等. 气候变化国家评估报告(Ⅱ): 气候变化的影响与适应[J]. 气候变化研究进展, 2006, 2(2):51−56. doi: 10.3969/j.issn.1673-1719.2006.02.001 Lin E D, Xu Y L, Jiang J H, et al. National assessment report of climate change (II): climate change impacts and adaptation[J]. Advances in Climate Change Research, 2006, 2(2): 51−56. doi: 10.3969/j.issn.1673-1719.2006.02.001
[2] Emanuel K. Increasing destructiveness of tropical cyclones over the past 30 years[J]. Nature, 2005, 436: 686−688. doi: 10.1038/nature03906
[3] Webster P J, Holland G J, Curry J A, et al. Changes in tropical cyclone number, duration, and intensity in a warming environment[J]. Science, 2005, 309: 1844−1846. doi: 10.1126/science.1116448
[4] Hoyos C D, Agudelo P A, Webster P J, et al. Deconvolution of the factors contributing to the increase in global hurricane intensity[J]. Science, 2006, 312: 94−97. doi: 10.1126/science.1123560
[5] 杨桂山. 中国沿海风暴潮灾害的历史变化及未来趋向[J]. 自然灾害学报, 2000, 9(3):23−30. doi: 10.3969/j.issn.1004-4574.2000.03.004 Yang G S. Historical change and future trends of storm surge disaster in China’s coastal area[J]. Journal of Natural Disasters, 2000, 9(3): 23−30. doi: 10.3969/j.issn.1004-4574.2000.03.004
[6] Jonsson M J, Foetzki A, Kalberer M, et al. Natural frequencies and damping ratios of Norway spruce (Picea abies (L.) Karst) growing on subalpine forested slopes[J]. Trees, 2007, 21(5): 541−548. doi: 10.1007/s00468-007-0147-x
[7] Sugden M J. Tree sway period-a possible new parameter for crown classification and stand competition[J]. The Forestry Chronicle, 1962, 38(3): 336−344. doi: 10.5558/tfc38336-3
[8] Mayhead G J, Gardiner J B H, Durrant D W. A report on the physical properties of conifers in relation to plantation stability[R]. Edinburgh: Forestry Commission Research and Development Division, 1975.
[9] Gardiner B A. The interactions of wind and tree movement in forest canopies[M]//Coutts M, Grace J. Wind and trees. Cambridge: Cambridge University Press, 1995: 41−59.
[10] Moore J R, Maguire D A. Natural sway frequencies and damping ratios of trees: concepts, review and synthesis of previous studies[J]. Trees, 2004, 18(2): 195−204. doi: 10.1007/s00468-003-0295-6
[11] Hassinen A, Lemettinen M, Peltola H, et al. A prism-based system for monitoring the swaying of trees under wind loading[J]. Agricultural and Forest Meteorology, 1998, 90(3): 187−194. doi: 10.1016/S0168-1923(98)00052-5
[12] Peltola H, Kellomäki S. A mechanistic model for calculating windthrow and stem breakage of Scots pines at stand age[J]. Silva Fennica, 1993, 27(2): 99−111.
[13] Holbo H R, Corbett T C, Horton P J. Aeromechanical behavior of selected Douglas-fir[J]. Agricultural Meteorology, 1980, 21(2): 81−91. doi: 10.1016/0002-1571(80)90056-4
[14] Peltola H M. Mechanical stability of trees under static loads[J]. American Journal of Botany, 2006, 93(10): 1501−1511. doi: 10.3732/ajb.93.10.1501
[15] Cremer K W, Borough C J, McKinnell F H, et al. Effects of stocking and thinning on wind damage in plantations[J]. New Zealand Journal of Forestry Science, 1982, 12(2): 244−268.
[16] James K R, Haritos N, Ades P K. Mechanical stability of trees under dynamic loads[J]. American Journal of Botany, 2006, 93(10): 1522−1530. doi: 10.3732/ajb.93.10.1522
[17] Mayhead G J. Some drag coefficients for British forest trees derived from wind tunnel studies[J]. Agricultural Meteorology, 1973, 12: 123−130. doi: 10.1016/0002-1571(73)90013-7
[18] Fraser A I, Gardiner J. Rooting and stability in sitka spruce[M]. London: HMSO, 1967: 331−334.
[19] Oliver H R, Mayhead G J. Wind measurements in a pine forest during a destructive gale[J]. Forestry: An International Journal of Forest Research, 1974, 47(2): 185−194. doi: 10.1093/forestry/47.2.185
[20] Sellier D, Fourcaud T. Crown structure and wood properties: influence on tree sway and response to high winds[J]. American Journal of Botany, 2009, 96(5): 885−896. doi: 10.3732/ajb.0800226
[21] Petty J A, Swain C. Factors influencing stem breakage of conifers in high winds[J]. Forestry: An International Journal of Forest Research, 1985, 58(1): 75−84. doi: 10.1093/forestry/58.1.75
[22] Coutts M P. Components of tree stability in Sitka spruce on peaty gley soil[J]. Forestry: An International Journal of Forest Research, 1986, 59(2): 173−197. doi: 10.1093/forestry/59.2.173
[23] Blackburn P, Petty J A, Miller K F. An assessment of the static and dynamic factors involved in windthrow[J]. Forestry: An International Journal of Forest Research, 1988, 61(1): 29−43. doi: 10.1093/forestry/61.1.29
[24] Hedden R L, Fredericksen T S, Williams S A. Modeling the effect of crown shedding and streamlining on the survival of loblolly pine exposed to acute wind[J]. Canadian Journal of Forest Research, 1995, 25(5): 704−712. doi: 10.1139/x95-078
[25] England A H, Baker C J, Saunderson S E T. A dynamic analysis of windthrow of trees[J]. Forestry: An International Journal of Forest Research, 2000, 73(3): 225−238. doi: 10.1093/forestry/73.3.225
[26] Cullen S. Trees and wind: a bibliography for tree care professionals[J]. Journal of Arboriculture, 2002, 28(1): 41−51.
[27] Schelhaas M J. The wind stability of different silvicultural systems for Douglas-fir in the Netherlands: a model-based approach[J]. Forestry: An International Journal of Forest Research, 2008, 81(3): 399−414. doi: 10.1093/forestry/cpn028
[28] 任如红, 刘分念, 龚洁莹, 等. 舟山市园林树木抗风性的调查研究[J]. 浙江农业科学, 2013(4):422−426. doi: 10.3969/j.issn.0528-9017.2013.04.024 Ren R H, Liu F N, Gong J Y, et al. Investigation on characteristics of wind resistance for landscape trees in Zhoushan City[J]. Journal of Zhejiang Agricultural Sciences, 2013(4): 422−426. doi: 10.3969/j.issn.0528-9017.2013.04.024
[29] Lecoeur H, Buffet P A, Milon G, et al. Early curative applications of the aminoglycoside wr279396 on an experimental Leishmania major-loaded cutaneous site do not impair the acquisition of immunity[J]. Antimicrobial Agents and Chemotherapy, 2010, 54(3): 984−990. doi: 10.1128/AAC.01310-09
[30] 吴志华, 李天会, 张华林, 等. 广东湛江地区绿化树种抗风性评价与分级选择[J]. 亚热带植物科学, 2011, 40(1):18−23. doi: 10.3969/j.issn.1009-7791.2011.01.005 Wu Z H, Li T H, Zhang H L, et al. Study on graduation and comprehensive evaluation of tree species wind-resistance in Zhanjiang, Guangdong Province[J]. Subtropical Plant Science, 2011, 40(1): 18−23. doi: 10.3969/j.issn.1009-7791.2011.01.005
[31] Mattheck C, Bethge K, Kappel R, et al. Failure modes for trees and related criteria: wind effects on trees[M]. Karlsruhe: University of Karlsruhe, 2003: 219−230.
[32] Urata T, Shibuya M, Koizumi A, et al. Both stem and crown mass affect tree resistance to uprooting[J]. Journal of Forest Research, 2012, 17(1): 65−71. doi: 10.1007/s10310-011-0249-6
[33] Putz F E, Coley P D, Lu K R, et al. Uprooting and snapping of trees: structural determinants and ecological consequences[J]. Canadian Journal of Forest Research, 1983, 13(5): 1011−1020. doi: 10.1139/x83-133
[34] Asner G P, Goldstein G. Correlating stem biomechanical properties of Hawaiian canopy trees with hurricane wind damage[J]. Biotropica, 1997, 29(2): 145−150. doi: 10.1111/j.1744-7429.1997.tb00018.x
[35] Nicoll B C, Ray D. Adaptive growth of tree root systems in response to wind action and site conditions[J]. Tree Physiology, 1996, 16(11/12): 891−898.
[36] Blackwell P G, Rennolls K, Coutts M P. A root anchorage model for shallowly rooted Sitka spruce[J]. Forestry: An International Journal of Forest Research, 1990, 63(1): 73−91. doi: 10.1093/forestry/63.1.73
[37] Dunham R A, Cameron A D. Crown, stem and wood properties of wind-damaged and undamaged Sitka spruce[J]. Forest Ecology and Management, 2000, 135(1/3): 73−81.
[38] Kontogianni A, Tsitsoni T, Goudelis G. An index based on silvicultural knowledge for tree stability assessment and improved ecological function in urban ecosystems[J]. Ecological Engineering, 2011, 37(6): 914−919. doi: 10.1016/j.ecoleng.2011.01.015
[39] Valinger E, Lundqvist L, Bondesson L. Assessing the risk of snow and wind damage from tree physical characteristics[J]. Forestry: An International Journal of Forest Research, 1993, 66(3): 249−260. doi: 10.1093/forestry/66.3.249
[40] Wessolly L. Fracture diagnosis of trees (part 2): statics-integrated methods-statically-integrated assessment (SIA): the practitioner’s method of diagnosis[J]. Stadt und Gruen, 1995, 8: 570−573.
[41] Sterken P. A guide for tree-stability analysis[M]. Wageningen: University and Research Centre of Wageningen, 2005.
[42] 肖洁舒, 冯景环. 华南地区园林树木抗台风能力的研究[J]. 中国园林, 2014, 30(3):115−119. Xiao J S, Feng J H. Research on the typhoon resistance ability of trees in South China[J]. Chinese Landscape Architecture, 2014, 30(3): 115−119.
[43] 罗冠勇, 宋希强, 杨冬华, 等. 海南10种园林乔木生物学特性与抗风性关联性分析[J]. 热带作物学报, 2013, 34(2):263−267. doi: 10.3969/j.issn.1000-2561.2013.02.012 Luo G Y, Song X Q, Yang D H, et al. Correlation analysis on the relationship between the biological characteristic of ten ornamental tree species and the wind-resistance ability in Hainan Island[J]. Chinese Journal of Tropical Crops, 2013, 34(2): 263−267. doi: 10.3969/j.issn.1000-2561.2013.02.012
-
期刊类型引用(20)
1. 林文月,王锦,张喆. 基于视觉吸引的森林景观色彩要素识别及影响因素研究——以云南轿子山自然保护区为例. 西部林业科学. 2024(02): 133-141 .  百度学术
百度学术
2. 刘帅健,邓华锋. 基于PSPNet深度学习网络景观要素语义分割的春季森林景观质量评价. 西北林学院学报. 2024(03): 231-238 .  百度学术
百度学术
3. 尹佳仪,甘德欣. 长株潭绿心视觉美学质量及视觉异质性研究. 农业与技术. 2024(23): 93-98 .  百度学术
百度学术
4. 郎博帅,刘叶凡,韩阳媚,欧阳嗣航,李玉灵,程顺. 林内色彩斑块分布格局对秋季生态景观林美景度的影响——以塞罕坝机械林场为例. 林业与生态科学. 2023(01): 98-105 .  百度学术
百度学术
5. 陆子婧,王锦,张喆,刁秀丽,王钰,林文月. 植物色彩量化方法研究. 现代农业科技. 2022(02): 127-132 .  百度学术
百度学术
6. 张菲,李玉灵. 塞罕坝机械林场生态景观林空间结构对夏季景观质量的影响. 林业与生态科学. 2022(02): 206-212+216 .  百度学术
百度学术
7. 马薛骑,裘鸿菲,张群. 景观结构要素与色彩因子对滨水景观视觉质量的影响——以武汉东湖磨山景区为例. 西北林学院学报. 2022(03): 231-238+280 .  百度学术
百度学术
8. 贾娜,史久西,秦一心,格日勒图,张龙. 森林色彩景观格局指数与色彩属性指标对观赏效应的影响. 林业科学. 2021(02): 12-21 .  百度学术
百度学术
9. 贾娜,闫伟,史久西,格日乐图,车晓雨. 秋色叶树木树冠色彩特性对其观赏效应的影响. 林业科学. 2021(11): 37-48 .  百度学术
百度学术
10. 钟姝,赵曜,李雄,姚朋. 基于SBE法的北京植物园月季园植物组群美学评价. 中国城市林业. 2020(01): 66-70 .  百度学术
百度学术
11. 韩丽,马长乐. 基于SBE法的滨江公园美景度调查研究——以昆明市滨江公园为例. 江苏农业科学. 2020(10): 137-142 .  百度学术
百度学术
12. 李雨薇,彭培好,汪平. 森林景观色彩研究进展. 四川林业科技. 2020(03): 153-160 .  百度学术
百度学术
13. 赵凯,李金航,徐程扬. 侧柏人工林林分结构与色彩斑块间的耦合关系. 北京林业大学学报. 2019(01): 82-91 .  本站查看
本站查看
14. 马冰倩,徐程扬,刘江,常成,赵凯,孔祥琦,龙嘉翼. 城镇森林视觉景观异质性对美学质量的影响. 浙江农林大学学报. 2019(02): 366-374 .  百度学术
百度学术
15. 宋世杰,颜立红,颜玉娟,赖小连,雷佳伟. 基于SBE法的宅间植物景观美学评价研究. 中国城市林业. 2019(02): 17-21 .  百度学术
百度学术
16. 曹瑜娟,徐程扬,崔义,岳阳,任雅雪. 观景距离和光照条件对黄栌林景观色彩的影响. 中南林业科技大学学报. 2019(05): 22-29+48 .  百度学术
百度学术
17. 李苹,毛斌,许丽娟,吴鞠,刘海轩,徐程扬. 密度、灌草盖度和树干形态对油松人工风景林林内景观指数的影响. 北京林业大学学报. 2018(10): 115-122 .  本站查看
本站查看
18. 马冰倩,徐程扬,崔义. 八达岭秋季景观整体色彩组成对美景度的影响. 西北林学院学报. 2018(06): 258-264 .  百度学术
百度学术
19. 王子,荣媛,李明阳,钱春花. 森林景观色彩评价研究. 世界林业研究. 2017(03): 41-45 .  百度学术
百度学术
20. 张喆,郄光发,王成,姜莎莎. 多尺度植物色彩表征及其与人体响应的关系. 生态学报. 2017(15): 5070-5079 .  百度学术
百度学术
其他类型引用(15)


 下载:
下载:


