
Analysis on phenotypic variation and germplasm resource selection of wild Amygdalus mira in Tibet of southwestern China
-
摘要:目的 本研究是探究西藏野生光核桃果实表型性状种群变异规律,结合主成分分析筛选优良种质资源,探明生态因子对果实表型性状的影响,为光核桃良种选育和推广提供参考。方法 根据西藏野生光核桃的集中分布区,兼顾种群生长海拔、气候和成熟期的差异,对5个地级市18个种群(SYD、AR、LD、JT、DB、QD、MX、LK、BM、GY、SZ、BJ、ZR、PZ、QN、BH、LZ、CN)进行实地调查采样,每个种群选取13株长势良好的光核桃,各单株间距大于50 m,每株分阴面、阳面和上、下4个方位采集成熟果实,从每方位的果实中随机选择5枚,共20枚,测量其表型性状。结果 光核桃果实表型性状种群间和种群内均存在极显著差异;种群间表型分化系数均值为67.99%,表型变异主要来源于种群间;根据PCA分析结合利用部位果肉和果核,筛选出果实大、果核小、果肉厚、出核率低的果用型光核桃,代表种群为山南贡嘎县江塘镇、林芝米林县羌纳乡、林芝朗县朗镇;果实小、果核大、果肉薄、高出核率的核用型光核桃,代表种群有林芝察隅县古玉乡、日喀则亚东县上亚东乡、昌都芒康县曲登乡。RDA分析5个生态因子共解释56.00%的果实性状变异,仅年均温对果实性状的总体变异影响显著(P = 0.049);两个特征性状果肉厚和出核率与生态因子的多元回归方程均回归显著(P < 0.01),调整后判定系数分别为0.599 3、0.798 1。果肉厚与经度、海拔、年均降雨量呈负相关,与纬度和年均温呈正相关;出核率与经度、海拔、年均降雨量和年均温呈正相关,与纬度呈负相关;5个生态因子中经度、纬度、海拔对果肉厚和出核率的影响极显著。结论 光核桃果实表型性状变异主要来源于种群间;根据表型性状筛选出了果用型和核用型光核桃及其代表种群,其特征性状主要受经纬度、海拔的影响。Abstract:Objective This study aims to explore the variation of fruit phenotypic traits of the wild Amygdalus mira populations in Tibet of southwestern China and to screen the good germplasm resources by the principal component analysis, and also to ascertain the effects of ecological factors on phenotypic traits of fruits for fine breeding and generalizing of Amygdalus mira.Method The 18 populations (SYD, AR, LD, JT, DB, QD, MX, LK, BM, GY, SZ, BJ, ZR, PZ, QN, BH, LZ, CN) in 5 regions were surveyed and sampled according to the concentration distribution area combined with the differences in altitude, climate and maturity of wild A. mira in Tibet. In each population, 13 trees with good growth potential were selected, and the spacing of each individual plant was greater than 50 m. The ripe fruits were collected from the dark, sunny and the upper, lower four directions of each plant, 5 fruits were randomly selected from each direction, 20 in total, and then the phenotypic traits were measured.Result The fruit phenotypic traits were highly significantly different in population and among populations of A. mira. The mean of phenotypic differentiation coefficient was 67.99%, and the fruit phenotypic variations were mainly derived from populations. According to the results of PCA analysis and the use of pulp and core, the representative populations with large fruit, small nut, thick pulp and low nuclear rate were selected, and they were the Jiangtang Township, Qiangna Township and Lang Township. While the representative populations with small fruit, large nut, thin pulp and high nuclear rate were the Guyu Township, Shangyadong Township and Qudeng Township. The 5 ecological factors explained 56.00% of the fruit character variation through RDA analysis, and only the annual average temperature had a significant effect on the overall variation of fruit traits (P = 0.049). The multiple regression equation of the two characteristics of the pulp thickness and the nuclear rate with the ecological factors were all significant (P < 0.01), and the adjusted R2 was 0.5993 and 0.7981, respectively. The thickness of pulp was negatively correlated with longitude, altitude and average annual rainfall, and was positively correlated with latitude and average annual temperature. The nuclear rate was positively correlated with longitude, altitude, average annual rainfall and annual temperature, and was negatively correlated with latitude. The effects of longitude, latitude and altitude on the thickness of pulp and the nuclear rate were highly significant.Conclusion The phenotypic variation of A. mira mainly comes from populations. According to the phenotypic traits, fruit type and nut type of A. mira and its representative populations were screened. The effects of longitude, latitude and altitude of 5 ecological factors on the thickness of pulp and the nuclear rate were the most significant.
-
Keywords:
- Amygdalus mira /
- phenotypic character /
- population /
- variation /
- germplasm resource
-
竹材具生长周期短、硬度强、韧性高、可降解的生物性材料。且在现有木材资源不能适应家具产业发展迫切需要的情况下,竹材是取代实木的最理想材料[1],竹集成材作为保持了竹材优异的物理力学性能的竹制家具用材,具有良好的发展前景。众所周知,竹材容易受外界环境如光照、水、微生物等的侵害而发生变色、腐朽[2],竹集成材亦如是。对竹集成材进行表面涂饰是最能够有效保护其性能的方法之一。
以水作为溶剂的水性漆与传统油性漆相比,不含挥发性有机物(volatile organic compounds,VOCs),具有绿色环保、节约资源的特性[3]。伴随着国家环保政策的不断完善和绿色环保理念的普及,水性漆在家具、室内装饰、建筑等领域将逐步替代传统涂料[4]。然而竹集成材水性漆涂饰面临着竹集成材密度大,纹孔少,横向渗透困难等问题[5],使得水性漆漆膜附着力差,竹集成材水性漆涂饰工业化进度缓慢。为了克服这些问题,Lu[6]通过对毛竹表面进行过氧化氢表面预处理的方法,提高了水性漆在毛竹表面的附着力。此外其他研究人员通过使用湿热处理[7-8]、碱液浸泡处理[9]等方法,也在一定程度上提高了竹材表面的润湿性和粗糙度,改善了水性漆等流体在竹材内部的渗透效率,漆膜的附着力由此增强。涂饰工艺对涂料性能的发挥有着重要影响,是涂饰过程中的关键技术环节。但目前有关水性涂饰工艺的研究还着重于水曲柳、杨木等木质材料上[10-12],对竹集成材涂饰工艺研究较少,且未有水性清漆和色漆对竹集成材硬度、附着力等漆膜性能影响方面的研究。
为了解决竹集成材水性涂装这些难题,本研究以家具中最为常用的毛竹集成材为基材,在省去预处理的基础上优化了竹集成材水性涂饰工艺,提高了水性涂饰工艺的效率,系统地探究了竹集成材清漆与色漆涂饰性能的影响及竹集成材水性漆漆膜的附着机理,为竹家具的水性化涂装提升提供理论支持和科学依据。
1. 材料与方法
1.1 材 料
选取含水率为11%的毛竹集成材,制成尺寸为100 mm(长) × 100 mm(宽) × 10 mm(厚)的试样18块,并对试样在室温和湿度为(65 ± 3)%的环境下进行打磨。选用涂料为自制水性底漆和商业水性面漆(分为清漆与色漆两种类型,主要成分为水性聚氨酯树脂,底漆固体含量为39.2%,面漆固体含量为34.6%)。
1.2 基材涂饰
依次用80目、120目、180目和240目砂纸对基材进行顺纹打磨并用羊毛刷除尘。涂饰前底漆与面漆分别添加5% 和8%的去离子水进行调配。调配底漆涂布量为80 g/m2,面漆涂布量为120 g/m2,在室温下均匀地喷涂底漆3遍、面漆1遍,每遍喷涂干燥之后再次顺纹打磨1遍(图1)。涂饰完后基材后在室温下干燥8 h。
1.3 测试方法
将无差别的18个样品分为A、B和C这3组,每组6个,按照字母加数字的方式编号成A1 ~ A6、B1 ~ B6和C1 ~ C6。
1.3.1 漆膜硬度、附着力、光泽度测试
选取A组试样进行漆膜的硬度测试。根据ISO 15184—1998 《色漆和清漆 铅笔法测定漆膜硬度》标准测试。选取B组试样进行漆膜的附着力测定。根据ISO 2409—2013《色漆和清漆交叉切割试验》中的检测标准,按照规定的步骤,使用QFH漆膜划格仪依次对每个试样进行测定。参照ISO 2813—2014《色漆和清漆在20°、60°和85°非金属色漆漆膜镜面光泽的测定》使用60°光泽度仪对C组和对照试样进行光泽度测试。
1.3.2 表面粗糙度测试
参照GB/T 12472—2003《产品几何量技术规范(GPS) 表面结构 轮廓法 木制件表面粗糙度参数及其数值》,使用TR240便携式表面粗糙度仪测试试样的表面粗糙度,将触针的运动转变为电信号,测量出各粗糙度参数。设置取样长度为2.5 mm,为了提高准确率,在每一块试件上选取4 个点测试,并对测试结果进行记录。
1.3.3 色度值测试
使用SP60色差仪按照国际照明委员会CIE标准色度系统对C组试样基材涂饰前后的颜色变化进行定量的度量。CIE由L*、a*、b*这3个数值进行评估。L*表示亮度;a*表示红绿,数值变化由正到负,表示颜色从红(正)到绿(负);b*表示黄蓝,数值变化由正到负,表示颜色从黄(正)到蓝(负)。总色差值ΔE表示颜色知觉差异,数值越小则表示颜色变化越小。ΔE由公式(1)确定:
ΔE=√ΔL∗2+Δa∗2+Δb∗2 (1) 式中:ΔL*、Δa* 和Δb*分别为涂饰前后的L*、a*和b*差值。
1.3.4 扫描电镜(scanning electron microscope,SEM)分析
使用场发射环境扫描电镜(FEG-ESEM,XL30ESEMFEG,FEI Company,USA)观察并记录基材涂饰前后的表面形态。将加速电压设置为7 kV后,着重对涂饰后基材与漆膜界面结合处的形态进行观察。
1.3.5 傅里叶变换红外光谱(Fourier transform infrared spectroscopy,FTIR)分析
用溴化钾压片法分别测定涂饰前后试样的FTIR。设置光谱分辨率为4 cm−1,在500 ~ 4 000 cm−1范围内,利用傅里叶变换红外光谱仪(Nicolet6700傅里叶红外光谱仪,Thermo Scientific, Waltham, USA)扫描得到清漆、色漆、竹集成材、清漆和色漆涂饰后的基材的5种FTIR。测试完成后,将所有5个样品的光谱绘制成图表,分析每个样品的特征峰的变化,并据此探究水性漆与竹集成材的结合机理。
2. 结果与讨论
2.1 漆膜硬度与附着力
漆膜硬度代表了涂饰在基材上的漆膜的机械强度,反映了漆膜对来自外界的碰擦、刺划等机械作用的耐受能力[13]。从表1可以看出:清漆的漆膜硬度为1H,而色漆的漆膜硬度为2H。这是因为漆膜的硬度是由成膜物质的性能所决定的,色漆中含有较高硬度的颜料,因而色漆的硬度优于清漆。但两者的硬度均能够满足GB/T 3324—2017《木家具通用技术条件》中室内装饰、实木地板的使用要求[14]。此外,我们发现清漆和色漆的漆膜硬度均比之前研究的水性漆涂饰水曲柳所得的硬度高[12],这充分说明了水性漆采用喷涂的涂饰工艺能在竹集成材上产生能媲美在木材上的效果。
表 1 水性漆漆膜的硬度与附着力Table 1. Hardness and adhesion of film of waterborne paint清漆 Varnish 色漆 Color paint 试件 Sample 硬度 Hardness 附着力 Adhesion 试件 Sample 硬度 Hardness 附着力 Adhesion A1 1H 0级 Grade 0 B1 2H 1级 Grade 1 A2 1H 0级 Grade 0 B2 2H 1级 Grade 1 A3 1H 0级 Grade 0 B3 2H 1级 Grade 1 A4 1H 0级 Grade 0 B4 2H 1级 Grade 1 A5 1H 0级 Grade 0 B5 2H 1级 Grade 1 A6 1H 0级 Grade 0 B6 2H 1级 Grade 1 平均值 Average value 1H 0级 Grade 0 平均值 Average value 2H 1级 Grade 1 漆膜附着力是指导家具涂装工艺优化方向的关键数据,也是影响漆膜性能的重要指标之一[15-16]。由表1可知:清漆漆膜的附着力比色漆漆膜的附着力更高,可达为最高的0级,这是由于色漆由于含有颜料,其固含量高于清漆,所以清漆具有更高的渗透能力,因而清漆能更好地填充在基材的细胞腔里。从SEM图中也能清晰地看到涂饰前后的差别。在未涂饰基材图(图2a、2b)中可以看到有较大的导管存在基材的横切面上,而纵切面上较多的则是裸露的细胞腔,基材表面裸露的细胞腔为水性漆在基材表面良好的附着性能提供了一定的基础。基材涂饰清漆和色漆后(图2c、2d),沟槽状的细胞腔和细胞胞间层中都有成膜物填充,因而达到较强的附着力。且从图2c、2d中也能看出:因清漆的渗透性能更好,使得在相同涂布量下,色漆的漆膜厚度明显高于清漆。此外,竹集成材水性清漆涂饰的漆膜附着力与之前研究的木材水性漆涂饰的附着力相当[12]。这也再次证明了使用“三低一面”的喷涂涂饰工艺能达到较好的漆膜性能。
2.2 光泽度
漆膜的光反射能力是通过漆膜的光泽度来衡量的,在一定范围内,随着竹材基材的表面光泽度增加,视觉效果变好[17]。涂饰前后基材的光泽度一般区分为垂直竹材纹理的光泽度值(gloss value of vertical bamboo texture,GZT)和平行竹材纹理的光泽度值(gloss value of parallel bamboo texture,GZL)。由图3可得涂饰后试样光泽度明显高于未涂饰试样,这是因为水性漆成膜物的光泽度比竹材自身的光泽度高。清漆涂饰后的平均GZT和GZL分别为19.83和21.24,色漆涂饰后的分别为21.39和22.93,均比未涂饰时提高了5倍以上,大大提升了竹集成材的装饰效果。且色漆因颜料填料含量较高,成膜物质在竹材表面固着占比更多,从而使得色漆光泽度均高于清漆。通过进一步对比发现试样的GZL均高于GZT,这是因为竹材大多数细胞是轴向排列的,在平行纹理方向,大部分细胞被剖开,细胞腔呈沟槽状暴露出来,因此成膜物容易填充到腔径大的细胞腔中;细胞壁的相对含量在垂直纹理方向上较多,因此成膜物很难渗透到具有纳米级孔的细胞壁中,导致平行纹理方向上成膜物的含量高于垂直纹理方向上的含量,因此其光泽度也显著增加[18-19]。
![]() 图 3 基材涂饰前后光泽度GZT为光泽度仪垂直于木材纹理方向时所测得的光泽度值;GZL为光泽度仪平行于木材纹理方向时所测得的光泽度值。 GZT is the glossiness value measured when glossmeter is perpendicular to the direction of wood texture. GZL is the glossiness value measured when glossmeter is parallel to the direction of wood texture.Figure 3. Glossiness of substrate before and after painting
图 3 基材涂饰前后光泽度GZT为光泽度仪垂直于木材纹理方向时所测得的光泽度值;GZL为光泽度仪平行于木材纹理方向时所测得的光泽度值。 GZT is the glossiness value measured when glossmeter is perpendicular to the direction of wood texture. GZL is the glossiness value measured when glossmeter is parallel to the direction of wood texture.Figure 3. Glossiness of substrate before and after painting2.3 表面粗糙度
表面粗糙度是指竹材在加工的过程中表面留下的各种不同程度的微观加工痕迹或不平度,常被用来评价竹材表面的质量,将会直接影响竹材的涂饰效果以及涂料的用量,常用轮廓算数平均偏差Ra、轮廓算数均方偏差Rq、微观不平度十点高度Rz和轮廓最大高度Ry表示[20]。本实验主要采用Ra表征试样的表面粗糙度,Ra的值越小,说明其表面越光滑平整。不同涂饰情况对应试样的表面粗糙度和电镜图见图4和图5。涂饰后的Ra值均小于未涂饰的Ra值,从SEM图也可以清楚地看出基材裸露的细胞腔被水性漆覆盖,表面粗糙度降低。且清漆涂饰后的Ra值比色漆涂饰后的Ra值小。这是因为色漆中含有颜料颗粒(图5b),可能影响成膜的交联程度,这导致涂饰色漆后表面粗糙度高于涂饰清漆后的表面粗糙度。
![]() 图 4 涂饰前后试样表面粗糙度平均值Ra为评定轮廓的算数平均偏差; Rz为微观不平度十点高度,是指在取样长度内5 个最大的轮廓峰高的平均;Rq为评定轮廓的算数均方偏差;Ry为轮廓最大高度,是指在取样长度内,轮廓峰顶线和轮廓谷底线之间的距离。Ra is the arithmetical mean deviation of assessed profile; Rz is the height of ten points of micro unevenness, which refers to the average of five maximum contour peak heights within the sampling length; Rq is the root mean square deviation of the assessed profile; Ry is the maximum height of profile, which refers to the distance between the contour peak line and the contour bottom line within the sampling length.Figure 4. Surface roughness of substrate before and after painting
图 4 涂饰前后试样表面粗糙度平均值Ra为评定轮廓的算数平均偏差; Rz为微观不平度十点高度,是指在取样长度内5 个最大的轮廓峰高的平均;Rq为评定轮廓的算数均方偏差;Ry为轮廓最大高度,是指在取样长度内,轮廓峰顶线和轮廓谷底线之间的距离。Ra is the arithmetical mean deviation of assessed profile; Rz is the height of ten points of micro unevenness, which refers to the average of five maximum contour peak heights within the sampling length; Rq is the root mean square deviation of the assessed profile; Ry is the maximum height of profile, which refers to the distance between the contour peak line and the contour bottom line within the sampling length.Figure 4. Surface roughness of substrate before and after painting2.4 色度值
色差是指两种颜色之间的差异。色差值是色差的数值表达。色差和色差值受涂料成分、涂饰工艺等因素的影响[21]。涂膜前后的色度值变化如图6所示。涂饰清漆前L*值为72.38,涂饰清漆后降低至64.37;a*值由原来的7.03增加到10.12;b*值由24.48增加到30.64。结果表明,涂层后基材表面明度略有下降,红色和黄色指数略有增加。ΔE较小为10.56,说明涂饰清漆前后竹集成材的表面颜色相差不大。这是因为水性清漆不含颜料,在竹集成材表面固化后是透明的,能较好地保持竹集成材本身的颜色。而涂饰色漆后L*值降低至34.74;a*值增加到12.03;b*值降低至18.30。说明涂层后基材表面明度有一定程度的下降,红色和蓝色指数略有增加。ΔE值较大,为38.46,这表明竹集成材表面的色彩特征因色漆中颜料的颜色发生了较大程度的改变。
![]() 图 6 涂饰前后色度值对比L*表示亮度;a*表示红绿;b*表示黄蓝。 L* indicates lightness, a* indicates red and green, and b* indicates yellow and blue.Figure 6. Comparison of chromaticity values before and after painting
图 6 涂饰前后色度值对比L*表示亮度;a*表示红绿;b*表示黄蓝。 L* indicates lightness, a* indicates red and green, and b* indicates yellow and blue.Figure 6. Comparison of chromaticity values before and after painting2.5 FTIR分析
图7显示了各试样的FTIR,可以看出:3 436 cm−1处吸收峰是由−OH伸缩振动引起的,与其他谱线相比,竹材谱线在这一位置的峰值明显最强,且涂饰后色漆和清漆在1 724 cm−1处(C=O的拉伸振动特征峰)的强度分别较纯色漆与清漆小得多,在1 143 cm−1处(酯基中C−O伸缩振动峰)的峰值比竹材谱线的更强,说明水性漆中的极性分子(如羧基、羟基)与基材中的羟基结合后,水性底漆中的羧基与基材中的羟基发生了酯化反应,两者之间形成了氢键使结合更加稳固[22-23]。此外色漆在2 921 cm−1(−CH2反对称伸缩振动峰)、1 724 cm−1(C=O的拉伸振动特征峰)、1 460 cm−1(−CH2弯曲振动峰)、1 143 cm−1(C−O伸缩振动)处的峰值均比清漆所在的峰值高,这是由于色漆中相应的基团的占比比清漆中的高。所以水性底漆除物理结合外,还会与基材发生化学反应,使成膜物能很好地附着在竹集成材表面。
![]() 图 7 水性漆与竹集成材涂饰前后的红外表征Figure 7. Infrared characterization of waterborne paint and bamboo laminated lumber before and after painting
图 7 水性漆与竹集成材涂饰前后的红外表征Figure 7. Infrared characterization of waterborne paint and bamboo laminated lumber before and after painting3. 结 论
本研究所获得的清漆的漆膜硬度为1H,色漆的漆膜硬度为2H。涂饰后,水性漆与竹集成材以机械互锁的物理形式和化学反应结合的形式使成膜物质能很好地附着在基材表面。由于色漆中含有颜料,清漆的附着性能优于色漆,可达最高的0级,与木材水性涂饰的附着性能相当。而颜料颗粒的存在影响了成膜的交联程度,使得色漆的表面粗糙度高于清漆。清漆和色漆涂饰后基材的光泽度提高了5倍以上,且平行纹理方向上的光泽度高于垂直纹理方向上。因色漆含有颜料,清漆涂饰前后总色差值较低,较好地保持了竹集成材本身优美的颜色。因此,本水性涂饰工艺在竹集成材上能获得较好的漆膜性能和较强的附着力,并能在很大程度上提升了竹集成材的装饰效果,为竹材及其制品的水性化涂装提供了重要的理论和技术支持。
-
![]()
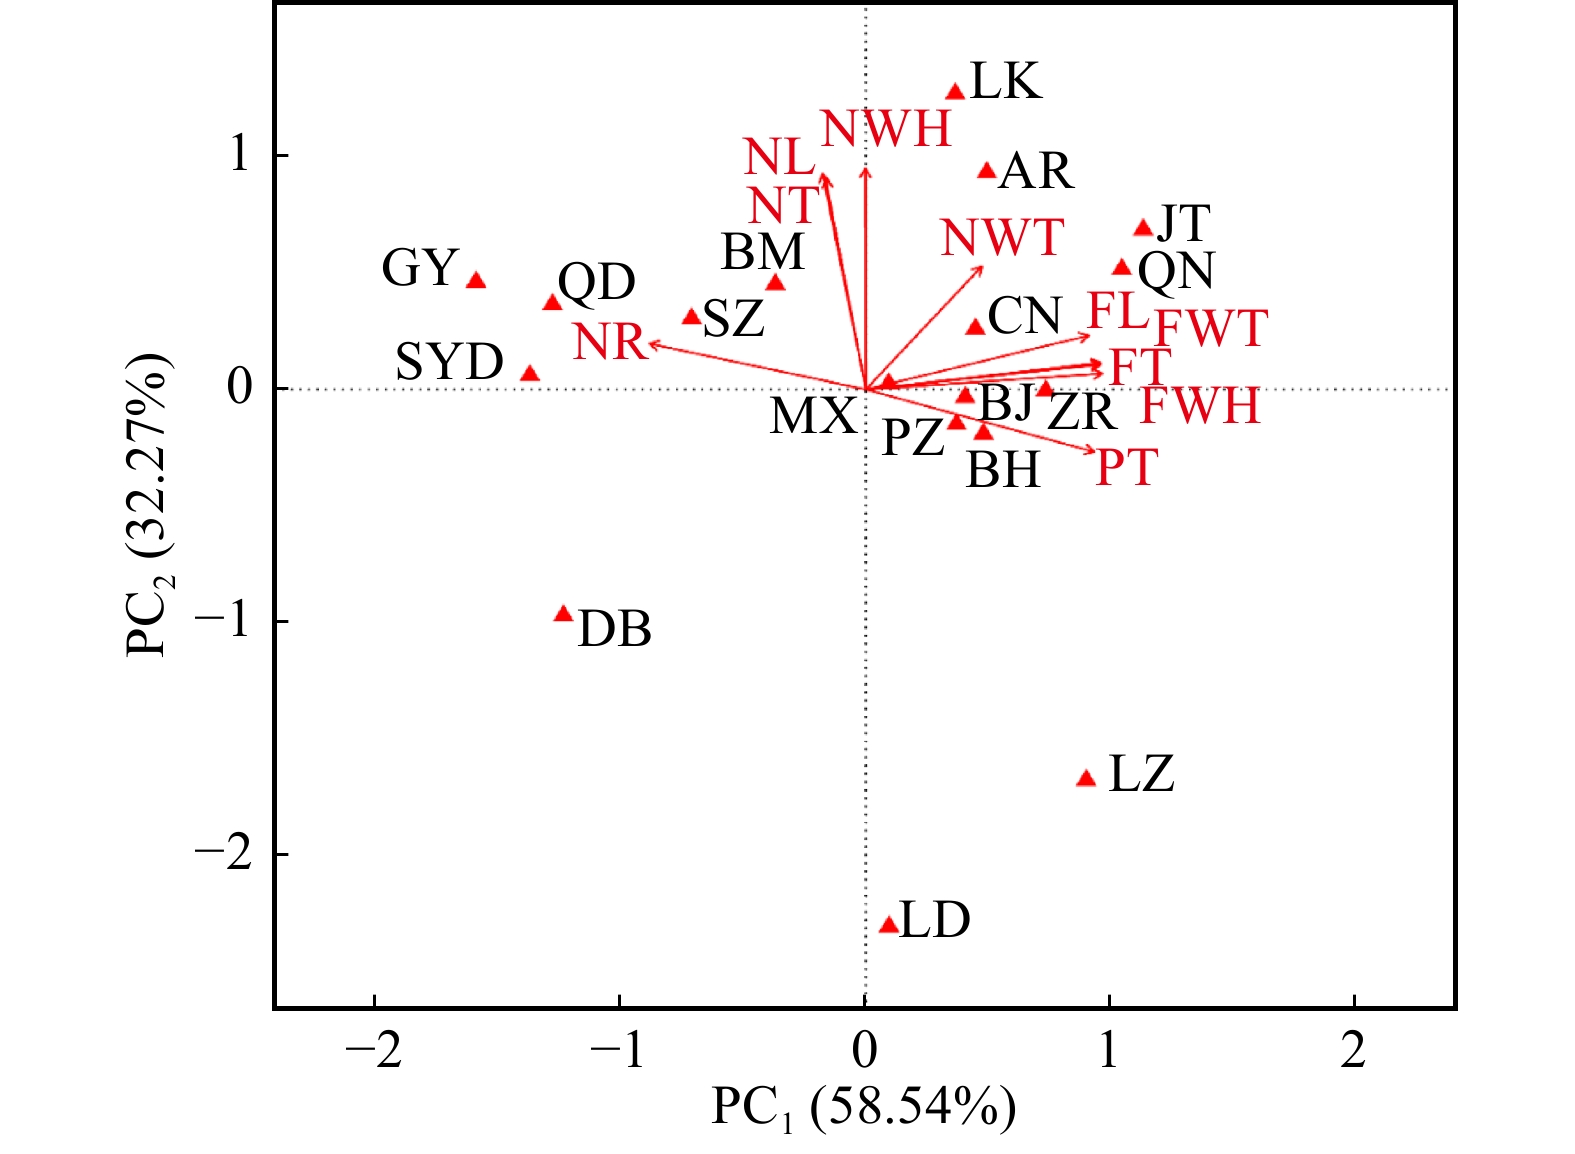
图 2 18个种群光核桃果实表型性状PCA分析
FWT、FL、FWH、FT、NWT、NL、NWH、NT、PT、NR为表型性状;SYD、AR、LD、LZ、DB、QD、MX、LK、BM、GY、SZ、BJ、ZR、JT、CN、PZ、QN、BH为种群代码。下同。FWT, FL, FWH, FT, NWT, NL, NWH, NT, PT, NR are phenotypic traits; SYD, AR, LD, LZ, DB, QD, MX, LK, BM, GY, SZ, BJ, ZR, JT, CN, PZ, QN, BH are population codes. The same below.
Figure 2. Segregation of the 18 populations according to fruit phenotypic traits determined by PCA analysis
![]()
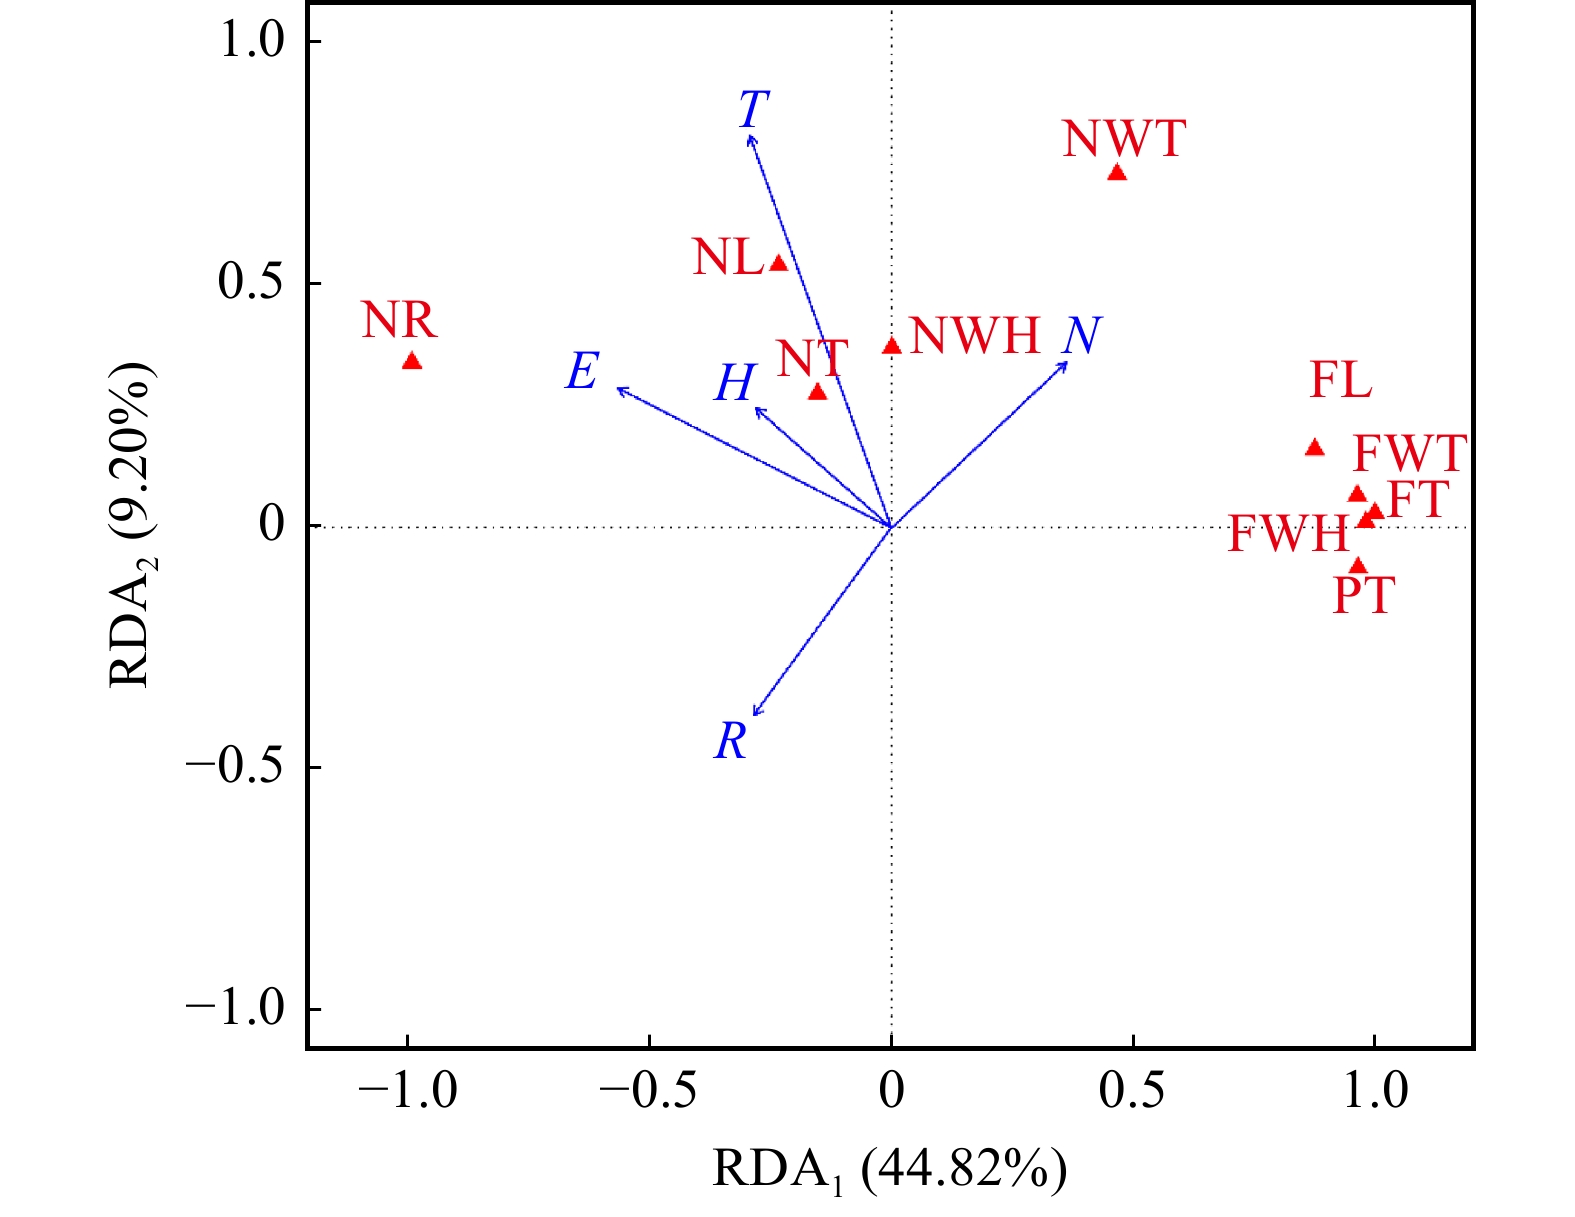
图 3 5个生态因子与18个种群光核桃果实表型性状RDA分析
E为经度,N为纬度,H为海拔;R为年均降雨量,T为年均温。下同。E is longitude, N is latitude, H is elevation; R is annual mean rainfall, T is annual mean temperature. The same below.
Figure 3. RDA analysis of 18 populations phenotypic traits with 5 ecological factors
表 1 光核桃18个种群的基本信息及成熟期
Table 1 Basic information and maturity stage of the 18 A. mira populations investigated in this study
种群及代码
Population and code经度
Longitude纬度
Latitude海拔
Elevation
(H)/m年均降水量
Average annual
rainfall(R)/mm年均温
Mean temperature
(T)/℃成熟期
Maturity stage日喀则亚东县上亚东乡
Shangyadong Township, Shigatse City(SYD)88°57′17″E 27°30′40″N 3 218 873.0 8.5 9月下旬
Late September山南加查县安绕镇
Anrao Township, Lhoka(AR)92°33′59″E 29°09′00″N 3 265 492.7 8.9 8月中下旬
Mid-late August山南加查县冷达乡
Lengda Township, Lhoka(LD)92°43′19″E 29°04′38″N 3 168 492.7 8.9 8月中下旬
Mid-late August山南贡嘎县江塘镇
Jiangtang Township, Lhoka(JT)90°41′42″E 29°15′43″N 3 770 356.6 9.2 9月中下旬
Mid-late September昌都左贡县东坝乡
Dongba Township, Qamdo City(DB)97°26′35″E 29°52′40″N 3 153 405.0 4.2 9月上旬
Early September昌都芒康县曲登乡
Qudeng Township, Qamdo City(QD)98°12′18″E 29°33′23″N 3 654 350.0 10.0 9月上旬
Early September昌都芒康县木许乡
Muxu Township, Qamdo City(MX)98°37′02″E 28°54′27″N 2 280 450.0 10.5 8月中下旬
Mid-late August昌都八宿县林卡乡
Linka Township, Qamdo City(LK)97°10′04″E 30°00′39″N 2 984 233.3 10.4 8月中下旬
Mid-late August昌都八宿县白马镇
Baima Township, Qamdo City(BM)96°55′56″E 30°03′47″N 3 240 233.3 10.4 9月上旬
Early September林芝察隅县古玉乡
Guyu Township, Nyingchi(GY)97°10′44″E 29°16′31″N 3 310 793.9 13.3 9月中下旬
Mid-late September林芝波密县松宗镇
Songzong Township, Nyingchi(SZ)96°16′20″E 29°37′49″N 3 230 900.0 8.5 8月下旬
Late August林芝林芝县布久乡
Bujiu Township, Nyingchi(BJ)94°23′30″E 29°35′24″N 2 927 654.0 8.5 9月中下旬
Mid-late September林芝米林县扎绕乡
Zharao Township, Nyingchi(ZR)94°21′17″E 29°19′28″N 2 912 641.0 8.2 9月中下旬
Mid-late September林芝米林县派镇
Paizhen Township, Nyingchi(PZ)94°52′26″E 29°30′54″N 2 864 641.0 8.2 9月中下旬
Mid-late September林芝米林县羌纳乡
Qiangna Township, Nyingchi(QN)94°30′17″E 29°25′34″N 2 881 641.0 8.2 9月中下旬
Mid-late September林芝工布江达县巴河镇
Bahe Township, Nyingchi(BH)93°39′47″E 29°51′35″N 3 125 808.0 8.3 9月中下旬
Mid-late September林芝朗县朗镇
Lang Township, Nyingchi(LZ)92°55′44″E 29°04′08″N 3 118 600.0 8.2 8月中旬
Mid August拉萨曲水县才纳乡
Caina Township, Lhasa City(CN)90°59′44″E 29°26′07″N 3 740 440.0 7.4 9月中下旬
Mid-late September 下载: 导出CSV
表 2 18个种群光核桃果实表型性状方差分析
Table 2 ANOVA results of fruit phenotypic characters of A. mira from 18 populations
表型性状
Phenotypic trait均方 Mean square F 种群间
Between populations种群内
Within population随机误差
Random error种群间
Between populations种群内
Within population果实质量 Fruit mass(FWT) 5301.46 247.52 6.94 21.42** 35.66** 纵径 Fruit length(FL) 1273.28 65.70 2.68 19.38** 24.50** 横径 Fruit width(FWH) 2245.02 87.78 2.53 25.58** 34.70** 侧径 Fruit thickness(FT) 2642.09 89.83 2.77 29.41** 32.47** 果核质量 Nut mass(NWT) 10.48 1.10 0.04 9.50** 26.06** 果核长 Nut length(NL) 728.61 27.23 1.32 26.76** 20.70** 果核宽 Nut width(NWH) 518.54 17.72 0.79 29.26** 22.43** 果核厚 Nut thickness(NT) 527.29 6.07 0.32 86.92** 19.24** 果肉厚 Pulp thickness(PT) 3237.64 68.85 2.38 47.03** 28.89** 出核率 Nuclear rate(NR) 1 935.73 38.61 1.46 50.14** 26.39** 注:种群间自由度(df)为17;种群内的自由度(df)为216;随机误差的自由度(df)为4 446。**代表差异极显著,P < 0.01;*代表差异显著,P < 0.05。Notes:the degree of freedom (df) among populations is 17, the degree of freedom (df) within population is 216, the degree of freedom (df) of the random error is 4 446. ** represents very significant difference, P < 0.01; * represents significant difference, P < 0.05.
下载: 导出CSV
表 3 光核桃果实表型性状种群间和种群内方差分量与种群间表型分化系数(VST)
Table 3 Variance components and phenotypic differentiation coefficients(VST)of fruit phenotypic traits among A. mira populations and within population
表型性状
Phenotypic trait方差分量
Variance component方差分量百分比
Percentage of variance component/%VST/% 种群间
Between populations种群内
Within population随机误差
Random error种群间
Between populations种群内
Within populationFWT 38.88 24.06 6.94 55.64 34.43 61.77 FL 9.29 6.30 2.68 50.84 34.49 59.58 FWH 16.59 8.53 2.53 60.02 30.83 66.06 FT 19.63 8.71 2.77 63.12 27.99 69.28 NWT 0.07 0.11 0.04 32.71 48.10 40.48 NL 5.40 2.59 1.32 58.00 27.86 67.55 NWH 3.85 1.69 0.79 60.81 26.72 69.47 NT 4.01 0.58 0.32 81.83 11.74 87.46 PT 24.38 6.65 2.38 72.97 19.90 78.58 NR 14.59 3.71 1.46 73.81 18.79 79.71 平均 Mean — — — 60.98 28.09 67.99
下载: 导出CSV
表 4 光核桃果实表型性状的相关系数
Table 4 Correlation coefficients between fruit phenotypic traits of A. mira
表型性状
Phenotypic traitFWT FL FWH FT NWT NL NWH NT PT NR FWT 1 0.94** 0.99** 0.99** 0.54* − 0.07 0.12 − 0.06 0.91** − 0.87** FL 1 0.94** 0.94** 0.54* 0.10 0.20 0.06 0.83** − 0.78** FWH 1 0.99** 0.51* − 0.13 0.08 − 0.09 0.93** − 0.89** FT 1 0.48* − 0.08 0.11 − 0.03 0.92** − 0.90** NWT 1 0.40 0.47* 0.23 0.34 − 0.15 NL 1 0.90** 0.90** − 0.44 0.35 NWH 1 0.94** − 0.28 0.16 NT 1 − 0.43 0.26 PT 1 − 0.92** NR 1 注:**表示在0.01水平下显著相关;*代表在0.05水平下显著相关。Notes: ** means the correlation is significant at 0.01 level; * means the correlation is significant at 0.05 level.
下载: 导出CSV
表 5 18个种群光核桃果实表型性状的均值和变异系数
Table 5 Means and CV (coefficient of variation) values of 10 phenotypic traits within 18 A. mira populations
表型性状
Phenotypic traitSYD AR LD LZ DB QD MX LK BM GY SZ BJ ZR JT CN PZ QN BH 均值
MeanFWT ˉX/g 8.90 22.44 16.25 24.43 9.68 9.30 19.21 21.48 15.91 8.37 12.70 20.70 23.94 28.48 22.63 20.31 26.90 20.86 18.47 CV/% 34.16 27.64 17.19 30.77 43.92 21.00 22.38 21.31 16.20 29.60 25.49 19.03 22.26 31.49 22.79 26.61 28.97 13.72 25.25 FL ˉX/mm 27.40 33.48 30.35 33.14 25.49 28.24 32.58 33.59 29.87 27.39 30.53 33.14 34.69 36.56 31.28 32.89 36.36 33.91 31.72 CV/% 10.05 9.39 6.57 10.99 11.28 5.98 8.39 7.87 6.14 6.76 7.26 6.06 6.21 9.73 6.00 8.83 8.39 5.66 7.86 FWH ˉX/mm 24.97 33.64 30.48 34.55 24.95 25.54 30.80 32.86 28.59 23.25 27.41 32.68 34.41 36.76 33.62 32.98 36.07 33.09 30.92 CV/% 12.65 9.87 7.13 11.30 14.52 7.36 9.60 8.31 6.76 8.82 8.02 7.31 8.58 12.38 7.69 10.11 10.79 5.53 9.26 FT ˉX/mm 23.63 33.34 29.15 33.34 23.74 23.99 30.71 31.82 28.87 22.84 26.29 33.26 34.71 36.02 33.53 32.85 36.17 33.49 30.43 CV/% 13.09 10.60 6.97 10.16 14.46 8.69 10.30 14.15 6.80 10.84 8.89 5.16 8.31 11.68 8.06 10.02 9.67 4.99 9.60 NWT ˉX/g 1.31 1.90 1.43 1.77 1.06 1.57 1.61 2.37 1.80 1.55 1.54 1.56 1.49 1.88 1.79 1.48 1.77 1.39 1.63 CV/% 18.96 25.80 19.51 22.61 35.88 13.47 21.08 15.06 12.76 16.65 24.53 15.87 20.03 19.00 18.88 23.57 18.69 23.58 20.33 NL ˉX/mm 19.99 22.12 13.83 14.94 17.66 21.30 21.09 22.46 21.55 22.11 21.37 19.24 19.93 20.93 18.82 18.93 20.72 19.60 19.81 CV/% 9.39 8.96 11.94 10.04 10.10 7.18 9.37 5.70 6.69 7.29 6.84 7.34 8.74 10.59 7.42 7.99 6.43 8.47 8.36 NWH ˉX/mm 15.77 17.83 9.99 11.19 13.93 15.93 14.43 17.68 16.11 15.68 16.08 15.14 15.26 17.05 16.52 15.11 16.40 14.88 15.28 CV/% 7.49 11.19 8.24 13.81 8.29 5.22 6.74 5.79 6.20 6.12 9.60 8.52 8.95 9.08 8.69 10.03 9.13 9.04 8.45 NT ˉX/mm 11.37 11.38 4.48 5.24 9.16 11.10 10.18 11.61 10.78 11.43 10.67 10.81 10.46 10.92 11.22 10.60 11.07 10.28 10.15 CV/% 5.18 10.08 17.59 16.53 11.11 5.53 7.93 6.03 5.70 4.28 7.83 7.06 5.63 5.90 6.71 7.77 7.56 8.30 8.15 PT ˉX/mm 12.26 21.96 24.68 28.10 14.58 12.89 20.52 20.22 18.09 11.41 15.63 22.45 24.25 25.10 22.31 22.25 25.10 23.21 20.28 CV/% 21.72 12.87 5.61 10.06 18.37 15.00 16.06 22.15 8.72 19.24 13.87 5.43 10.04 15.25 10.40 12.22 11.47 6.01 13.03 NR/% ˉX 15.60 8.67 8.83 7.56 11.55 17.29 8.95 11.44 11.52 19.33 12.55 7.64 6.33 7.07 8.09 7.43 6.87 6.67 10.19 CV 19.93 16.93 10.83 19.11 17.33 15.69 35.33 20.23 8.28 17.91 20.36 8.05 13.87 23.97 12.33 11.41 19.86 14.46 16.99 ¯CV /%15.26 14.33 11.16 15.54 18.53 10.51 14.72 12.66 8.43 12.75 13.27 8.98 11.26 14.91 10.90 12.86 13.10 9.98 注: ˉX 为平均值;CV为变异系数;¯CV 为种群内各表型性状变异系数平均值。Notes:ˉX is mean value; CV is coefficient of variation;¯CV is the average variation coefficient of phenotypic traits in the population.
下载: 导出CSV
表 6 PC1、PC2主成分的载荷
Table 6 Main components of load PC1 and PC2
表型性状
Phenotypic trait载荷系数 Load coefficient PC1(λ=58.54%) PC2(λ=32.27%) FWT 1.126 2 0.134 2 FL 1.068 1 0.271 7 FWH 1.134 9 0.079 8 FT 1.126 0 0.125 3 NWT 0.556 2 0.621 5 NL − 0.207 7 1.088 6 NWH − 0.002 7 1.114 9 NT − 0.193 1 1.061 5 PT 1.095 1 − 0.315 2 NR − 1.038 6 0.230 5
下载: 导出CSV
表 7 RDA主成分的贡献率
Table 7 Contribution rates of RDA principal components
项目 Item RDA1 RDA2 RDA3 RDA4 RDA5 特征值
Eigenvalue4.482 4 0.919 9 0.117 9 0.056 1 0.024 3 贡献率
Contribution rate/%44.82 9.20 1.18 0.56 0.24 累计贡献率
Cumulative contribution rate/%44.82 54.02 55.20 55.76 56.00
下载: 导出CSV
表 8 生态因子与主成分RDA1、RDA2的相关性分析
Table 8 Correlation analysis of ecological factors and principal components of RDA1 and RDA2
生态因子Ecological factor RDA1 RDA2 R2 P E − 0.936 38 0.350 99 0.159 8 0.254 N 0.832 07 0.554 67 0.093 9 0.487 H − 0.847 67 0.530 52 0.056 3 0.653 R − 0.713 40 − 0.700 76 0.089 5 0.482 T − 0.481 89 0.876 23 0.302 3 0.049 *
下载: 导出CSV
表 9 果肉厚、出核率与生态因子的多元回归方程
Table 9 Multiple regression equations of pulp thickness, nut rate and geographical meteorological factors
表型性状
Phenotypic trait回归方程
Regression equation调整后判定系数
Adjusted R2P值
P valuePT Y = 58.104 9 − 2.139 4x1 + 6.783 5x2 − 0.010 8x3 − 0.006 2x4 + 0.310 5x5 0.599 3 0.004 9 NR Y = − 8.888 7 + 1.534 8x1 − 5.421 8x2 + 0.009 1x3 + 0.003 5x4 + 0.302 9x5 0.798 1 0.000 1 注:x1.经度;x2. 纬度;x3. 海拔;x4. 年均降雨量;x5. 年均温。Notes: x1 is longitude; x2 is latitude; x3 is elevation; x4 is annual mean rainfall; x5 is annual mean temperature.
下载: 导出CSV
-
[1] 钟政昌, 王婷, 高根升, 等. 自然温度下光核桃果酒主发酵工艺优化[J]. 食品科学, 2012, 33(13):197−201. Zhong Z C, Wang T, Gao G S, et al. Optimization of fermentation process for Prunus mira Koehne wine at natural temperature by response surface methodology[J]. Food Science, 2012, 33(13): 197−201.
[2] 谭江平, 曾秀丽, 廖明安. 西藏光核桃自然居群遗传多样性的SRAP分析[J]. 草业学报, 2012, 21(6):213−220. doi: 10.11686/cyxb20120628 Tan J P, Zeng X L, Liao M A. Genetic diversity of natural Prunus mira populations detected by SRAP[J]. Acta Prataculturae Sinica, 2012, 21(6): 213−220. doi: 10.11686/cyxb20120628
[3] 郭其强, 罗大庆, 王贞红, 等. 光核桃幼苗光合特性和保护酶对干旱胁迫的响应[J]. 西北农林科技大学学报(自然科学版), 2010, 38(6):138−144. Guo Q Q, Luo D Q, Wang Z H, et al. Photosynthetic characteristics and protective enzyme activities of Prunus mira seedlings to drought stress[J]. Journal of Northwest A&F University (Natural Science Edition), 2010, 38(6): 138−144.
[4] 侯常伟, 白涛, 王忆, 等. Uv-b辐射对光核桃光合作用和内源激素水平的影响[J]. 中国农学通报, 2012, 28(22):184−189. doi: 10.11924/j.issn.1000-6850.2012-1872 Hou C W, Bai T, Wang Y, et al. Influence of ultraviolet radiation on photosynthesis and hormone levels in Prunus mira Koehne[J]. Chinese Agricultural Science Bulletin, 2012, 28(22): 184−189. doi: 10.11924/j.issn.1000-6850.2012-1872
[5] 包文泉, 乌云塔娜, 杜红岩, 等. 基于SSR标记的西藏光核桃群体遗传多样性和遗传结构分析[J]. 林业科学, 2018, 54(2):30−41. doi: 10.11707/j.1001-7488.20180204 Bao W Q, Wuyuntana, Du H Y, et al. Genetic diversity and population structure of Amygdalus mira in the Tibet Plateau in China based on SSR markers[J]. Scientia Silvae Sinicae, 2018, 54(2): 30−41. doi: 10.11707/j.1001-7488.20180204
[6] Guan F, Wang S, Li R, et al. Genetic diversity of wild peach (Prunus mira Koehne kov et. kpst) from different altitudes in the Tibetan Plateau by pollen morphous and rapd markers[J]. Hortscience, 2014, 49(8): 1017−1022. doi: 10.21273/HORTSCI.49.8.1017
[7] Peng M, Guan F, Tao L, et al. Analysis of genetic relationship on Amygdalus mira (Koehne) ricker with other peach species using simple sequence repeat (SSR)[J]. Biochemical Systematics & Ecology, 2015, 62: 98−105.
[8] 钟政昌, 方江平, 钟国辉. 土壤因子与西藏光核桃果实品质的关系[J]. 林业科技开发, 2009, 23(5):44−47. doi: 10.3969/j.issn.1000-8101.2009.05.011 Zhong Z C, Fang J P, Zhong G H. Relationship between soil nutrient and Prunus mira Koehne fruit quality[J]. China Forestry Science and Technology, 2009, 23(5): 44−47. doi: 10.3969/j.issn.1000-8101.2009.05.011
[9] 钟政昌, 方江平. 液固串淋法生产光核桃果醋的工艺[J]. 食品研究与开发, 2011, 32(3):94−96. doi: 10.3969/j.issn.1005-6521.2011.03.026 Zhong Z C, Fang J P. Liquid & solid cross-sprinkling fermentation in producing Prunus mira Koehne vinegar[J]. Food Research and Development, 2011, 32(3): 94−96. doi: 10.3969/j.issn.1005-6521.2011.03.026
[10] 郝海平, 姜闯道, 石雷, 等. 根系温度对光核桃幼苗光合机构热稳定性的影响[J]. 植物生态学报, 2009, 33(5):984−992. doi: 10.3773/j.issn.1005-264x.2009.05.018 Hao H P, Jiang C D, Shi L, et al. Effects of root temperature on thermostability of photosynthetic apparatus in Prunus mira seedlings[J]. Chinese Journal of Plant Ecology, 2009, 33(5): 984−992. doi: 10.3773/j.issn.1005-264x.2009.05.018
[11] 罗达尚.中华藏本草[M]. 北京: 民族出版社, 1997: 122−123. Luo D S. Chinese Tibetan materia medica[M]. Beijing:The Ethnic Publishing House, 1997:122−123.
[12] 魏丽萍, 钟政昌, 李明. 光核桃仁脂肪油的提取与其理化性质分析[J]. 经济林研究, 2013, 31(3):136−139. doi: 10.3969/j.issn.1003-8981.2013.03.027 Wei L P, Zhong Z C, Li M. Extraction and physicochemical properties of fatty oil in Prunus mira kernel[J]. Nonwood Forest Research, 2013, 31(3): 136−139. doi: 10.3969/j.issn.1003-8981.2013.03.027
[13] 刘侠, 陈碧, 白艳霞. 桃核直接作为生物吸附材料对水中亚甲基蓝的吸附研究[J]. 科学技术与工程, 2015, 15(12):118−122. doi: 10.3969/j.issn.1671-1815.2015.12.020 Liu X, Chen B, Bai Y X. Study on adsorption of peach core directly as a biological adsorption material on methylene blue in aqueous solution[J]. Science Technology and Engineering, 2015, 15(12): 118−122. doi: 10.3969/j.issn.1671-1815.2015.12.020
[14] 包文泉, 乌云塔娜, 杜红岩, 等. 西藏光核桃表型性状遗传多样性分析[J]. 分子植物育种, 2018, 16(16):5463−5473. Bao W Q, Wuyuntana, Du H Y, et al. Genetic diversity analysis of Amygdalus mira from the Tibet Plateau in China based on phenotypic traits[J]. Molecular Plant Breeding, 2018, 16(16): 5463−5473.
[15] Pigliucci M, Murren C J, Schlichting C D. Phenotypic plasticity and evolution by genetic assimilation[J]. Journal of Experimental Biology, 2006, 209(12): 2362−2367. doi: 10.1242/jeb.02070
[16] Li M, Zhao Z, Miao X J, et al. Genetic diversity and population structure of Siberian apricot (Prunus sibirical) in China[J/OL]. International Journal of Molecular Sciences, 2014, 15(1), 377. [2019−10−25]. https://www.mdpi.com/1422-0067/15/1/377/pdf.
[17] 张彩霞, 明军, 刘春, 等. 岷江百合天然群体的表型多样性[J]. 园艺学报, 2008, 35(8):1183−1188. doi: 10.3321/j.issn:0513-353X.2008.08.013 Zhang C X, Ming J, Liu C, et al. Phenotypic variation of natural populations in Lilium regale Wilson[J]. Acta Horticulturae Sinica, 2008, 35(8): 1183−1188. doi: 10.3321/j.issn:0513-353X.2008.08.013
[18] Jie Z, Zheng H, Gan S, et al. Phenotypic variation in natural populations of Betula alnoides in Guangxi, China[J]. Scientia Silvae Sinicae, 2005, 41(2): 59−65.
[19] Cantin C M, Gogorcena Y, Moreno M A. Phenotypic diversity and relationships of fruit quality traits in peach and nectarine (Prunus persica (L.) Batsch) breeding progenies[J]. Euphytica, 2010, 171(2): 211−226. doi: 10.1007/s10681-009-0023-4
[20] Dicenta F, Garcia J E, Carbonell E A. Heritability of fruit characters in almond[J]. Journal of Horticultural Science, 1993, 68(1): 121−126. doi: 10.1080/00221589.1993.11516335
[21] 冯秋红, 史作民, 徐静茹, 等. 岷江柏天然种群种实表型变异特征[J]. 应用生态学报, 2017, 28(3):748−756. Feng Q H, Shi Z M, Xu J R, et al. Phenotypic variations in cones and seeds of natural Cupressus chengiana populations in China[J]. Chinese Journal of Applied Ecology, 2017, 28(3): 748−756.
[22] Shih K M, Chang C T, Chung J D, et al. Adaptive genetic divergence despite significant isolation-by-distance in populations of Taiwan cow-tail fir (Keteleeria davidiana var. formosana) [J/OL]. Frontiers in Plant Science, 2018, 9: 92 [2019−09−20]. https://sci-hub.tw/10.3389/fpls.2018.00092#.
[23] Zhao Y, Vrieling K, Liao H, et al. Are habitat fragmentation, local adaptation and isolation-by-distance driving population divergence in wild rice Oryza rufipogon?[J]. Molecular Ecology, 2013, 22(22): 5531−5547. doi: 10.1111/mec.12517
[24] Ruan Y, Huang B H, Lai S J, et al. Population genetic structure, local adaptation, and conservation genetics of Kandelia obovata[J]. Tree Genetics & Genomes, 2013, 9(4): 913−925.
[25] Khadivi-Khub A, Etemadi-Khah A. Phenotypic diversity and relationships between morphological traits in selected almond (Prunus amygdalus) germplasm[J]. Agroforest Syst, 2015, 89: 205−216. doi: 10.1007/s10457-014-9754-x
[26] 林玲, 王军辉, 罗建, 等. 砂生槐天然群体种实性状的表型多样性[J]. 林业科学, 2014, 50(4):137−143. Lin L, Wang J H, Luo J, et al. Phenotypic diversity of seed and fruit traits in natural populations of Sophora moorcroftiana[J]. Scientia Silvae Sinicae, 2014, 50(4): 137−143.
[27] Bonser S P. Plant phenotypic plasticity in a changing climate[J]. Trends in Plant Science, 2010, 15(12): 684−692. doi: 10.1016/j.tplants.2010.09.008
[28] 张永兵, 李寐华, 吴海波, 等. 新疆甜瓜地方品种资源的表型遗传多样性[J]. 园艺学报, 2012, 39(2):305−314. Zhang Y B, Li M H, Wu H B, et al. Genetic diversity of melon landraces (Cucumis melo L.) in Xinjiang based on phenotypic characters[J]. Acta Horticulturae Sinica, 2012, 39(2): 305−314.
[29] 杜会聪, 蒋雅婷, 田敏, 等. 浙江省野生蜡梅花部形态变异及其与环境因子的相关性[J]. 生态学报, 2018, 38(16):5800−5809. Du H C, Jiang Y T, Tian M, et al. Morphological variation in flowers of wild populations of Chimonanthus praecox in Zhejiang Province and its correlation with environment factors[J]. Acta Ecologica Sinica, 2018, 38(16): 5800−5809.
[30] 杜宁, 张秀茹, 王炜, 等. 荆条叶性状对野外不同光环境的表型可塑性[J]. 生态学报, 2011, 31(20):6049−6059. Du N, Zhang X R, Wang W, et al. Foliar phenotypic plasticity of a warm-temperate shrub, Vitex negundo var.heterophylla, to different light environments in the field[J]. Acta Ecologica Sinica, 2011, 31(20): 6049−6059.
[31] 沈涛, 申仕康, 张霁, 等. 三七表型变异及其对气候因子的响应[J]. 热带亚热带植物学报, 2017, 25(5):445−455. doi: 10.11926/jtsb.3724 Shen T, Shen S K, Zhang J, et al. Phenotypic variation of Panax notoginseng and response to climatic factors[J]. Journal of Tropical and Subtropical Botany, 2017, 25(5): 445−455. doi: 10.11926/jtsb.3724
[32] 李洪果, 陈达镇, 许靖诗, 等. 濒危植物格木天然种群的表型多样性及变异[J]. 林业科学, 2019, 55(4):72−86. Li H G, Chen D Z, Xu J S, et al. Phenotypic diversity and variation in natural populations of Erythrophleum fordii, an endangered plant species[J]. Scientia Silvae Sinicae, 2019, 55(4): 72−86.
[33] 王晓军, 程绍敏. 西藏主要气候特征分析[J]. 高原山地气象研究, 2009, 29(4):81−84. doi: 10.3969/j.issn.1674-2184.2009.04.014 Wang X J, Cheng S M. Analysis of major climatic features in Tibet[J]. Plateau and Mountain Meteorology Research, 2009, 29(4): 81−84. doi: 10.3969/j.issn.1674-2184.2009.04.014
[34] 赵玉萍, 邹志荣, 杨振超, 等. 不同温度和光照对温室番茄光合作用及果实品质的影响[J]. 西北农林科技大学学报(自然科学版), 2010, 38(5):125−130. Zhao Y P, Zou Z R, Yang Z C, et al. Effect of temperature and light to tomato photosynthesis and quality in greenhouse[J]. Journal of Northwest A&F University (Natural Science Edition), 2010, 38(5): 125−130.
[35] 齐国亮, 苏雪玲, 郑国琦, 等. 气象因子对宁夏枸杞果实生长及多糖含量的影响[J]. 植物学报, 2016, 51(3):311−321. doi: 10.11983/CBB15041 Qi G L, Su X L, Zheng G Q, et al. Effect of meteorological factor on fruit growth and accumulation of polysaccharides in Lycium barbarum[J]. Chinese Bulletin of Botany, 2016, 51(3): 311−321. doi: 10.11983/CBB15041
-
期刊类型引用(2)
1. 谷国泽,宋魁彦. 水性清漆涂饰对皮影表面的装饰效果. 家具. 2025(01): 19-22 .  百度学术
百度学术
2. 钟成龙,侯贤锋,卓光武,高振忠,涂登云,胡传双. 重组竹表面涂饰工艺研究. 竹子学报. 2023(02): 41-47 . 百度学术
其他类型引用(2)


计量
- 文章访问数: 1700
- HTML全文浏览量: 637
- PDF下载量: 62
- 被引次数: 4
