
Relationship model between stand mean height and mean DBH for natural Quercus spp. broadleaved mixed stands
-
摘要:目的 考虑天然混交林的林分密度、直径结构和树种结构,基于代数差分方程构建最适宜的林分平均高与平均胸径关系模型,为天然混交林的立地生产力估计与可持续经营提供理论依据。方法 以吉林省天然栎类阔叶混交林为研究对象,利用4期连续调查固定样地数据,基于Richards方程构建4种数据结构类型即typeC、typeD、typeE和typeF的基础代数差分方程,比较分析得出最优数据结构类型;基于最优数据结构类型,以5个林分密度指标即林木株数(N)、林分断面积(BA)、林分密度指数(SDIr)、可加林分密度指数(SDIa)和郁闭度(CD),5个直径多样性指数即Shannon均匀度指数(ShaI)、Simpson指数(SimI)、McIntosh均匀度指数(MceI)、Gini系数(GinI)和Berger-Parker指数(BerI),4个树种多样性指数即ShaI、SimI、MceI和BerI,构建并比较分析不同多样性代数差分方程的差异,得出最佳方程为最适宜林分平均高与平均胸径关系模型。结果 不同数据结构类型的建模效果由好到差排序:typeD > typeC > typeF > typeE。除了typeC,其他3个数据结构类型的模型参数b和r均显著不为零(P < 0.01),说明typeD拟合的模型参数检验效果最佳。林分密度指标SDIr的建模效果最好。无论使用哪个林分密度指标,其模型参数b0、r和cSD均显著(P < 0.01),说明5个林分密度指标的模型参数检验效果均比较理想。直径多样性指数ShaI的建模效果最好。除了GinI,其他4个直径多样性指数的模型参数b0、r、cSDIr和cDI均显著(P < 0.01),表明ShaI、SimI、MceI和BerI均为较理想的直径多样性指数。4个树种多样性指数的建模拟合效果和检验数据效果差别不大。BerI的模型参数b0、r、cSDIr、cShaI和cSP均显著(P < 0.01),说明BerI是较理想的树种多样性指数。ShaI、SimI和MceI的模型参数b0、r、cSDIr、cShaI和cSP均不能同时达到0.05显著水平,说明ShaI、SimI和MceI是不理想的树种多样性指数。结论 typeD是最优的数据结构类型,林分密度、直径多样性和树种多样性对模型均有影响。其中,林分密度指标SDIr、直径多样性指数ShaI和树种多样性指数BerI建立的多样性代数差分方程拟合效果最佳,为最适宜的天然栎类阔叶混交林林分平均高与平均胸径关系模型。Abstract:Objective Considering stand density, diameter structure and tree species structure, the optimal model for stand mean height and mean DBH relationship was constructed using algebraic difference approach. It may provide a theoretical basis for site productivity estimation and sustainable management of natural mixed forests.Method Base algebraic difference approaches were modeled with 4 different data structure types, i.e. typeC, typeD, typeE and typeF based on Richards model using 4 inventory data of permanent sample plots in natural Quercus spp. broadleaved mixed stands. The 4 different base algebraic difference approaches were comparatively analyzed to get the optimal data structure type. Algebraic difference approach of diversity indices was constructed based on the optimal data structure type using 5 different stand density indices, including tree number (N), stand basal area (BA), stand density index (SDIr), additive stand density index (SDIa) and canopy density (CD), and the 5 different diameter diversity indices including Shannon evenness index (ShaI), Simpson index (SimI), McIntosh evenness index (MceI), Gini coefficient (GinI) and Berger-Parker index (BerI), and the 4 different species diversity indices including ShaI, SimI, MceI and BerI. The algebraic difference approach of diversity indices was comparatively analyzed to obtain the optimize algebraic difference approaches, i.e. the optimize stand mean height and mean DBH relationship.Result Model fitting effects of calibration data in different data structure types were sorted from best to worst, and the ranking was: typeD > typeC > typeF > typeE. Except for typeC, model coefficients b and r of the other three data structure types were significant (P < 0.01), indicating that the model fitting effects of typeD were the best. Model fitting effects of SDIr were the best. Model coefficients b0, r and cSD were significant (P < 0.01), regardless of which stand density index was used, indicating that model fitting effects of the 5 different stand density indices were reasonable. Model fitting effect of ShaI was the best. Except for GinI, model coefficients b0, r, cSDIr and cDI of the other 4 diameter diversity indices were significant (P < 0.01), indicating that model fitting effects of ShaI, SimI, MceI and BerI were reasonable. Model fitting and validation effects had little difference among the 4 species diversity indices. Model coefficients b0, r, cSDIr, cShaI and cSP of BerI were significant (P < 0.01), indicating that BerI was reasonable. However, model coefficients b0, r, cSDIr, cShaI and cSP of ShaI, SimI and MceI were not significant at the level of 0.05, indicating that ShaI, SimI and MceI were not reasonable.Conclusion TypeD is the best data structure type, stand density, diameter diversity and species diversity were significant for algebraic difference approach. Moreover, the model fitting effects of algebraic difference approach within SDIr, ShaI and BerI are the best, which is served as the optimize stand mean height and mean DBH relationship in natural Quercus spp.
broadleaved mixed stands. -
干旱是限制我国北方干旱半干旱气候区植被建设的最主要环境因素之一[1]。干旱引起植物细胞原生质脱水、膜脂过氧化和膜结构被破坏,细胞发生机械损伤,进而导致植物生长受抑制,甚至发生萎蔫死亡,因此,对植物抗旱性的评价和品种筛选是干旱地区植物引种栽培的必要技术环节。国内外针对植物抗旱性,从表型特征、光合生理过程、抗氧化酶系统、渗透调节和激素调节等多方面开展了研究[2-6],并总结出了抗旱性评价指标体系、量级方法和标准。然而,植物的抗旱机制在不同干旱程度下具有差异化表现[7] ,研究表明[8]在轻中度干旱下,光合作用相关基因的表达量上调以维持较高光合速率,但在重度干旱下,该调节机制不再发生,而是转变为以渗透调节或提升抗氧化系统活性为主的抗旱机制。因此,对不同程度干旱胁迫下植物多性状的综合监测,是全面掌握植物抗逆机制、实现客观抗逆评价的基础,也能为我国西北干旱、半干旱区生态建设的植物种筛选提供理论依据和技术支撑。
油莎豆(Cyperus esculentus var. sativus
)又名油莎草,为莎草科一年生草本油料作物,原产于非洲东北部,在我国新疆一带也有少量分布,因其具有防风固沙及土壤培肥[9]的作用,已经成为脆弱生态系统恢复中的选用物种,并在我国干旱、半干旱荒漠化地区开始种植。然而,现阶段关于油莎豆对干旱逆境胁迫的响应及适应性机制研究不足[10],这直接制约了油莎豆在该区域的引种和栽培管理。 故本研究通过模拟不同土壤干旱程度,监测油莎豆在各干旱程度下的表型生长和光合生理参数,对其进行抗旱性综合评价;分析不同程度下抗氧化酶活性系统调节、渗透调节和激素调节的权衡响应,以揭示其抗旱机制,为油莎豆在北方的引种种植提供理论依据。
1. 研究区概况
本研究在北京林业大学水土保持学院宁夏盐池毛乌素沙地生态系统国家定位观测站进行,该观测站位于我国半干旱地区毛乌素沙地西南缘的宁夏盐池县(37°52′N,107°22′E),该区域年均气温7.77 ℃,无霜期140 d,≥ 10 ℃的年均积温为2944.9 ℃;年均降水量约为292 mm;年均潜在蒸发量为2024 mm,约为年均降水量的7倍。土壤类型是风沙土。植被类型以荒漠草原植被为主体,主要建群种有油蒿(Artemisia ordosica)、杨柴(Hedysarum mongolicum)、沙柳(Salix psammophila)等灌木物种,以及沙生针茅(Stipa glareosa)、赖草(Leymus secalinus)等禾草类物种。
2. 材料与方法
2.1 试验材料与试验设计
2020年5月底在宁夏盐池毛乌素沙地进行穴盘播种。将油莎豆种子播种于盛有沙土的穴盘中,每穴播种1粒,待出苗15 d后移植到直径35 cm、高40 cm花盆中,每盆1株。缓苗10 d后,选取长势一致的幼苗作为供试材料进行干旱胁迫处理。
通过控制土壤含水率来模拟不同干旱胁迫程度。按照土壤水势从田间持水率(水势为0 MPa)到萎蔫系数(水势为−0.5 MPa)均匀划分为4个等级。经测定可知,本研究区风沙土土壤田间持水率为(12.0 ± 0.4)%,土壤水势−0.5 MPa时对应的土壤质量含水率为1.9%,故干旱胁迫试验设置正常供水(CK)、轻度干旱(LD)、中度干旱(MD)和重度干旱(SD)4个处理区间,其土壤含水量分别控制在 > 12%、8% ~ 12%、5% ~ 8%和 < 5%。向各盆加水使盆内土壤含水量达到处理水平并记录质量,之后每间隔1 d用电子秤(精度0.005 kg)称量并记录各桶质量,补充水分至各个处理水平的土壤水分含量,处理期间除桶内土壤水分处理之外其他管理一致。试验采用完全随机设计,每个水平设置20盆重复,分别用于表型生长指标、光合生理参数和抗逆生理生化指标测定。胁迫处理2周后进行光合生理参数和抗逆生化指标测定。待9月植株完全成熟结实后,挖取整株,获取表型生长和生物量数据。
2.2 指标测定
2.2.1 表型生长指标
每个处理随机选取6株重复进行生长指标测定。用刻度尺测量株高(沙面以上为株高)和冠幅,并统计分蘖数和果实数。之后将整株植物取出,将地上和地下部分离,洗净后分别放入105 ℃的烘箱中杀青10 mins,80 ℃烘干至恒质量,称量得地上生物量与地下生物量。根据下列公式计算植株根冠比:
根冠比 = 地下生物量/地上生物量
2.2.2 光合生理指标
选择晴朗无风日,于10:00—14:00进行光合生理指标测定,每个处理随机选取3 ~ 5株的叶片作为重复,测定指标包括叶片蒸腾速率(Tr)、净光合速率(Pn)、气孔导度(Gs),以上指标均采用LI-6400便携式光合测定仪(LI-COR, Lincoln, USA)测定。基于净光合速率和蒸腾速率值,计算叶片尺度的水分利用效率(WUE),具体公式如下:
WUE=Pn/Tr 另取3 ~ 5株收获其叶片,采用由德国IBL公司提供的试剂盒方法测定叶片PEP羧化酶活性[11]。
2.2.3 抗逆调节生化指标
每个处理随机取3 ~ 5株作为重复,分别获取叶片和根系样品进行抗氧化酶系统、渗透调节、激素调节相关指标的测定。
采用愈创木酚法测定过氧化物酶(POD)活性,采用碘液滴定法测定抗坏血酸过氧化物酶(APX)活性。
采用高效液相色谱法(HPLC)测定渗透调节物质甜菜碱(GB)含量。
采用酶联免疫法(ELISA)测定激素调节物质脱落酸(ABA)含量[12]。
2.3 油莎豆抗旱性分析
植物的抗旱性评价不仅和抗旱鉴定指标的选取有关[13],还和与这些指标之间密切程度有关。因此本文采用灰色关联度分析和隶属函数分析的方法[14-16]计算参试材料的综合抗旱能力,具体方法如下:
D=n∑j=1[μ(Xj)⋅|rj|/n∑j=1|rj|],(j=1,2,3,⋯,n) (1) μ(Xj)=Xj−Xjmin (2) \mu ({X_j}) = 1 - \dfrac{{{X_j} - {X_{j\min }}}}{{{X_{j\max }} - {X_{j\min }}}} (3) 式中:D值为参试材料利用综合生理指标体系评价所得的抗旱性度量值;rj为参试材料第j个指标权重,该值的获取采用灰色关联分析法计算得到,rj值越大,表示指标与抗旱性关系越紧密;μ(Xj)为第j个指标的隶属函数值,若指标和抗旱性呈正相关,则采用(2)式计算,若负相关,则采用(3)式计算;X j为第j个的指标测定值,X jmin和X jmax分别为第j个指标的最小值和最大值。
2.4 数据处理
采用SPSS 22.0软件进行数据处理,对不同胁迫水平的油莎豆生长指标、光合参数和抗逆生化指标进行单因素方差分析(one-way ANOVA),LSD法进行多重检验,显著性水平为P < 0.05;采用Origin 2019制图。
3. 结果与分析
3.1 干旱胁迫下油莎豆表型生长特征的变化
随干旱程度加剧,油莎豆的株高逐渐下降,在重度胁迫下达到24.6 cm,相比对照组下降约21.7%;在干旱胁迫下,冠幅显著低于对照组(P < 0.05),在中度胁迫下达到最小值0.10 m2(图1a)。果实数在中度干旱胁迫下达到最小值15.0个,为对照组的44.2%(图1b);分蘖数在重度干旱胁迫下达到最小值2.4个,为对照组的24.2%。该结果表明,干旱胁迫对油莎豆的表型生长产生了显著影响(P < 0.05),使油莎豆趋于矮小和低结实量。
![]() 图 1 不同干旱胁迫梯度对油莎豆表型生长特征的影响CK.对照;LD.轻度干旱;MD.中度干旱;SD.重度干旱。不同字母代表不同干旱处理间具有显著差异(P < 0.05)。下同。CK, control; LD, light drought; MD, moderate drought; SD, severe drought. Different letters represent significant differences between varied drought treatments (P < 0.05). The same below.Figure 1. Effects of different drought stress gradients on the growth of C. esculentus var. sativus
图 1 不同干旱胁迫梯度对油莎豆表型生长特征的影响CK.对照;LD.轻度干旱;MD.中度干旱;SD.重度干旱。不同字母代表不同干旱处理间具有显著差异(P < 0.05)。下同。CK, control; LD, light drought; MD, moderate drought; SD, severe drought. Different letters represent significant differences between varied drought treatments (P < 0.05). The same below.Figure 1. Effects of different drought stress gradients on the growth of C. esculentus var. sativus3.2 干旱胁迫对油莎豆生物量积累及分配的影响
随干旱胁迫加剧,油莎豆的地上生物量和地下生物量逐渐降低,与对照组差异显著(P < 0.05);油莎豆根冠比逐渐升高,在重度胁迫下达到最大值244.7%。由此可见,干旱胁迫下,油莎豆通过调整生物量分配,增加根冠比从而保持高吸水效率,以适应和缓解干旱造成的水分亏缺(图2)。
![]() 图 2 不同干旱胁迫梯度对油莎豆生物量积累和分配的影响Figure 2. Effects of different drought stress gradients on biomass accumulation and distribution of C. esculentus var. sativus
图 2 不同干旱胁迫梯度对油莎豆生物量积累和分配的影响Figure 2. Effects of different drought stress gradients on biomass accumulation and distribution of C. esculentus var. sativus3.3 干旱胁迫对油莎豆光合生理特性的影响
随干旱胁迫程度加剧,油莎豆的净光合速率、气孔导度、蒸腾速率以及水分利用效率均呈先升高后降低的趋势(图3)。在轻度干旱胁迫下,各指标均达到最大值,且与对照组差异显著(P < 0.05),分别为对照组的1.9、1.2、1.3和1.4倍。由此可以推断,土壤含水率8% ~ 12%的轻度胁迫下,油莎豆光合生理活性最强,即适度的干旱胁迫对油莎豆光合生理起促进作用,可以提高光合速率,增加水分利用效率。
![]() 图 3 不同干旱胁迫梯度对油莎豆光合生理指标的影响Figure 3. Effects of different drought stress gradients on photosynthetic physiologic characteristics of C. esculentus var. sativus
图 3 不同干旱胁迫梯度对油莎豆光合生理指标的影响Figure 3. Effects of different drought stress gradients on photosynthetic physiologic characteristics of C. esculentus var. sativus3.4 油莎豆抗逆生化机制对干旱胁迫的响应
图4反映了油莎豆酶系统对干旱胁迫的响应。在根系中,APX酶在轻度胁迫下显著升高(P < 0.05)并达到最大值,比对照组高出44.4%,之后随干旱程度加剧而持续缓慢下降(图4a);POD酶活性随干旱程度加剧而持续上升(图4b),在重度胁迫下达到最大值,比对照组高出58.3%(P < 0.05)。在叶片中,APX酶和POD酶的活性随干旱程度加剧呈现波动上升的趋势,并均在重度胁迫下达到最高值,分别比对照组高出64.1%和52.3%(P < 0.05)。该结果表明,干旱胁迫激发了根系和叶片中的APX和POD抗氧化酶的活性,以减少活性氧对植物的伤害。
![]() 图 4 不同干旱胁迫梯度下油莎豆酶系统活性变化Figure 4. Changes of enzyme system activity in C. esculentus var. sativus under different drought stress gradients
图 4 不同干旱胁迫梯度下油莎豆酶系统活性变化Figure 4. Changes of enzyme system activity in C. esculentus var. sativus under different drought stress gradients根系PEP羧化酶活性随干旱胁迫加剧呈先升高后降低趋势(图4c),在中度胁迫达到最大值,为对照组的1.4倍(P < 0.05),即适度干旱胁迫下,油莎豆通过增大PEP羧化酶活性维持光合速率,而重度胁迫下,该酶调节能力下降。
图5反映了干旱胁迫下油莎豆渗透调节物质甜菜碱的变化水平。叶片中的甜菜碱含量在轻度胁迫下显著上升且达到最大值,在中度和重度干旱胁迫下显著下降;根系中甜菜碱含量随干旱胁迫的加剧持续升高,并在重度胁迫下达到峰值。
![]() 图 5 不同干旱胁迫梯度下油莎豆甜菜碱含量的变化Figure 5. Changes of glycine betaine content of C. esculentus var. sativus under different drought stress gradients
图 5 不同干旱胁迫梯度下油莎豆甜菜碱含量的变化Figure 5. Changes of glycine betaine content of C. esculentus var. sativus under different drought stress gradients图6反映了干旱胁迫下油莎豆激素调节物质ABA的变化水平。根系和叶片中的ABA含量均在轻度胁迫下达到最大值,与对照组差异显著(P < 0.05),之后在中度和重度胁迫下降低。根系中的ABA含量在各个胁迫梯度间变异度大于叶片,表明根系中干旱的激素调节比叶片更为敏感。
![]() 图 6 不同干旱胁迫梯度下油莎豆脱落酸ABA含量的变化Figure 6. Changes of abscisic acid (ABA) content of C. esculentus var. sativus under different drought stress gradients
图 6 不同干旱胁迫梯度下油莎豆脱落酸ABA含量的变化Figure 6. Changes of abscisic acid (ABA) content of C. esculentus var. sativus under different drought stress gradients3.5 油莎豆抗旱性综合评价
表1为油莎豆抗旱性灰色关联度分析结果,综合植物生化指标、光合生理指标和生长各项指标评价,得到油莎豆的抗旱性度量值为0.468。
表 1 油莎豆抗旱性灰色关联度分析结果Table 1. Grey correlation analysis of drought resistance of C. esculentus var. sativus指标
Index灰色关联度系数
Grey correlation coefficient隶属函数值
Membership function value指标权重
Index weight抗逆生化指标
Stress resistant biochemical index酶系统
Enzyme system根系
Root抗坏血酸过氧化物酶
Ascorbate peroxidase0.646 0.818 0.044 过氧化物酶
Peroxidase0.647 0.733 0.044 PEP羧化酶
PEP carboxylase0.679 0.483 0.046 叶片
Leaf抗坏血酸过氧化物酶
Ascorbate peroxidase0.647 0.733 0.044 过氧化物酶
Peroxidase0.635 0.826 0.043 PEP羧化酶
PEP carboxylase0.869 0.080 0.059 渗透调节
Osmotic regulation根系
Root0.573 0.747 0.039 叶片
Leaf0.614 0.521 0.042 激素调节
Hormone regulation根系
Root0.652 0.678 0.044 叶片
Leaf0.719 0.824 0.049 光合生理指标
Photosynthetic physiological index净光合速率
Net photosynthetic rate0.643 0.419 0.044 气孔导度
Stomatal conductance0.810 0.645 0.055 蒸腾速率
Transpiration rate0.727 0.637 0.049
WUE0.664 0.705 0.045 表型生长特征指标
Growth characteristic index株高
Plant height0.840 0.883 0.057 冠幅
Crown width0.911 0.708 0.062 分蘖数
Tiller number0.837 0.686 0.057 果实数
Tuber number0.880 0.807 0.060 生物量及分配
Biomass and distribution地下生物量
Belowground biomass0.782 0.429 0.053 地上生物量
Aboveground biomass0.873 0.362 0.059 综合抗旱性度量值
Comprehensive drought resistance value0.468 4. 讨 论
4.1 干早胁迫对油莎豆生长特征和光合生理的影响
干旱条件下,植物会通过调整表型特征、改变不同器官的生物量积累及分配[17]以最大化利用土壤水分,实现个体的生存,如增加根冠比[18]、减少叶面积等。本研究中,油莎豆通过增加地下生物量,提升根冠比从而保持较高的吸水速率,以抵御干旱;同时干旱胁迫显著减小了冠幅、果实数和分蘖数,表明油莎豆通过减少耗水途径以提高抗旱能力,这与前人研究规律一致。
光合作用是植物物质积累和能量转化的重要生理过程,能直接反映植物对逆境的适应程度[19]。本研究结果表明,油莎豆的Pn、Tr、WUE和Gs在轻度胁迫下达到最大值,而在中度和重度胁迫下降低且显著低于对照组。裴斌等[20]对沙棘叶片的Pn、Tr和WUE的研究结果与本研究一致,这说明适当的水分胁迫可以提升植物的水分利用效率,有利于植物进行光合作用进而提升产量;但如果土壤水分持续降低,植物的生理过程会受到负面影响。基于该规律,本研究认为,沙土土壤含水率8% ~ 12%是油莎豆生长的最优水分环境。鉴于研究区毛乌素沙地表层土壤含水率多稳定在5%以下[21],故我们还需进一步增加大田试验以探究该地区是否能够实现油莎豆成功引种栽培。
4.2 油莎豆抵御干旱胁迫的生化机制
植物抵御逆境的生理生化机制主要包括激素调节、渗透物质调节和抗氧化系统3类。在渗透调节方面,植物通过合成和积累可溶性糖、游离氨基酸、脯氨酸等各种物质以提高细胞液浓度、降低渗透势,从而保持细胞结构和功能的稳定[5]。本研究中,随干旱胁迫加剧,油莎豆根系和叶片中甜菜碱含量呈现波动上升的趋势,实现了维持渗透平衡、减少细胞结构性失水的功能;然而,根系和叶片中甜菜碱含量变化趋势不同,根系甜菜碱含量随干旱胁迫加剧不断升高,叶片甜菜碱在轻度胁迫下达到峰值。这种叶片和根系的差异响应在鸭茅(Dactylis glomerata)[22]、羊草(Leymus chinensis)[23]、樟子松(Pinus sylvestris var. mongolica)[24]和马尾松(Pinus massoniana)[25]等植物的研究中也有证明,这是植物为达到整体的内稳态平衡而表现出的器官间权衡策略。
抗氧化酶活性的提升有利于提升植物的抗旱性[26-28]。本研究中,干旱胁迫引发抗氧化酶活性显著升高,表明胁迫激发了油莎豆抗氧化酶系统活性以抵御干旱。根系中PEP羧化酶活性在干旱胁迫下显著升高且在中度胁迫到达峰值,可以推断在中轻度胁迫下,光合碳同化过程仍具有一定的调节能力,但过高的胁迫程度使得光合酶调节能力失效,这也进一步印证了光合生理指标所表现出的规律(图3)。
ABA激素在植物响应干旱胁迫的过程中发挥关键作用。ABA能通过促进气孔关闭和调控基因表达[28-29]提升植物抗旱性,同时还可以通过提高吸收光能性能指数[30]、光系统的有效量子产率[31]和叶绿素含量[32]等途径提高叶片净光合速率,进而维持较高的生产力[33-34]。本研究中油莎豆根系和叶片中的ABA激素含量在干旱胁迫下显著高于对照,且在轻度干旱胁迫下,ABA激素含量和光合速率同步达到最大值,说明油莎豆启动了激素调节途径提升了油莎豆的抗旱性,同时维持了较高光合能力。张海燕[2]等试验研究证明,干旱胁迫能提高甘薯块茎和叶片中ABA含量,与本研究规律一致。但随着胁迫加剧,油莎豆ABA激素含量有下降趋势,说明重度胁迫导致油莎豆应对干旱的脱落酸调节机制受损。
由此可知,油莎豆对轻度和中度干旱胁迫具有一定耐受性,可以通过启动多种抗逆机制抵御干旱,然而重度干旱则会对植物产生伤害,影响其生理生化代谢过程,抑制其生长。
4.3 油莎豆抗旱性综合评价
本研究结果表明,油莎豆综合抗旱性度量值为0.468,借鉴玉米(Zea mays)[35]、大麦(Hordeum vulgare)[16]、薏苡(Coix lacryma-jobi)[36]、青稞(Hordeum vulgare var. coeleste)[37]、油菜(Brassica napus)[38]等作物的抗旱定级标准,油莎豆属于中等抗旱型作物。
5. 结 论
油莎豆属于中等抗旱性植物,沙土土壤含水率8% ~ 12%是油莎豆表型生长、生物量积累和维持光合生理活性的最优水分环境。在沙土土壤含水率5% ~ 12%的轻度和中度干旱胁迫下,油莎豆可以通过启动渗透调节、抗氧化酶系统和激素分泌等多种生化机制抵御干旱,然而不同干旱胁迫程度下各抗逆生化机制调节能力发生改变,且油莎豆根系和叶片对干旱胁迫的响应具有差异性。土壤含水率5%以下的重度干旱则会抑制植物生长,抗旱机制失去作用,生产力下降。因此,在沙区引种该作物时,需要配备一定的灌溉条件,以调控土壤含水量保证油莎豆的长势。
-
![]()
图 1 多次调查固定样地位置图
Figure 1. Location diagram of permanent sample plots for repeated surveying
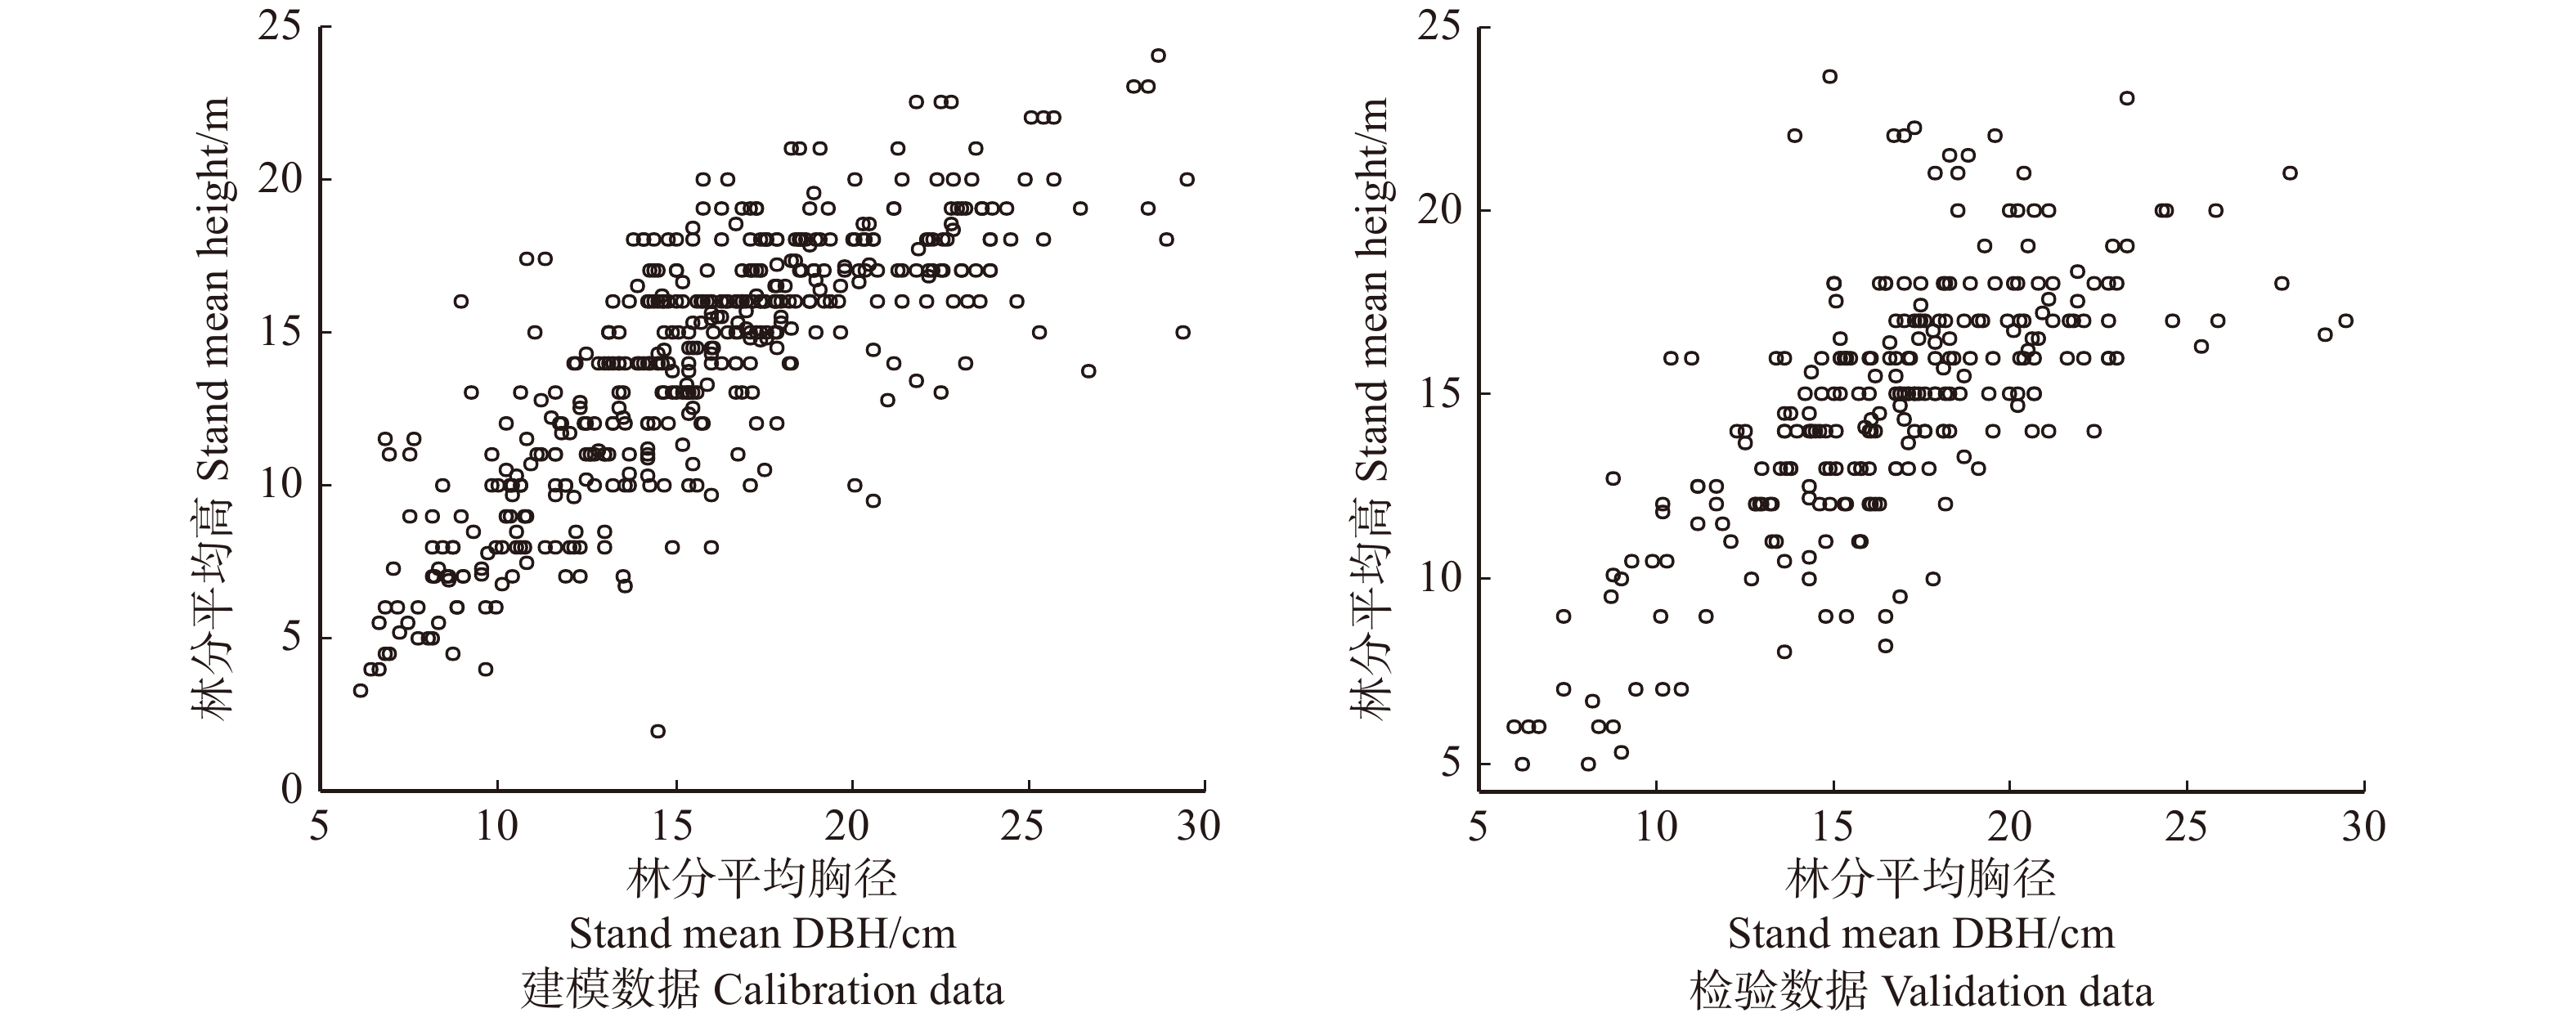
![]()
图 2 林分平均高与林分平均胸径的散点图
Figure 2. Scatter diagram of stand mean height and stand mean DBH
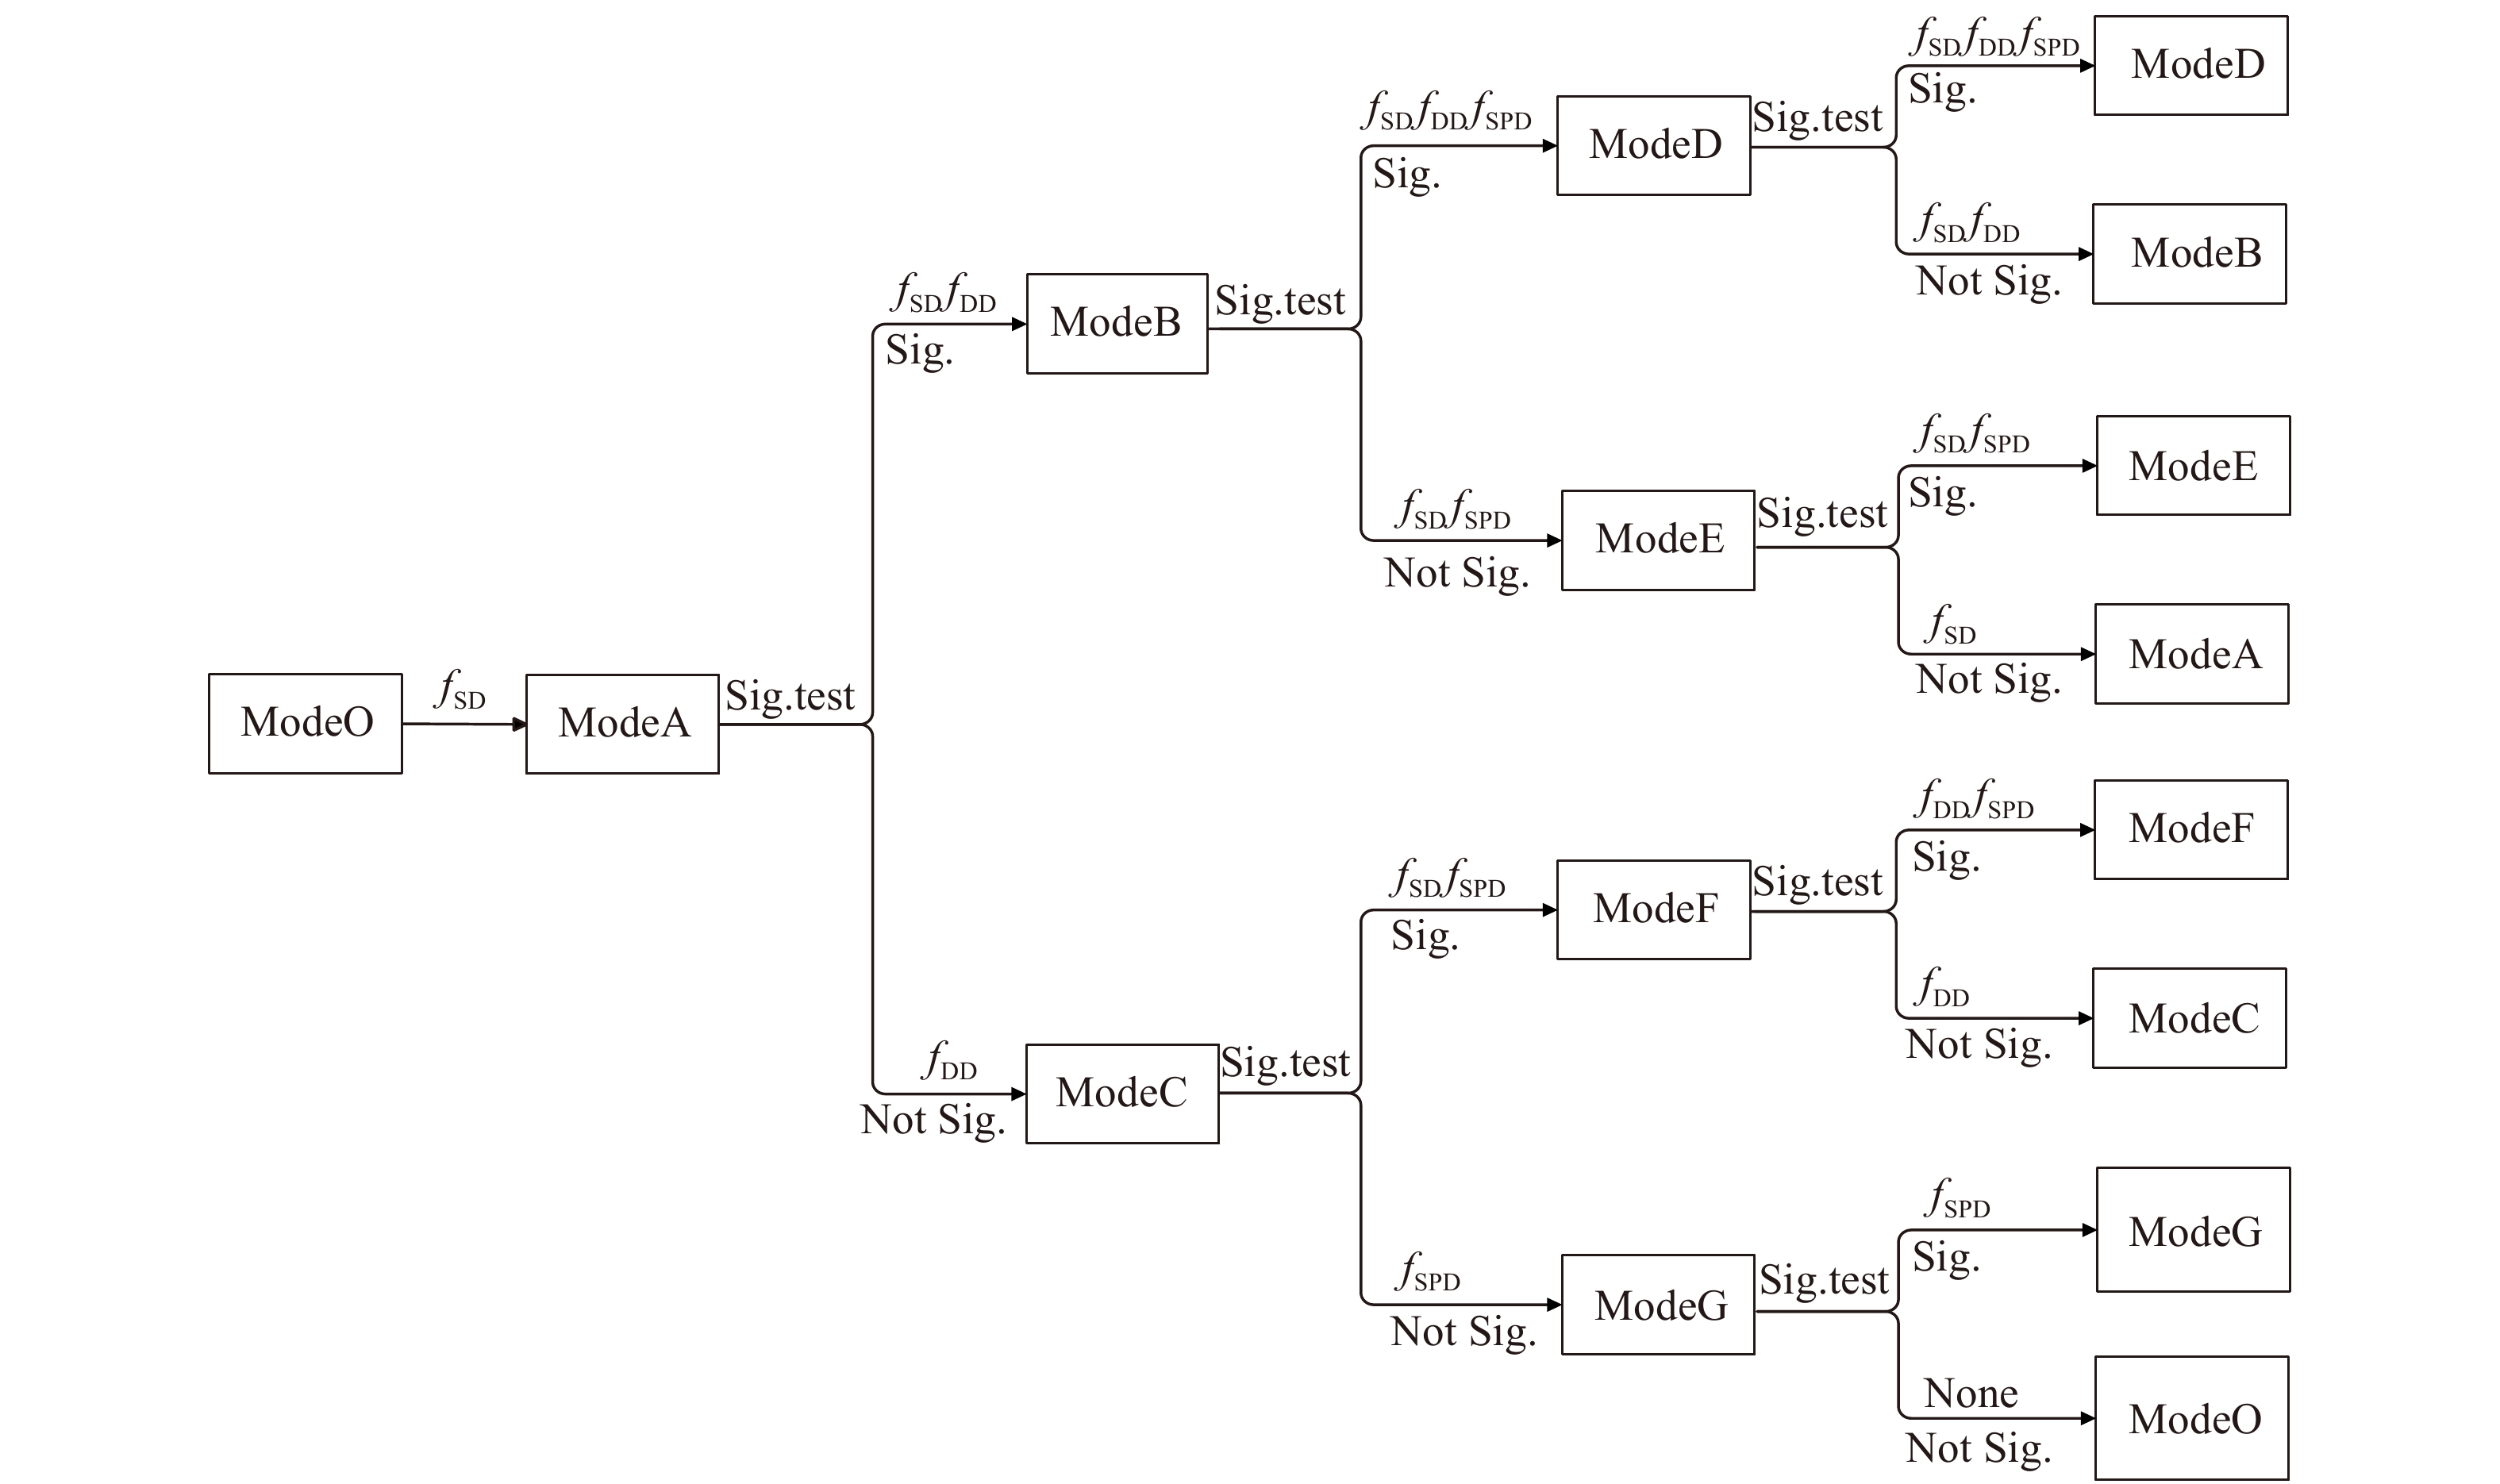
![]()
图 3 多样性代数差分方程建模流程图
ModeO代表基础代数差分方程,即公式(3)。Sig. test表示参数显著性检验,Sig.表示参数检验显著,Not Sig.表示参数检验不显著,None表示模型中不加入fSD、fDD和fSPD。 ModeO represents the basic algebraic difference equation, i.e. formula (3). Sig. test denotes significance test of parameters, Sig. denotes parameter test is significant, Not Sig. denotes parameter test is not significant, None denotes that fSD, fDD and fSPD are not added into the model.
Figure 3. Modeling flowchart of diversity algebraic differential equations
表 1 229个连续调查固定样地统计结果
Table 1 Summary statistics for 229 permanent sample plots inventory
特征值 Characteristic value 建模数据 Calibration data 检验数据 Validation data 连续调查2次 Continuously investigating twice 35 18 连续调查3次 Continuously investigating three times 57 23 连续调查4次 Continuously investigating four times 55 41 总样地个数 Total number of sample plots 147 82 林分年龄 Stand age 55 ± 31 (10, 152) 57 ± 28 (6, 149) 林分平均高 Stand mean height/m 13.0 ± 4.7 (2.0, 24.0) 13.8 ± 3.9 (5.0, 22.2) 林分平均直径 Stand mean diameter/cm 14.8 ± 4.9 (6.1, 28.9) 15.6 ± 4.2 (6.0, 25.9) 林分优势直径 Stand dominant diameter/cm 28.6 ± 11.3 (6.9, 57.7) 30.6 ± 9.3 (6.8, 56.4) 林木株数(N)/(株·hm−2) Tree number (N) /(plant·ha−1) 1 133 ± 483 (200, 2 717) 1 100 ± 433 (250, 2267) 林分断面积(BA)/(m2·hm−2) Stand basal area (BA)/(m2·ha−1) 20.100 ± 11.700 (0.833, 53.833) 20.800 ± 10.350 (1.150, 57.133) 注:小括号内的值表示范围,下同。连续调查是指前后两次调查的时间间隔为5年。Notes: values in parentheses denote scope, the same below. Continuously investigating refers to the time interval of 5 years between two surveys.  下载: 导出CSV
表 2 林分密度指标
Table 2 Stand density indices
林分密度指标
Stand density index林分密度指数
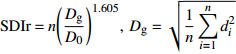
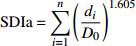
Stand density index (SDIr)可加林分密度指数
Additive stand density index (SDIa)公式 Formula {\rm{SDIr} } = n{\left( {\dfrac{ { {D_{\rm{g} } } }}{ { {D_0} } } } \right)^{1.605} }, \; {D_{\rm{g} } } = \sqrt {\dfrac{1}{n}\displaystyle\sum\limits_{i = 1}^nd_i^2} {\rm{SDIa}} = \displaystyle\sum\limits_{i = 1}^n{\left( {\dfrac{{{d_i}}}{{{D_0}}}} \right)^{1.605}} 注:n表示林木株数,di表示第i株林木的胸径,Dg表示林分平均胸径,D0表示标准直径。Notes: n is the number of trees, di is the DBH of tree i, Dg is stand mean DBH, D0 is standard diameter.
下载: 导出CSV
表 3 229个连续调查固定样地的林分密度指标
Table 3 Stand density indices for 229 permanent sample plots inventory
林分密度指标 Stand density index 建模数据 Calibration data 检验数据 Validation data 林木株数(N)/(株·hm−2) Tree number(N)/(stem·ha−1) 1133 ± 483 (200, 2717) 1100 ± 433 (250, 2267) 林分断面积(BA)/(m2·hm−2) Stand basal area(BA)/(m2·ha−1) 20.100 ± 11.700 (0.833, 53.833) 20.800 ± 10.350 (1.150, 57.133) SDIa 636.050 ± 315.833 (42.450, 1382.650) 651.817 ± 279.083 (57.117, 1522.033) SDIr 696.250 ± 355.717 (42.650, 1540.833) 717.633 ± 318.400 (58.650, 1797.983) 郁闭度 Canopy density (CD) 0.8 ± 0.2 (0.2, 1.0) 0.8 ± 0.1 (0.3, 1.0)
下载: 导出CSV
表 4 5个多样性指数
Table 4 Five diversity indices
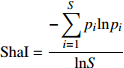
多样性指数 Diversity index 公式 Formula 适用类型 Applicable type 均匀度指数 Shannon evenness index (ShaI) {\rm{ShaI} } = \dfrac{ { - \displaystyle\sum\limits_{i = 1}^S{p_i}{\rm ln} { {p_i} } } }{ { {\rm ln} S } } 直径多样性,树种多样性
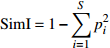
Diameter diversity , tree species diversitySimpson指数 Simpson index (SimI) {\rm{SimI}} = 1 - \displaystyle\sum\limits_{i = 1}^S {p_i^2} 直径多样性,树种多样性
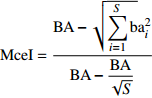
Diameter diversity, tree species diversityMcIntosh均匀度指数 McIntosh evenness index (MceI) {\rm{MceI} } = \dfrac{ { {\rm{BA} } - \sqrt {\displaystyle\sum\limits_{i = 1}^S {\rm{b} } } {\rm{a} }_i^2} }{ { {\rm{BA} } - \dfrac{ { {\rm{BA} } } }{ {\sqrt S } } } } 直径多样性,树种多样性
Diameter diversity, tree species diversityBerger-Parker指数 Berger-Parker index (BerI) {\rm{BerI} } = 1 - \dfrac{ { {\rm{b} }{ {\rm{a} }_{\rm max} } } }{ { {\rm{BA} } } } 直径多样性,树种多样性
Diameter diversity, tree species diversityGini系数 Gini coefficient (GinI) {\rm{GinI} } = \dfrac{ {\displaystyle\sum\limits_{j = 1}^n {\left( {2j - n - 1} \right)} {\rm{b} }{ {\rm{a} }_{{j} } } } }{ {\displaystyle\sum\limits_{j = 1}^n {\rm{b} } { {\rm{a} }_j}\left( {n - 1} \right)} } 直径多样性
Diameter diversity注:pi在直径多样性指数中表示第i个径阶的断面积比例,在树种多样性指数中表示第i个树种的株数比例;S在直径多样性指数中表示径阶数,在树种多样性指数中表示树种数;BA表示林分总断面积;bai表示第i个径阶的断面积;baj表示第j株林木的断面积;bamax表示断面积最大所在径阶的断面积;n表示林木总株数。Notes: pi is the proportion of basal area in diameter class i within diameter diversity index, or pi is the proportion of tree number in tree species i within species diversity index; S is the number of diameter classes within diameter diversity index, or S is the number of tree species within species diversity index; BA is stand basal area; bai is the basal area in the diameter class i; baj is the basal area of the tree; bamax is the basal area in the diameter class with the largest basal area; n is the total number of trees.
下载: 导出CSV
表 5 229个连续调查固定样地的多样性指数
Table 5 Diversity indices for 229 permanent sample plots inventory
类型 Type 多样性指数 Diversity index 建模数据 Calibration data 检验数据 Validation data ShaI 0.900 ± 0.069 (0.490, 0.979) 0.904 ± 0.077 (0.421, 0.979) SimI 0.861 ± 0.097 (0.383, 0.937) 0.874 ± 0.105 (0.265, 0.937) 直径多样性 Diameter diversity McI 0.903 ± 0.085 (0.394, 0.980) 0.909 ± 0.095 (0.323, 0.981) BerI 0.779 ± 0.122 (0.239, 0.901) 0.798 ± 0.125 (0.157, 0.906) GinI 0.543 ± 0.132 (0.142, 0.791) 0.573 ± 0.118 (0.105, 0.734) 树种多样性 Tree species diversity ShaI 0.947 ± 0.068 (0.588, 0.998) 0.957 ± 0.062 (0.617, 1.000) SimI 0.961 ± 0.051 (0.611, 0.988) 0.965 ± 0.045 (0.675, 0.986) McI 0.949 ± 0.081 (0.488, 0.998) 0.959 ± 0.076 (0.537, 1.000) BerI 0.903 ± 0.102 (0.385, 0.975) 0.917 ± 0.095 (0.440, 0.973)
下载: 导出CSV
表 6 参数b的组合模式
Table 6 Composition model of parameter b
表达式 Expression 说明 Description {f}_{x}=1+{c}_{x}\dfrac{x-\bar{x} }{\bar{x} } 参数标准化 Standard parameter b={b}_{0} {f}_{\rm{SD} } 含SD的参数b Parameter b including SD b={b}_{0} {f}_{\rm{SD} } {f}_{\rm{DD} } 含SD和DD的参数b Parameter b including SD and DD b={b}_{0} {f}_{\rm{DD} } 含DD的参数b Parameter b including DD b={b}_{0} {f}_{\rm{SD} } {f}_{\rm{DD} } {f}_{\rm{SPD} } 含SD、DD和SPD的参数b Parameter b including SD, DD and SPD b={b}_{0} {f}_{\rm{SD} } {f}_{\rm{SPD} } 含SD和SPD的参数b Parameter b including SD and SPD b={b}_{0} {f}_{\rm{DD} } {f}_{\rm{SPD} } 含DD和SPD的参数b Parameter b including DD and SPD b={b}_{0} {f}_{\rm{SPD} } 含SPD的参数b Parameter b including SPD 注:b0和cx表示参数,SD表示林分密度指标,DD表示直径多样性指数,SPD表示树种多样性指数,fx表示标准化函数,fSD表示标准化的林分密度指标,fDD表示标准化的直径多样性指数,fSPD表示标准化的树种多样性指数。Notes: b0 and cx denote parameters, SD denotes stand density index, DD denotes diameter diversity index, SPD denotes tree species diversity index, fx denotes standardize function, fSD denotes standardize stand density index, fDD denotes standardize diameter diversity index, fSPD denotes standardize species diversity index.
下载: 导出CSV
表 7 多样性代数差分方程
Table 7 Algebraic differential equations of diversity
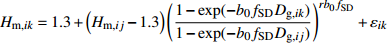
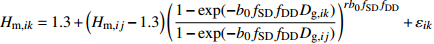
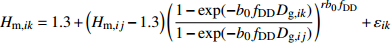
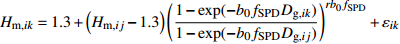
模型 Model 方程 Equation 说明 Description ModeA {H}_{ {\rm m},ik}=1.3+\left({H}_{{\rm m},ij}-1.3\right) {\left(\dfrac{1-\exp (-{b}_{0}{f}_{\rm{SD} }{D}_{ {\rm{g} },ik})}{1-\exp (-{b}_{0}{f}_{\rm{SD} }{D}_{ {\rm{g} },ij})}\right)}^{r{b}_{0}{f}_{\rm{SD} } }+{\varepsilon }_{ik} 含SD Including SD ModeB {H}_{{\rm m},ik}=1.3+\left({H}_{{\rm m},ij}-1.3\right) {\left(\dfrac{1-\exp (-{b}_{0}{f}_{\rm{SD} }{f}_{\rm{DD} }{D}_{ {\rm{g} },ik})}{1-\exp (-{b}_{0}{f}_{\rm{SD} }{f}_{\rm{DD} }{D}_{ {\rm{g} },ij})}\right)}^{r{b}_{0}{f}_{\rm{SD} }{f}_{\rm{DD} } }+{\varepsilon }_{ik} 含SD和DD Including SD and DD ModeC {H}_{{\rm m},ik}=1.3+\left({H}_{{\rm m},ij}-1.3\right) {\left(\dfrac{1-\exp (-{b}_{0}{f}_{\rm{DD} }{D}_{ {\rm{g} },ik})}{1-\exp (-{b}_{0}{f}_{\rm{DD} }{D}_{ {\rm{g} },ij})}\right)}^{r{b}_{0}{f}_{\rm{DD} } }+{\varepsilon }_{ik} 含DD Including DD ModeD {H}_{{\rm m},ik}=1.3+\left({H}_{{\rm m},ij}-1.3\right) {\left(\dfrac{1-\exp (-{b}_{0}{f}_{\rm{SD} }{f}_{\rm{DD} }{f}_{\rm{SPD} }{D}_{ {\rm{g} },ik})}{1-\exp (-{b}_{0}{f}_{\rm{SD} }{f}_{\rm{DD} }{f}_{\rm{SPD} }{D}_{ {\rm{g} },ij})}\right)}^{r{b}_{0}{f}_{\rm{SD} }{f}_{\rm{DD} }{f}_{\rm{SPD} } }+{\varepsilon }_{ik} 含SD、DD和SPD Including SD, DD and SPD ModeE {H}_{{\rm m},ik}=1.3+\left({H}_{{\rm m},ij}-1.3\right) {\left(\dfrac{1-\exp (-{b}_{0}{f}_{\rm{SD} }{f}_{\rm{SPD} }{D}_{ {\rm{g} },ik})}{1-\exp (-{b}_{0}{f}_{\rm{SD} }{f}_{\rm{SPD} }{D}_{ {\rm{g} },ij})}\right)}^{r{b}_{0}{f}_{\rm{SD} }{f}_{\rm{SPD} } }+{\varepsilon }_{ik} 含SD和SPD Including SD and SPD ModeF {H}_{{\rm m},ik}=1.3+\left({H}_{{\rm m},ij}-1.3\right) {\left(\dfrac{1-\exp (-{b}_{0}{f}_{\rm{DD} }{f}_{\rm{SPD} }{D}_{ {\rm{g} },ik})}{1-\exp (-{b}_{0}{f}_{\rm{DD} }{f}_{\rm{SPD} }{D}_{ {\rm{g} },ij})}\right)}^{r{b}_{0}{f}_{\rm{DD} }{f}_{\rm{SPD} } }+{\varepsilon }_{ik} 含DD和SPD Including DD and SPD ModeG {H}_{{\rm m},ik}=1.3+\left({H}_{{\rm m},ij}-1.3\right) {\left(\dfrac{1-\exp (-{b}_{0}{f}_{\rm{SPD} }{D}_{ {\rm{g} },ik})}{1-\exp (-{b}_{0}{f}_{\rm{SPD} }{D}_{ {\rm{g} },ij})}\right)}^{r{b}_{0}{f}_{\rm{SPD} } }+{\varepsilon }_{ik} 含SPD Including SPD
下载: 导出CSV
表 8 具有4次观测数据的6种数据结构类型
Table 8 Six different types of data structure with four measurements
typeA typeB typeC typeD typeE typeF (Hm,i1, Dg,i1), (Hm,i4, Dg,i4) (Hm,i1, Dg,i1), (Hm,i4, Dg,i4) (Hm,i1, Dg,i1), (Hm,i2, Dg,i2) (Hm,i1, Dg,i1), (Hm,i2, Dg,i2) (Hm,i1, Dg,i1), (Hm,i2, Dg,i2) (Hm,i1, Dg,i1), (Hm,i2, Dg,i2) (Hm,i4, Dg,i4), (Hm,i1 , Dg,i1) (Hm,i2, Dg,i2), (Hm,i3, Dg,i3) (Hm,i2, Dg,i2), (Hm,i1, Dg,i1) (Hm,i1, Dg,i1), (Hm,i3, Dg,i3) (Hm,i1, Dg,i1), (Hm,i3, Dg,i3) (Hm,i3, Dg,i3), (Hm,i4, Dg,i4) (Hm,i2, Dg,i2), (Hm,i3, Dg,i3) (Hm,i1, Dg,i1), (Hm,i4, Dg,i4) (Hm,i1, Dg,i1), (Hm,i4, Dg,i4) (Hm,i3, Dg,i3), (Hm,i2, Dg,i2) (Hm,i2, Dg,i2), (Hm,i3, Dg,i3) (Hm,i2, Dg,i2), (Hm,i1, Dg,i1) (Hm,i3, Dg,i3), (Hm,i4, Dg,i4) (Hm,i2, Dg,i2), (Hm,i4, Dg,i4) (Hm,i2, Dg,i2), (Hm,i3, Dg,i3) (Hm,i4, Dg,i4), (Hm,i3, Dg,i3) (Hm,i3, Dg,i3), (Hm,i4, Dg,i4) (Hm,i2, Dg,i2), (Hm,i4, Dg,i4) (Hm,i3, Dg,i3), (Hm,i1, Dg,i1) (Hm,i3, Dg,i3), (Hm,i2, Dg,i2) (Hm,i3, Dg,i3), (Hm,i4, Dg,i4) (Hm,i4, Dg,i4), (Hm,i1, Dg,i1) (Hm,i4, Dg,i4), (Hm,i2, Dg,i2) (Hm,i4, Dg,i4), (Hm,i3, Dg,i3) 注:typeA、typeB、typeC、typeD、typeE、typeF分别为非下降最长组合、最长组合、非重叠非下降组合、非重叠组合、非下降所有可能组合、所有可能组合,下同。Hm,i1、Hm,i2、Hm,i3、Hm,i4分别表示第 i 个样地的第1、2、3、4次林分平均高的观测数据;Dg,i1、Dg,i2、Dg,i3、Dg,i4分别表示第 i 个样地的第1、2、3、4次林分平均胸径的观测数据。Notes: typeA, typeB, typeC, typeD, typeE, typeF are the longest nondescending combination, the longest combination, the nonoverlapping and nondescending combination, the nonoverlapping combination, all possible nondescending combination, all possible combinations,the same below. Hm,i1、Hm,i2、Hm,i3、Hm,i4 represent the first, second, third and fourth observation data of stand mean height in the i-th sample plot; Dg,i1、Dg,i2、Dg,i3、Dg,i4 represent the observation data of the first, second, third and fourth of stand mean DBH in the i-th sample plot respectively.
下载: 导出CSV
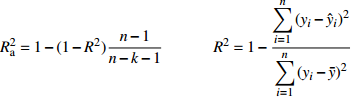
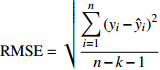
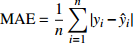
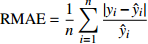
表 9 5个模型评价指标
Table 9 Five model evaluating indices
模型评价指标 Model evaluating index 公式 Formula 调整决定系数 Adjusted coefficient of determination ( R_{\rm{a}}^{2} )R_{\rm{a}}^{2}=1-(1-{R}^{2}) \dfrac{n-1}{n-k-1}\begin{array}{ccc}& & {R}^{2}=1-\dfrac{\displaystyle\sum_{i=1}^{n}{\left({y}_{i}-{\hat{y}}_{i}\right)}^{2}}{\displaystyle\sum_{i=1}^{n}{\left({y}_{i}-\bar{y}\right)}^{2}}\end{array} 均方根误差 Root mean square error (RMSE) {\rm{RMSE}}=\sqrt{\dfrac{\displaystyle\sum_{i=1}^{n}{\left({y}_{i}-{\hat{y}}_{i}\right)}^{2}}{n-k-1}} 平均绝对误差 Mean absolute error (MAE) {\rm{MAE}} = \dfrac{1}{n} \displaystyle\sum\limits_{i = 1}^n {\left| {{y_i} - {{\hat y}_i}} \right|} 相对平均绝对误差 Relative mean absolute error (RMAE) {\rm{RMAE}} = \dfrac{1}{n} \displaystyle\sum\limits_{i = 1}^n {\dfrac{{\left| {{y_i} - {{\hat y}_i}} \right|}}{{{{\hat y}_i}}}} Akaike信息准则 Akaike information criterion (AIC) \mathrm{A}\mathrm{I}\mathrm{C}=-\log L+2k 注:yi表示观测值, {\hat{y}}_{i} 表示估计值,\bar{y} 表示平均观测值,n表示观测样本数,k表示模型参数个数,L表示似然函数值。Notes: yi is observed value,{\hat{y}}_{i} is estimated value,\bar{y} is mean observed value, n is observed sample quantity, k is the number of model parameters, L is the likelihood function value.
下载: 导出CSV
表 10 建模数据的不同数据结构类型拟合效果
Table 10 Fitting performance for different data structure types of calibration data
数据结构类型
Data structure typeRa 2 RMSE MAE RMAE typeC 0.720 2.019 1.336 0.121 typeD 0.767 1.980 1.315 0.111 typeE 0.562 2.373 1.628 0.149 typeF 0.681 2.280 1.572 0.133
下载: 导出CSV
表 11 检验数据的不同数据结构类型拟合效果
Table 11 Fitting performance for different data structure types of validation data
数据结构类型
Data structure typeRMSE MAE RMAE typeC 1.850 1.189 0.087 typeD 1.809 1.165 0.084 typeE 2.162 1.479 0.106 typeF 2.087 1.436 0.102
下载: 导出CSV
表 12 不同数据结构类型的模型参数估计
Table 12 Model parameter estimates for different data structure types
数据结构类型 Data structure type 参数 Parameter 估计值 Estimate 标准差 Std. error t值 t value P值 P value typeC b 0.161 5 0.076 8 2.102 1 0.036 3 r 11.983 2 3.162 3 3.789 4 0.000 2 typeD b 0.165 7 0.046 2 3.586 2 0.000 4 r 14.420 4 2.350 7 6.134 4 0.000 0 typeE b 0.147 0 0.036 7 4.008 8 0.000 1 r 15.180 9 1.663 7 9.125 0 0.000 0 typeF b 0.156 6 0.023 2 6.736 6 0.000 0 r 17.442 6 1.301 6 13.400 9 0.000 0
下载: 导出CSV
表 13 建模数据的不同林分密度指标拟合效果
Table 13 Fitting performance for different stand density indices of calibration data
林分密度指标 Stand density index Ra 2 RMSE MAE RMAE AIC N 0.768 1.976 1.312 0.111 2 641.729 BA 0.769 1.973 1.316 0.113 2 639.754 SDIa 0.769 1.973 1.317 0.113 2 639.648 SDIr 0.769 1.973 1.316 0.113 2 639.383 CD 0.768 1.978 1.319 0.113 2 643.066
下载: 导出CSV
表 14 检验数据的不同林分密度指标拟合效果
Table 14 Fitting performance for different stand density indices of validation data
林分密度指标
Stand density indexRMSE MAE RMAE N 1.828 1.193 0.087 BA 1.829 1.178 0.086 SDIa 1.829 1.180 0.086 SDIr 1.825 1.178 0.086 CD 1.808 1.160 0.084
下载: 导出CSV
表 15 不同林分密度指标的模型参数估计
Table 15 Model parameter estimates for different stand density indices
林分密度指标 Stand density index 参数 Parameter 估计值 Estimate 标准差 Std. error t值 t value P值 P value N b0 0.163 2 0.031 4 5.192 6 0.000 0 r 16.757 4 2.543 3 6.588 9 0.000 0 cSD 1.387 3 0.167 0 8.307 4 0.000 0 BA b0 0.174 9 0.032 3 5.407 8 0.000 0 r 18.152 5 2.623 7 6.918 7 0.000 0 cSD 1.081 8 0.180 9 5.979 0 0.000 0 SDIa b0 0.165 7 0.029 8 5.555 6 0.000 0 r 17.725 9 2.438 1 7.270 3 0.000 0 cSD 1.225 8 0.182 6 6.712 8 0.000 0 SDIr b0 0.168 5 0.030 8 5.474 9 0.000 0 r 17.667 2 2.453 8 7.200 0 0.000 0 cSD 1.172 1 0.192 2 6.099 6 0.000 0 CD b0 0.172 4 0.036 3 4.756 2 0.000 0 r 16.061 2 2.440 0 6.582 3 0.000 0 cSD 1.506 9 0.322 4 4.673 5 0.000 0 注:cSD是标准化后的5个林分密度指标参数。Note: cSD is the five stand density index parameters after standardization.
下载: 导出CSV
表 16 建模数据的不同直径多样性指数拟合效果
Table 16 Fitting performance for different diameter diversity indices of calibration data
直径多样性指数
Diameter diversity indexRa 2 RMSE MAE RMAE AIC ShaI 0.772 1.959 1.308 0.111 2 631.775 SimI 0.771 1.964 1.306 0.111 2 634.669 MceI 0.772 1.963 1.308 0.111 2 634.009 BerI 0.772 1.961 1.304 0.111 2 633.108 GinI 0.769 1.972 1.312 0.113 2 639.897
下载: 导出CSV
表 17 检验数据的不同直径多样性指数拟合效果
Table 17 Fitting performance for different diameter diversity indices of validation data
直径多样性指数
Diameter diversity indexRa 2 RMSE MAE RMAE AIC ShaI 0.772 1.959 1.308 0.111 2 631.775 SimI 0.771 1.964 1.306 0.111 2 634.669 MceI 0.772 1.963 1.308 0.111 2 634.009 BerI 0.772 1.961 1.304 0.111 2 633.108 GinI 0.769 1.972 1.312 0.113 2 639.897
下载: 导出CSV
表 18 不同直径多样性指数的模型参数估计
Table 18 Model parameter estimates for different diameter diversity indices
直径多样性指数
Diameter diversity index参数
Parameter估计值
Estimate标准差
Std. errort值
t valueP值
P valueShaI b0 0.186 1 0.027 4 6.792 0 0.000 0 r 21.405 3 2.686 2 7.968 5 0.000 0 cSDIr 1.279 6 0.120 2 10.646 4 0.000 0 cDI 8.707 1 1.225 0 7.108 1 0.000 0 SimI b0 0.190 5 0.028 6 6.653 2 0.000 0 r 22.628 8 2.900 7 7.801 2 0.000 0 cSDIr 1.370 8 0.146 5 9.354 5 0.000 0 cDI 6.965 8 1.879 7 3.705 7 0.000 2 MceI b0 0.180 1 0.027 5 6.544 5 0.000 0 r 20.721 2 2.610 3 7.938 1 0.000 0 cSDIr 1.299 1 0.132 2 9.823 5 0.000 0 cDI 7.711 0 1.270 1 6.071 2 0.000 0 BerI b0 0.184 5 0.027 3 6.758 7 0.000 0 r 22.645 4 2.798 0 8.093 4 0.000 0 cSDIr 1.397 6 0.144 2 9.692 4 0.000 0 cDI 5.400 2 0.775 3 6.965 5 0.000 0 GinI b0 0.183 7 0.034 6 5.311 0 0.000 0 r 18.978 5 2.675 5 7.093 4 0.000 0 cSDIr 1.228 1 0.175 9 6.981 0 0.000 0 cDI 0.930 0 0.798 0 1.165 5 0.244 3 注:cSDIr是标准化后的林分密度指标SDIr参数,下同。cDI是标准化后的5个直径多样性指数参数。Note: cSDIr is the SDIr parameter of stand density index after standardization, the same below. cDI is the five diameter diversity index parameters after standardization.
下载: 导出CSV
表 19 建模数据的不同树种多样性指数拟合效果
Table 19 Fitting performance for different tree species diversity index of calibration data
树种多样性指数
Tree species diversity indexRa 2 RMSE MAE RMAE AIC ShaI 0.774 1.952 1.293 0.110 2 628.473 SimI 0.774 1.954 1.301 0.111 2 629.331 MceI 0.774 1.951 1.292 0.110 2 627.545 BerI 0.773 1.957 1.307 0.111 2 631.183
下载: 导出CSV
表 20 检验数据的不同树种多样性指数拟合效果
Table 20 Fitting performance for different tree species diversity index of validation data
树种多样性指数
Tree species diversity indexRMSE MAE RMAE ShaI 1.817 1.176 0.087 SimI 1.859 1.219 0.089 MceI 1.817 1.186 0.088 BerI 2.151 1.286 0.091
下载: 导出CSV
表 21 不同树种多样性指数的模型参数估计
Table 21 Model parameter estimates for different tree species diversity index
树种多样性指数
Tree species diversity index参数
Parameter估计值
Estimate标准差
Std. errort值
t valueP值
P valueShaI b0 0.317 2 0.064 0 4.957 9 0.000 0 r 21.774 6 3.520 6 6.184 8 0.000 0 cSDIr 0.594 5 0.296 4 2.005 5 0.045 3 cShaI −2.736 2 3.044 4 −0.898 8 0.369 1 cSP −24.003 0 5.118 3 −4.689 6 0.000 0 SimI b0 −0.037 3 0.019 9 −1.874 9 0.061 3 r −9.609 4 6.686 6 −1.437 1 0.151 2 cSDIr −1.993 7 0.482 0 −4.136 6 0.000 0 cShaI −1.692 0 2.139 2 −0.791 0 0.429 3 cSP 50.617 9 15.604 2 3.243 9 0.001 2 MceI b0 0.420 9 0.095 5 4.407 6 0.000 0 r 22.790 2 3.568 5 6.386 5 0.000 0 cSDIr 0.720 0 0.279 4 2.577 3 0.010 2 cShaI −2.313 5 3.029 4 −0.763 7 0.445 3 cSP −30.040 1 4.594 6 −6.538 2 0.000 0 BerI b0 0.178 9 0.026 7 6.690 3 0.000 0 r 21.947 4 2.934 8 7.478 3 0.000 0 cSDIr 1.033 2 0.211 3 4.890 9 0.000 0 cShaI 8.149 1 1.606 6 5.072 4 0.000 0 cSP 3.606 4 0.762 0 4.733 0 0.000 0 注:cShaI表示标准化后的直径多样性指数ShaI参数,cSP表示标准化后的4个树种多样性指数参数。Notes: cShaI refers to the diameter diversity index ShaI parameters after standardization, and cSP refers to the four tree species diversity index parameters after standardization.
下载: 导出CSV
-
[1] Skovsgaard J P, Vanclay J K. Forest site productivity: a review of the evolution of dendrometric concepts for even-aged stands[J]. Forestry: An International Journal of Forest Research, 2008, 81(1): 13−31. doi: 10.1093/forestry/cpm041
[2] Skovsgaard J P, Vanclay J K. Forest site productivity: a review of spatial and temporal variability in natural site conditions[J]. Forestry: An International Journal of Forest Research, 2013, 86(3): 305−315. doi: 10.1093/forestry/cpt010
[3] Hägglund B. Evaluation of forest site productivity[J]. Forestry Abstracts, 1981, 42(11): 516−527.
[4] Rennolls K. “Top height”: its definition and estimation[J]. Commonwealth Forestry Review, 1978, 57(3): 215−219.
[5] Huang S M, Titus S J. An index of site productivity for uneven-aged or mixed-species stands[J]. Canadian Journal of Forest Research, 1993, 23(3): 558−562. doi: 10.1139/x93-074
[6] Palahí M, Pukkala T, Kasimiadis D, et al. Modelling site quality and individual-tree growth in pure and mixed Pinus brutia stands in northeast Greece[J]. Annals of Forest Science, 2008, 65(5): 501. doi: 10.1051/forest:2008022
[7] Nigh G D. The geometric mean regression line: a method for developing site index conversion equations for species in mixed stands[J]. Forest Science, 1995, 41(1): 84−98. doi: 10.1093/forestscience/41.1.84
[8] Johansson T. Site index conversion equations for Picea abies and five broadleaved species in Sweden: Alnus glutinosa, Alnus incana, Betula pendula, Betula pubescens and Populus tremula[J]. Scandinavian Journal of Forest Research, 2006, 21(1): 14−19. doi: 10.1080/02827580500526015
[9] Raulier F, Lambert M C, Pothier D, et al. Impact of dominant tree dynamics on site index curves[J]. Forest Ecology and Management, 2003, 184(1/3): 65−78.
[10] Ouzennou H, Pothier D, Raulier F. Adjustment of the age-height relationship for uneven-aged black spruce stands[J]. Canadian Journal of Forest Research, 2008, 38(7): 2003−2012. doi: 10.1139/X08-044
[11] Anyomi K A, Raulier F, Bergeron Y, et al. Spatial and temporal heterogeneity of forest site productivity drivers: a case study within the eastern boreal forests of Canada[J]. Landscape Ecology, 2014, 29(5): 905−918. doi: 10.1007/s10980-014-0026-y
[12] McCarthy J W, Weetman G. Stand structure and development of an insect-mediated boreal forest landscape[J]. Forest Ecology and Management, 2007, 241(1/3): 101−114.
[13] Boucher D, Gauthier S, De Grandpré L. Structural changes in coniferous stands along a chronosequence and a productivity gradient in the northeastern boreal forest of Québec[J]. Écoscience, 2006, 13(2): 172−180. doi: 10.2980/i1195-6860-13-2-172.1
[14] Vanclay J K. Site productivity assessment in rainforests: an objective approach using indicator species[M]//Mohd W R, Chan H T, Appanah S. Seminar on growth and yield in tropical mixed/moist forests. Kuala Lumpur: Forest Research Institute, 1989: 225−241.
[15] Meyer H A. A mathematical expression for height curves[J]. Journal of Forestry, 1940, 38(5): 415−420.
[16] Husch B, Miller C I, Beers T W. Forest mensuration [M]. New York: John Wiley & Sons, 1982.
[17] Lei X D, Tang M P, Lu Y C, et al. Forest inventory in China: status and challenges[J]. International Forestry Review, 2009, 11(1): 52−63. doi: 10.1505/ifor.11.1.52
[18] Zeng W S, Tomppo E, Healey S P, et al. The national forest inventory in China: history-results-international context[J]. Forest Ecosystems, 2015, 2(1): 1−16. doi: 10.1186/s40663-014-0025-0
[19] Pienaar L V, Shiver B D. An analysis and models of basal area growth in 45-year-old unthinned and thinned slash pine plantation plots[J]. Forest Science, 1984, 30(4): 933−942.
[20] Lanner R M. On the insensitivity of height growth to spacing[J]. Forest Ecology and Management, 1985, 13(3/4): 143−148.
[21] Bontemps J D, Bouriaud O. Predictive approaches to forest site productivity: recent trends, challenges and future perspectives[J]. Forestry: An International Journal of Forest Research, 2014, 87(1): 109−128. doi: 10.1093/forestry/cpt034
[22] 傅立国, 陈谭清, 郎楷永, 等. 中国高等植物[M]. 青岛: 青岛出版社, 2001: 240−254. Fu L G, Chen T Q, Lang K Y, et al. Higher plants of China[M]. Qingdao: Qingdao Publishing House, 2001: 240−254.
[23] 国家林业局. 第八次全国森林资源清查结果[J]. 林业资源管理, 2014(1):1−2. State Forestry Bureau. The 8th national forest inventory[J]. Forest Resources Management, 2014(1): 1−2.
[24] 郭斌. 栎属近缘种指纹图谱构建及遗传结构[J]. 北京林业大学学报, 2018, 40(5):10−18. Guo B. Construction of SSR fingerprint and research of genetic structure in relative Quercus species[J]. Journal of Beijing Forestry University, 2018, 40(5): 10−18.
[25] 官秀玲, 胡艳波. 我国栎类经营及其发展方向研究[J]. 西部林业科学, 2019, 48(2):146−150, 158. Guan X L, Hu Y B. Research on oak forest management orientation of China[J]. Journal of West China Forestry Science, 2019, 48(2): 146−150, 158.
[26] 盛炜彤. 我国应将天然次生林的经营放在重要位置[J]. 林业科技通讯, 2016(2):10−13. Sheng W T. China should put an important position for the management of natural secondary forests[J]. Forest Science and Technology, 2016(2): 10−13.
[27] 张晓红, 张会儒. 蒙古栎次生林垂直结构特征对目标树经营的响应[J]. 北京林业大学学报, 2019, 41(5):56−65. Zhang X H, Zhang H R. Response of vertical structure characteristics of natural secondary Quercus mongolica forest to crop tree release[J]. Journal of Beijing Forestry University, 2019, 41(5): 56−65.
[28] Reineke L H. Perfecting a stand-density index for even-aged forests[J]. Journal of Agricultural Research, 1933, 46(7): 627−638.
[29] Stage A R. A tree-by-tree measure of site utilization for grand fir related to stand density index[R]. Washington: U.S. Forest Service Research, 1968.
[30] Long J N, Daniel T W. Assessment of growing stock in uneven-aged stands[J]. Western Journal of Applied Forestry, 1990, 5(3): 93−96. doi: 10.1093/wjaf/5.3.93
[31] 张连金, 惠刚盈, 孙长忠. 不同林分密度指标的比较研究[J]. 福建林学院学报, 2011, 31(3):257−261. Zhang L J, Hui G Y, Sun C Z. Comparison of different stand density measures[J]. Journal of Fujian College of Forestry, 2011, 31(3): 257−261.
[32] Lexerød N L, Eid T. An evaluation of different diameter diversity indices based on criteria related to forest management planning[J]. Forest Ecology and Management, 2006, 222(1/3): 17−28.
[33] Wang M L, Borders B E, Zhao D H. Parameter estimation of base-age invariant site index models: which data structure to use?[J]. Forest Science, 2007, 53(5): 541−551.
[34] 倪成才, 于福平, 张玉学, 等. 差分生长模型的应用分析与研究进展[J]. 北京林业大学学报, 2010, 32(4):284−292. Ni C C, Yu F P, Zhang Y X, et al. Application analysis and recent advances of projection growth models[J]. Journal of Beijing Forestry University, 2010, 32(4): 284−292.
[35] Getis A, Aldstadt J. Constructing the spatial weights matrix using a local statistic[J]. Geographical Analysis, 2004, 36(2): 90−104. doi: 10.1111/j.1538-4632.2004.tb01127.x
-
期刊类型引用(7)
1. 钟思琪,宁金魁,黄锦程,陈鼎泸,欧阳勋志,臧颢. 基于混合效应的杉木人工林冠幅模型. 森林与环境学报. 2024(02): 127-135 .  百度学术
百度学术
2. 张晓姗,高嘉,王洪永,王霞,庞薇,陈寅,杜振宇,马风云,马丙尧. 我国栎树引种及其营养生长研究进展. 江苏林业科技. 2024(02): 48-52 . 百度学术
3. 邓坦,李文博,张向阳,王新建. 河南省栎类经营技术研究与建议. 河南林业科技. 2023(01): 1-5+30 . 百度学术
4. 廖科,刘振华,童方平,陈瑞,吴敏,蒋龙,龚发武,李贵. 不同混交比例对栎类混交林生长和土壤养分的影响. 中南林业科技大学学报. 2023(09): 80-88 . 百度学术
5. 娄明华,杨同辉,王卫兵,毛建方,徐婧,章建红. 四明山黄山松针阔混交林的树高—胸径模型. 林业与环境科学. 2023(05): 7-14 . 百度学术
6. 娄明华,白超,杨同辉. 宁波石栎-木荷天然常绿阔叶混交林的树高-胸径模型. 林业与环境科学. 2021(04): 46-54 . 百度学术
7. 娄明华,杨同辉,陈文伟,许俊. 宁波天然甜槠阔叶混交林树高—胸径模型研究. 防护林科技. 2021(05): 1-5 . 百度学术
其他类型引用(4)


计量
- 文章访问数: 2585
- HTML全文浏览量: 970
- PDF下载量: 114
- 被引次数: 11
