
Ability evaluation of coniferous forest aboveground biomass inversion using Sentinel-2A multiple characteristic variables
-
摘要:目的 森林生物量是衡量森林碳储量的关键因子,准确估算生物量对掌握森林现状和森林资源合理利用具有重要意义。欧空局发射Sentinel-2A数据因其丰富的光谱信息和较高的空间分辨率为生物量的反演和监测提供了新的机会。本文旨在评估基于Sentinel-2A的各类特征变量反演针叶林地上生物量的能力以及完成区域尺度的针叶林地上生物量定量估测。方法 试验以内蒙古赤峰市喀喇沁旗旺业甸林场针叶林为研究对象,以Sentinel-2A为主要数据源,提取了10个波段反射率、20个植被指数和5个生物物理参数共3种类型变量,分别建立基于光谱反射率、植被指数、生物物理参数,以及融合3类变量的多元逐步回归生物量估算模型,同时每组均加入高程因子分析地形对估算精度的影响。结果 (1)基于多种类型参数建立的模型估算效果最好,模型决定系数达到0.765,均方根误差为39.49 t/hm2;(2)在3组单类型变量模型中,基于植被指数的预测结果最好,说明相比于波段反射率和生物物理参数,植被指数对针叶林地上生物量的估算贡献更大;(3)无论基于何种类型参数建模,高程信息的加入都会提高针叶林地上生物量的估算精度。结论 基于Sentinel-2A植被指数与地形特征的针叶林地上生物量反演模型较好,可用于区域生物量估算。该研究对区域性森林资源监测的实际应用具有指导意义。
-
关键词:
- Sentinel-2A /
- 地上生物量 /
- 多元逐步回归 /
- 生物物理参数 /
- 红边波段
Abstract:Objective Forest biomass is the key factor to measure forest carbon reserves. Therefore, accurate estimation of forest biomass is helpful for forest management and resource utilization. The data from Sentinel-2A provide new opportunities for biomass estimation and monitoring due to rich spectral information and high spatial resolution. In this paper, we evaluated the ability of various parameters to estimate aboveground biomass of coniferous forest , and completed regional-scale forest biomass estimation based on Sentinel-2A.Method Selecting the coniferous forest of Wangyedian Forest Farm in Chifeng City, Inner Mongolia of northern China as the research object, this research extracted spectral reflectance, vegetation index and biophysical parameters in Sentinel-2A. Then we set up multiple stepwise regression equations by data types to estimate biomass. In addition, the elevation factor was added to improve the accuracy of model.Result The results showed that: (1) the model built with multiple types of parameters had the highest accuracy, with R2 reaching 0.765 and RMSE was 39.49 t/ha; (2) among the models established by spectral reflectance, vegetation index and biophysical parameters, the accuracy based on the vegetation index was higher, indicating that the vegetation index had a greater impact on coniferous forest aboveground biomass estimation than the spectral reflectance and biophysical parameters; (3) for all the models of our research, elevation always improved accuracy.Conclusion The retrieved aboveground biomass from Sentinel-2A spatial distribution is basically consistent with the actual situation, which shows that the coniferous forest aboveground biomass inversion is meaningful for regional forest resource monitoring. -
-
![]()
图 1 研究区位置及调查样地分布图
Figure 1. Location of study area and distribution of surveying sample plots
![]()
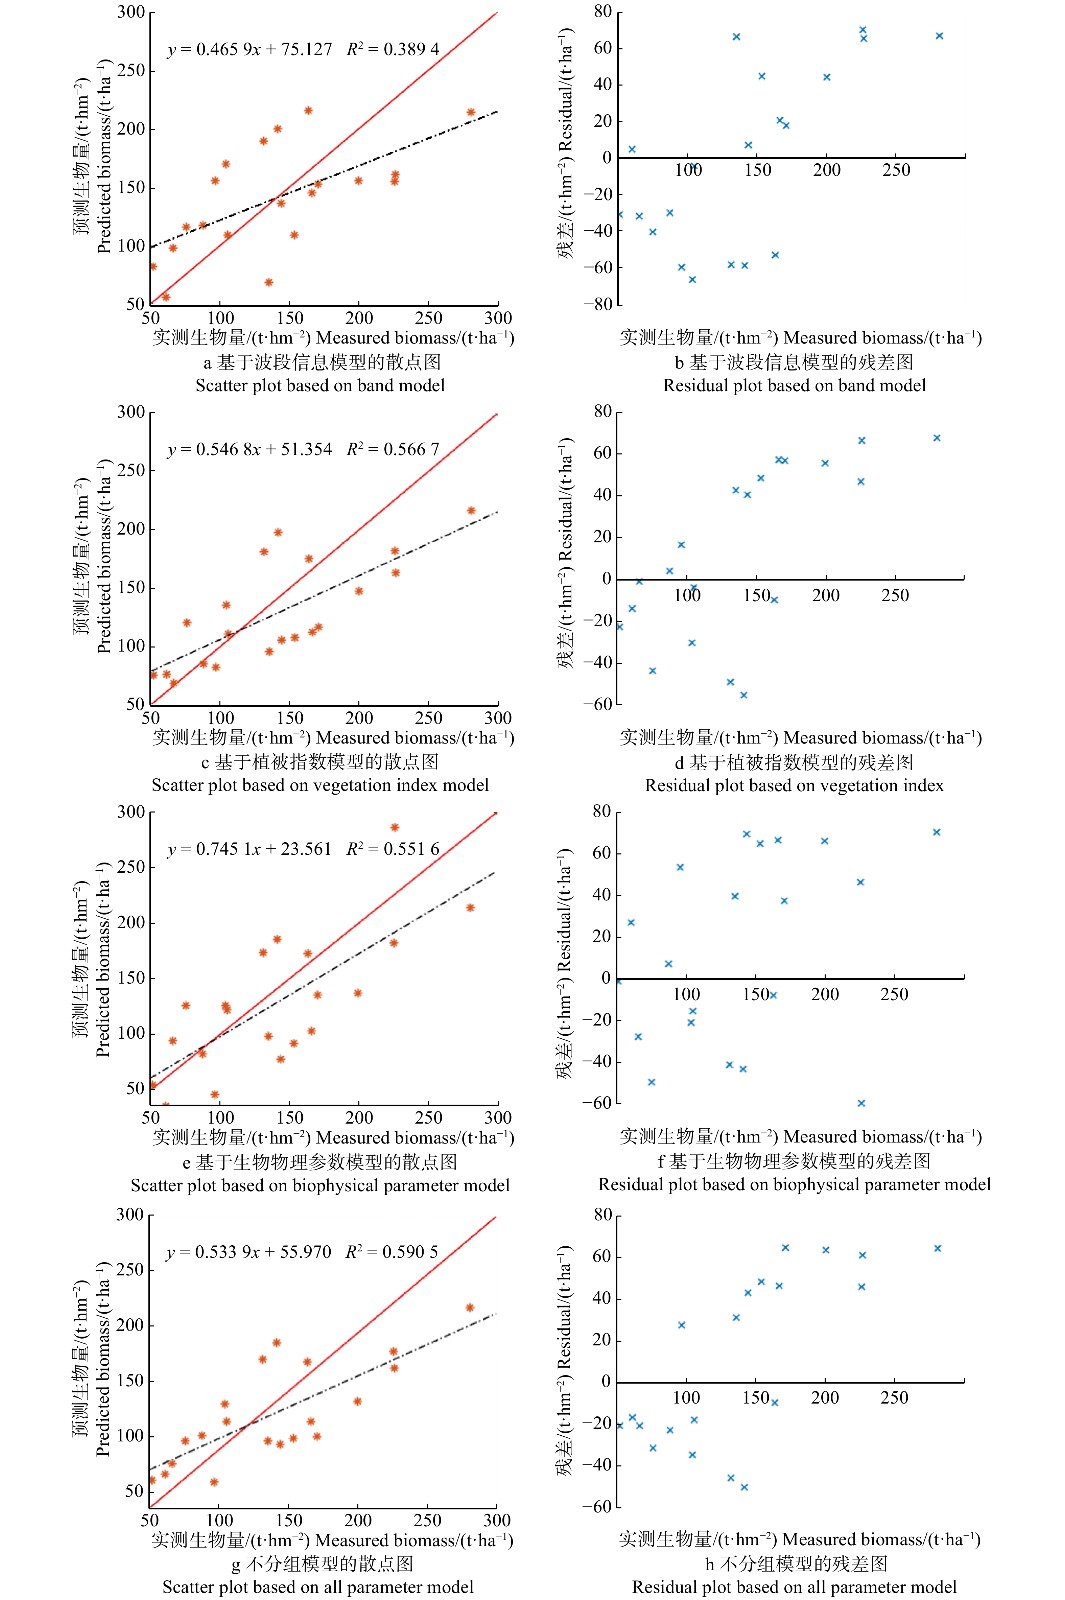
图 3 预估生物量与实测生物量的散点图与残差图
Figure 3. Scatter plots and residual plots of predicted and measured biomass
![]()
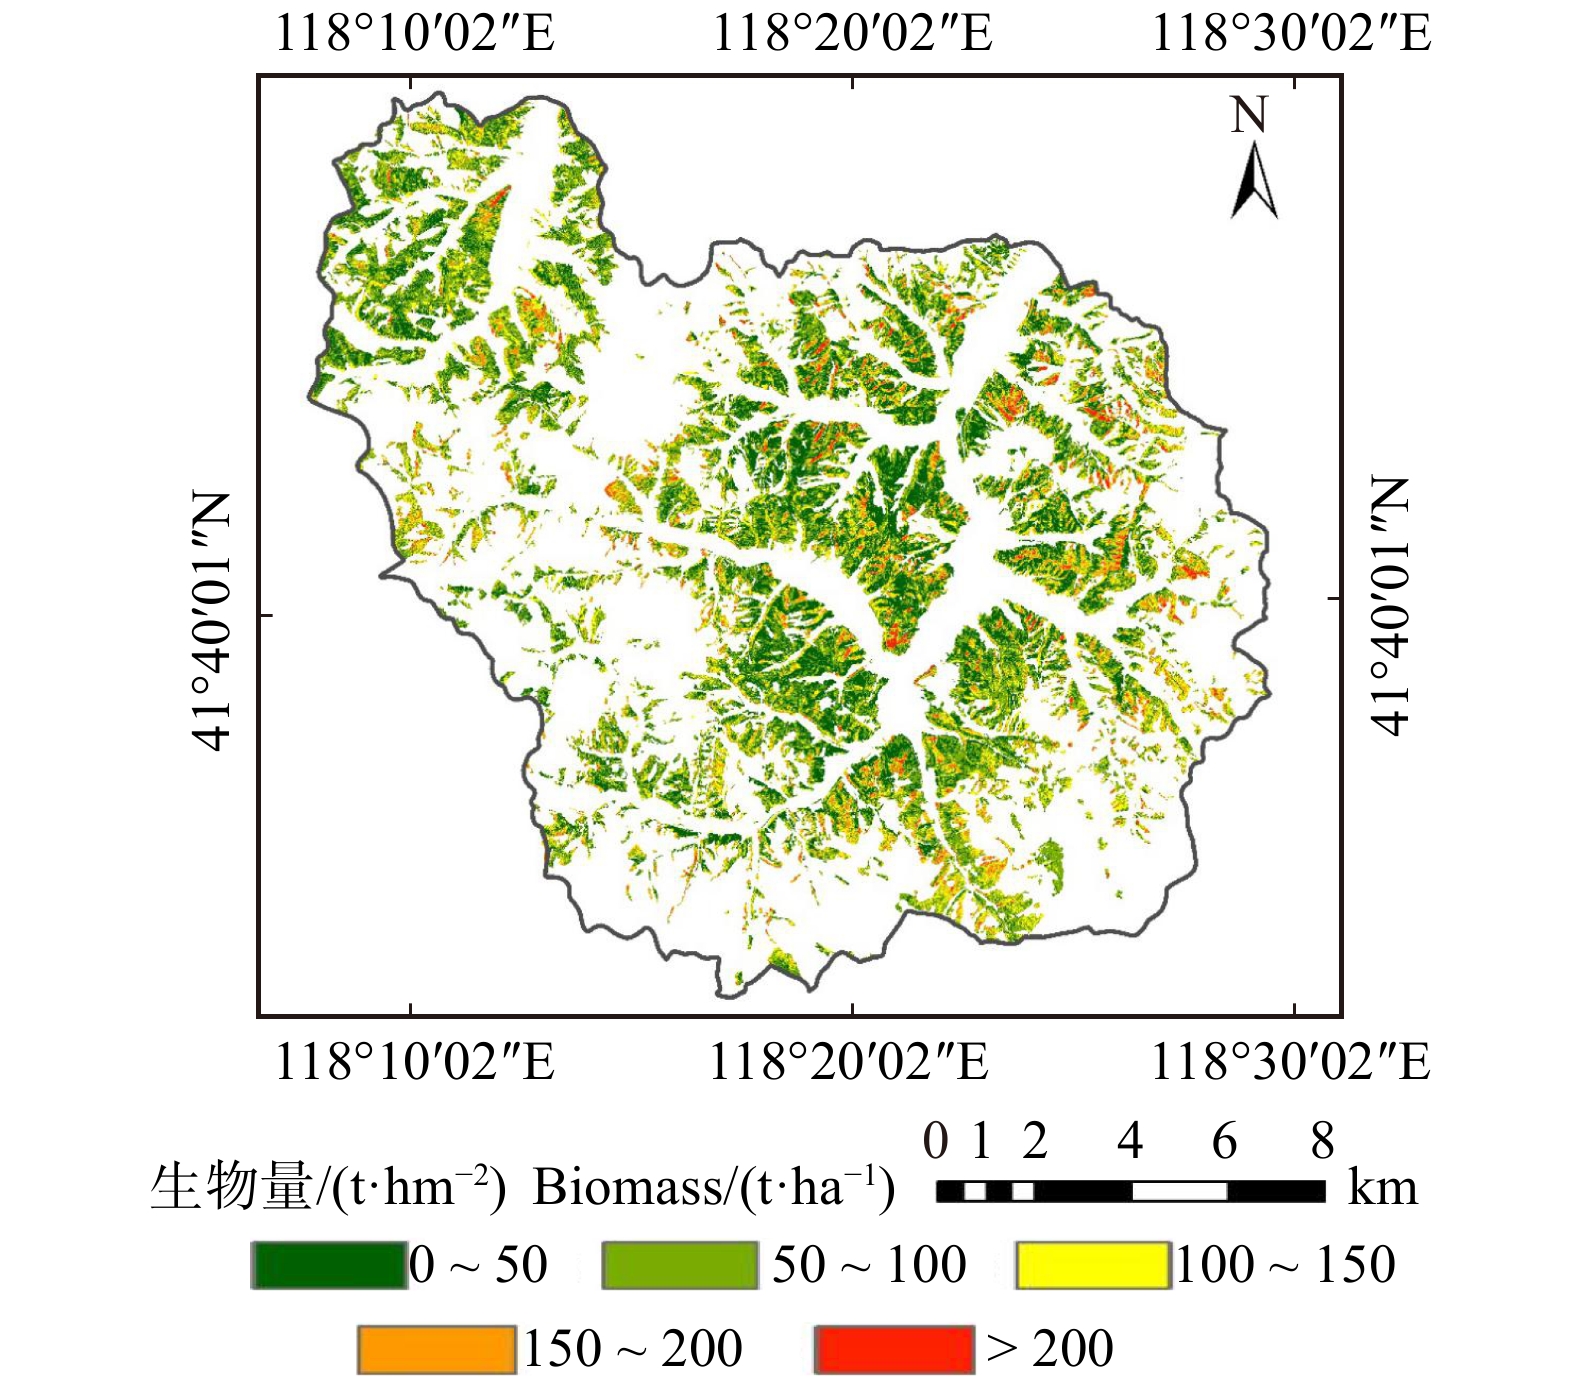
图 4 旺业甸林场针叶林生物量反演分布图
Figure 4. Biomass inversion distribution of coniferous forest in Wangyedian Forest Farm
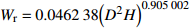
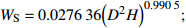
表 1 落叶松、油松的生物量计算模型
Table 1 Biomass calculating models of Larix gmelinii and Pinus tabuliformis
树种(组)
Tree species (group)生物量模型和参数
Biomass model and parameter落叶松 Larix gmelinii Wr=0.046238(D2H)0.905002 油松 Pinus tabuliformis WS=0.027636(D2H)0.9905; WB=0.0091313(D2H)0.982; WL=0.0045755(D2H)0.9894; Wr=WS+WB+WL 注: WS 、WB 、WL 、Wr 分别为树干生物量、树枝生物量、树叶生物量、地上部分总生物量,t/hm2;D为胸径,cm;H为树高,m。Notes:WS ,WB ,WL ,Wr indicate stem biomass, branch biomass, leaf biomass, total aboveground biomass, respectively, t/ha; D is DBH, cm; H is tree height, m. 下载: 导出CSV
表 2 生态变量列表
Table 2 List of ecological variables
数据源
Data source类别
Type变量名称
Variable name属性
Attribute公式
FormulaSentinel-2A 波段信息
Band informationB2 蓝色 Blue
(波长 Wavelength (WL), WL = 490 nm)B3 绿色 Green (WL = 560 nm) B4 红色 Red (WL = 665 nm) B5 红边波段 Red edge band
(WL = 705 nm)B6 红边波段 Red edge band
(WL = 749 nm)B7 红边波段 Red edge band
(WL = 783 nm)B8 近红外 Near infrared (WL = 842 nm) B8a 近红外 Near infrared (WL = 865 nm) B11 短波红外 Shortwave infrared
(WL = 1 610 nm)B12 短波红外 Shortwave infrared
(WL = 2 190 nm)植被指数
Vegetation
indexRVI 比值植被指数
Ratio vegetation indexB8/B4 DVI 差值植被指数
Difference vegetation indexB8 − B4 WDVI 权重差值植被指数
Weighted difference vegetation indexB8−0.5×B4 IPVI 红外植被指数
Infrared vegetation indexB8/(B8 + B4) PVI 垂直植被指数
Perpendicular vegetation indexsin(45∘)×B8−cos(45∘)×B4 NDVI 归一化差值植被指数
Normalized difference vegetation index(B8 − B4)/(B8 + B4) NDVI45 B4和B5归一化差值植被指数
NDVI with band4 and band5(B5 − B4)/(B5 + B4) GNDVI 绿波归一化差值植被指数
NDVI of green band(B7 − B3)/(B7 + B3) IRECI 反红边叶绿素指数
Inverted red edge chlorophyll index(B7 − B4)/(B5/B6) SAVI 土壤调节植被指数
Soil adjusted vegetation index1.5 × (B8 − B4)/8 × (B8 + B4 + 0.5) TSAVI 转化土壤调节植被指数
Transformed soil adjusted vegetation index0.5 × (B8 − 0.5 × B4 − 0.5)/(0.5 × B8 + B4 − 0.15) MSAVI 修正型土壤调节植被指数
Modified soil adjusted vegetation index(2−NDVI×WDVI)×(B8−B4)/8×(B8+B4+1−NDVI×WDVI) MSAVI2 二次修正型土壤调节植被指数
Secondly modified soil adjusted vegetation index0.5×[2×(B8+1)−√(2×B8+1)2−8×(B8−B4)] ARVI 大气阻抗植被指数
Atmospherically resistant vegetation indexB8−(2×B4−B2)/B8+(2×B4−B2) PSSRa 特定色素简单比值植被指数
Pigment specific simple ratio chlorophyll indexB7/B4 MTCI Meris陆地叶绿素指数
Meris terrestrial chlorophyll index(B6 − B5)/(B5 − B4) MCARI 修正型叶绿素吸收比植指数
Modified chlorophyll absorption ratio index[(B5−B4)−0.2×(B5−B3)]×(B5−B4) S2REP “哨兵2号”红边位置指数
Sentinel-2 red edge position index705+35×[(B4+B7)2−B5]×(B6−B5) REIP 红边感染点指数
Red edge infection point index700+40×[(B4+B7)2−B5]/(B6−B5) GEMI 全球环境监测指数
Global environmental monitoring indexeta×(1−0.25×eta)−B4−0.1251−B4,eta=[2×(B8A−B4)+1.5×B8A+0.5×B4]/(B8A+B4+0.5) 生物物理参数
Biophysical parameterLAI 叶面积指数 Leaf area index FVC 植被覆盖度 Vegetation coverage FAPAR 有效光合吸收辐射度
Effective photosynthetically absorbed radianceCab 叶绿素含量 Chlorophyll content Cwc 冠层水分含量 Canopy water content SRTM DEM 地形指数
Topographic indexH 高程 Elevation
下载: 导出CSV
表 3 变量与地上生物量之间的相关性分析
Table 3 Correlation analysis of aboveground biomass and variables
变量
Variable相关系数
Correlation coefficient变量
Variable相关系数
Correlation coefficient变量
Variable相关系数
Correlation coefficient变量
Variable相关系数
Correlation coefficientB2 −0.590** RVI 0.748** TSAVI −0.092 LAI 0.527** B3 −0.588** DVI −0.352* MSAVI −0.418** FVC −0.123 B4 −0.526** WDVI −0.405** MSAVI2 −0.267 FAPAR 0.528** B5 −0.572** IPVI 0.582** ARVI −0.534** Cab 0.459** B6 −0.489** PVI 0.462** PSSRa 0.757** Cwc 0.643** B7 −0.417** NDVI 0.582** MTCI 0.700** H 0.425** B8 −0.442** NDVI45 0.569** MCARI −0.502** B8a −0.444** GNDVI 0.685** S2REP 0.105 B11 −0.582** IRECI 0.589** REIP 0.620** B12 −0.585** SAVI −0.393** GEMI −0.311* 注:*代表显著性水平为0.05,**代表显著性水平为0.01。下同。Notes: * means the significance level is 0.05 and ** is 0.01. Same as below.
下载: 导出CSV
表 4 模型评价结果
Table 4 Evaluation results of models
数据源
Data source类别
Type预测变量
Predictive variable决定系数
R2显著性
Significance均方根误差/(t·hm−2)
RMSE/(t·ha−1)Sentinel-2A 波段信息 Band information B4 + B12 0.465 < 0.01 49.27 B4 + B12 + H 0.523 < 0.01 47.33 植被指数 Vegetation index PSSRa + AVRI 0.601 < 0.01 44.08 PSSRa + AVRI + H 0.682 < 0.01 41.14 生物物理参数 Biophysical parameter LAI + FAPAR + Cwc 0.506 < 0.01 46.31 LAI + FAPAR + Cwc + H 0.604 < 0.01 44.62 不分组 No grouping PSSRa + AVRI + Cwc 0.673 < 0.01 41.84 PSSRa + AVRI + Cwc + H 0.765 < 0.01 39.49
下载: 导出CSV
表 5 模型精度评价表
Table 5 Evaluation of model accuracy
类别
Type模型方程
Model equation均方根误差/(t·hm−2)
RMSE/(t·ha−1)相对均方根误差
Relative root mean
square error (rRMSE)/%平均绝对百分误差
Mean absolute
percentage error/%波段信息
Band informationY = −104.388 − 47 558.708 × B12 +
20 487 × B4 + 0.255 × H47.33 33.97 33.03 植被指数
Vegetation indexY = 214.919 + 22.950 × PSSRa −
735.420 × AVRI + 0.176 × H41.14 29.53 25.98 生物物理参数
Biophysical parameterY = −1 059.178 + 8 097.090 × Cwc −
1 219.432 × LAI + 4 037.249 × FAPAR + 0.441 × H44.62 32.03 29.73 不分组
No groupingY = 147.724 + 19.581 × PSSRa − 770.512 ×
AVRI + 1 593.239 × Cwc + 0.230 × H39.49 28.35 27.96
下载: 导出CSV
-
[1] Hu X, Zhang L, Ye L, et al. Locating spatial variation in the association between road network and forest biomass carbon accumulation[J]. Ecological Indicators, 2017, 73: 214−223. doi: 10.1016/j.ecolind.2016.09.042.
[2] Seedre M, Janda P, Trotsiuk V, et al. Biomass carbon accumulation patterns throughout stand development in primary uneven-aged forest driven by mixed-severity natural disturbances[J/OL]. Forest Ecology and Management, 2020, 455 (2019−11−18) [2020−02−01]. https://doi.org/10.1016/j.foreco.2019.117676.
[3] Drake J F, Swisdak M, Cattell C, et al. Formation of electron holes and particle energization during magnetic reconnection[J]. Science, 2003, 299(5608): 873−877. doi: 10.1126/science.1080333.
[4] 刘茜, 杨乐, 柳钦火, 等. 森林地上生物量遥感反演方法综述[J]. 遥感学报, 2015, 19(1):62−74. doi: 10.11834/jrs.20154108. Liu Q, Yang L, Liu Q H, et al. Summary of remote sensing inversion methods for forest aboveground biomass[J]. Journal of Remote Sensing, 2015, 19(1): 62−74. doi: 10.11834/jrs.20154108.
[5] 冯宗炜, 陈楚莹, 张家武, 等. 湖南会同地区马尾松林生物量的测定[J]. 林业科学, 1982(2):127−134. Feng Z W, Chen C Y, Zhang J W, et al. Biomass determination of Pinus massoniana forest in Huitong Area, Hunan[J]. Forestry Science, 1982(2): 127−134.
[6] 李德仁, 王长委, 胡月明, 等. 遥感技术估算森林生物量的研究进展[J]. 武汉大学学报(信息科学版), 2012, 37(6):631−635. Li D R, Wang C W, Hu Y M, et al. Research advances in forest biomass estimation using remote sensing technology[J]. Journal of Wuhan University (Information Science Edition), 2012, 37(6): 631−635.
[7] Dong J, Kaufmann R K, Myneni R B, et al. Remote sensing estimates of boreal and temperate forest woody biomass: carbon pools, sources, and sinks[J]. Remote Sensing of Environment, 2003, 84(3): 393−410. doi: 10.1016/S0034-4257(02)00130-X.
[8] Kumar S, Khati U G, Chandola S, et al. Polarimetric SAR interferometry based modeling for tree height and aboveground biomass retrieval in a tropical deciduous forest[J]. Advances in Space Research, 2017, 60(3): 571−586. doi: 10.1016/j.asr.2017.04.018.
[9] Ho T M, Le T T, Rocca F, et al. SAR tomography for the retrieval of forest biomass and height: cross-validation at two tropical forest sites in French Guiana[J]. Remote Sensing of Environment, 2016, 175: 138−147. doi: 10.1016/j.rse.2015.12.037.
[10] 王月婷. 基于多源遥感数据的森林蓄积量估算[D]. 北京: 北京林业大学, 2015. Wang Y T. Forest volume estimation based on multi-source remote sensing data[D]. Beijing: Beijing Forestry University, 2015.
[11] Castillo M, Rivard B, Sánchez-Azofeifa A, et al. LIDAR remote sensing for secondary tropical dry forest identification[J]. Remote Sensing of Environment, 2012, 121: 132−143. doi: 10.1016/j.rse.2012.01.012.
[12] Nelson R, Oderwald R, Gregoire T G. Separating the ground and airborne laser sampling phases to estimate tropical forest basal area, volume, and biomass[J]. Remote Sensing of Environment, 1997, 60(3): 311−326. doi: 10.1016/S0034-4257(96)00213-1.
[13] 田昕, 陈尔学, 李增元, 等. 基于多极化星载SAR数据的水稻/旱田识别——以江苏省海安县为例[J]. 遥感技术与应用, 2012, 27(3):406−412. doi: 10.11873/j.issn.1004-0323.2012.3.406. Tian X, Chen E X, Li Z Y, et al. Rice/dry field recognition based on multipolar spaceborne SAR data: a case study of Hai'an county, Jiangsu Province[J]. Remote Sensing Technology and Application, 2012, 27(3): 406−412. doi: 10.11873/j.issn.1004-0323.2012.3.406.
[14] Israelsson H, Askne J, Sylvander R. Potential of SAR for forest bole volume estimation[J]. International Journal of Remote Sensing, 1994, 15(14): 2809−2826. doi: 10.1080/01431169408954286.
[15] Sandberg G, Ulander L M H, Fransson J E S, et al. L- and P-band backscatter intensity for biomass retrieval in hemiboreal forest[J]. Remote Sensing of Environment, 2011, 115(11): 2874−2886. doi: 10.1016/j.rse.2010.03.018.
[16] 冯琦, 陈尔学, 李增元, 等. 基于机载P-波段全极化SAR数据的复杂地形森林地上生物量估测方法[J]. 林业科学, 2016, 52(3):10−22. Feng Q, Chen E X, Li Z Y, et al. Estimation of aboveground biomass in complex terrain based on airborne P-band full-polarization SAR data[J]. Forestry Science, 2016, 52(3): 10−22.
[17] 谭炳香. 浅谈星载SAR的森林应用[J]. 遥感信息, 1995(3):40−41. Tan B X. The forest application of spaceborne SAR[J]. Remote Sensing Information, 1995(3): 40−41.
[18] 肖虹雁, 岳彩荣. 合成孔径雷达技术在林业中的应用综述[J]. 林业调查规划, 2014, 39(2):132−137. doi: 10.3969/j.issn.1671-3168.2014.02.029. Xiao H Y, Yue C R. Overview of the application of synthetic aperture radar technology in forestry[J]. Forestry Survey Planning, 2014, 39(2): 132−137. doi: 10.3969/j.issn.1671-3168.2014.02.029.
[19] 吴一戎, 朱敏慧. 合成孔径雷达技术的发展现状与趋势[J]. 遥感技术与应用, 2000(2):121−123. doi: 10.3969/j.issn.1004-0323.2000.02.012. Wu Y R, Zhu M H. Development status and trend of synthetic aperture radar technology[J]. Remote Sensing Technology and Application, 2000(2): 121−123. doi: 10.3969/j.issn.1004-0323.2000.02.012.
[20] Næsset E, Gobakken T, Solberg S, et al. Model-assisted regional forest biomass estimation using LiDAR and InSAR as auxiliary data: a case study from a boreal forest area[J]. Remote Sensing of Environment, 2011, 115(12): 3599−3614. doi: 10.1016/j.rse.2011.08.021.
[21] Zhao K, Popescu S, Nelson R. Lidar remote sensing of forest biomass: a scale-invariant estimation approach using airborne lasers[J]. Remote Sensing of Environment, 2009, 113(1): 182−196. doi: 10.1016/j.rse.2008.09.009
[22] 邹永林. 归并排序的概念与算法设计[J]. 现代计算机(专业版), 2015(20):48−51. Zou Y L. Concept and algorithm design of merge sort[J]. Modern Computer (Professional Edition), 2015(20): 48−51.
[23] Muukkonen P, Heiskanen J. Estimating biomass for boreal forests using ASTER satellite data combined with standwise forest inventory data[J]. Remote Sensing of Environment, 2005, 99(4): 434−447. doi: 10.1016/j.rse.2005.09.011.
[24] 田颖, 陈卓奇, 惠凤鸣, 等. 欧空局哨兵卫星Sentinel-2A/B数据特征及应用前景分析[J]. 北京师范大学学报(自然科学版), 2019, 55(1):57−65. Tian Y, Chen Z Q, Hui F M, et al. Data characteristics and application prospect analysis of ESA sentinel satellite Sentinel-2A/B[J]. Journal of Beijing Normal University (Natural Science Edition), 2019, 55(1): 57−65.
[25] 安海波, 李斐, 赵萌莉, 等. 基于优化光谱指数的牧草生物量估算[J]. 光谱学与光谱分析, 2015, 35(11):3155−3160. An H B, Li F, Zhao M L, et al. Forage biomass estimation based on optimized spectral index[J]. Spectroscopy and Spectral Analysis, 2015, 35(11): 3155−3160.
[26] 郑阳, 吴炳方, 张淼. Sentinel-2数据的冬小麦地上干生物量估算及评价[J]. 遥感学报, 2017, 21(2):318−328. doi: 10.11834/jrs.20176269. Zheng Y, Wu B F, Zhang M. Aboveground dry biomass estimation and evaluation of winter wheat based on Sentinel-2 data[J]. Journal of Remote Sensing, 2017, 21(2): 318−328. doi: 10.11834/jrs.20176269.
[27] 曹霖, 彭道黎, 王雪军, 等. 应用Sentinel-2A卫星光谱与纹理信息的森林蓄积量估算[J]. 东北林业大学学报, 2018, 46(9):54−58. doi: 10.3969/j.issn.1000-5382.2018.09.012. Cao L, Peng D L, Wang X J, et al. Forest volume estimation using Sentinel-2A satellite spectrum and texture information[J]. Journal of Northeast Forestry University, 2018, 46(9): 54−58. doi: 10.3969/j.issn.1000-5382.2018.09.012.
[28] Pandit S, Tsuyuki S, Dube T. Estimating above-ground biomass in sub-tropical buffer zone community forests, nepal, using sentinel 2 data[J]. Remote Sensing, 2018, 10(4): 601. doi: 10.3390/rs10040601.
[29] 陈瑜云. 基于Sentinel-2影像数据的毛竹林生物量估测[D]. 杭州: 浙江农林大学, 2019. Chen Y Y. Biomass estimation of Phyllostachys pubescens forest based on Sentinel-2 image data[D]. Hangzhou: Zhejiang Agriculture and Forestry University, 2019.
[30] Immitzer M, Vuolo F, Atzberger C. First experience with Sentinel-2 data for crop and tree species classifications in Central Europe[J]. Remote Sensing, 2016, 8(3): 166. doi: 10.3390/rs8030166.
[31] 毕恺艺, 牛铮, 黄妮, 等. 基于Sentinel-2A时序数据和面向对象决策树方法的植被识别[J]. 地理与地理信息科学, 2017, 33(5):16−20. doi: 10.3969/j.issn.1672-0504.2017.05.003. Bi K Y, Niu Z, Huang N, et al. Vegetation recognition based on Sentinel-2A time series data and object-oriented decision tree method[J]. Geography and Geographic Information Science, 2017, 33(5): 16−20. doi: 10.3969/j.issn.1672-0504.2017.05.003.
[32] 杨斌, 李丹, 王磊, 等. 基于Sentinel-2A岷江上游地表生物量反演与植被特征分析[J]. 科技导报, 2017, 35(21):74−80. Yang B, Li D, Wang L, et al. Analysis of surface biomass inversion and vegetation characteristics based on Sentinel-2A upper Minjiang River[J]. Science & Technology Review, 2017, 35(21): 74−80.
[33] 李海奎, 雷渊才. 中国森林植被生物量和碳储量评估[M]. 北京: 中国林业出版社, 2010. Li H K, Lei Y C. Assessment of biomass and carbon storage of forest vegetation in China[M]. Beijing: China Forestry Publishing House, 2010.
[34] Wang M, Sun R, Xiao Z. Estimation of forest canopy height and aboveground biomass from spaceborne LiDAR and Landsat Imageries in Maryland[J]. Remote Sensing, 2018, 10(2): 344. doi: 10.3390/rs10020344.
[35] Chiang S H, Valdez M, Chen C F. Forest tree species distribution mapping using Landsat satellite imagery and topographic variables with the maximum entropy method in Mongolia[J]. The International Archives of the Photogrammetry, Remote Sensing and Spatial Information Sciences, 2016, XLI-B8: 593−596. doi: 10.5194/isprsarchives-XLI-B8-593-2016.
[36] Dorren L K A, Maier B, Seijmonsbergen A C. Improved Landsat-based forest mapping in steep mountainous terrain using object-based classification[J]. Forest Ecology and Management, 2003, 183(1): 31−46.
[37] Liu Y, Gong W, Hu X, et al. Forest type identification with Random Forest using Sentinel-1A, Sentinel-2A, multi-temporal Landsat-8 and DEM data[J]. Remote Sensing, 2018, 10(6): 946. doi: 10.3390/rs10060946.
-
期刊类型引用(5)
1. 买永辉,贾艳玲,齐蓉,陈帅,王宏彬,丁志辉. 基于LoRa的沙漠近地环境参数监测系统设计. 数字技术与应用. 2023(07): 163-165 .  百度学术
百度学术
2. 屈英,刘小强,李明淇. 枣树滴灌水肥一体化发展现状及建议. 河北农机. 2023(18): 94-96 . 百度学术
3. 丁磊,鲁延芳,占玉芳,甄伟玲,滕玉风,钱万建. 沙荒地红枣矮化密植丰产栽培技术. 林业科技通讯. 2022(04): 78-81 . 百度学术
4. 韩齐齐,张娅妮,冯荦荦,闫欣鹏,张有林. 冬枣采后生理与气调贮藏关键技术研究. 食品与发酵工业. 2021(04): 33-39 . 百度学术
5. 张波,吕廷波,赵秀杰,王东旺,徐强,邢猛,周小杰. 不同灌溉定额对滴灌骏枣生长的影响. 水土保持学报. 2021(06): 168-174+182 . 百度学术
其他类型引用(1)


计量
- 文章访问数: 2299
- HTML全文浏览量: 771
- PDF下载量: 125
- 被引次数: 6
