
Spatio-temporal evolution and driving factors of ecosystem services in Chengdu-Chongqing urban agglomeration of southwestern China based on GWR model
-
摘要:目的 对成渝城市群自然生态系统服务时空演变特征与驱动因素进行研究,有助于规划者从宏观尺度上掌握其自然资源存量情况与发展趋势,合理拟定成渝城市群规划建设策略,从而推动我国西部大开发平台建设。方法 选择成渝城市群为研究对象,以144个市、县、区作为研究单元,通过当量因子法量化其生态系统服务,建立“自然—社会”驱动因子指标体系,在此基础上运用最小二乘法(OLS)模型筛选具有显著相关性的驱动因子,运用地理加权回归(GWR)构建回归模型,研究成渝城市群自然社会因素对生态系统服务的驱动作用。结果 (1)成渝城市群生态系统服务总量劣化趋势显著,1995—2015年间(1995、2000、2005、2010、2015年,共5期)成渝城市群生态系统服务价值分别为3 470.53亿、3 464.08亿、3 452.43亿、3 438.02亿和3 423.92亿元,分别比前一期下降6.45亿、11.65亿、14.40亿和14.10亿元;(2)成渝城市群生态系统服务空间分布以成都、重庆两处核心城市中心区与缙云—中梁山脉中心区呈现显著区域化分布特征,全域超过90.38%的区域生态系统服务均处于下降趋势;(3)降雨量、温度、单位面积平均GDP、林业用地比例、人口密度5项驱动因子对成渝城市群生态系统服务具有显著影响。其中,降雨量、单位面积平均GDP呈现较明显的负相关驱动特征,林地覆盖比例呈现较明显的正相关驱动特征,降雨量与人口密度则呈现较明显的两极化趋势。结论 本研究明确了在研究期限内成渝城市群生态系统服务逐渐劣化的发展状态,所构建的地理加权回归(GWR)模型在空间层面上量化降雨量、温度、单位面积平均GDP、林业用地比例、人口密度5项主要驱动因素对成渝城市群生态系统服务所呈现的不同驱动特征与驱动强度,为成渝城市群长远规划提供决策依据。Abstract:Objective The study on the temporal and spatial evolution characteristics and driving factors of the ecosystem services of Chengdu-Chongqing urban agglomeration can help planners grasp its situation of natural resource stock and development trend on a macro scale, reasonably formulate the planning and construction strategy of Chengdu-Chongqing urban agglomeration of southwestern China, so as to promote the construction of China’s western development platform.Method In this study, the whole region of Chengdu-Chongqing urban agglomeration was selected as the research object, and 144 districts, counties and regions were taken as the research units. The values of ecosystem services were quantified by equivalent factor method, and the bi-directional driving factor index system of “natural environment-social economy” was established. On this basis, the least square method (OLS) model was used to screen the driving factor models with significant correlation, and the geographical weighted regression (GWR) model was used to study the driving correlation between the ecosystem services, natural environment characteristics and socio-economic factors of Chengdu-Chongqing urban agglomeration.Result (1) The total amount of ecosystem services of Chengdu-Chongqing urban agglomeration showed a significant trend of deterioration. From 1995 to 2015(totally 5 periods, i.e. 1995, 2000, 2005, 2010, 2015), the ecosystem service values of Chengdu-Chongqing urban agglomeration were 347.053, 346.408, 345.243, 343.802 and 342.392 billion CNY, respectively, showing a value decline of 0.645 billion, 1.165 billion, 1.440 billion and 1.410 billion CNY, respectively compared with the former period. (2) The spatial distribution of ecosystem services in Chengdu-Chongqing urban agglomeration was characterized by significant regional distribution in the core urban centers of Chengdu and Chongqing and the central area of Jinyun-Zhongliang Mountains. More than 90.38% of the regional ecosystem services in the whole region were in a downward trend. (3) Research results on ecological driving factors of Chengdu-Chongqing urban agglomeration showed that, five driving factors, namely rainfall, temperature, per capita GDP, forestry land ratio and population density, had significant influences on ecosystem services of Chengdu-Chongqing urban agglomeration. Among them, rainfall and land per capita GDP showed obvious negative correlation driving characteristics, the proportion of forest land showed obvious positive correlation driving characteristics, and rainfall and population density showed obvious polarization trend.Conclusion In this study, the status of deterioration of ecosystem services in Chengdu-Chongqing urban agglomeration was clarified. The GWR (geographic weighted regression) model was constructed to quantify the different driving characteristics and driving intensities of the five main driving factors of rainfall, temperature, land average GDP, forestry land proportion and population density on the ecosystem services of Chengdu-Chongqing urban agglomeration, which provide decision-making basis for the long-term planning of Chengdu-Chongqing urban agglomeration.
-
-
![]()
图 1 成渝城市群生态系统服务评价
Figure 1. Ecosystem service evaluation of Chengdu-Chongqing urban agglomeration
![]()
图 2 地理加权回归(GWR)模型拟合结果
Figure 2. Fitting result of geographically weighted regression (GWR) model
![]()
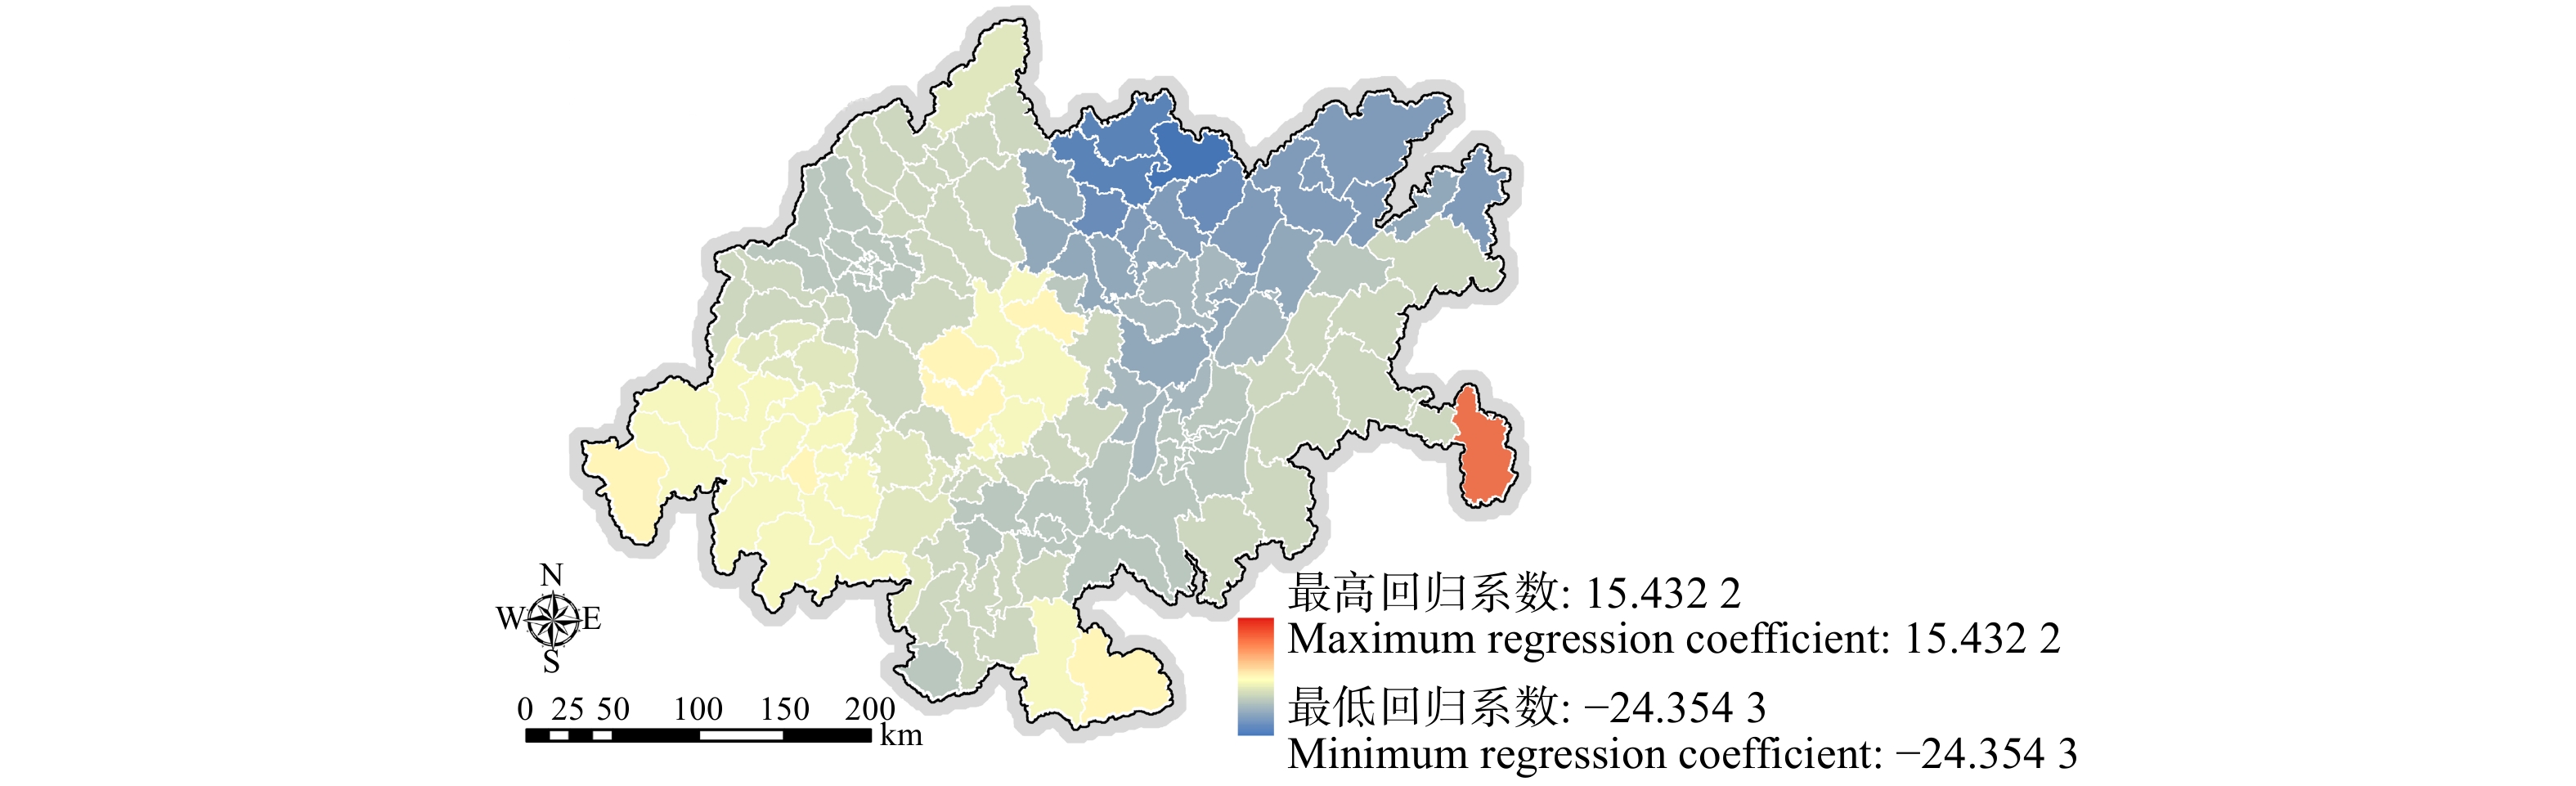
图 3 成渝城市群温度与生态系统服务回归系数空间分布
Figure 3. Spatial distribution of regression coefficients between temperature and ecosystem service in Chengdu-Chongqing urban agglomeration
![]()
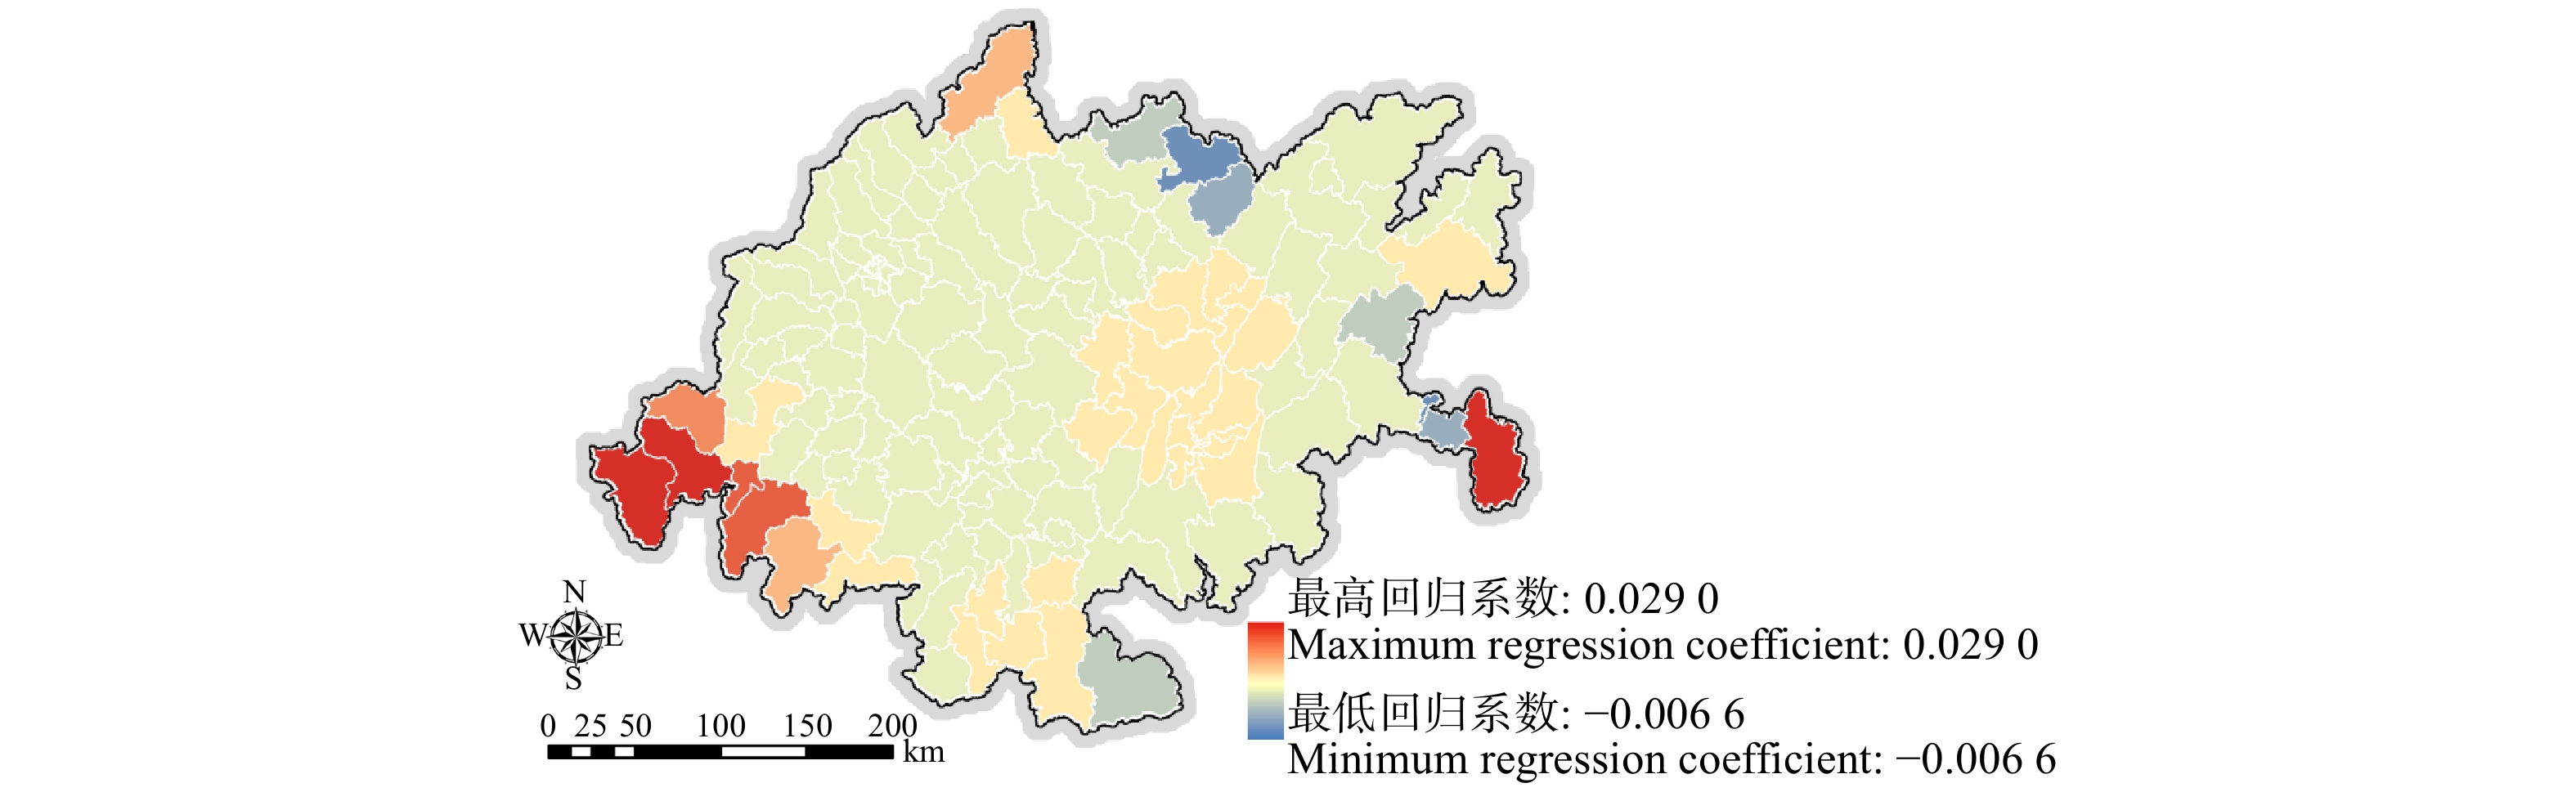
图 7 成渝城市群人口密度与生态系统服务回归系数空间分布
Figure 7. Spatial distribution of regression coefficients between population density and ecosystem service in Chengdu-Chongqing urban agglomeration
![]()
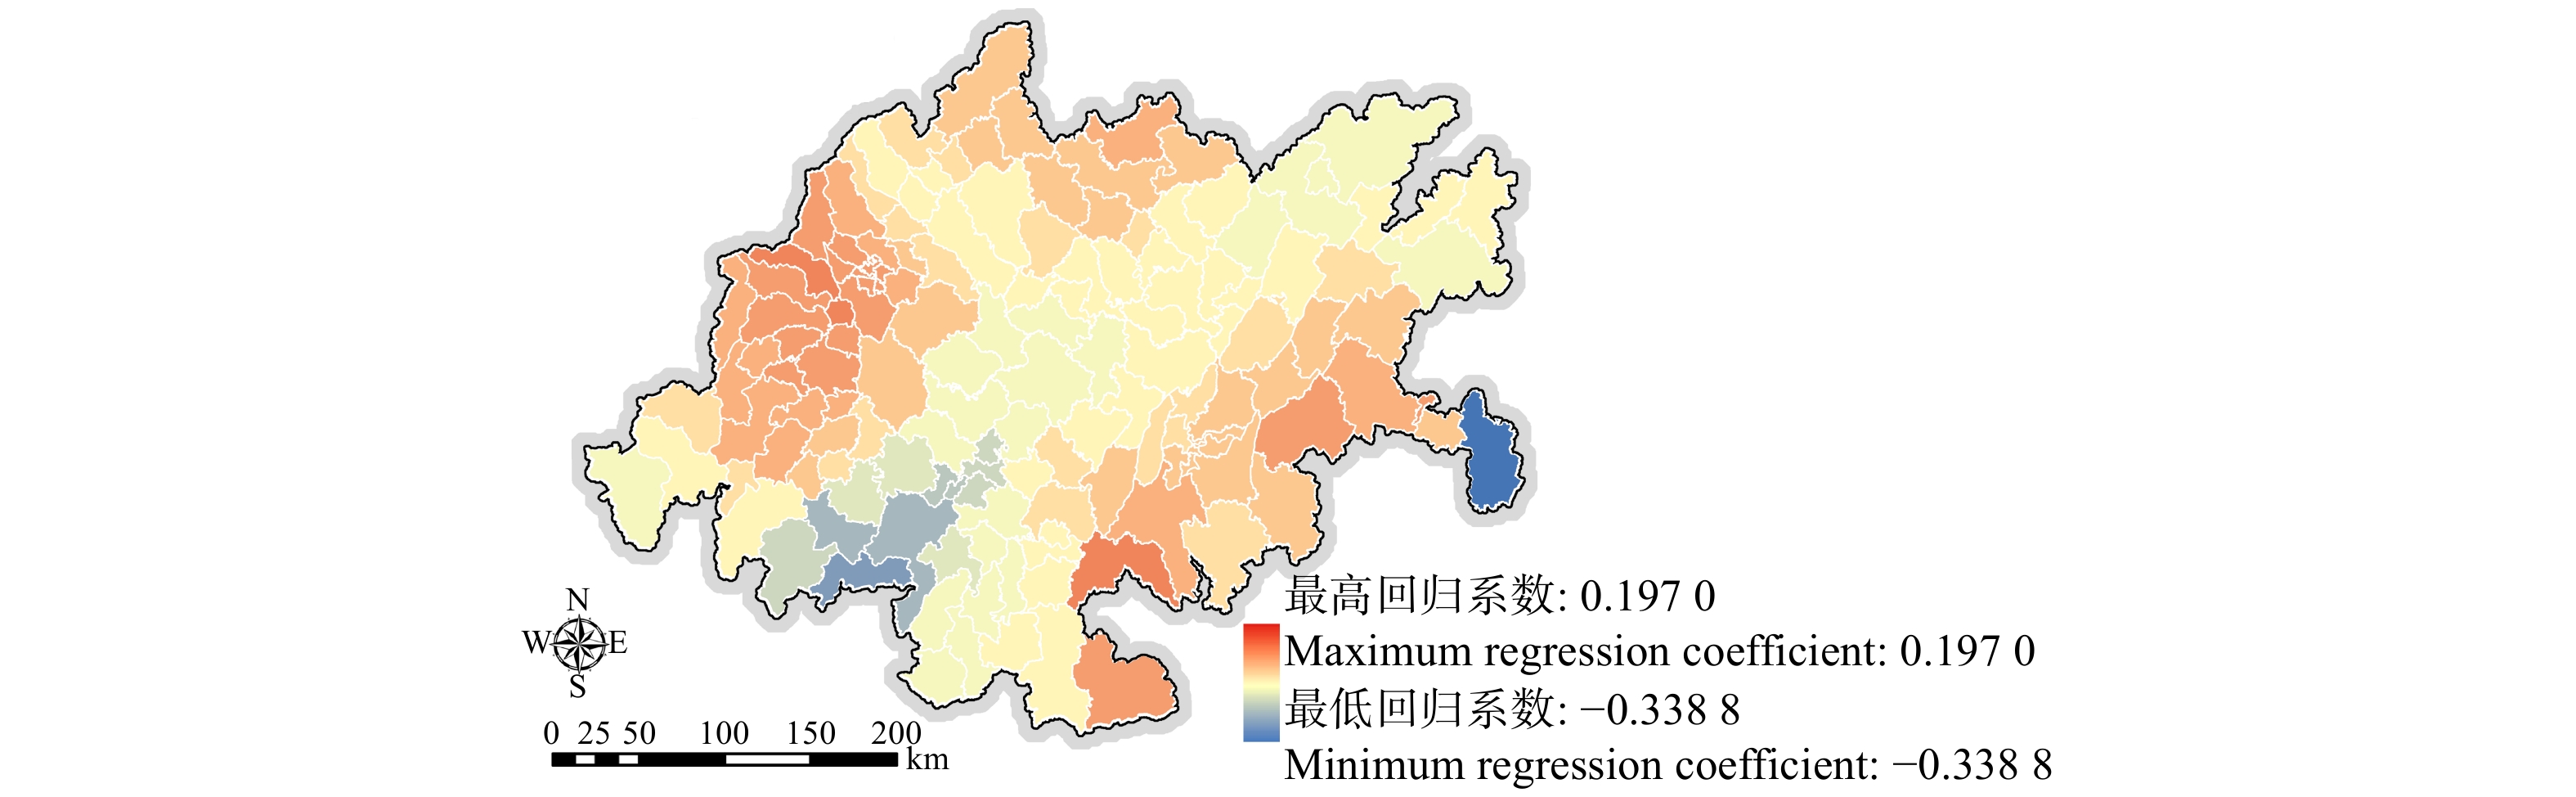
图 4 成渝城市群降雨量与生态系统服务回归系数空间分布
Figure 4. Spatial distribution of regression coefficients between rainfall and ecosystem service in Chengdu-Chongqing urban agglomeration
![]()
图 5 成渝城市群林地覆盖比例与生态系统服务回归系数空间分布
Figure 5. Spatial distribution of regression coefficients between forest land proportion and ecosystem service in Chengdu-Chongqing urban agglomeration
![]()
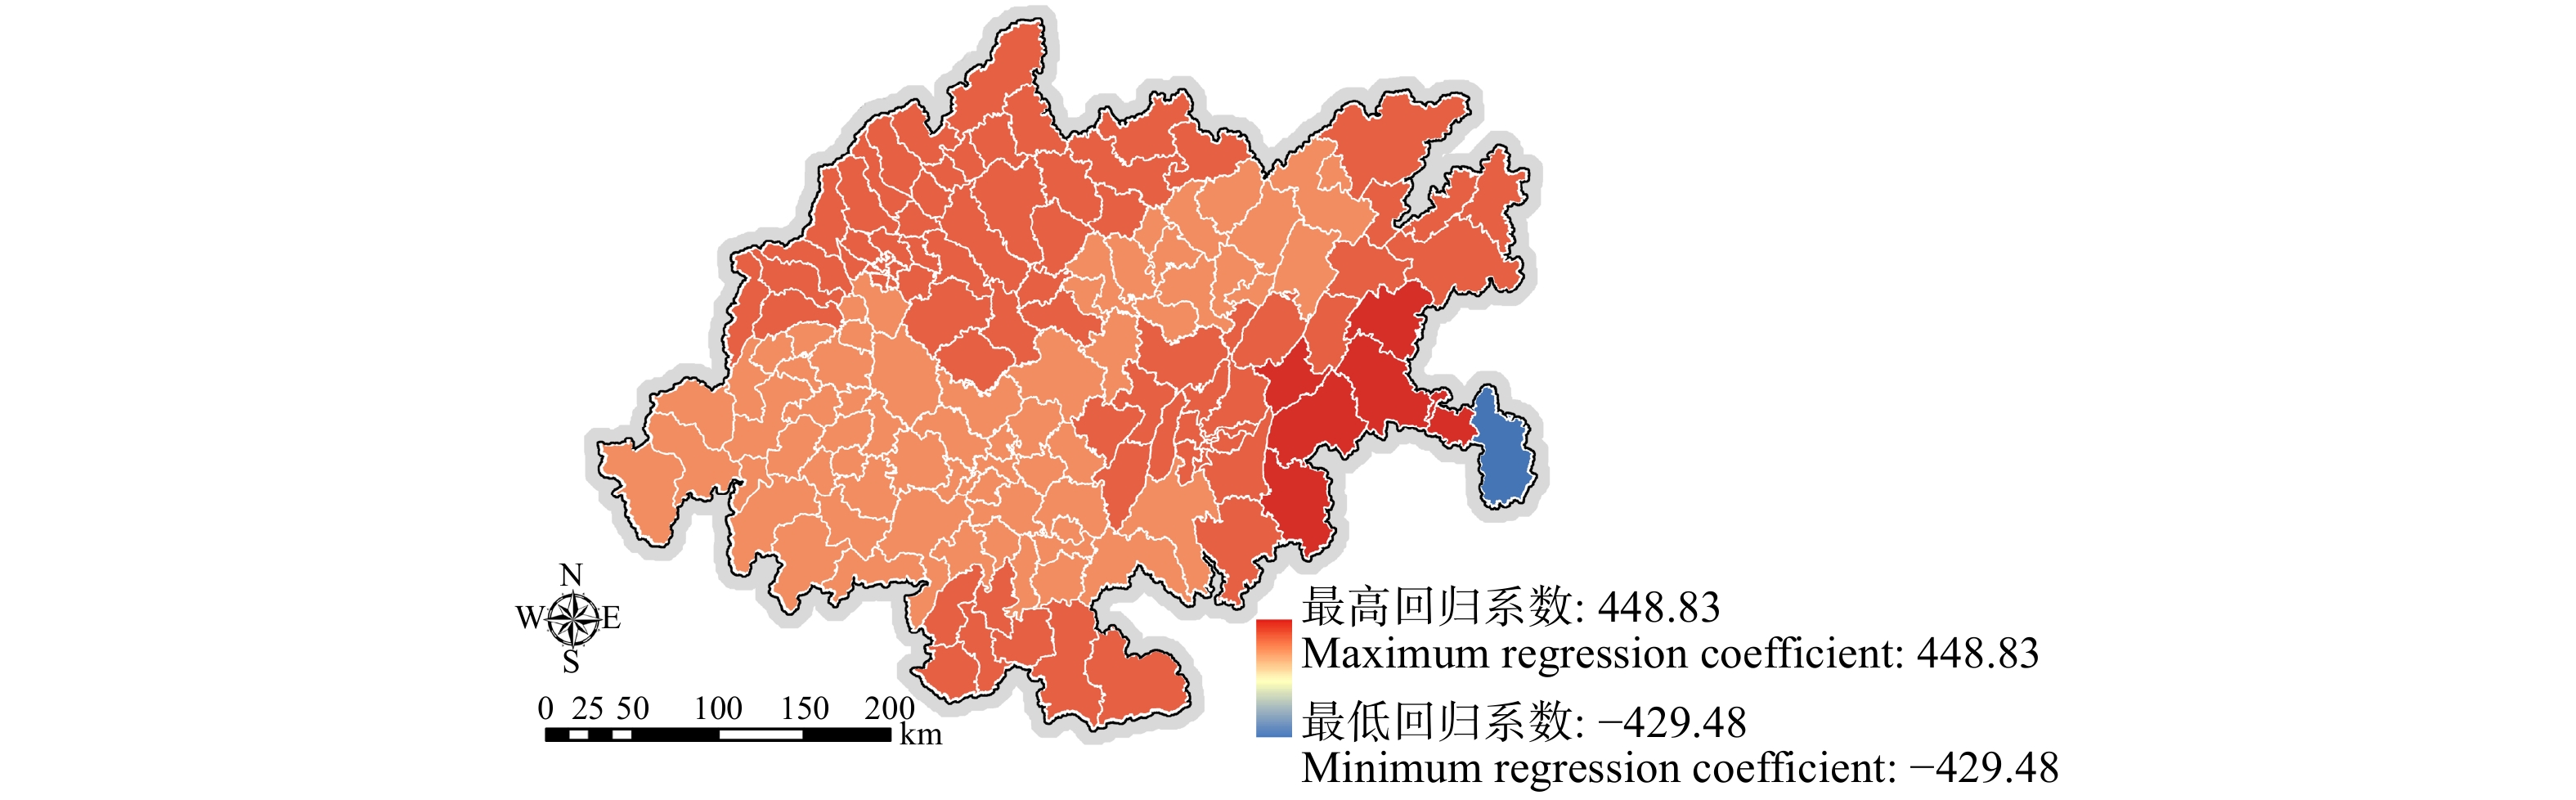
图 6 成渝城市群单位面积平均GDP与生态系统服务回归系数空间分布
Figure 6. Spatial distribution of regression coefficients between average GDP per unit area and ecosystem service in Chengdu-Chongqing urban agglomeration
表 1 数据来源及精度表
Table 1 Data sources and accuracy table
数据名称
Data name数据描述
Data description数据格式/精度
Data format/accuracy数据来源
Data source行政边界
Administrative boundary正式政府规划边界
Official government planning boundaryShp 《成渝城市群发展规划》
Chengdu-Chongqing City Cluster Development Plan土地利用
Land use土地利用
Land useRaster/250 m 欧洲航天航空局(ESA)
European Space Agency农产经济数据
Agricultural economic data四川省粮食经济数据
Grain economic data of Sichuan ProvinceExcel 《中国农产品成本收益资料汇编》《中国统计年鉴》
Data Collection on the Cost and Benefit of China’s Agricultural Products (China Statistical Yearbook)高程
Elevation平均高程数据
Data of average elevationRaster/30 m 地理空间数据云平台(http://www.gscloud.cn/)
Geospatial data cloud platform (http://www.gscloud.cn/)植被覆盖指数
Vegetation coverage index(NDVI)年均NDVI
Average annual NDVIRaster/500 m 地理空间数据云平台(http://www.gscloud.cn/)
Geospatial data cloud platform (http://www.gscloud.cn/)降雨量
Rainfall年均降雨量
Average annual rainfallRaster/1 km 中国科学院资源环境科学数据中心(www.resdc.cn)
Data Center for Resources and Environmental Sciences, Chinese Academy of Sciences (www.resdc.cn)温度
Temperature年均地表温度
Average annual land surface temperatureRaster/1 km 中国科学院资源环境科学数据中心(www.resdc.cn)
Data Center for Resources and Environmental Sciences, Chinese Academy of Sciences (www.resdc.cn)单位面积GDP
GDP per unit area每平方公里平均GDP
Average GDP per square kilometerRaster/1 km 中国科学院资源环境科学数据中心(www.resdc.cn)
Data Center for Resources and Environmental Sciences, Chinese Academy of Sciences (www.resdc.cn)林地面积比例
Forestland area ratio森林生态系统占行政单元总面积比例
Forestland area ratio to the administrative unitsShp 欧洲航天航空局(ESA)
European Space Agency人口密度
Population density每平方公里平均人口数量
Average population per square kilometerRaster/1 km 全球人口动态统计分析数据库
Global statistical analysis database of population dynamics已建成区面积比例
Built-up area ratio已建成区占行政单元总面积比例
Proportion of built up area to the administrative unitsShp 清华大学地球系统科学数据库
Tsinghua University Earth System Science Database土壤
Soil土壤含沙量
Soil sediment concentrationRaster/1 km 世界土壤数据库
Harmonized World Soil Database基础设施密度
Infrastructure density基础设施在行政单元内比例
Infrastructure ratio to the administrative unitsShp 高德地图POI接口
AutoNavi POI interface 下载: 导出CSV
表 2 驱动因子统计学分析表
Table 2 Statistical analysis on driving factors
驱动因子
Driving factor平均值
Average value标准差
Standard deviation最大值
Maximum value最小值
Minimum value自然环境因子
Natural environmental
factor高程
Elevation/m608.477 5 391.038 9 2 466.168 1 243.272 3 土壤(含沙量)
Soil (sediment concentration)/%11.144 2 19.276 7 90.000 0 0.000 0 植被覆盖指数
NDVI0.761 0 0.085 3 0.879 5 0.404 3 降雨量
Rainfall/mm1 053.407 4 123.527 2 1 247.849 5 789.998 9 温度
Temperature/℃16.927 6 1.725 4 19.226 3 10.279 7 社会经济因子
Socioeconomic factor单位面积GDP/(元·km−2)
GDP per unit area/(CNY·km−2)6 745.219 8 18 194.331 5 136 089.924 2 145.433 3 人口密度/(人·km−2)
Population density/(person·km−2)893.455 7 2 274.309 1 21 474.381 0 39.794 2 已建成区面积比例
Built-up area ratio/%0.071 5 0.152 6 0.863 5 0.000 0 林地面积比例
Forestland area ratio/%0.170 4 0.156 9 0.670 9 0.005 2 基础设施密度/(个·km−2)
Infrastructure density /(number·km−2)0.339 7 0.784 8 4.027 5 0.003 7
下载: 导出CSV
表 3 基于探索性回归的OLS模型参数因子筛选结果表
Table 3 Filtering results of parameter factor based on exploratory regression
驱动因素
Driving factor初始模型 Initial model 筛选后模型 Filtered model 系数
Coefficient标准差
Standard
deviation概率/稳健概率
Probability/
robust probability系数
Coefficient标准差
Standard
deviation概率/稳健概率
Probability/
robust probability自然环境因子
Natural environmental
factor高程
Elevation0.021 3 0.009 5 m */* 土壤(含沙量)
Soil (sediment concentration)0.054 2 0.049 3% 植被覆盖指数
NDVI43.740 9 31.353 2 降雨量
Rainfall0.027 0 0.010 0 mm **/** 0.064 4 0.009 8 mm ***/*** 温度
Temperature1.164 0 2.284 4 ℃ −5.725 3 0.705 5 ℃ ***/*** 社会经济因子
Socioeconomic
factor单位面积GDP
GDP per unit area0.000 0 0.000 1元/km2
0.000 1 CNY/km2−0.000 6 0.000 1元/km2
0.000 1 CNY/km2***/*** 人口密度
Population density0.000 8 0.000 7人/km2
0.000 7 person/km2−0.003 1 0.000 6人/km2
0.000 6 person/km2***/** 已建成区面积比例
Built-up area ratio−138.790 0 34.630 7% ***/*** 林地面积比例
Forestland area ratio272.574 3 6.440 8% ***/*** 282.986 2 7.336 9% ***/*** 基础设施密度
Infrastructure density4.783 3 5.611 1个/km2
5.611 1 number/km2注:*、**、***分别为P < 0.05、P < 0.01、P < 0.001;初始模型与筛选后模型均满足R2 > 0.6的回归拟合优度。Notes: *,**,*** mean P < 0.05, P < 0.01, P < 0.001; both the initial model and the screened model meet R2 > 0.6 goodness of regression fitting.
下载: 导出CSV
-
[1] Sun X, Crittenden J C, Li F, et al. Urban expansion simulation and the spatio-temporal changes of ecosystem services, a case study in Atlanta Metropolitan area, USA[J]. Science of the Total Environment, 2018, 622−623: 974−987. doi: 10.1016/j.scitotenv.2017.12.062.
[2] 陈万旭, 李江风, 朱丽君. 长江中游地区生态系统服务价值空间分异及敏感性分析[J]. 自然资源学报, 2019, 34(2):325−337. Chen W X, Li J F, Zhu L J. Spatial heterogeneity and sensitivity analysis of ecosystem services value in the middle Yangtze River region[J]. Journal of Natural Resources, 2019, 34(2): 325−337.
[3] Li T, Li J, Wang Y Z. Carbon sequestration service flow in the Guanzhong-Tianshui economic region of China: how it flows, what drives it, and where could be optimized?[J]. Ecological Indicators, 2019, 96: 548−558. doi: 10.1016/j.ecolind.2018.09.040.
[4] 闻熠, 高峻, 姚扬, 等. 基于改进参数的长三角城市群生态足迹时空动态及驱动因子分析[J]. 环境工程技术学报, 2020, 10(1):133−141. doi: 10.12153/j.issn.1674-991X.20190061. Wen Y, Gao J, Yao Y, et al. Spatial and temporal dynamics and driving factor analysis of ecological footprint of Yangtze River Delta urban agglomeration based on improved parameters[J]. Journal of Environmental Engineering Technology, 2020, 10(1): 133−141. doi: 10.12153/j.issn.1674-991X.20190061.
[5] Chen W X, Chi G Q, Li J F. Ecosystem services and their driving forces in the middle reaches of the Yangtze River urban agglomerations, China[J/OL]. International Journal of Environmental Research and Public Health, 2020, 17(10): 3717 [2020−01−18]. https://www.mdpi.com/1660-4601/17/10/3717.
[6] 李凯, 刘涛, 曹广忠. 中国典型城市群空间范围的动态识别与空间扩展模式探讨: 以长三角城市群、武汉城市群和成渝城市群为例[J]. 城市发展研究, 2015, 22(11):72−79. doi: 10.3969/j.issn.1006-3862.2015.11.012. Li K, Liu T, Cao G Z. Spatial dynamics and expansion model of urban agglomerations in China: the experiences of Yangtze River Delta, Chengdu-Chongqing, and Wuhan urban agglomerations[J]. Urban Development Studies, 2015, 22(11): 72−79. doi: 10.3969/j.issn.1006-3862.2015.11.012.
[7] 李凯, 刘涛, 曹广忠. 城市群空间集聚和扩散的特征与机制:以长三角城市群、武汉城市群和成渝城市群为例[J]. 城市规划, 2016, 40(2):18−26, 60. doi: 10.11819/cpr20160204a. Li K, Liu T, Cao G Z. Characteristics and mechanism of spatial concentration and dispersion of the representative urban agglomerations in China: a case study of Yangtze River Delta urban agglomerations, Wuhan urban agglomerations, and Chengdu-Chongqing urban agglomerations[J]. City Planning Review, 2016, 40(2): 18−26, 60. doi: 10.11819/cpr20160204a.
[8] 蒋奕廷, 蒲波. 基于引力模型的成渝城市群吸引力格局研究[J]. 软科学, 2017, 31(2):98−102. Jiang Y T, Pan B. Analysis of attraction pattern in Chengdu-Chongqing urban agglomeration based on a gravity model[J]. Soft Science, 2017, 31(2): 98−102.
[9] 吴朋, 李玉刚, 管程程, 等. 基于ESDA-GIS的成渝城市群人居环境质量测度与时空格局分异研究[J]. 中国软科学, 2018(10):93−108. doi: 10.3969/j.issn.1002-9753.2018.10.011. Wu P, Li Y G, Guan C C, et al. Spatial-temporal differentiation of human settlement in Chengdu-Chongqing urban agglomeration based on ESDA-GIS[J]. China Soft Science, 2018(10): 93−108. doi: 10.3969/j.issn.1002-9753.2018.10.011.
[10] 潘碧麟, 王江浩, 葛咏, 等. 基于微博签到数据的成渝城市群空间结构及其城际人口流动研究[J]. 地球信息科学学报, 2019, 21(1):68−76. doi: 10.12082/dqxxkx.2019.180235. Pan B L, Wang J H, Ge Y, et al. Spatial structure and population flow analysis in Chengdu-Chongqing urban agglomeration based on Weibo Check-in Big Data[J]. Journal of Geo-Information Science, 2019, 21(1): 68−76. doi: 10.12082/dqxxkx.2019.180235.
[11] 中华人民共和国国家发展和改革委员会. 成渝城市群发展规划[EB/OL]. (2016−04−27)[2020−01−02]. https://www.ndrc.gov.cn/xxgk/zcfb/tz/201605/t20160504_963034.html. National Development and Reform Commission. Chengdu-Chongqing urban agglomeration development plan[EB/OL]. (2016−04−27)[2020−01−02]. https://www.ndrc.gov.cn/xxgk/zcfb/tz/201605/t20160504_963034.html.
[12] 谢高地, 甄霖, 鲁春霞, 等. 一个基于专家知识的生态系统服务价值化方法[J]. 自然资源学报, 2008, 23(5):911−919. doi: 10.3321/j.issn:1000-3037.2008.05.019. Xie G D, Zhen L, Lu C X, et al. Expert knowledge based valuation method of ecosystem services in China[J]. Journal of Natural Resources, 2008, 23(5): 911−919. doi: 10.3321/j.issn:1000-3037.2008.05.019.
[13] Zhong Y, Lin A W, He L J, et al. Spatiotemporal dynamics and driving forces of urban land-use expansion: a case study of the Yangtze River economic belt, China[J/OL]. Remote Sensing, 2020, 12(2): 287 [2020−03−06]. http://dx.doi.org/10.3390/rs12020287.
[14] Huang X, Huang X J, Liu M M, et al. Spatial-temporal dynamics and driving forces of land development intensity in the western China from 2000 to 2015[J]. Chinese Geographical Science, 2020, 30(1): 16−29. doi: 10.1007/s11769-020-1095-2.
[15] 杜茂华, 杨刚. 基于锡尔系数和基尼系数法的重庆城乡发展差异分析[J]. 经济地理, 2010, 30(5):773−777. Du M H, Yang G. The analysis of differences in Chongqing urban and rural development based on Theil and Gini coefficient[J]. Economic Geography, 2010, 30(5): 773−777.
[16] 许旭, 金凤君, 刘鹤. 成渝经济区县域经济实力的时空差异分析[J]. 经济地理, 2010, 30(3):388−392. Xu X, Jin F J, Liu H. Analysis of regional economy in time-space disparities in Chengdu-Chongqing economic zone[J]. Economic Geography, 2010, 30(3): 388−392.
[17] 李方正. 基于多源数据分析的北京市中心城绿色空间格局演变和优化研究[D]. 北京: 北京林业大学, 2018. Li F Z. Evolution and optimization of green space pattern in central Beijing based on multi-source data[D]. Beijing: Beijing Forestry University, 2018.
[18] 邓煌炜, 廖振良. 生态系统服务驱动因素及供需研究进展[J]. 环境科技, 2020, 33(1):74−78. Deng H W, Liao Z L. Review of drivers, supply and demand of ecosystem services[J]. Environmental Science and Technology, 2020, 33(1): 74−78.
[19] Liu C L, Wang T, Guo Q B. Factors aggregating ability and the regional differences among China’s urban agglomerations[J/OL]. Sustainability, 2018, 10(11): 4179 [2020−01−05]. http://dx.doi.org/10.3390/su10114179.
[20] Chen J H, Wang D C, Li G D, et al. Spatial and temporal heterogeneity analysis of water conservation in Beijing-Tianjin-Hebei urban agglomeration based on the geodetector and spatial elastic coefficient trajectory models[J/OL]. GeoHealth, 2020, 4(8): e2020GH000248 [2020−03−01]. https://agupubs.onlinelibrary.wiley.com/doi/full/10.1029/2020GH000248.
[21] Dai X, Wang L C, Huang C B, et al. Spatio-temporal variations of ecosystem services in the urban agglomerations in the middle reaches of the Yangtze River, China[J/OL]. Ecological Indicators, 2020, 115: 106394 [2020−01−16]. https://www.sciencedirect.com/science/article/abs/pii/S1470160X20303319.
[22] Gao J, Wang L C. Embedding spatiotemporal changes in carbon storage into urban agglomeration ecosystem management : a case study of the Yangtze River Delta, China[J/OL]. Journal of Cleaner Production, 2019, 237: 117764 [2020−02−18]. https://www.sciencedirect.com/science/article/abs/pii/S0959652619326241.
[23] Luo Q L, Zhou J F, Li Z G, et al. Spatial differences of ecosystem services and their driving factors: a comparation analysis among three urban agglomerations in China’s Yangtze River Economic Belt[J/OL]. Science of the Total Environment, 2020, 725: 138452 [2020−02−06]. https://www.sciencedirect.com/science/article/abs/pii/S0048969720319653.
[24] Sun W, Li D H, Wang X R, et al. Exploring the scale effects, trade-offs and driving forces of the mismatch of ecosystem services[J]. Ecological Indicators, 2019, 103: 617−629. doi: 10.1016/j.ecolind.2019.04.062.
[25] Lyu R F, Clarke K C, Zhang J M, et al. Spatial correlations among ecosystem services and their socio-ecological driving factors: a case study in the city belt along the Yellow River in Ningxia, China[J]. Applied Geography, 2019, 108: 64−73. doi: 10.1016/j.apgeog.2019.05.003.
[26] 黄从德, 张健, 杨万勤, 等. 四川省及重庆地区森林植被碳储量动态[J]. 生态学报, 2008, 28(3):966−975. doi: 10.3321/j.issn:1000-0933.2008.03.008. Huang C D, Zhang J, Yang W Q, et al. Dynamics on forest carbon stock in Sichuan Province and Chongqing City[J]. Acta Ecologica Sinica, 2008, 28(3): 966−975. doi: 10.3321/j.issn:1000-0933.2008.03.008.
[27] 祁生林, 张洪江, 何凡, 等. 重庆四面山植被类型对坡面产流的影响[J]. 中国水土保持科学, 2006, 4(4):33−38. doi: 10.3969/j.issn.1672-3007.2006.04.006. Qi S L, Zhang H J, He F, et al. Effect of the vegetation types on runoff generation on slope land in Simian Mountain of Chongqing[J]. Science of Soil and Water Conservation, 2006, 4(4): 33−38. doi: 10.3969/j.issn.1672-3007.2006.04.006.
[28] 林孝松. 滑坡与降雨研究[J]. 地质灾害与环境保护, 2001, 12(3):1−7. doi: 10.3969/j.issn.1006-4362.2001.03.001. Lin X S. The study of landslide related to rainfall[J]. Journal of Geological Hazards and Environment Preservation, 2001, 12(3): 1−7. doi: 10.3969/j.issn.1006-4362.2001.03.001.
[29] 陈俊华, 黎燕琼, 郑绍伟, 等. 成渝地区城市森林树种选择研究[J]. 甘肃农业大学学报, 2008, 53(1):130−136. doi: 10.3969/j.issn.1003-4315.2008.01.027. Chen J H, Li Y Q, Zheng S W, et al. Tree species selection on urban forest in Chengdu-Chongqing region[J]. Journal of Gansu Agricultural University, 2008, 53(1): 130−136. doi: 10.3969/j.issn.1003-4315.2008.01.027.
[30] 方一平. 成渝产业带产业结构的相似性及其结构转换力分析[J]. 长江流域资源与环境, 2000, 9(1):22−27. Fang Y P. On industrial structure similarity and the ability of structural adjustment in Chengdu and Chongqing regions[J]. Resources and Environment in the Yangtze Basin, 2000, 9(1): 22−27.
[31] 黄炳康, 李忆春, 吴敏. 成渝产业带主要城市空间关系研究[J]. 地理科学, 2000, 20(5):411−415. doi: 10.3969/j.issn.1000-0690.2000.05.004. Huang B K, Li Y C, Wu M. The research of main cities space relations of Cheng-Yu industry belt[J]. Scientia Geographica Sinica, 2000, 20(5): 411−415. doi: 10.3969/j.issn.1000-0690.2000.05.004.
[32] 于涛方. 中国城市人口流动增长的空间类型及影响因素[J]. 中国人口科学, 2012(4):47−58. Yu T F. Spatial-temporal features and influential factors of the China urban floating population growth[J]. Chinese Journal of Population Science, 2012(4): 47−58.
[33] 刘望保, 石恩名. 基于ICT的中国城市间人口日常流动空间格局:以百度迁徙为例[J]. 地理学报, 2016, 71(10):1667−1679. doi: 10.11821/dlxb201610001. Liu W B, Shi E M. Spatial pattern of population daily flow among cities based on ICT: a case study of “Baidu Migration”[J]. Acta Geographica Sinica, 2016, 71(10): 1667−1679. doi: 10.11821/dlxb201610001.
[34] 冯伟林, 李树茁, 李聪. 生态系统服务与人类福祉:文献综述与分析框架[J]. 资源科学, 2013, 35(7):1482−1489. Feng W L, Li S Z, Li C. Overview and frame work for ecosystem services and human well-being[J]. Resources Science, 2013, 35(7): 1482−1489.
-
期刊类型引用(5)
1. 买永辉,贾艳玲,齐蓉,陈帅,王宏彬,丁志辉. 基于LoRa的沙漠近地环境参数监测系统设计. 数字技术与应用. 2023(07): 163-165 .  百度学术
百度学术
2. 屈英,刘小强,李明淇. 枣树滴灌水肥一体化发展现状及建议. 河北农机. 2023(18): 94-96 . 百度学术
3. 丁磊,鲁延芳,占玉芳,甄伟玲,滕玉风,钱万建. 沙荒地红枣矮化密植丰产栽培技术. 林业科技通讯. 2022(04): 78-81 . 百度学术
4. 韩齐齐,张娅妮,冯荦荦,闫欣鹏,张有林. 冬枣采后生理与气调贮藏关键技术研究. 食品与发酵工业. 2021(04): 33-39 . 百度学术
5. 张波,吕廷波,赵秀杰,王东旺,徐强,邢猛,周小杰. 不同灌溉定额对滴灌骏枣生长的影响. 水土保持学报. 2021(06): 168-174+182 . 百度学术
其他类型引用(1)


计量
- 文章访问数: 1849
- HTML全文浏览量: 567
- PDF下载量: 106
- 被引次数: 6
