
Changes in forest resource carbon storage in China between 1949 and 2018
-
摘要:目的 建立全国单木材积生物量模型非常重要且必要。研究中国的森林碳储量变化及其碳汇能力对于估算区域碳收支和制定应对气候变化的森林管理政策具有重要意义。方法 本文结合森林资源清查抽样总体和气候区差异的实际,利用全国森林资源清查22种主要树种的生物量建模实测数据,分别建立区域性单木生物量与材积回归模型,利用1949—2018年间11个时间段的森林资源清查和统计数据,系统测算出了近70年全国及各个区域森林碳储量和碳源汇能力,以期揭示出70年来我国森林碳储量的变化规律和原因以及对碳汇的相关贡献。结果 研究结果表明:在1949—2018年间,林分、疏林等森林资源碳储总量由4.509 × 10¹² kg增加到8.601 × 10¹² kg,增加了90.74%,其中2014—2018年期间年均增长3.09%;林分碳储量由4.38 × 10¹² kg增加到7.97 × 10¹² kg,增加了81.97%;林分碳密度在1973—1976年时段最低为31.64 t/hm2,2014—2018年时段增加到44.30 t/hm2,但是仍然没有达到1949年的46.48 t/hm2;各区域的森林资源碳储总量都有不同程度的增加,尤其是华北区和东南沿海区增长较快,分别增加了145.91%和116.63%;全国及各个区域的森林碳储量和碳密度的变化规律基本呈现出先下降后增加的趋势。全国碳源汇的变化规律也与此基本相同,1981年之前,年均碳积累是负值,以碳源为主,1981年之后碳积累是正值,年均生物量碳汇0.122 × 1012 kg/a,且积累能力不断提高。林分生物量碳库在森林总碳库中占据主要地位,各期的全国林分碳储量占碳储总量的比例均在80%以上;由于我国人工林面积大量增加,碳累积增长速度很快,自20世纪70年代以来年均生物量碳汇为0.04 × 1012 kg/a;天然林在1989年前虽然碳累积为负值,但自我国实行天然林保护工程以来,天然林碳汇能力持续增强,是我国森林碳逐年累积的主要贡献者。结论 随着我国全面实施天然林保护、生态修复和保护政策持续加强,同时中国现阶段以中幼龄林为主的森林已进入快速增长期,因此未来中国的森林碳汇潜力巨大。Abstract:Objective It is very important and necessary to establish the national single tree volume biomass model. The research on forest carbon storage change and carbon sequestration capacity has great significance to the forest management policies of estimating regional carbon balance and addressing climate change.Method With forest resource sampling population and the difference of climate zones, using the survey data from 22 main forest type biomass building models in national forest inventory, establishing regional individual tree regression models of biomass and stock volume, using 11 periods of forest inventory and statistics data from 1949 to 2018, the paper calculates forest carbon storage and carbon sequestration capacity in 70 forest regions to explore forest carbon storage change regulations, causes and contribution to carbon sequestration in 70 years.Result From 1949 to 2018, forest carbon storage of forest stand and sparse forest increased from 4.509 × 10¹² to 8.601 × 10¹² kg, increased by 90.74%. Average annual increase was 3.09% during 2014 to 2019; carbon storage of forest storage increased from 4.38 × 10¹² to 7.97 × 10¹² kg, increased by 81.97%; the lowest carbon intensity of forest stand from 1973 to 1976 was 31.64 t/ha, and increased to 44.30 t/ha from 2014 to 2018, but it cannot reach 46.48 t/ha in 1949. Forest carbon storage in different regions increased differently. Forest carbon storage in north China and southeast coast regions increased by 145.91% and 116.63%, respectively. National and regional forest carbon storage and carbon intensity showed the trends of firstly decreased and secondly increased. The national forest showed the same trends. Before 1981, annual average of carbon accumulation was negative and it was carbon source. After 1981, carbon accumulation was positive. Annual average of biomass carbon sequestration was 0.122 × 10¹² kg/year, and carbon accumulation increased gradually. Carbon storage of forest stand accounted for the main parts of forest resource, and its carbon storage was more than 80% of total forest carbon storage. As plantation forest area increased in large proportion and its carbon accumulation increased quickly, annual average biomass carbon sequestration had been 0.04 × 10¹² kg/year since 1970s; before 1989, natural forest carbon accumulation was negative, but its carbon sequestration capacity had been increased continually since national forest protection program. It was the main contributor to annual forest carbon accumulation.Conclusion With national forest protection, ecosystem restoration and protection, and the dominated middle and young age forest stand had entered into quick growing period. The potential of forest carbon sequestration in China will be great.
-
-
![]()
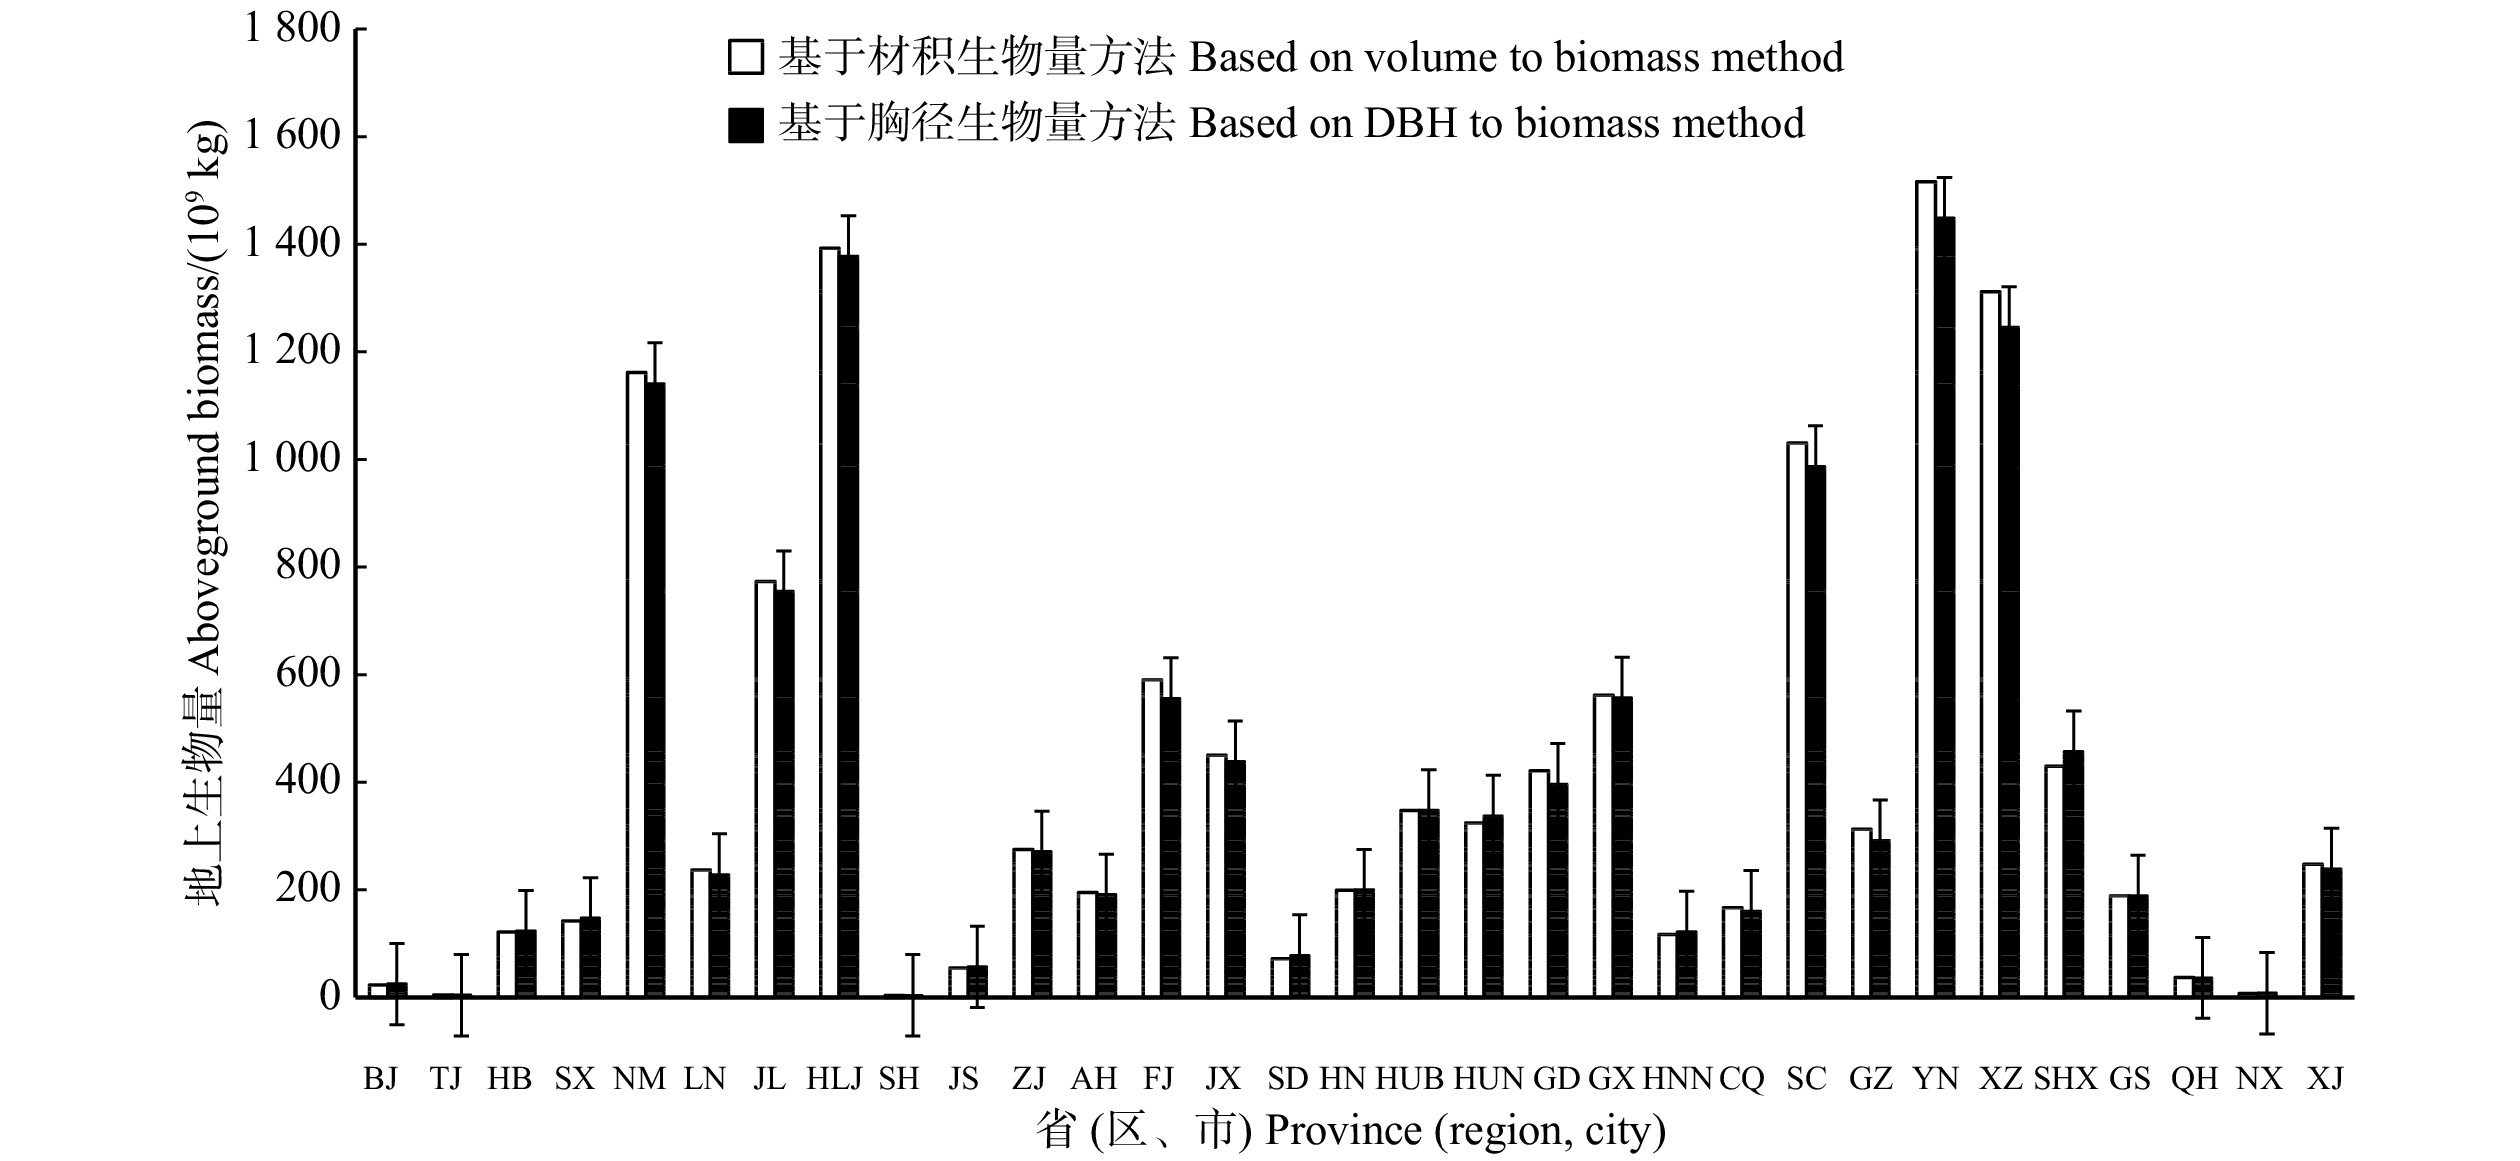
图 1 不同区域生物量转换因子(BEF)与根茎比(RSR)比较
Figure 1. Comparison of BEF and RSR values in different regions
![]()
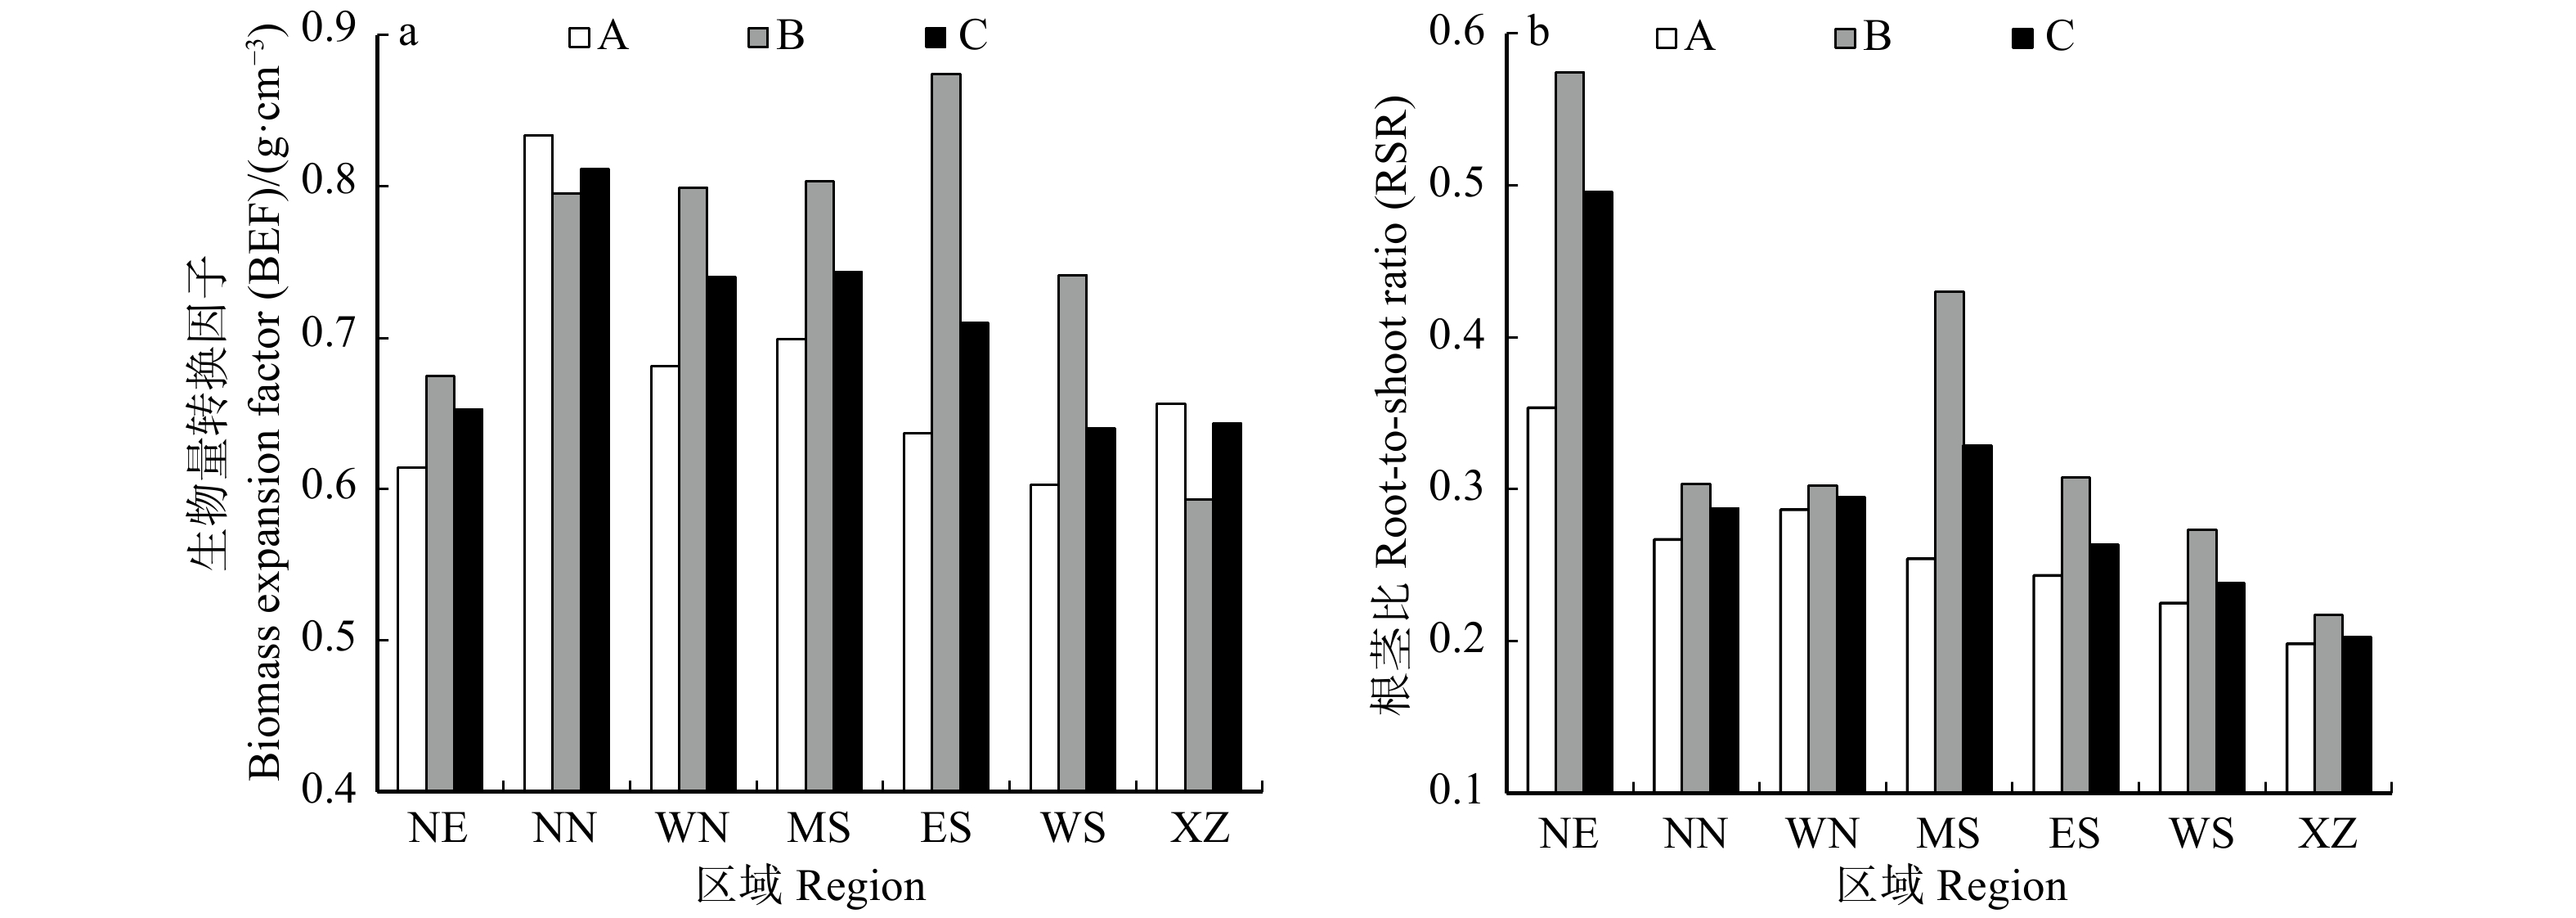
图 2 两种测算方法地上生物量结果对比
BJ为北京;TJ为天津;HB为河北;SX为山西;NM为内蒙古;LN为辽宁;JL为吉林;HLJ为黑龙江;SH为上海;JS为江苏;ZJ为浙江;AH为安徽;FJ为福建;JX为江西;SD为山东;HN为河南;HUB为湖北;HUN为湖南;GD为广东;GX为广西;HNN为海南;CQ为重庆;SC为四川;GZ为贵州;YN为云南;XZ为西藏;SHX为陕西;GS为甘肃;QH为青海;NX为宁夏;XJ为新疆。BJ, Beijing City; TJ, Tianjing City; HB, Hebei Province; SX, Shanxi Province; NM, Inner Mongolia Autonomous Region; LN, Liaoning Province; JL, Jilin Province; HLJ, Heilongjiang Province; SH, Shanghai City; JS, Jiangshu Province; ZJ, Zhejiang Province; AH, Anhui Province; FJ, Fujian Province; JX, Jiangxi Province; SD, Shandong Province; HN, Henan Province; HUB, Hubei Province; HUN, Hunan Province; GD, Guangdong Province; GX, Guangxi Zhuang Autonomous Region; HNN, Hainan Province; CQ, Chongqing City; SC, Sichuan Province; GZ, Guizhou Province; YN, Yunnan Province, XZ, Tibet; SHX, Shaanxi Province; GS, Gansu Province; QH, Qinhai Province; NX, Ningxia Hui Autonomous Region; XJ, Xinjiang Uygur Autonomous Region.
Figure 2. Comparison of aboveground biomass results by two calculating methods
![]()
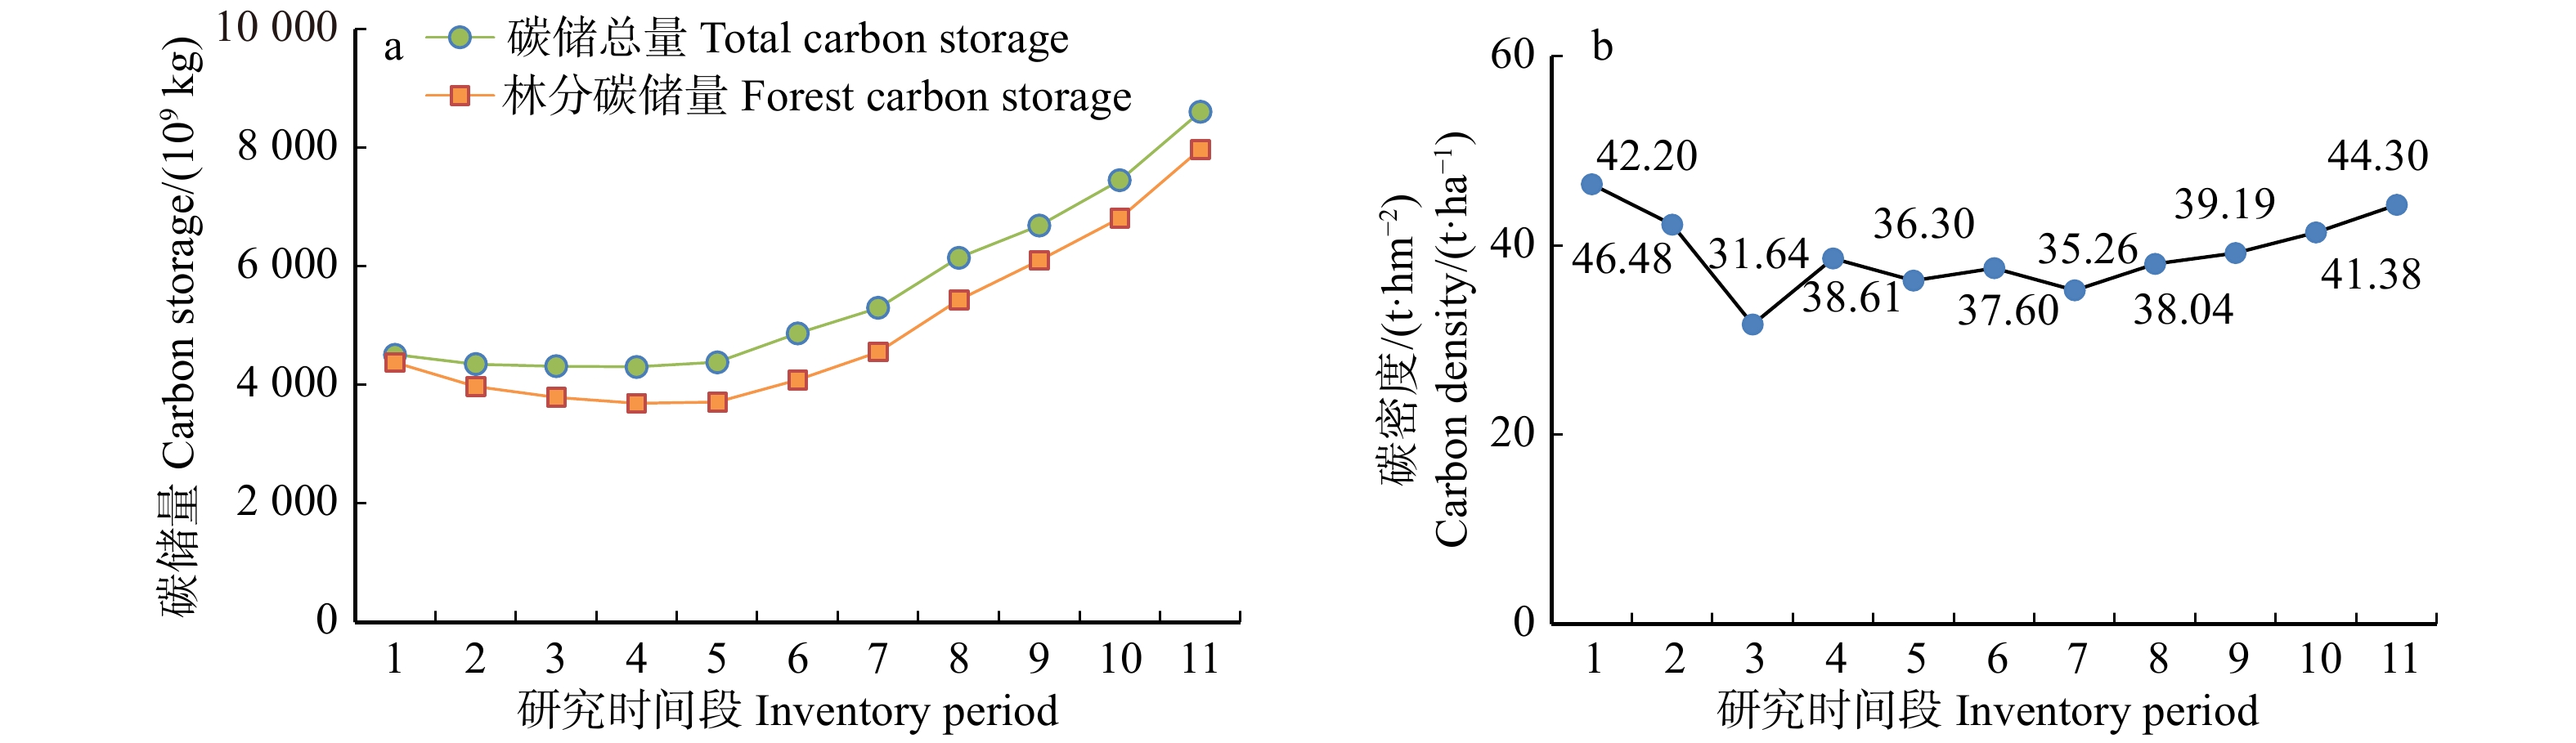
图 3 各时期森林碳储量和碳密度变化
数字1 ~ 11代表研究时间段,依次为:1949、1950—1962、1973—1976、1977—1981、1984—1988、1989—1993、1994—1998、1999—2003、2004—2008、2009—2013、2014—2018年。下同。The No. 1−11 represent the periods of year 1949, 1950−1962, 1973−1976, 1977−1981, 1984−1988, 1989−1993, 1994−1998, 1999−2003, 2004−2008, 2009−2013, 2014−2018, respectively. The same below.
Figure 3. Changes of forest carbon storage and carbon density in different periods
![]()
图 4 1949—2018年森林面积、蓄积量、碳储量、碳密度和碳储总量变化
Figure 4. Changes of forest area, volume stock, carbon storage, carbon density and total carbon storage from 1949 to 2018
表 1 全国主要树种材积与生物量模型
Table 1 Regression model of volume to biomass of main tree species in China
建模范围
Modeling range建模树种(组)
Modeling tree species (group)地上生物量与材积
Aboveground biomass and volume地下与地上生物量
Underground biomass and aboveground biomass模型表达式
Model expressionN R2 模型表达式
Model expressionN R2 CH 柳杉 Cryptomeria fortunei Y1 = 0.917 2X10.872 5 150 0.991 9 Y2 = 0.224 5X21.061 0 47 0.962 7 马尾松 Pinus massoniana Y1 = 0.806 7X10.948 3 301 0.989 6 Y2 = 0.119 8X21.081 2 104 0.973 8 杉木 Cunninghamia lanceolata Y1 = 0.684 6X10.908 9 301 0.987 8 Y2 = 0.240 8X20.983 9 102 0.953 3 油松 Pinus tabuliformis Y1 = 0.840 0X10.958 4 149 0.983 9 Y2 = 0.189 2X21.041 2 49 0.965 2 黄山松 Pinus taiwanensis Y1 = 0.686 1X10.966 0 150 0.988 6 Y2 = 0.189 1X20.981 1 51 0.955 6 NE 落叶松 Larix dahurica Y1 = 0.762 9X10.947 7 150 0.994 2 Y2 = 0.199 9X21.091 1 50 0.979 1 云杉 Picea asperata Y1 = 0.799 1X10.952 0 150 0.986 4 Y2 = 0.270 4X20.970 7 50 0.964 6 冷杉 Abies fabri Y1 = 0.624 5X10.974 8 150 0.992 7 Y2 = 0.223 4X20.983 3 49 0.977 3 栎树 Quercus spp. Y1 = 0.851 7X11.009 0 160 0.989 2 Y2 = 0.545 7X20.864 4 53 0.948 2 白桦 Betula platyphylla Y1 = 0.668 2X11.005 9 150 0.994 9 Y2 = 0.362 2X20.956 1 53 0.966 8 桦树 Betula spp. Y1 = 0.514 6X11.046 7 150 0.985 3 Y2 = 0.438 1X20.895 4 51 0.941 1 山杨 Populus davidiana Y1 = 0.621 6X10.978 3 151 0.991 5 Y2 = 0.237 8X20.975 0 55 0.971 6 人工杨 Populus simonii Y1 = 0.692 5X10.947 2 150 0.988 1 Y2 = 0.284 3X20.949 9 50 0.943 6 樟子松 Pinus sylvestris var. mongolica Y1 = 0.578 3X10.956 1 151 0.981 7 Y2 = 0.335 3X21.121 9 49 0.939 6 椴树 Tilia tuan Y1 = 0.463 9X11.024 5 150 0.983 3 Y2 = 0.871 6X21.006 0 50 0.934 0 榆树 Ulmus pumila Y1 = 0.781 4X11.009 4 149 0.988 7 Y2 = 0.709 0X21.028 6 49 0.993 6 NN、NW 落叶松 Larix dahurica Y1 = 0.733 8X10.935 1 300 0.983 5 Y2 = 0.285 9X20.963 3 100 0.957 0 云杉 Picea asperata Y1 = 0.913 0X10.9128 300 0.978 6 Y2 = 0.300 5X20.958 7 100 0.940 7 冷杉 Abies fabri Y1 = 0.696 8X10.957 0 150 0.987 5 Y2 = 0.206 6 X21.013 4 50 0.968 4 柏木 Cupressus funebris Y1 = 1.133 7X10.9422 300 0.971 5 Y2 = 0.339 7X20.921 3 102 0.924 4 栎树 Quercus spp. Y1 = 0.719 3X11.029 6 210 0.972 3 Y2 = 0.495 5X20.869 8 72 0.936 6 桦树 Betula spp. Y1 = 0.855 1X10.979 1 240 0.969 1 Y2 = 0.335 9X20.941 4 79 0.961 1 人工杨 Populus simonii Y1 = 0.611 6X11.001 6 150 0.990 4 Y2 = 0.304 2X20.931 4 48 0.990 1 山杨 Populus davidiana Y1 = 0.631 0X10.998 7 150 0.988 5 Y2 = 0.281 6X20.951 6 55 0.974 9 WS 云杉 Picea asperata Y1 = 0.818 1X10.927 3 302 0.967 0 Y2 = 0.211 5X21.009 8 98 0.961 5 冷杉 Abies fabri Y1 = 0.690 1X10.939 9 301 0.985 5 Y2 = 0.282 5X20.948 3 101 0.950 8 XZ 云杉 Picea asperata Y1 = 0.943 8X10.919 1 149 0.961 7 Y2 = 0.196 3X20.983 1 47 0.960 4 冷杉 Abies fabri Y1 = 0.607 3X10.950 6 150 0.986 2 Y2 = 0.190 3X21.033 0 49 0.979 7 WS、XZ 落叶松 Larix dahurica Y1 = 0.716 8X10.929 3 152 0.982 4 Y2 = 0.190 1X21.006 6 49 0.946 2 栎树 Quercus spp. Y1 = 1.086 4X10.935 8 151 0.980 0 Y2 = 0.372 5X20.883 9 50 0.953 8 桦树 Betula spp. Y1 = 0.692 6X10.987 1 150 0.977 6 Y2 = 0.261 7X20.978 3 53 0.944 6 云南松 Pinus yunnanensis Y1 = 0.536 0X10.993 8 150 0.986 7 Y2 = 0.155 3X21.007 7 50 0.973 1 山杨 Populus davidiana Y1 = 0.642 3X10.977 2 150 0.994 1 Y2 = 0.275 0X20.912 3 50 0.974 5 思茅松 Pinus kesiya var. langbianensis Y1 = 0.391 8X11.060 3 150 0.994 7 Y2 = 0.170 1X20.984 2 49 0.986 4 高山松 Pinus densata Y1 = 0.786 5X10.958 5 150 0.982 6 Y2 = 0.156 2X21.030 6 49 0.934 9 柏木 Cupressus funebris Y1 = 1.020 3X10.931 2 150 0.991 7 Y2 = 0.232 6X20.936 4 51 0.973 0 MS、ES 湿地松 Pinus elliottii Y1 = 0.677 4X10.980 1 154 0.991 9 Y2 = 0.388 9X20.917 3 50 0.937 2 柏木 Cupressus funebris Y1 = 0.949 6X10.950 4 160 0.985 6 Y2 = 0.216 7X21.011 0 65 0.973 0 栎树 Quercus spp. Y1 = 1.228 2X10.934 1 149 0.982 8 Y2 = 0.324 2X20.921 9 53 0.905 9 木荷 Schima superba Y1 = 0.857 3X10.975 3 150 0.993 7 Y2 = 0.294 0X20.992 0 50 0.959 0 枫香 Liquidambar formosana Y1 = 0.793 6X10.993 1 152 0.991 0 Y2 = 0.463 2X20.933 9 50 0.966 6 人工杨 Populus simonii Y1 = 0.545 8X11.019 9 151 0.995 3 Y2 = 0.221 9X20.933 7 49 0.975 0 注:CH为全国;NE为东北区;NN为华北区;NW为西北区;MS为中南区;ES为东南沿海区;WS为西南区;XZ为西藏区;N为原始数据样本数量,R2为决定系数;Y1为单木生物量(地上部分)(t),X1为单木材积(m3);Y2为单木地下生物量(t), X2为单木地上生物量(t)。下同。Notes: CH, whole country; NE, Northeast China; NN, North China; NW, Northwest China; MS, South Central China; ES, Southeast Coastal China; WS, Southwest China; XZ is Tibet; N, sample number of raw data; R2, coefficient of determination; Y1, biomass of a tree (aboveground) (t); X1, volume of single tree (m3); Y2, underground biomass of a tree (t); X2, aboveground biomass of a tree (t). The same below.  下载: 导出CSV
表 2 全国各区域按森林类型建立的材积与生物量回归模型
Table 2 Regression models of volume to biomass by forest types in different regions of China
适用范围
Scope of
application建模树种(组)
Modeling tree
species (group)地上生物量与材积
Aboveground biomass and volume地下与地上生物量
Underground biomass and aboveground biomass模型表达式 Model expression N R2 模型表达式 Model expression N R2 NE A Y1 = 0.683 9X10.965 7 600 0.987 5 Y2 = 0.257 9X21.035 3 199 0.938 9 B Y1 = 1.368 1X10.946 0 1 060 0.943 9 Y2 = 0.468 9X20.949 0 361 0.882 7 C Y1 = 1.114 3X10.941 8 1 660 0.940 7 Y2 = 0.382 1X20.977 9 560 0.898 6 NN A Y1 = 0.995 5X10.935 5 449 0.970 8 Y2 = 0.277 2X20.963 3 150 0.952 9 B Y1 = 0.745 0X11.001 2 600 0.972 7 Y2 = 0.373 0X20.941 9 199 0.957 0 C Y1 = 0.843 7X10.974 0 1 049 0.970 9 Y2 = 0.328 2X20.934 9 349 0.954 2 NW A Y1 = 0.880 3X10.920 6 600 0.974 1 Y2 = 0.293 8X20.960 6 201 0.936 7 B Y1 = 0.752 1X11.000 1 600 0.972 4 Y2 = 0.364 1X20.919 9 206 0.953 3 C Y1 = 0.821 5X10.957 1 1 200 0.970 0 Y2 = 0.329 5X20.938 3 407 0.944 8 MS A Y1 = 0.853 9X10.936 9 433 0.982 2 Y2 = 0.223 8X21.002 0 149 0.956 2 B Y1 = 0.829 7X10.977 4 320 0.978 3 Y2 = 0.229 2X20.919 7 109 0.924 3 C Y1 = 0.841 6X10.954 8 753 0.979 0 Y2 = 0.253 0X20.965 6 258 0.941 8 ES A Y1 = 0.737 4X10.951 1 774 0.981 5 Y2 = 0.220 5X20.998 8 255 0.956 7 B Y1 = 0.970 3X10.964 2 341 0.985 2 Y2 = 0.318 4X20.955 5 115 0.940 4 C Y1 = 0.800 6X10.955 6 1 115 0.977 8 Y2 = 0.245 3X20.987 4 370 0.949 7 WS A Y1 = 0.712 8X10.945 0 1 337 0.978 2 Y2 = 0.199 5X21.004 4 446 0.959 0 B Y1 = 0.803 0X10.968 0 501 0.980 0 Y2 = 0.310 7X20.931 7 171 0.944 9 C Y1 = 0.738 3X10.950 5 1 838 0.976 6 Y2 = 0.224 0X20.985 5 617 0.953 3 XZ A Y1 = 0.759 8X10.946 6 569 0.971 8 Y2 = 0.185 4X20.990 4 186 0.950 6 B Y1 = 0.642 3X10.977 2 150 0.994 1 Y2 = 0.275 0X20.912 3 50 0.974 5 C Y1 = 0.734 0X10.953 0 719 0.976 4 Y2 = 0.204 0X20.971 1 236 0.953 9 注:A为针叶树种;B为阔叶树种;C为针阔混交树种。下同。Notes: A, coniferous tree species; B, broadleaved tree species; C, coniferous and broadleaved mixed tree species. The same below.
下载: 导出CSV
表 3 各区域各森林类型的生物量转换因子(BEF)和根茎比(RSR)比较
Table 3 Comparison of biomass expansion factor (BEF) and root-to-shoot ratio (RSR) of different forest types in different regions
区域
Region类型
Type变量
Variable样本数
Sample number平均值
Average value最小值
Min. value最大值
Max. value标准差
SD变动系数
Coefficient of variation/%NE A BEF/(g·cm−3) 600 0.614 0.176 1.510 0.169 27.6 RSR 199 0.354 0.079 2.581 0.289 81.8 B BEF/(g·cm−3) 1 060 0.675 0.040 3.561 0.215 31.9 RSR 361 0.574 0.074 3.587 0.471 82.1 C BEF/(g·cm−3) 1 660 0.653 0.040 3.561 0.202 31.0 RSR 560 0.496 0.074 3.587 0.429 86.5 NN A BEF/(g·cm−3) 449 0.834 0.295 3.041 0.322 38.6 RSR 150 0.267 0.059 0.960 0.126 47.2 B BEF/(g·cm−3) 600 0.795 0.139 2.087 0.282 35.4 RSR 199 0.303 0.036 1.200 0.162 53.5 C BEF/(g·cm−3) 1 049 0.812 0.139 3.041 0.300 37.0 RSR 349 0.288 0.036 1.200 0.149 51.6 NW A BEF/(g·cm−3) 600 0.681 0.165 3.311 0.300 44.1 RSR 201 0.287 0.052 1.351 0.154 53.6 B BEF/(g·cm−3) 600 0.799 0.139 2.087 0.282 35.3 RSR 206 0.302 0.036 1.200 0.163 53.9 C BEF/(g·cm−3) 1 200 0.740 0.139 3.311 0.297 40.1 RSR 407 0.295 0.036 1.351 0.158 53.8 MS A BEF/(g·cm−3) 433 0.699 0.200 6.236 0.338 48.4 RSR 149 0.254 0.073 1.347 0.164 64.5 B BEF/(g·cm−3) 320 0.804 0.389 2.287 0.310 38.6 RSR 109 0.430 0.033 1.301 0.247 57.4 C BEF/(g·cm−3) 753 0.744 0.200 6.236 0.330 44.4 RSR 258 0.329 0.033 1.347 0.221 67.2 ES A BEF/(g·cm−3) 774 0.637 0.242 6.236 0.279 43.7 RSR 255 0.243 0.065 0.838 0.120 49.1 B BEF/(g·cm−3) 341 0.874 0.396 2.287 0.279 31.9 RSR 115 0.308 0.033 1.200 0.181 58.6 C BEF/(g·cm−3) 1 115 0.710 0.242 6.236 0.299 42.2 RSR 370 0.264 0.033 1.200 0.144 54.7 WS A BEF/(g·cm−3) 1 337 0.603 0.134 2.428 0.227 37.6 RSR 446 0.225 0.059 0.912 0.115 51.1 B BEF/(g·cm−3) 501 0.741 0.202 2.118 0.251 33.9 RSR 171 0.273 0.020 0.954 0.141 51.6 C BEF/(g·cm−3) 1838 0.641 0.134 2.428 0.242 37.8 RSR 617 0.238 0.020 0.954 0.125 52.3 XZ A BEF/(g·cm−3) 569 0.656 0.213 1.972 0.276 42.1 RSR 186 0.199 0.045 0.559 0.093 47.0 B BEF/(g·cm−3) 150 0.593 0.295 1.309 0.114 19.2 RSR 50 0.217 0.113 0.527 0.099 45.6 C BEF/(g·cm−3) 719 0.643 0.213 1.972 0.253 39.3 RSR 236 0.203 0.045 0.559 0.095 46.8
下载: 导出CSV
表 4 1949—2018年不同时期森林面积、蓄积、碳储量及年均碳累积
Table 4 Forest area, volume, carbon storage and annual average carbon sequestration in different periods from 1949 to 2018
调查期
Investigating
period林分 Stand 人工林 Plantation 天然林 Natural forest FA FV FC AC FA FV FC AC FC FV FC AC 1949 94.23 92.23 4.38 — — — — — — — — — 1950—1962 95.85 83.67 3.98 −0.033 — — — — — — — — 1973—1976 119.78 84.70 3.79 −0.014 17.81 1.64 0.07 101.97 83.06 3.72 1977—1981 95.63 79.79 3.69 −0.020 12.73 2.73 0.13 0.011 82.90 77.06 3.56 −0.031 1984—1988 102.19 80.91 3.71 0.003 18.74 5.30 0.24 0.017 83.45 75.61 3.47 −0.014 1989—1993 108.64 90.87 4.08 0.074 21.37 7.12 0.32 0.015 87.27 83.75 3.76 0.059 1994—1998 129.20 100.86 4.56 0.096 19.14 10.13 0.46 0.028 110.06 90.73 4.10 0.068 1999—2003 142.79 120.98 5.43 0.174 32.29 15.05 0.68 0.044 110.50 105.93 4.75 0.130 2004—2008 155.59 133.63 6.10 0.134 40.00 19.61 0.90 0.044 115.59 114.02 5.20 0.090 2009—2013 164.60 147.79 6.81 0.142 47.07 24.83 1.14 0.050 117.53 122.96 5.67 0.092 2014—2018 179.89 170.58 7.97 0.232 57.13 33.88 1.58 0.088 122.76 136.70 6.39 0.144 注:1949年和1950—1962年两期资源数据不含西藏自治区的数据,1977—1981、1984—1988、1989—1993、1994—1998年4期数据统计不含西藏控制以外;FA为森林面积(106 hm2),FV为森林蓄积(108 m3),FC为碳储量(1012 kg),AC为年均碳累积(1012 kg/a);—表示没有调查统计数据。下同。Notes: The resource data for the periods of year 1949 and 1950−1962 do not include Tibet’s data, and data statistics for the periods of year 1977−1981, 1984−1988, 1989−1993 and 1994−1998 do not include data outside of Tibetan control; FA, forest area (106 ha); FV, forest volume (108 m3); FC, carbon storage (1012 kg); AC, annual average carbon sequestration (1012 kg/year); — indicates no survey statistic data. The same below.
下载: 导出CSV
表 5 全国各区域林分、疏林等碳储量占碳储总量的百分比
Table 5 Percentage of carbon storage in total carbon storage of forest and sparse forest in different regions of China
% 区域
Region组分
Component1949 1950—1962 1973—1976 1977—1981 1984—1988 1989—1993 1994—1998 1999—2003 2004—2008 2009—2013 2014—2018 NE SF 0.97 5.91 6.20 7.48 9.49 10.59 10.55 10.20 6.51 6.15 6.93 FL 99.03 94.09 93.80 92.52 90.51 89.41 89.45 89.80 93.49 93.85 93.07 NN SF 0.66 10.87 15.20 13.83 15.84 22.07 21.39 17.14 13.87 10.45 8.27 FL 99.34 89.13 84.80 86.17 84.16 77.93 78.61 82.86 86.13 89.55 91.73 NW SF 28.78 9.27 14.11 11.92 14.94 16.87 13.04 12.22 9.11 9.70 9.37 FL 71.22 90.73 85.89 88.08 85.06 83.13 86.96 87.78 90.89 90.30 90.63 MS SF 3.95 11.46 28.04 28.94 31.47 34.44 32.01 22.02 15.75 16.35 12.56 FL 96.05 88.54 71.96 71.06 68.53 65.56 67.99 77.98 84.25 83.65 87.44 ES SF 0.00 11.41 21.59 21.78 22.60 18.44 14.85 12.47 9.38 9.39 7.51 FL 100.00 88.59 78.41 78.22 77.40 81.56 85.15 87.53 90.62 90.61 92.49 WS SF 0.00 7.78 13.46 15.21 15.58 29.34 10.93 11.54 8.70 8.84 6.77 FL 100.00 92.22 86.54 84.79 84.42 70.66 89.07 88.46 91.30 91.16 93.23 XZ SF — — 0.00 6.27 0.00 2.70 4.30 1.26 1.19 1.13 0.94 FL — — 100.00 93.73 100.00 97.30 95.70 98.74 98.81 98.87 99.06 CH SF 2.89 8.57 12.19 14.20 15.36 16.13 14.01 11.61 8.76 8.58 7.35 FL 97.11 91.43 87.81 85.80 84.64 83.87 85.99 88.39 91.24 91.42 92.65 注:SF为疏林等,FL为林分。Notes: SF, sparse forest, etc; FL, stand.
下载: 导出CSV
表 6 全国不同时期森林碳密度 t/hm2
Table 6 Changes in forest carbon density in different periods of China
t/ha 区域
Region1949 1950—1962 1973—1976 1977—1981 1984—1988 1989—1993 1994—1998 1999—2003 2004—2008 2009—2013 2014—2018 CH 46.48 42.20 31.64 38.61 36.30 37.60 35.26 38.04 39.19 41.38 44.30 NE 50.81 47.83 42.71 45.47 42.88 43.64 41.68 41.03 41.97 44.69 48.73 NN 40.37 39.81 27.27 31.42 31.53 31.43 31.62 30.92 31.12 34.57 37.89 NW 42.75 49.28 39.25 42.99 39.54 43.56 41.75 43.24 42.77 43.46 46.45 MS 28.18 21.54 10.95 17.94 18.44 19.23 18.54 22.30 24.68 27.82 31.83 ES 38.97 34.21 14.95 29.16 24.30 23.31 21.96 26.81 30.64 33.29 39.27 WS 62.59 54.12 45.30 52.91 48.51 47.50 43.25 43.79 45.03 46.78 46.39 XZ — — 76.05 58.89 58.89 96.75 95.97 90.88 92.10 91.87 88.65
下载: 导出CSV
表 7 本文碳储量与其他研究结果的对比
Table 7 Comparison of carbon storage results between this study and other research
1012 kg 调查期
Investigating
period本文
This study方精云等[1]
Fang J Y, et al.[1]方精云等[12, 30]
Fang J Y, et al.[12, 30]郭兆迪等[40]
Guo Z D, et al.[40]Zhang C H, et al.[24] 朱永杰[39]
Zhu Y J[39]李妍等[41]
Li Y, et al.[41]林分
Stand森林资源
Forest
resource林分
Stand林分
Stand林分
Stand林分
Stand森林资源
Forest
resource林分
Stand林分
Stand1949 4.38 4.51 5.06 — — — — — — 1950—1962 3.98 4.35 4.58 — — — — — — 1973—1976 3.79 4.32 4.44 — — 4.11 4.38 — 3.85 1977—1981 3.69 4.30 4.38 4.30 4.72 4.21 4.75 4.09 3.70 1984—1988 3.71 4.38 4.45 4.46 4.89 4.18 4.82 4.04 3.76 1989—1993 4.08 4.87 4.63 4.93 5.40 4.52 5.25 4.76 4.11 1994—1998 4.56 5.30 4.75 5.01 5.39 4.50 5.12 5.25 4.66 1999—2003 5.43 6.15 — 5.85 5.86 5.41 5.97 6.49 5.51 2004—2008 6.10 6.68 — — 6.43 6.24 6.83 7.895 6.09 2009—2013 6.81 7.45 — — — — — — — 2014—2018 7.97 8.60 — — — — — — —
下载: 导出CSV
-
[1] 方精云, 陈安平. 中国森林植被碳库的动态变化及其意义[J]. 植物学报, 2001, 43(9):967−973. Fang J Y, Chen A P. Dynamic forest biomass carbon pools in China and their significance[J]. Chinese Bulletin of Botany, 2001, 43(9): 967−973.
[2] Koch G, Mooney H. Carbon dioxide and terrestrial ecosystems[M]. San Diego: Academic Press, 1996.
[3] Grier C C, Vogt K A, Keyes M R, et al. Biomass distribution and above- and below-ground production in young and mature Abies amabilis zone ecosystems of the Washington Cascades[J]. Canadian Journal of Forest Research, 1981, 11(1): 155−167. doi: 10.1139/x81-021
[4] Post W M, Deangelis D L. The global carbon cycle[J]. Science, 1988, 241: 1736−1737. doi: 10.1126/science.241.4874.1736-a
[5] Schimel D S. Terrestrial ecosystems and the carbon cycle[J]. Global Change Biology, 1995, 1(1): 77−91. doi: 10.1111/j.1365-2486.1995.tb00008.x
[6] Schlesinger W H. Biogeochemistry: an analysis of global change[J]. San Diego: Academic Press, 1997.
[7] Brown S L, Schroeder P, Kern J S. Spatial distribution of biomass in forests of the eastern USA[J]. Forest Ecology and Management, 1999, 123: 81−90. doi: 10.1016/S0378-1127(99)00017-1
[8] Hughes R F, Kauffman J B, Jaramillo V J. Biomass, carbon, and nutrient dynamics of secondary forests in a humid tropical region of Mexico[J]. Ecology, 1999, 80(6): 1892−1907.
[9] 王万同, 唐旭利, 黄玫, 等. 中国森林生态系统碳储量: 动态及机制[M]. 北京: 科学出版社, 2018. Wang W T, Tang X L, Huang M, et al. Carbon stocks in China’s forest ecosystems: dynamics and mechanisms[M]. Beijing: Science Press, 2018.
[10] 王效科, 冯宗炜, 欧阳志云. 中国森林生态系统植物碳储量和碳密度研究[J]. 应用生态学报, 2001, 12(1):13−16. doi: 10.3321/j.issn:1001-9332.2001.01.003 Wang X K, Feng Z W, Ouyang Z Y. Vegetation carbon storage and density of forest ecosystems in China[J]. Chinese Journal of Applied Ecology, 2001, 12(1): 13−16. doi: 10.3321/j.issn:1001-9332.2001.01.003
[11] Fang J Y, Chen A P, Peng C H, et al. Changes in forest biomass carbon storage in China between 1949 and 1998[J]. Science, 2001, 292: 2320−2322. doi: 10.1126/science.1058629
[12] 方精云, 刘国华, 徐嵩龄. 我国森林植被的生物量和净生产量[J]. 生态学报, 1996, 16(5):497−508. Fang J Y, Liu G H, Xu S L. Biomass and net production of forest vegetation in China[J]. Acta Ecologica Sinica, 1996, 16(5): 497−508.
[13] 刘国华, 傅伯杰, 方精云. 中国森林的碳动态及对全球碳平衡的贡献[J]. 生态学报, 2000, 20(5):733−740. doi: 10.3321/j.issn:1000-0933.2000.05.004 Liu G H, Fu B J, Fang J Y. Carbon dynamics of Chinese forests and its contribution to global carbon balance[J]. Acta Ecologica Sinica, 2000, 20(5): 733−740. doi: 10.3321/j.issn:1000-0933.2000.05.004
[14] 唐守正, 张会儒, 胥辉. 相容性生物量模型的建立及其估计方法研究[J]. 林业科学, 2000, 36(专刊1): 19−27. Tang S Z, Zhang H R, Xu H. Study on establish and estimate method of compatible biomass model[J]. Scientia Silvae Sinicae, 2000, 36(Spec. 1): 19−27.
[15] 赵敏, 周广胜. 基于森林资源清查资料的生物量估算模式及其发展趋势[J]. 应用生态学报, 2004, 15(8):1468−1472. doi: 10.3321/j.issn:1001-9332.2004.08.034 Zhao M, Zhou G S. Forest Inventory data(FID)-based biomass models and their prospects[J]. Chinese Journal of Applied Ecology, 2004, 15(8): 1468−1472. doi: 10.3321/j.issn:1001-9332.2004.08.034
[16] Pan Y, Luo T, Birdsey R, et al. New estimates of carbon storage and sequestration in China’s forests: effects of age-class and method on inventory-based carbon estimation[J]. Climatic Change, 2004, 67(2−3): 211−236. doi: 10.1007/s10584-004-2799-5
[17] 王仲锋, 冯仲科. 森林蓄积量与生物量转换的CVD模型研究[J]. 北华大学学报(自然科学版), 2006, 7(3):265−268. Wang Z F, Feng Z K. On CVD model transforming forestry volume into biomass[J]. Journal of Beihua Forestry University (Natural Sciences Editions), 2006, 7(3): 265−268.
[18] 罗云建, 张小全, 王效科, 等. 森林生物量的估算方法及其研究进展[J]. 林业科学, 2009, 45(8):129−134. doi: 10.3321/j.issn:1001-7488.2009.08.023 Luo Y J, Zhang X Q, Wang X K, et al. Forest biomass estimation methods and their prospects[J]. Scientia Silvae Sinicae, 2009, 45(8): 129−134. doi: 10.3321/j.issn:1001-7488.2009.08.023
[19] Wang B, Huang J, Yang X, et al. Estimation of biomass, net primary production and net ecosystem production of China’s forests based on the 1999−2003 National Forest Inventory[J]. Scandinavian Journal of Forest Research, 2010(25): 544−553.
[20] Xu X, Li K. Biomass carbon sequestration by planted forests in China[J]. Chinese Geographical Science, 2010, 20(4): 289−297. doi: 10.1007/s11769-010-0401-9
[21] 王雪军, 黄国胜, 孙玉军, 等. 近20年辽宁省森林碳储量及其动态变化[J]. 生态学报, 2008, 28(10):145−152. Wang X J, Huang G S, Sun Y J, et al. Forest carbon storage and dynamics in Liaoning Province from 1984 to 2000[J]. Acta Ecologica Sinica, 2008, 28(10): 145−152.
[22] 冯宗炜. 中国森林生态系统的生物量和生产力[M]. 北京: 科学出版社, 1999. Feng Z W. Biomass and productivity of forest ecosystems in China[M]. Beijing: Science Press, 1999.
[23] 周玉荣, 于振良, 赵士洞. 我国主要森林生态系统碳贮量和碳平衡[J]. 植物生态学报, 2000, 24(5):518−522. doi: 10.3321/j.issn:1005-264X.2000.05.002 Zhou Y R, Yu Z L, Zhao S D. Carbon storage and carbon balance of main forest ecosystems in China[J]. Chinese Journal of Plant Ecology, 2000, 24(5): 518−522. doi: 10.3321/j.issn:1005-264X.2000.05.002
[24] Zhang C H, Ju W M, Chen J M, et al. China’s forest biomass carbon sink based on seven inventories from 1973 to 2008[J]. Climatic Change, 2013, 118(3−4): 933−948. doi: 10.1007/s10584-012-0666-3
[25] 李海奎, 雷渊才. 中国森林植被生物量和碳储量评估[M]. 北京: 中国林业出版社, 2010. Li H K, Lei Y C. Assessment of forest vegetation biomass and carbon storage in China[M]. Beijing: China Forestry Publishing House, 2010.
[26] 王雪军, 张煜星, 黄国胜, 等. 三峡库区森林生产力和固碳能力估算[J]. 生态科学, 2014, 33(6):1114−1121. Wang X J, Zhang Y X, Huang G S, et al. Estimation of forest productivity and carbon storage in Three Gorges Reservoir[J]. Ecology Science, 2014, 33(6): 1114−1121.
[27] 曾伟生, 唐守正. 利用混合模型方法建立全国和区域相容性立木生物量方程[J]. 中南林业调查规划, 2010, 29(4):1−6. doi: 10.3969/j.issn.1003-6075.2010.04.001 Zeng W S,Tang S Z. Sample collection approach for modeling of single tree biomass equations[J]. Central South Forest Inventory and Planning, 2010, 29(4): 1−6. doi: 10.3969/j.issn.1003-6075.2010.04.001
[28] 徐新良, 曹明奎, 李克让. 中国森林生态系统植被碳储量时空动态变化研究[J]. 地理科学进展, 2007, 26(6):1−10. doi: 10.3969/j.issn.1007-6301.2007.06.001 Xu X L, Cao M K, Li K R. Temporal-spatial dynamics of carbon storage of forest vegetation in China[J]. Progress in Geography, 2007, 26(6): 1−10. doi: 10.3969/j.issn.1007-6301.2007.06.001
[29] 黄国胜, 马炜, 王雪军, 等. 东北地区落叶松林碳储量估算[J]. 林业科学, 2014, 50(6):167−174. Huang G S, Ma W, Wang X J, et al. Carbon storage measurement of larch forest in northeastern China[J]. Scientia Silvae Sinicae, 2014, 50(6): 167−174.
[30] 方精云, 郭兆迪, 朴世龙, 等. 1981—2000年中国陆地植被碳汇的估算[J]. 中国科学(D辑: 地球科学), 2007, 37(6):804−812. Fang J Y, Guo Z D, Piao S L, et al. Estimation of terrestrial vegetation carbon sink in China from 1981 to 2000[J]. Science in China Press (Series D: Earth Sciences), 2007, 37(6): 804−812.
[31] 中华人民共和国林业部. 当代中国森林资源概况(1949—1993)[M]. 北京: 中华人民共和国林业部资源和林政管理司, 1996. Ministry of Forestry of the PRC. Forest resources in contemporary China (1949−1993)[M]. Beijing: Department of Resources and Forestry Administration, Ministry of Forestry, 1996.
[32] 中华人民共和国林业部. 全国森林资源统计(1994—1998)[M]. 北京: 国家林业局森林资源管理司, 2000. Ministry of Forestry of the PRC. National forest resources statistics (1994−1998)[M]. Beijing: Forest Resources Management Department of State Forestry Administration, 2000.
[33] 国家林业局. 中国森林资源报告[M]. 北京: 中国林业出版社, 2005. State Forestry Administration. China forest resources report [M]. Beijing: China Forestry Publishing House, 2005.
[34] 国家林业局. 中国林业年鉴2008[M]. 北京: 中国林业出版社, 2008. State Forestry Administration. China forestry yearbook 2008[M]. Beijing: China Forestry Publishing House, 2008.
[35] 国家林业局. 中国森林资源报告(2009)[M]. 北京: 中国林业出版社, 2010. State Forestry Administration. China forest resources report (2009)[M]. Beijing: China Forestry Publishing House, 2010.
[36] 国家林业局. 全国森林资源统计: 第八次全国森林资源清查[M]. 北京: 中国林业出版社, 2014. State Forestry Administration. National forest resources statistics: the eighth national forest resources inventory[M]. Beijing: China Forestry Publishing House, 2014.
[37] 张煜星. 中国森林资源1950—2003年结构变化分析[J]. 北京林业大学学报, 2006, 28(6):80−87. doi: 10.3321/j.issn:1000-1522.2006.06.014 Zhang Y X. Change analysis on Chinese forest construction from year 1950 to 2003[J]. Journal of Beijing Forestry University, 2006, 28(6): 80−87. doi: 10.3321/j.issn:1000-1522.2006.06.014
[38] Zhang Y X, Song C H. Impacts of afforestation, deforestation, and reforestation on forest cover in China from 1949 to 2003[J]. Journal of Forestry, 2006, 104(7): 383−387.
[39] 朱永杰. 中国省域森林资源碳汇贡献及其补偿问题研究[M]. 北京: 中国林业出版社, 2012. Zhu Y J. Carbon sequestration contribution and compensation of forest resources in China[M]. Beijing: China Forestry Publishing House, 2012.
[40] 郭兆迪, 胡会峰, 李品, 等. 1977—2008年中国森林生物量碳汇的时空变化[J]. 中国科学: 生命科学, 2013, 43(5):421−431. Guo Z D, Hu H F, Li P, et al. et al. Spatio-temporal changes in biomass carbon sinks in China’s forests during 1977−2008[J]. Science in China Press (Series C), 2013, 43(5): 421−431.
[41] 李妍, 徐新良, 张超. 中国乔木林碳储量变化研究[J]. 森林工程, 2015, 31(4):50−55. doi: 10.3969/j.issn.1001-005X.2015.04.011 Li Y, Xu X L, Zhang C. Study on dynamics of arboreal forest carbon storage in China[J]. Forest Engineering, 2015, 31(4): 50−55. doi: 10.3969/j.issn.1001-005X.2015.04.011

计量
- 文章访问数: 5243
- HTML全文浏览量: 1167
- PDF下载量: 801
