
River morphology simulation and resilient restoration strategies of Yongding River in Beijing
-
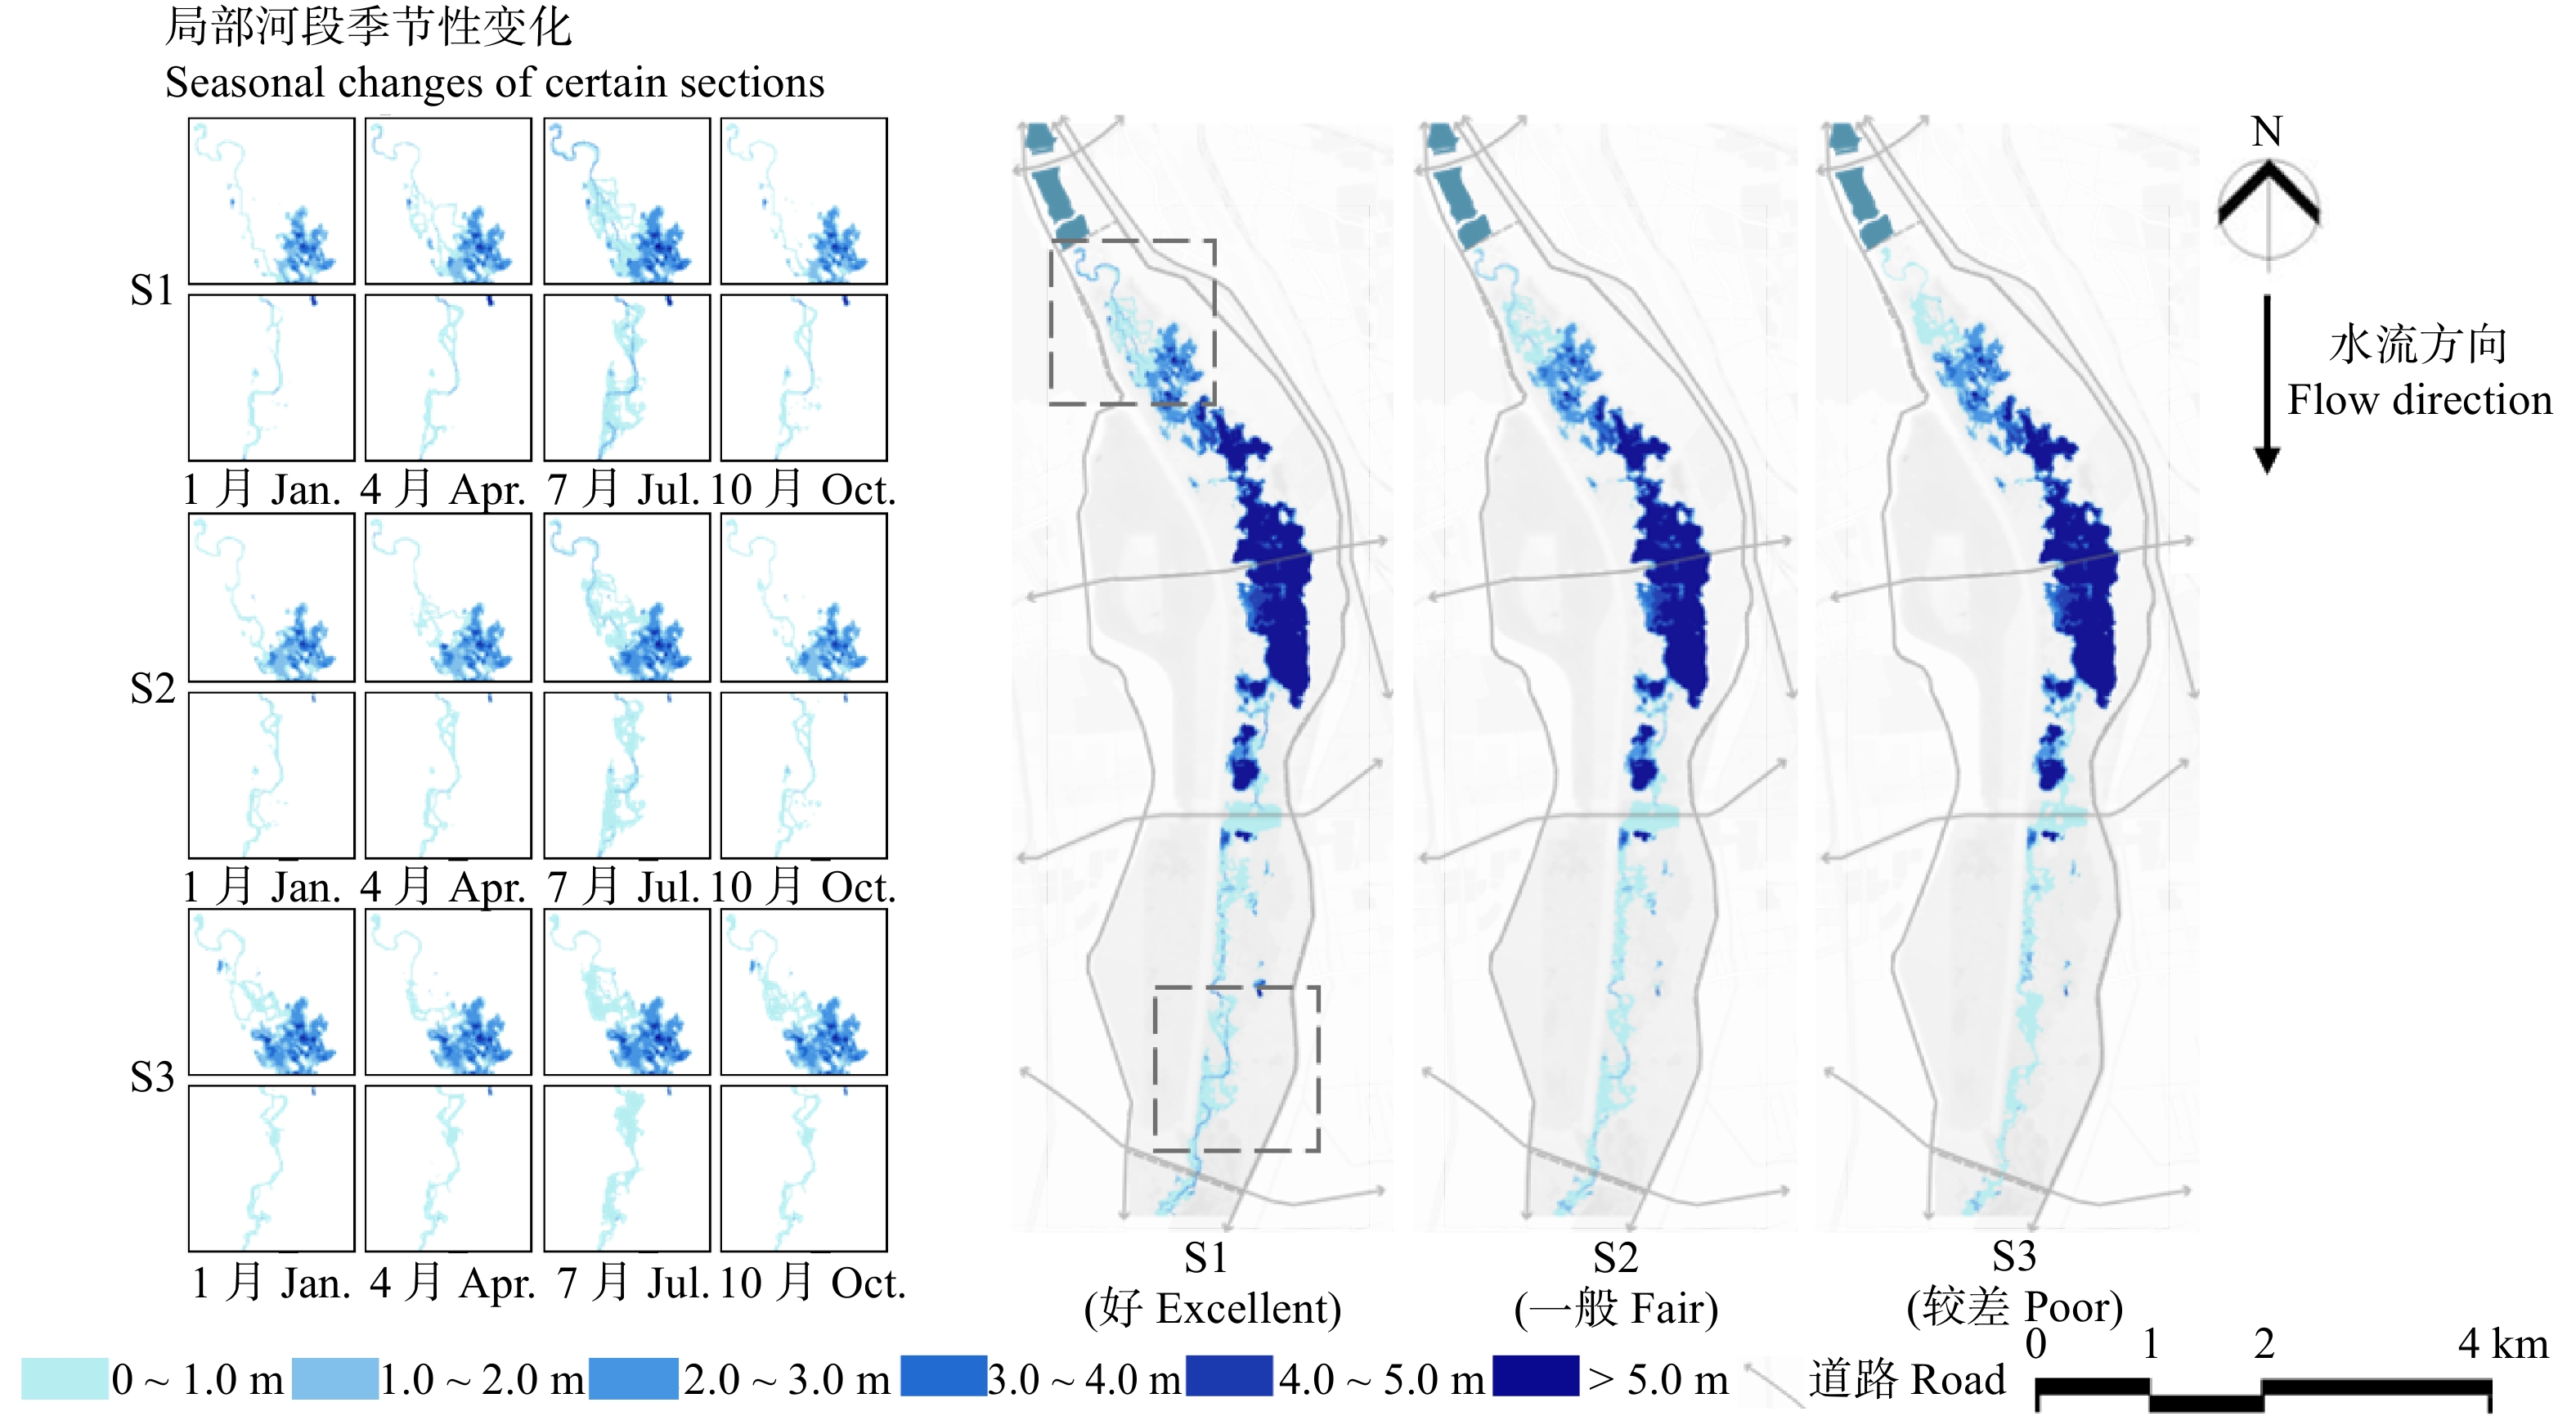
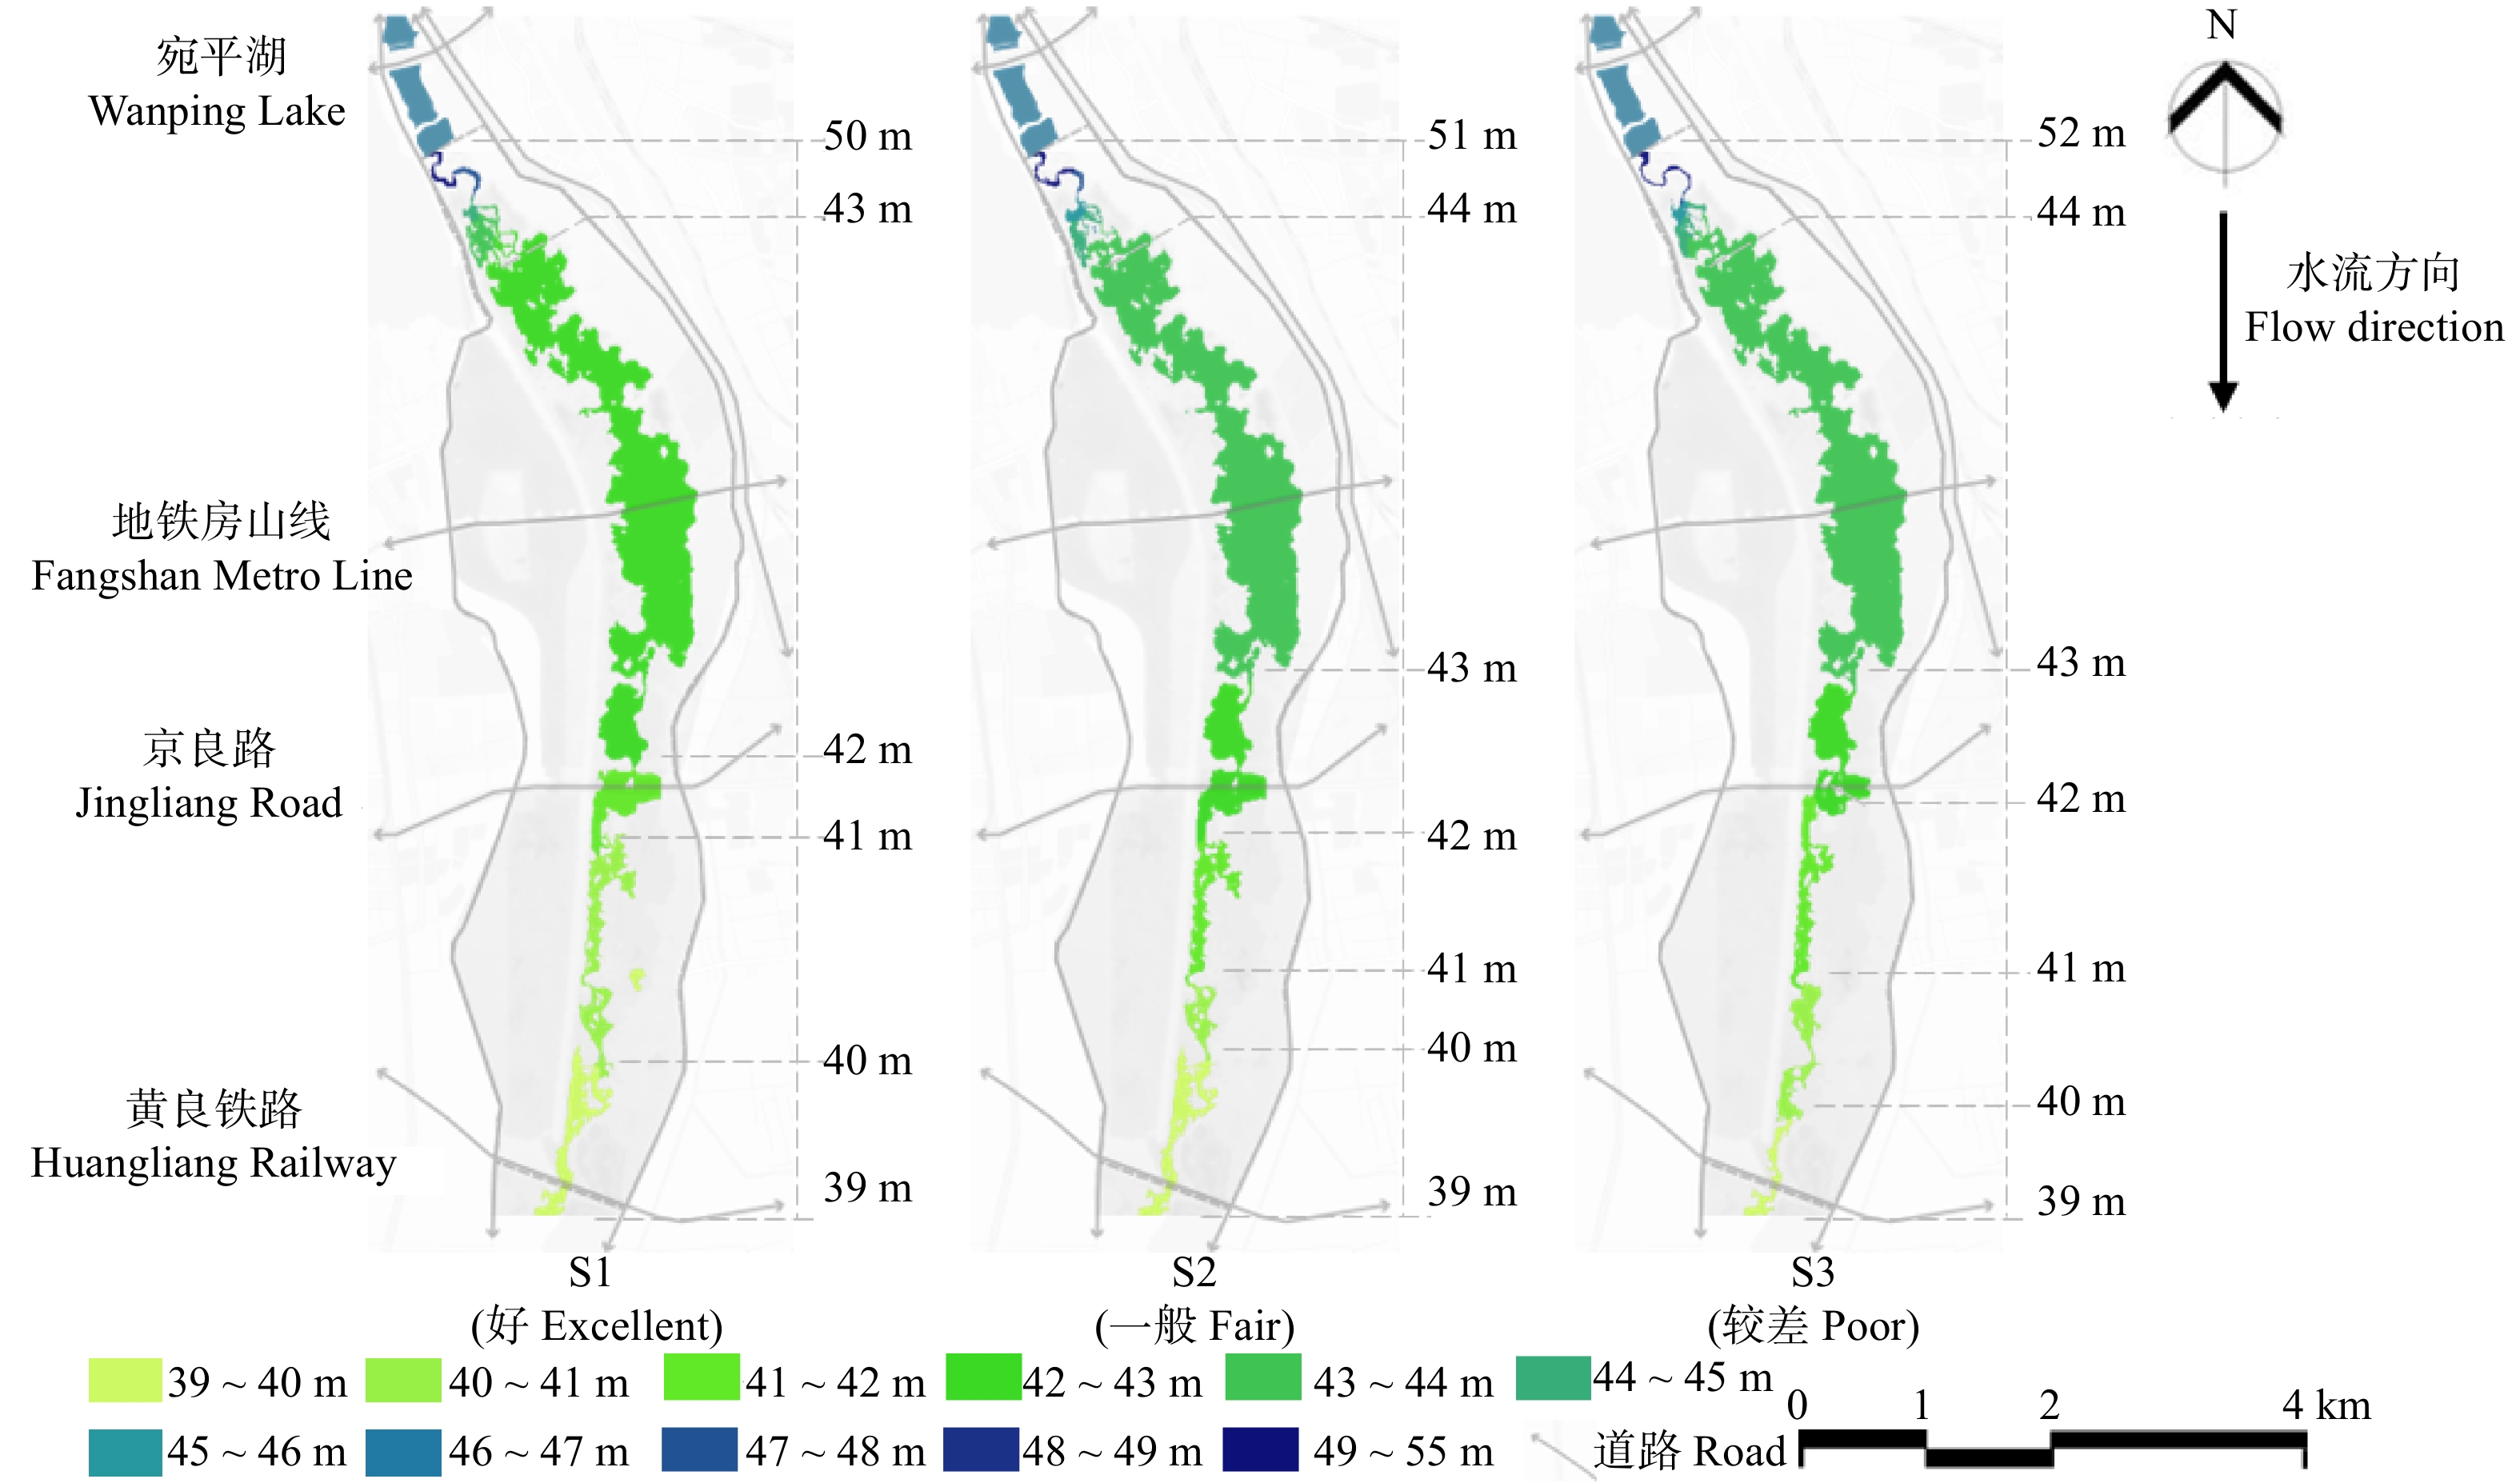
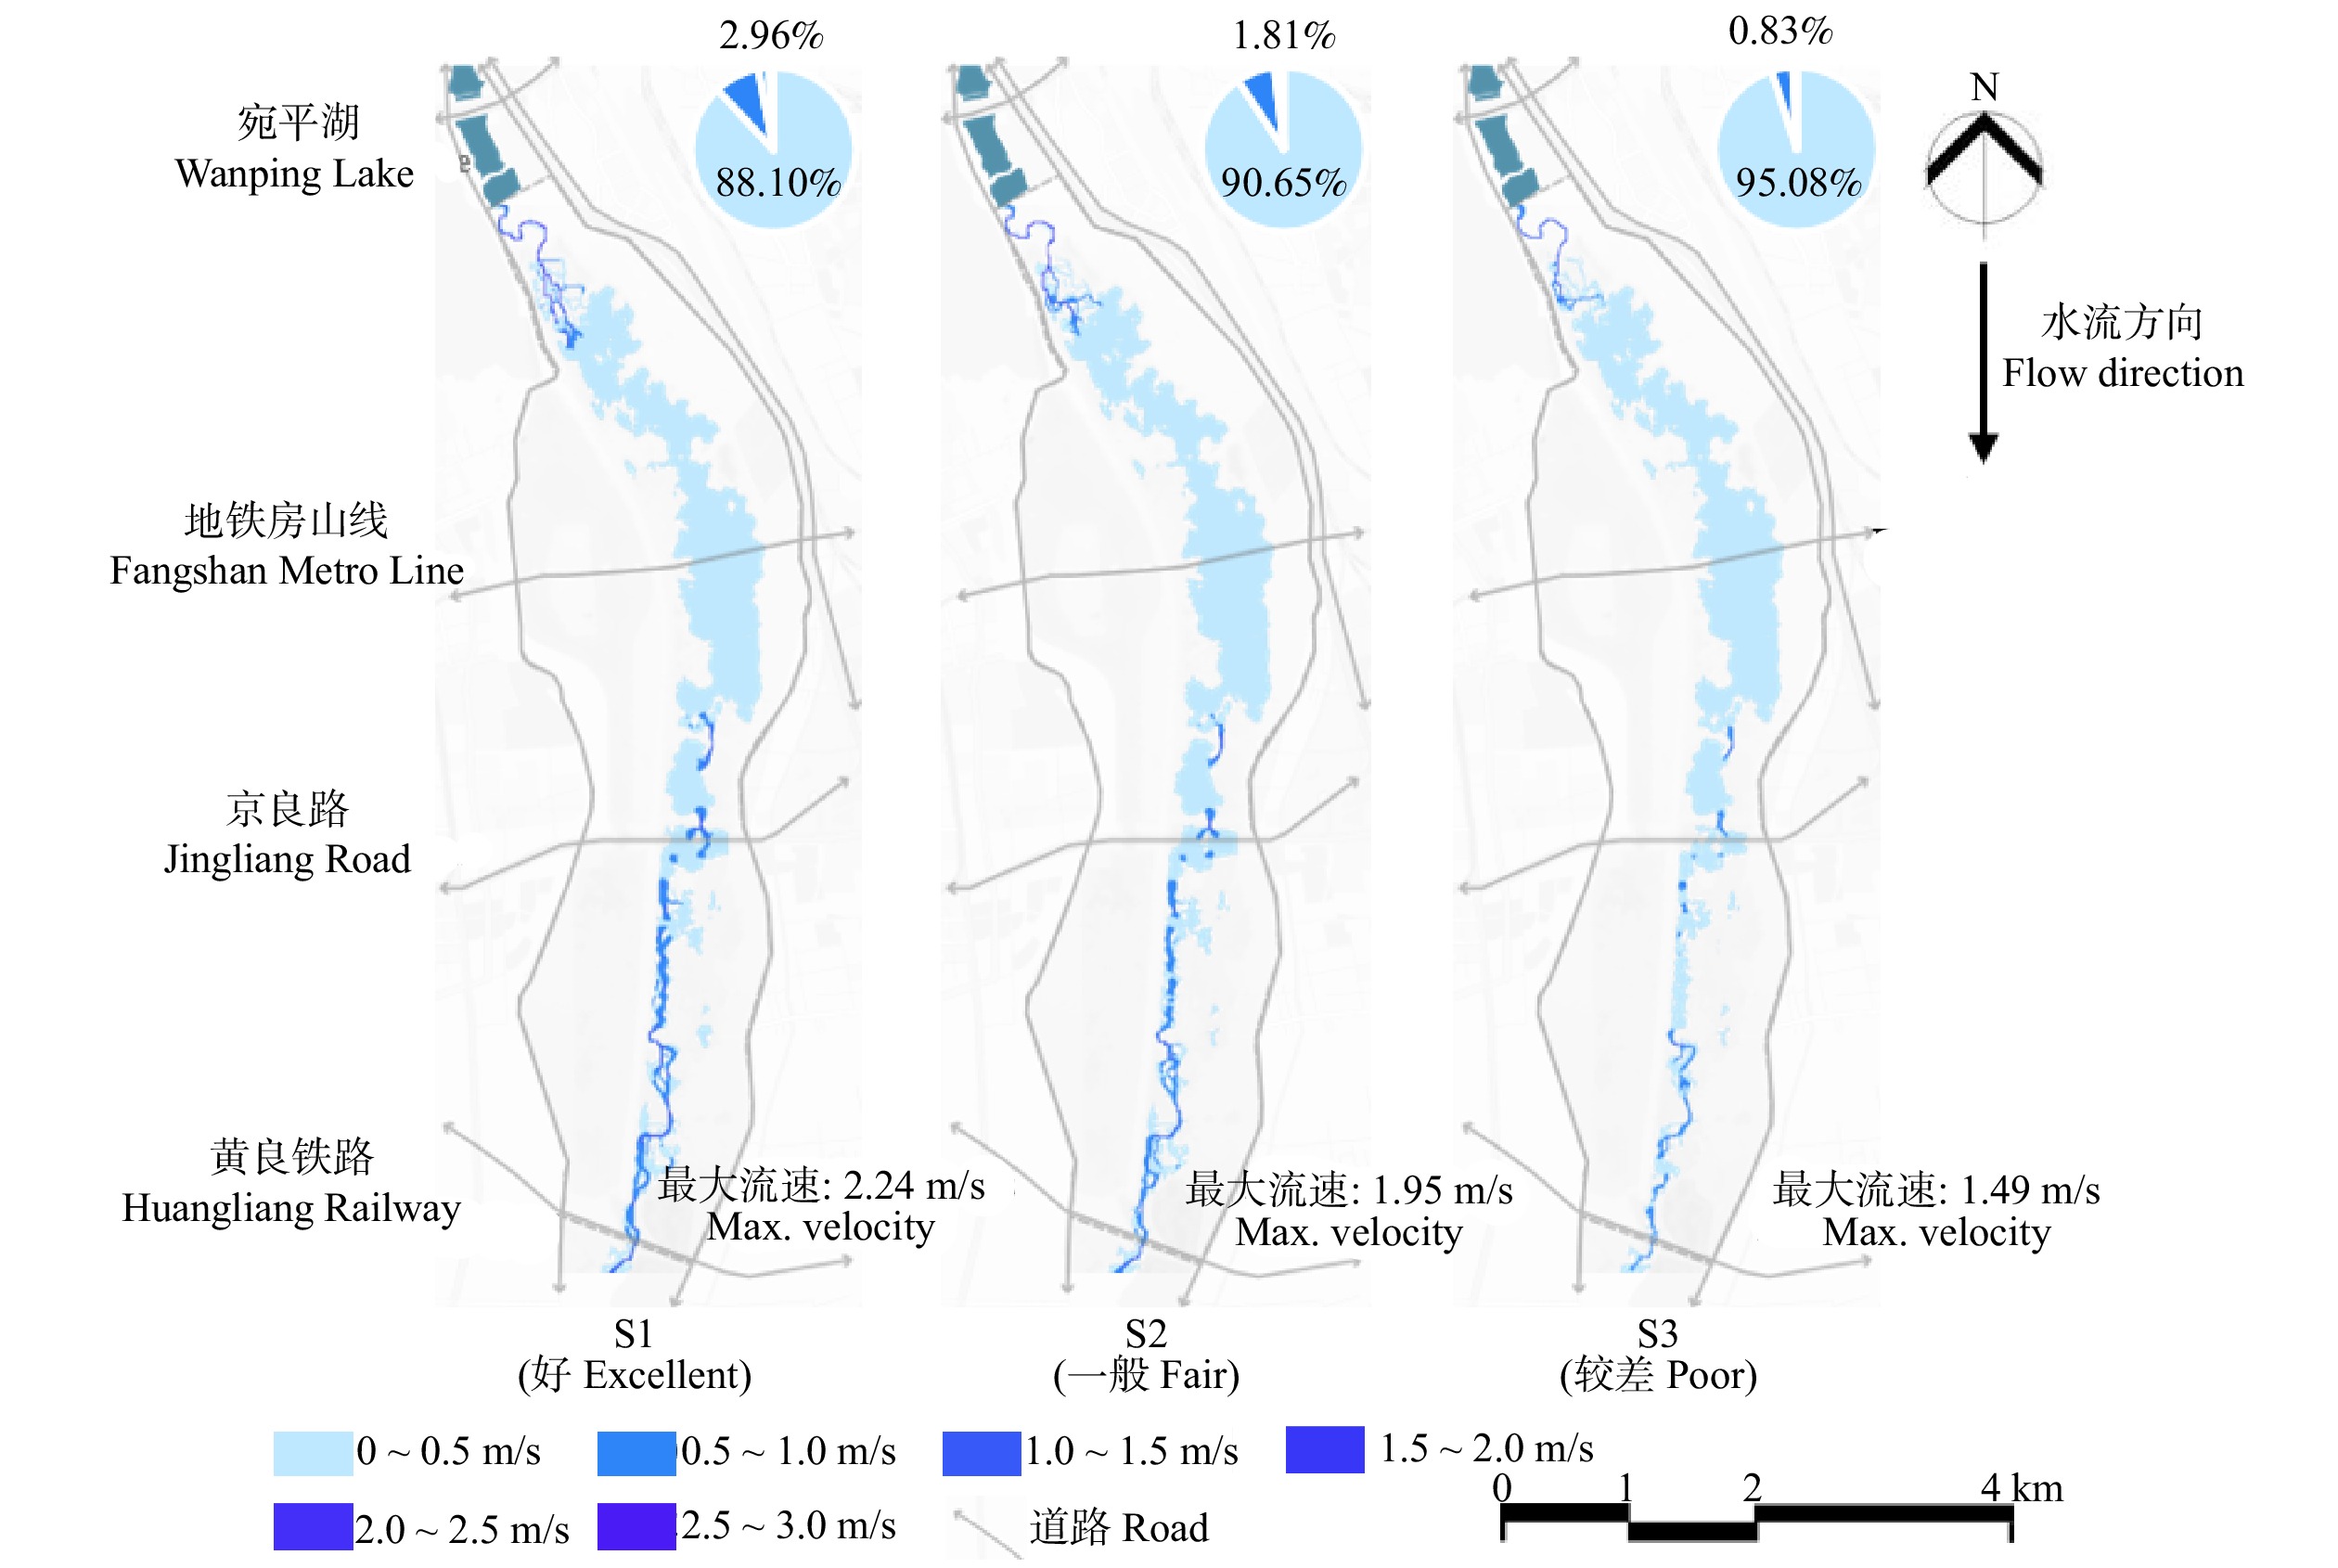
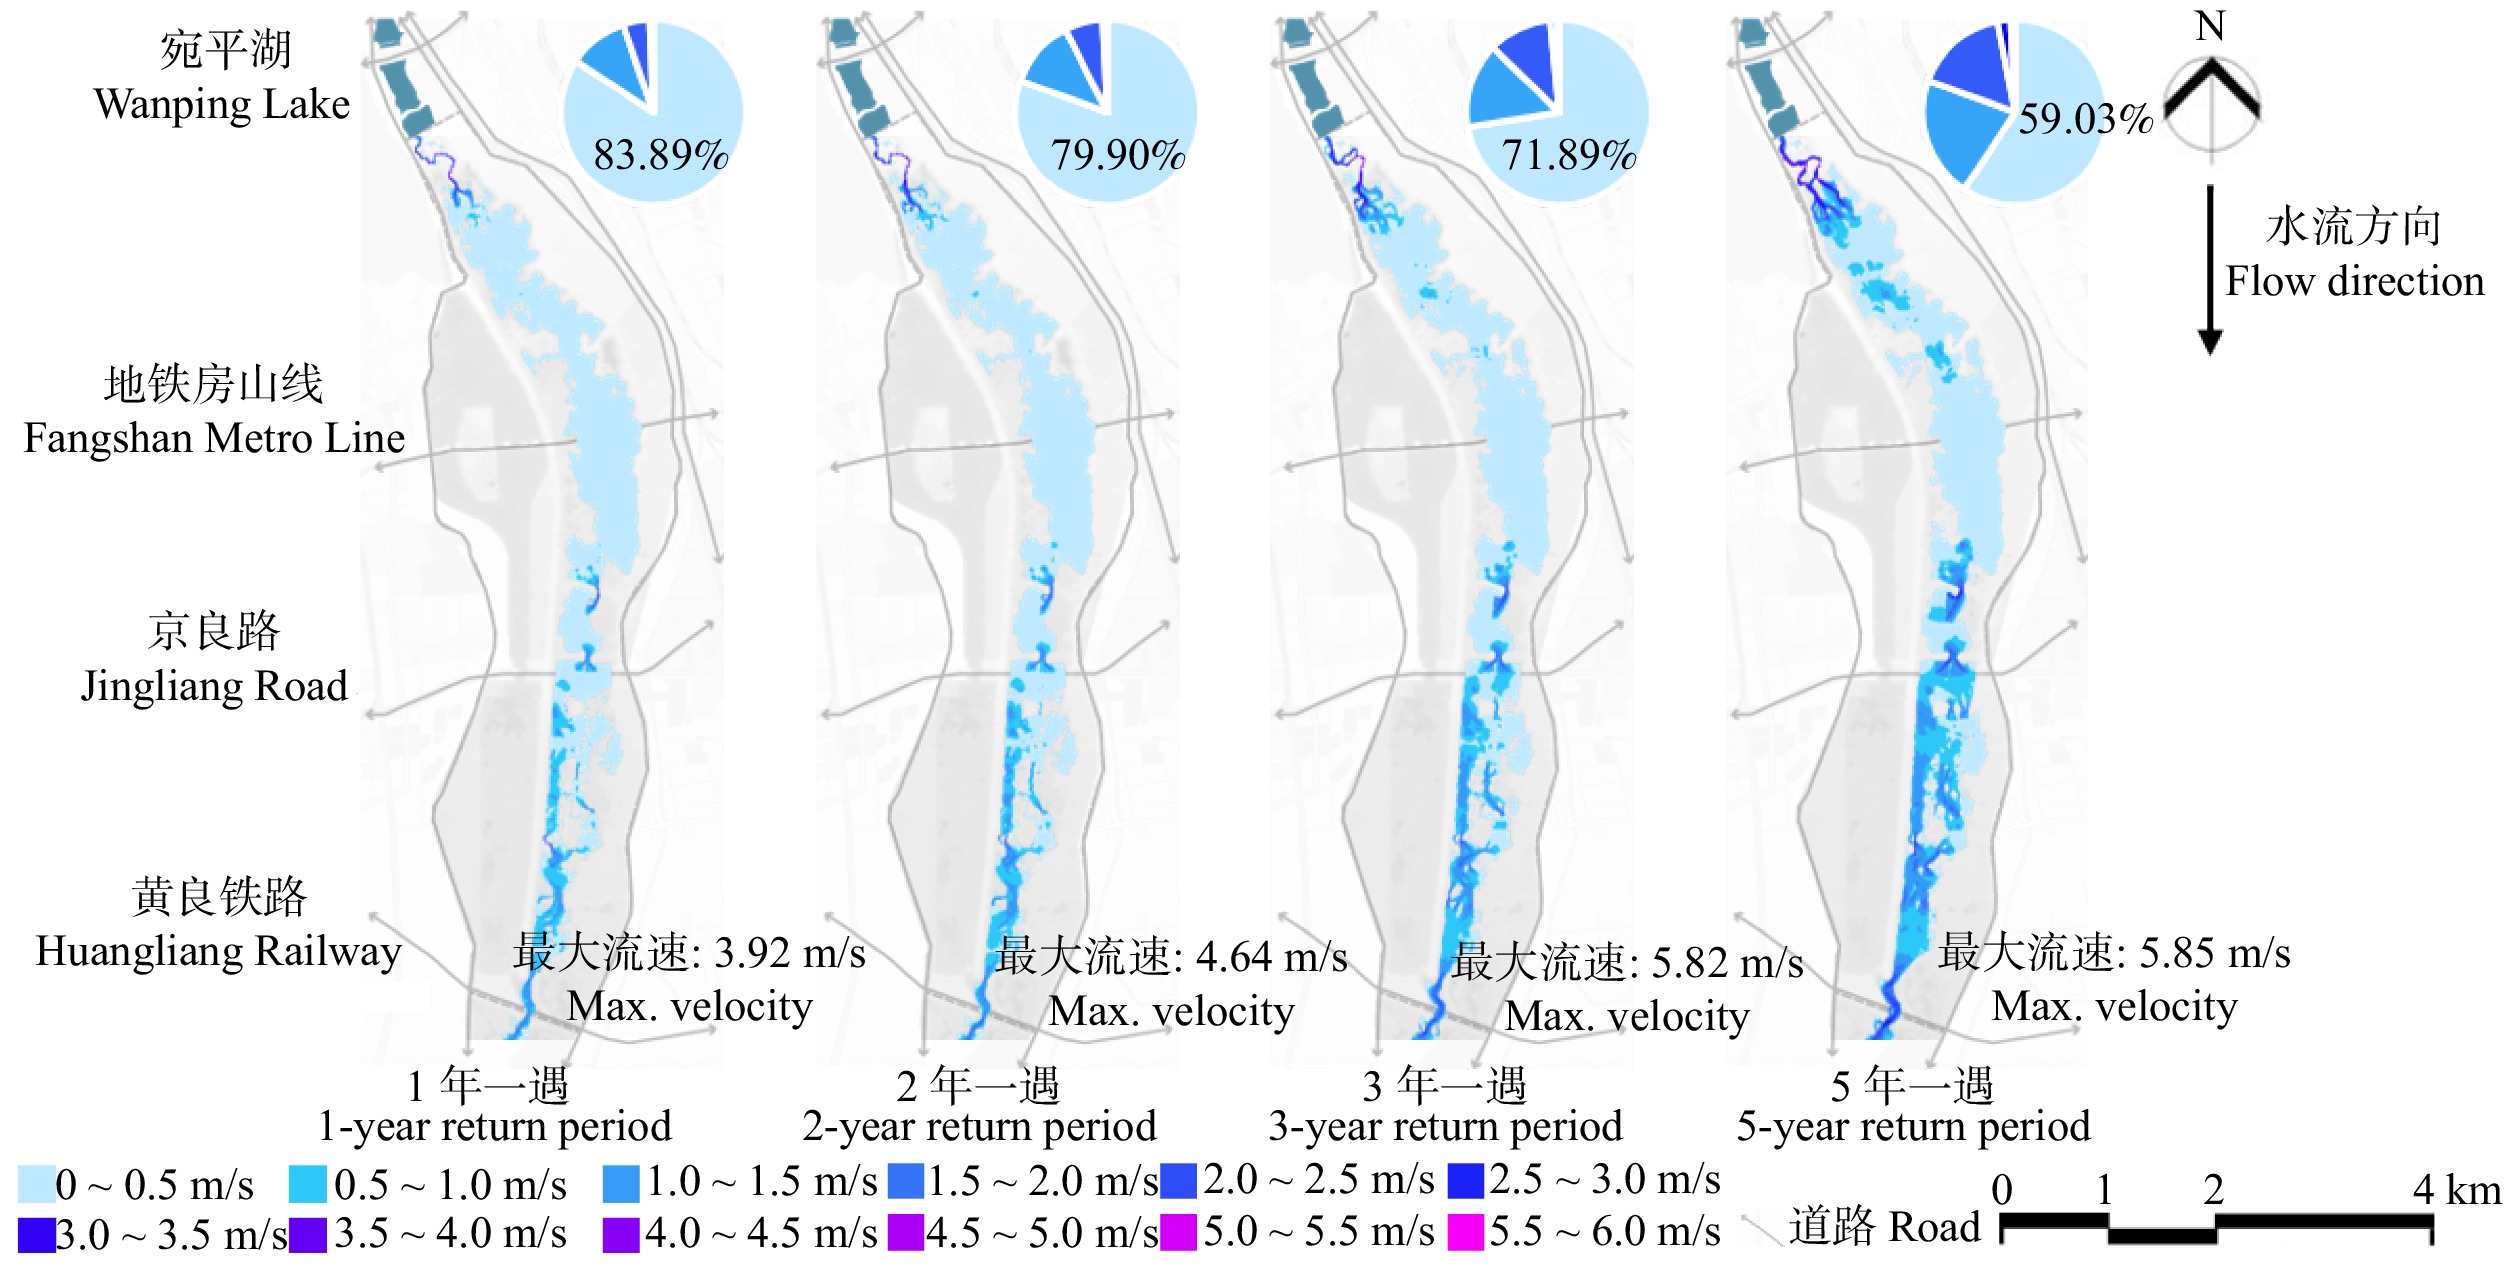
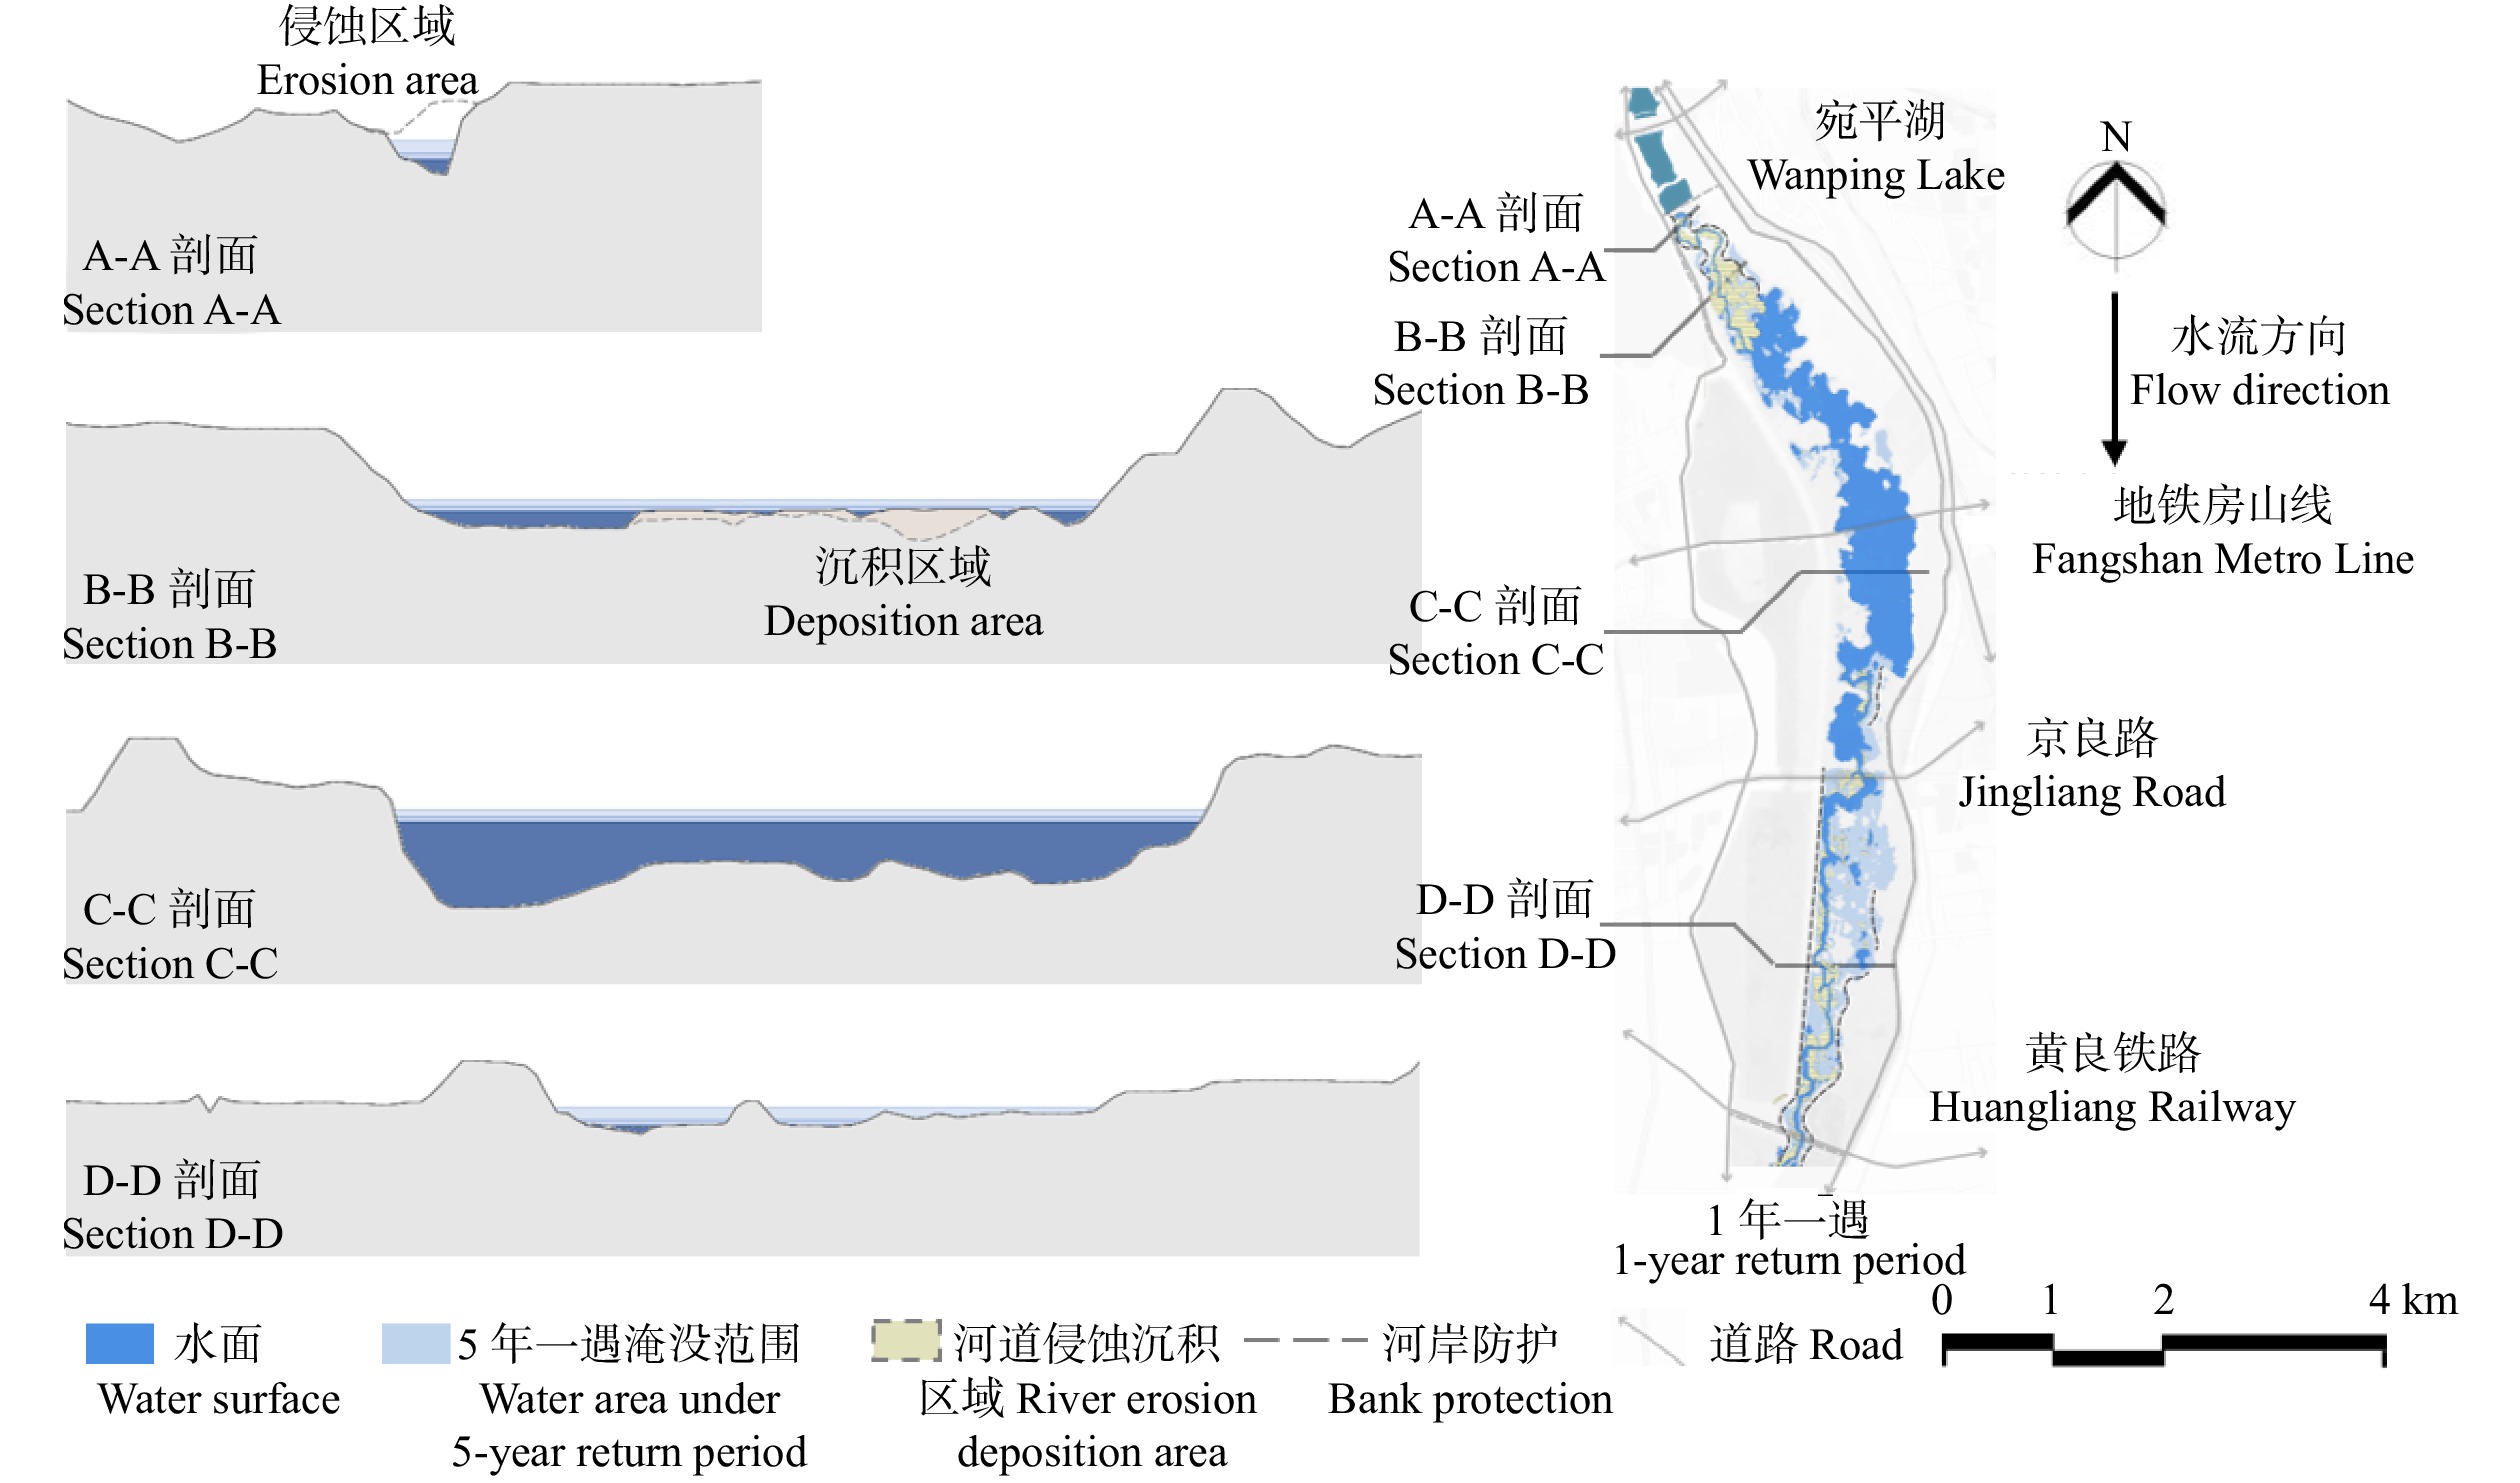
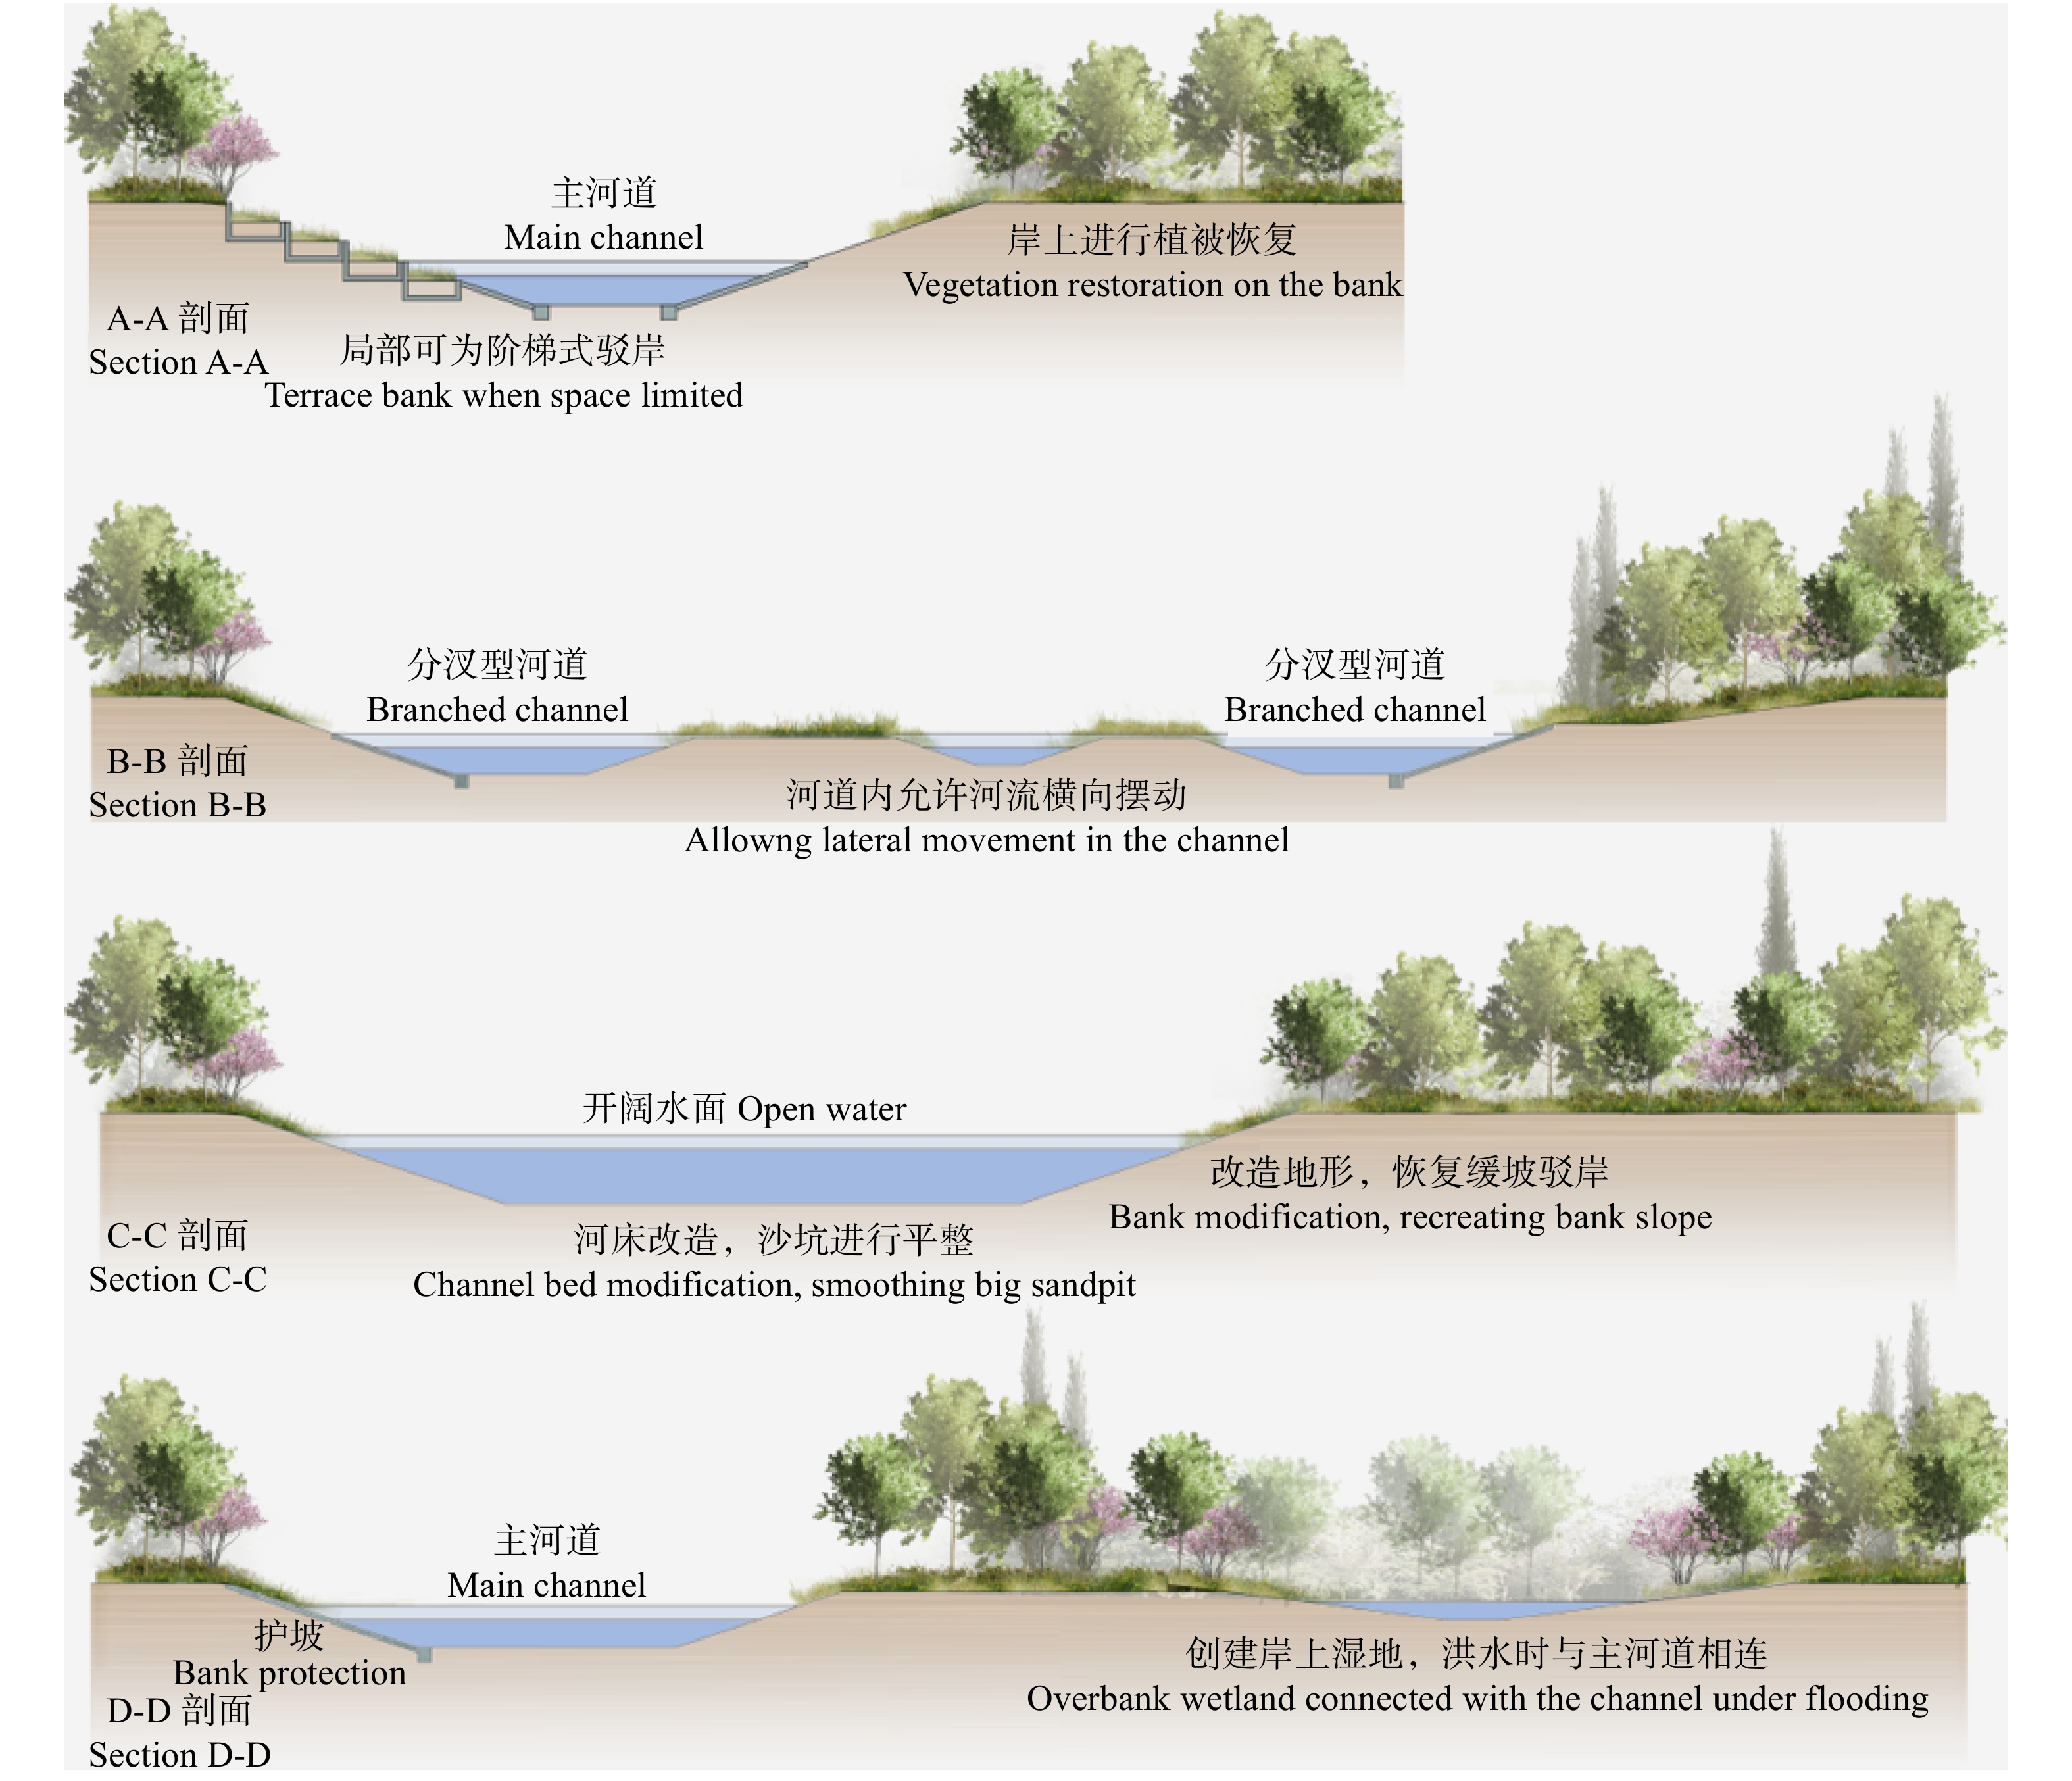
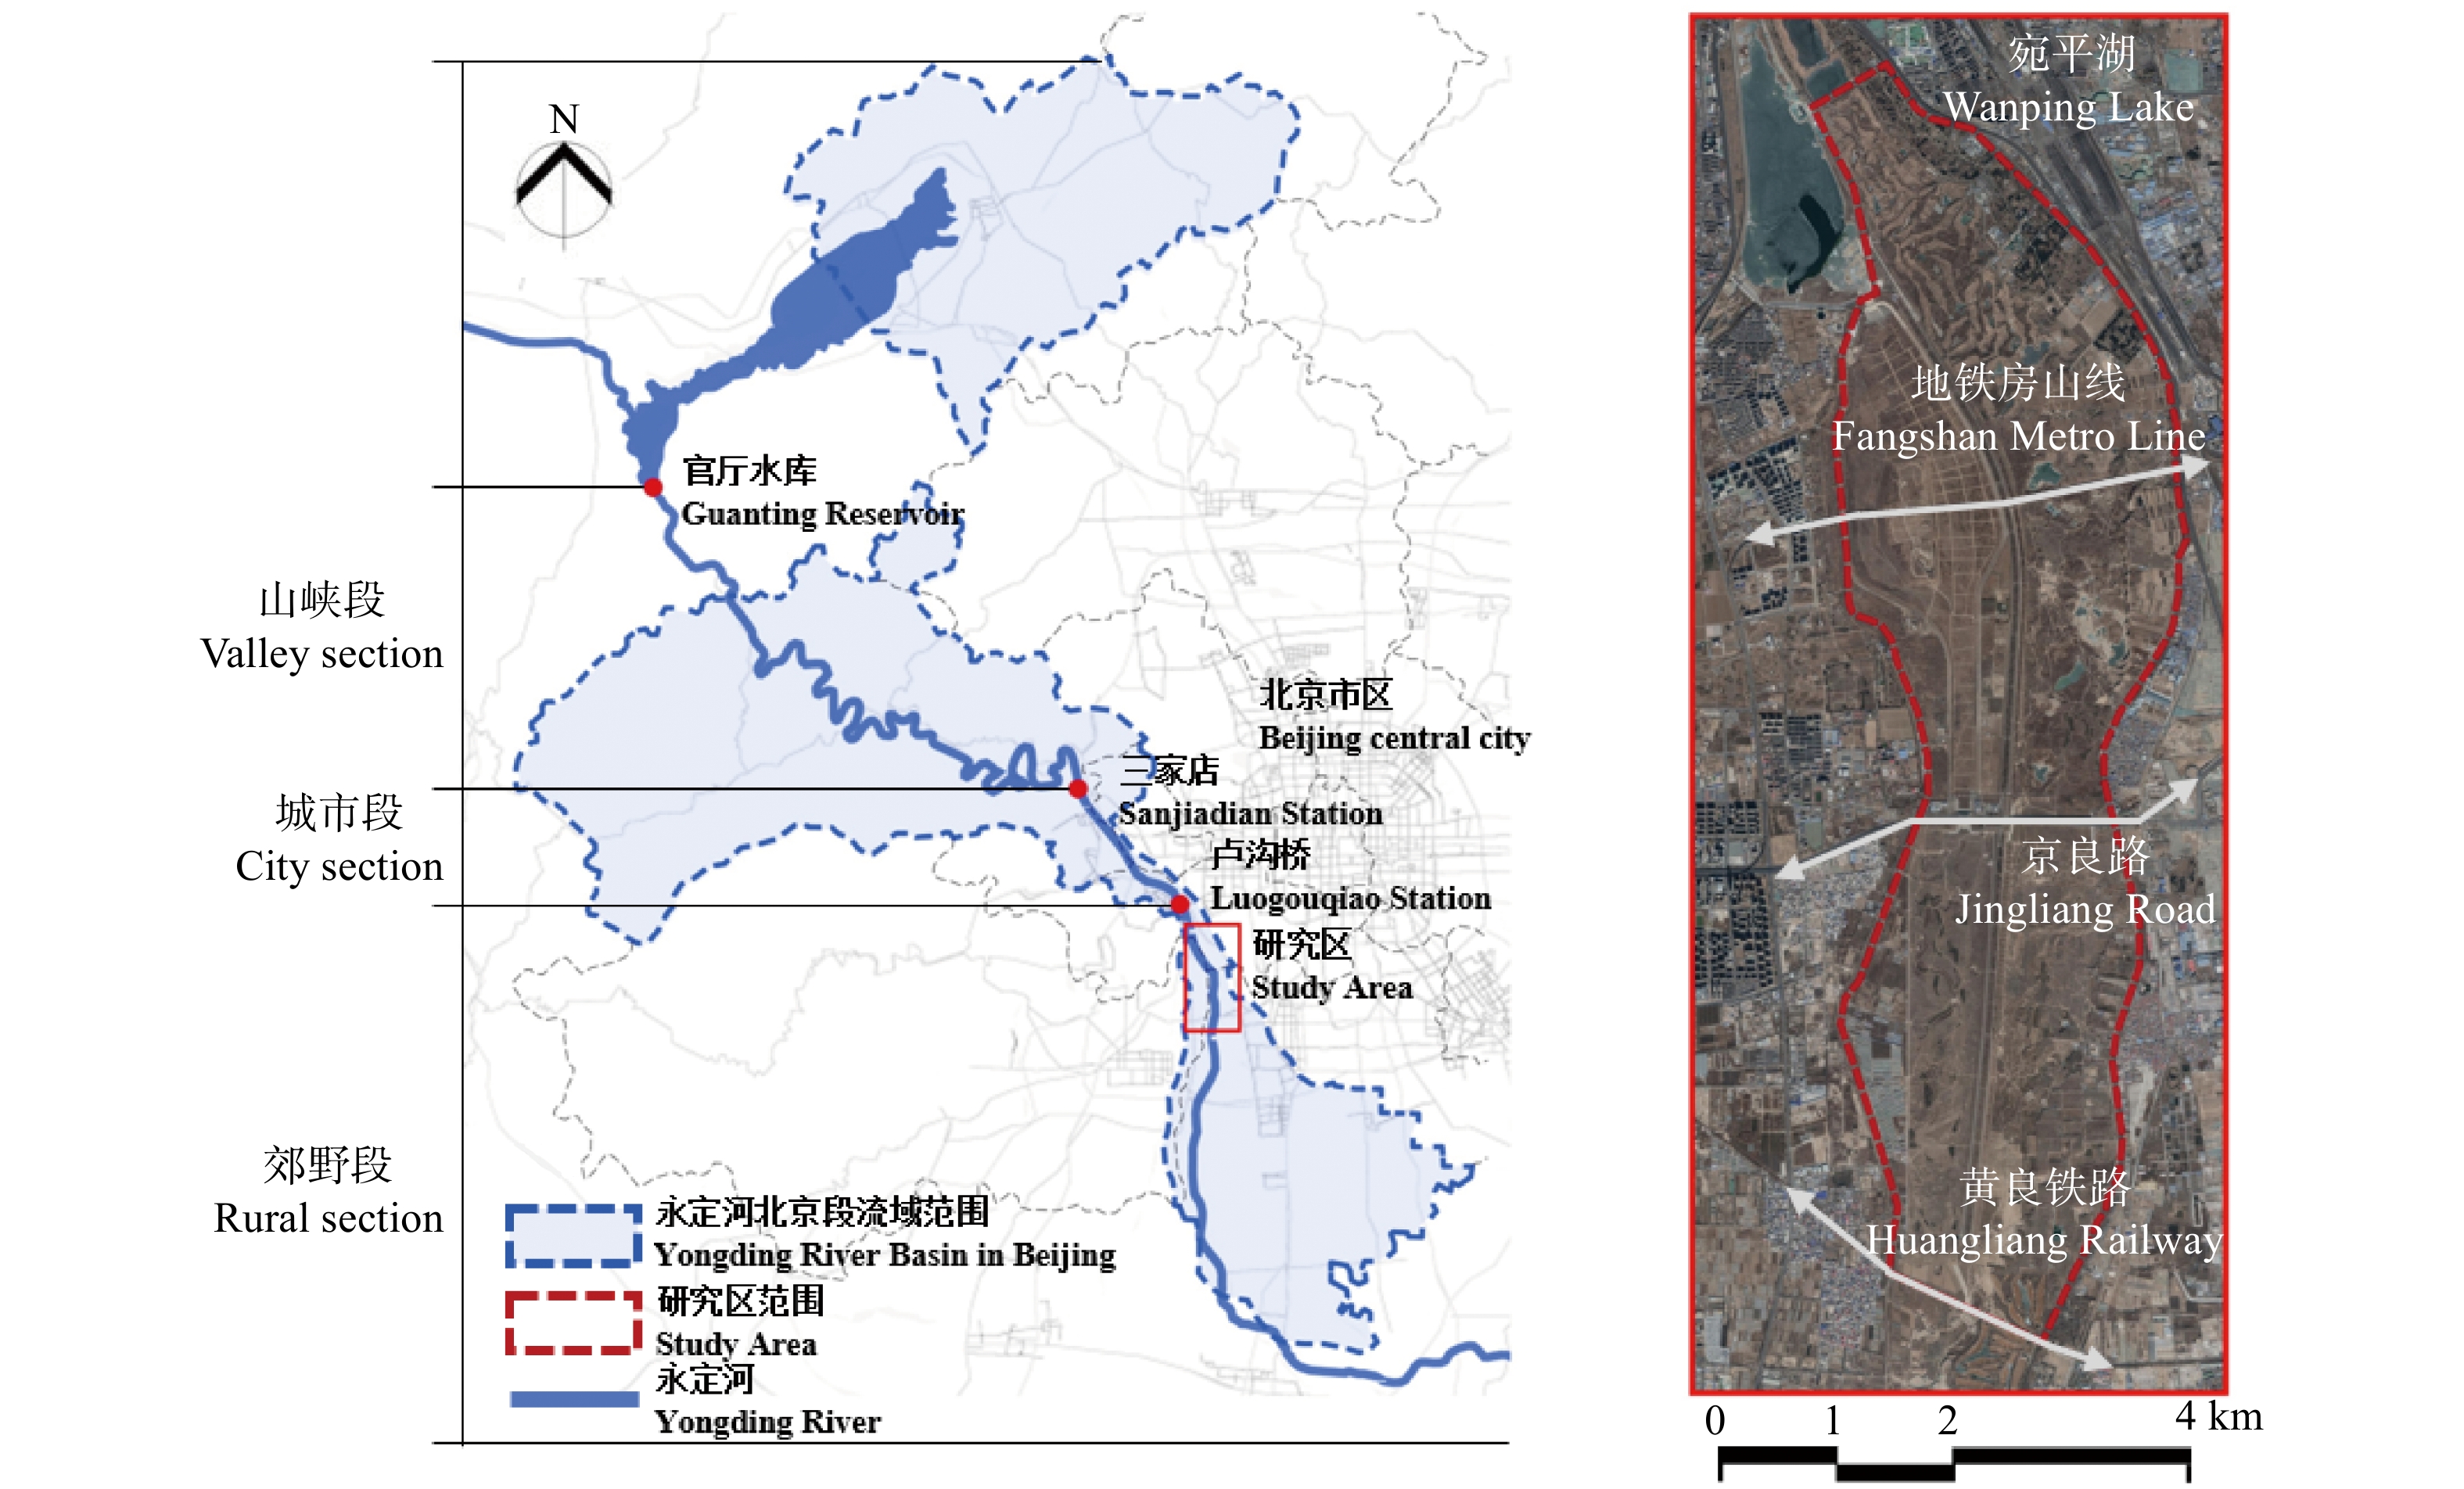
摘要:目的 自20世纪80年代断流以来,永定河下游河道被侵占、破坏严重,2019年和2020年永定河实施生态补水工作。本文选取永定河宛平湖至黄良铁路间河段,模拟不同生态流量和洪水脉冲流量设定下河流形态特征,目的是将补水流量变化与河流形态变化联系,为河流生态修复提供科学支撑。方法 (1)运用Tennant法计算永定河下游生态流量,并选取3种不同等级的生态流量作为后续模拟输入;(2)使用CAESAR-Lisflood 模型模拟3种生态流量和4种洪水脉冲流量下的形态特征。结果 (1)模拟得到3种生态流量下河道内年平均水面面积为439.29 ~ 462.74 hm2,水面高度在40 ~ 52 m之间,最大流速为1.49 ~ 2.24 m/s。河道内侵蚀区域面积为52.18 ~ 77.94 hm2,沉积区域为61.70 ~ 101.39 hm2。4种洪水脉冲流量下,河道内年平均水面面积为637.58 ~ 769.25 hm2,水面高度在42 ~ 55 m之间,最大流速在3.92 ~ 5.85 m/s之间。(2)根据不同河段的形态特征,河道内侵蚀/沉积区域范围和5年一遇洪水淹没范围,提出不同河段修复策略,并确定河道内弹性空间范围。结论 在生态补水工作的促进下,研究河段以及整个永定河北京段断流河段的修复应以自然修复为主,人工修复为辅。在生态修复过程中需要预留充足的河流空间,允许河道形态变化,发挥河道自我修复能力。通过长期的、不间断的人工监测和策略调整,逐渐恢复断流区河流生态系统功能及自然河流景观。Abstract:Objective The downstream channel of Yongding River was occupied and damaged seriously after it was dry from the 1980s. Ecological water replenishments were carried out in 2019 and 2020 for river ecological restoration. The reach between Wanping Lake and Huangliang Railway was selected to simulate the river morphology under different ecological flows and pulse flows. This paper aims to couple different flow discharges with the river spatial morphology to provide information for ecological restoration.Method (1) Ecological flow discharges of different habitat conditions were calculated by Tennant method. And three ecological flow discharges and four pulse flow discharges were selected and set as the hydrology inputs for simulation. (2) The river morphology characteristics under flow discharges above were modelled by CAESAR-Lisflood model.Result (1) The simulation results under different ecological flows were: the annual average wetted areas were 439.29−462.74 ha, water surface heights were 40−52 m, the Max. velocities were 1.49−2.24 m/s, the erosion areas were 52.18−77.94 ha, and the deposition areas were 61.70−101.39 ha. The results under different pulse flows were: the wetted areas were 637.58−769.25 ha, water surface height was 42−55 m, and the Max. velocities were 3.92−5.85 m/s. (2) The restoration alternatives were suggested according to the river spatial morphology characteristics. And the erosion/deposion areas and the flooding areas under 5-year return period flood were identified as the resilient space.Conclusion The study reach and the whole dry downstream of Yongding River in Beijing should be ecologically restored by natural recovery and artificial restoration measures under the implementation of ecological water replenishment. It is necessary to make space for nature to heal itself and for river dynamic processes. And it needs long-term monitoring and adaptive management strategies to rebuild the ecosystem function and the natural river landscape in the future.
-
近年来,木材被广泛应用于室外领域,如木结构建筑、木栈道、木围栏等。然而在室外应用时,木材会不可避免地受到自然环境因素的影响,产生腐朽等生物劣化现象[1],不仅缩短了其使用寿命,还会造成安全隐患。目前,户外木材主要采用南方松(Pinus spp.)和欧洲赤松(Pinus sylvestris)等松木为原料。并且有研究表明:相比于采绒革盖菌(Coriolus versicolor)等白腐菌,松木等针叶材更易受密黏褶菌(Gloeophyllum trabeum)和绵腐卧孔菌(Poria vaporaria)等褐腐菌侵害,且褐腐菌能够在较短时间内快速降解木材,在质量损失较低的情况下导致木材力学强度急剧下降[2],严重影响其使用价值。因此,阐明木材在褐腐初期的微观结构和化学成分变化对于木材防腐保护具有重要意义。
在褐腐过程中,轴向排列的细胞有利于真菌沿木材的顺纹方向蔓延生长,但实际应用中,木材通常要经过封端处理以防止端裂、腐朽等劣化发生。而对于花纹美观且直接暴露的弦切面与径切面,菌丝进入木材内部的通道主要为射线薄壁组织、细胞壁纹孔等[3-5]。随着褐腐的进行,木材中的纤维素和半纤维素被陆续降解,而木质素基本不被破坏[6],因此残留的木质素使得木材在宏观上通常呈现出红褐色[7]。研究表明:在褐腐过程中半纤维素首先发生降解,其降解速度比纤维素更快[8-9]。此外,腐朽材中纤维素的结晶度也明显降低,有研究显示:褐腐15周后的马尾松(Pinus massoniana)相对结晶度下降了60.05%[10],这表明结晶纤维素在褐腐过程中遭到破坏,原本排列有序的分子链被打乱,分子间作用力减小,进而导致分子间间隙增加。褐腐初期对于木材性能的影响非常显著。Witomski等[11]利用粉孢革菌(Coniophora puteana)对欧洲赤松进行腐朽试验,发现褐腐初期纤维素的聚合度由6 000降至1 800,而此时的质量损失仅为7%。尽管褐腐初期木材的质量损失较低(通常不超过10%[12]),但会使木材力学强度急剧下降[13]。
综上所示,以往研究的褐腐周期一般较长(12周),且大多关注腐朽带来的最终结果。对腐朽各阶段,尤其是褐腐初期,木材组分及宏、微观变化的研究并不深入。因此,本研究对户外常用的南方松边材进行不同时长的褐腐处理,重点关注腐朽初期木材的各项变化,揭示褐腐菌进入木材内部的通道,并阐明其对木材微观结构和化学成分变化的影响,为深入探究木材褐腐机理奠定理论基础。
1. 材料与方法
1.1 材 料
南方松边材,试件尺寸为10 mm (轴向) × 20 mm (弦向) × 20 mm (径向);饲木选用南方松边材,尺寸为3 mm(轴向) × 20 mm (弦向) × 20 mm(径向)。褐腐菌采用密黏褶菌,购自中国普通微生物菌种保藏管理中心。
1.2 褐腐试验
参照GB/T 13942.1—2009 《木材耐久性能第一部分:天然耐腐性实验室试验方法》[14]进行土壤木块法测试,腐朽时长分别为0、10、20、40 d。试件在腐朽过程中的质量损失率(L)按公式(1)计算:
L=m0−m1m0×100% (1) 式中:L为试件质量损失率,%;m0为试件腐朽前的绝干质量,g;m1为试件腐朽后的绝干质量,g。
1.3 颜色测定
利用色差仪(三恩施NH310,中国)对木材腐朽前后弦切面的颜色进行表征,测得CIE色度系统中的参数L*、a*和b*。L*为明度值(白色为100,黑色为0),a*为红绿色品指数(a*值越大,颜色越偏红,反之偏绿),b*为黄蓝色品指数(b*值越大,颜色越偏黄,反之偏蓝)。每块试件选取5个点位进行测试,并计算平均值。腐朽过程中的总色差(ΔE)按式(2)计算:
ΔE=√ΔL∗2+Δa∗2+Δb∗2 (2) 式中:ΔE为腐朽前后木材的总色差;ΔL*、Δa*、Δb*分别为不同腐朽时间后腐朽材与健康材的L*、a*、b*差值。
1.4 化学成分测定
试件的苯−乙醇抽提物、酸不溶木质素、综纤维素、纤维素含量,分别根据GB/T 2677.6—94《造纸原料有机溶剂抽出物含量的测定》[15]、ASTM D 1106—96 “Standard Test Method for Acid-Insoluble Lignin in Wood”[16]、Browning(1967)的综纤维素改进测定法[17]、硝酸−乙醇纤维素测定法[18]进行测试。半纤维素含量由综纤维素与纤维素含量之差得到。
1.5 微观形貌表征
收集不同腐朽时长的试件,并在其弦切面与横切面上分别制取5 mm × 5 mm薄片,利用场发射扫描电子显微镜(FE-SEM,日立SU8010,日本)进行观察。同时,使用ImageJ软件测量木材在腐朽过程中细胞壁厚度的变化。
1.6 红外光谱表征
利用傅里叶红外光谱仪(FTIR,Nicolet IS 10,美国),通过KBr法测定试件的红外光谱,扫描范围为400 ~ 4 000 cm−1,扫描次数为64次,分辨率为4 cm−1。
1.7 相对结晶度测定
利用X射线衍射仪(XRD,Bruker D8 ADVANCE,德国)、Jade 6.0软件对试件进行测试与分析。扫描角度范围为5° ~ 40°(2θ),扫描速率为2.0°/min,步长0.02°。
根据Scherrer公式计算微晶尺寸[19]:
Cs=Kλβcosθ (3) 式中:Cs为微晶尺寸,Å;K为校正系数,取0.90;λ为X射线衍射波长,取1.54 Å;β为衍射峰的半高宽,°;θ为布拉格角,°。
根据Segal公式计算相对结晶度[20]:
Cr=I200−IamI200×100% (4) 式中:Cr为相对结晶度,%;I200为(200)晶格衍射角的总强度,2θ = 22.4°,即结晶区的衍射强度;Iam为(110)与(200)晶格之间最小强度,即非结晶区衍射的散射强度,2θ = 18.4°。
2. 结果与讨论
2.1 宏观颜色变化分析
由图1可知:经褐腐菌侵染后,木材的表面(弦切面)颜色发生明显变化,从原来的偏黄色变为灰褐色。随着腐朽的进行,木材表面的ΔL*值持续降低,表明木材颜色变暗(图1b)。同时,Δa*与Δb*值总体呈增加趋势,表明腐朽后木材表面更偏向红褐色。随着腐朽程度的深入,木材中的综纤维素被大量脱除,残留的木质素使木材呈现为红褐色,色差值进一步增大。
2.2 微观形貌变化分析
图2和图3分别为南方松边材在腐朽不同时长后的弦切面和横切面电镜照片。在此过程中,木材的质量变化和细胞壁厚度变化情况如图4所示。由图2可知:未经腐朽的试件显示出较为光滑平整的弦切面(图2a),然而其横切面表面(图3a)还残留着一些破碎的木材组织,这主要由试件的锯切加工过程导致。腐朽10 d后,这些残留的木材组织被逐步降解,在横切面上裸露出木材的细胞腔与细胞壁(图3b)。同时,对于径向排列的射线薄壁细胞,可以观察到其内部菌丝已经穿透细胞壁(矩形框线内的截取图像),并横穿细胞腔,有延伸到下一个细胞的趋势。此外,在弦切面上(图2b)可以发现,木材表面被菌丝附着,同时细胞壁上部分具缘纹孔的纹孔膜被降解并发生破裂(矩形框内的放大图像),菌丝穿透纹孔进入木材细胞腔。研究表明,纹孔膜的主要成分为半纤维素与少量纤维素[21],为褐腐菌降解木材的主要成分。褐腐10 d后,木材内部残留的菌丝较少,结合图4可知,此时的木材质量损失率较低,仅为2.77%。腐朽20 d后,木材的质量损失率增大为16.60%,表明褐腐菌的生长迅速,对营养物质的代谢更剧烈,加快了对木材的降解进程。此时,在木材的管胞内(图2c、图3c)观察到大量交叉缠绕的菌丝,部分菌丝正从纹孔处进入细胞腔(图2c箭头位置),并在细胞腔内蔓延生长,表明褐腐菌逐步完成初期定植。此外,从横切面上可以观察到,木材的S2层被严重降解,细胞壁厚度损失率高达18.24%(图4b)。随着腐朽天数的延长,菌丝的数量不断增加,木材的质量和细胞壁厚度进一步降低。腐朽40 d后,木材的弦切面基本被菌丝覆盖(图2d),而横切面上的木材细胞壁也不再完整,由于纤维素的降解,细胞壁结构逐渐失去支撑作用,出现溃烂瓦解的现象(图3d)。此时,木材的质量损失率和细胞壁厚度损失率分别为20.35%和20.86%(图4),相比于之前,木材的降解速度有所减缓,据此推测腐朽20 d时菌丝已基本完成初期定植。
![]() 图 2 不同腐朽时间后木材的弦切面微观结构图片Figure 2. FE-SEM images of samples at tangential section at different decay times
图 2 不同腐朽时间后木材的弦切面微观结构图片Figure 2. FE-SEM images of samples at tangential section at different decay times![]() 图 3 不同腐朽时间后木材的横切面微观结构图片Figure 3. FE-SEM images of samples at cross section at different decay times
图 3 不同腐朽时间后木材的横切面微观结构图片Figure 3. FE-SEM images of samples at cross section at different decay times![]() 图 4 不同腐朽时间后木材的质量损失率和细胞壁厚度变化Figure 4. Changes in mass loss rate and cell wall thickness of wood samples at different decay times
图 4 不同腐朽时间后木材的质量损失率和细胞壁厚度变化Figure 4. Changes in mass loss rate and cell wall thickness of wood samples at different decay times2.3 化学成分变化分析
腐朽过程中,木材中各组分的变化如表1所示,其对应的FTIR谱图如图5所示。由图5可知:相比于健康材,腐朽10 d后,木材中各特征峰的强度变化较小,质量损失率较低(仅为2.77%),表明褐腐初期木材的降解速度缓慢。由表1可知:此时的质量损失主要来源于抽提物和半纤维素含量的减少,两者的质量损失率分别为47.55%和49.19%。木材中抽提物的绝对含量很少,且成分复杂,除能够被腐朽菌利用外,部分还具有抑菌作用[22],因此其在褐腐初期的变化还有待进一步探讨。由此推测,在腐朽初期,褐腐菌主要降解木材中的半纤维素。随着腐朽时间的延长,木材中综纤维素相对质量分数不断降低,而木质素的相对质量分数有所增加。褐腐20 d时,腐朽材在1 736 cm−1(半纤维素中的乙酰基和羰基的C=O伸缩振动)、1 372 cm−1(纤维素中的C—H变形振动)、897 cm−1(纤维素中的C—H变形振动)和810 cm−1(半纤维素中的葡甘露聚糖)[23-26]处的峰强开始明显降低,表明木材中的碳水化合物发生了严重的降解。碳源作为营养物质被真菌代谢,以及大分子解聚导致3 342 cm−1(纤维素中的O—H伸缩振动)和2 860 cm−1(对称CH2的伸缩振动)[27]处的峰强增加。此时,半纤维素的质量损失率高达85.88%,而纤维素质量分数仅下降了3.54%。相反,木质素特征峰的强度显著增加,如1 510 cm−1(芳环的C=C骨架振动)、1 225 cm−1(C—O伸缩振动)处[23-26],此时木质素相对质量分数增加了16.07%。
表 1 不同腐朽时间后木材的质量损失及化学成分变化Table 1. Mass loss and chemical composition of wood samples at different decay times腐朽时间
Decay
time/d质量损失率
Mass loss
rate/%抽提物质量分数
Extract mass
fraction/%木质素质量分数
Lignin mass
fraction/%综纤维素质量分数
Holocellulose mass
fraction/%纤维素质量分数
Cellulose mass
fraction/%半纤维素质量分数
Hemicellulose mass
fraction/%0 0 3.26 28.07 68.67 50.05 18.62 10 2.77 1.71 28.11 60.12 50.66 9.46 20 16.60 2.77 31.29 50.91 48.28 2.63 40 20.35 3.04 32.58 48.91 46.68 2.23 综上可知,腐朽10 ~ 20 d内是褐腐菌定植木材的重要阶段,此时木材的质量急剧降低,其中的半纤维素和纤维素被迅速降解,细胞壁和纹孔的结构发生破坏,为褐腐菌深入木材进行后续降解奠定了基础。
2.4 相对结晶度分析
由化学成分变化分析可知,褐腐初期半纤维素的降解优先于纤维素,且降解程度更加剧烈。尽管纤维素在这一过程中的损失较少,但其结构也发生了不同程度的变化。本研究对腐朽不同时长后,木材中纤维素的晶格间距d200、微晶尺寸Cs、相对结晶度Cr变化进行了表征,结果如表2所示。总体而言,各阶段的腐朽材的(200)晶面均位于22.4°附近(介于22.30° ~ 22.45°之间),说明腐朽过程对纤维素结晶区的影响相对较小。相比于健康材,腐朽材的晶格间距减小,这主要是因为纤维素结晶区外部松散的非晶区域或不完全结晶的物质被脱除,导致剩余的结晶区更加有序地排列[28]。褐腐20 d后,由于半纤维素含量急剧降低,结晶区在氢键作用下紧密靠拢,因而此时晶格间距d200最小(3.962 Å),相对结晶度Cr从原来的38.63%增加到47.02%。结晶度的增加及晶格间距的减小将阻碍褐腐菌的代谢产物渗透进入纤维素结晶区,因此20 d后木材的腐朽降解速率变缓。然而,随着半纤维素的大量脱除,木材中的孔隙结构增多,褐腐菌将以酶降解的方式进一步对木材细胞壁进行破坏[29]。因此,腐朽40 d后,褐腐菌对半纤维素的降解速度减缓,逐步开始降解纤维素,因而导致其相对结晶度有所降低(降低为44.21%),晶格间距逐渐变大(3.972 Å)。此外,在腐朽过程中,由于微纤丝的不断聚集,使得其微晶尺寸逐渐增加。
表 2 不同腐朽时间后木材的微晶尺寸和相对结晶度变化Table 2. Changes in crystallite sizes and relative crystallinity of wood samples at different decay times腐朽时间
Decay
time/d2θ/(°) 晶格间距
Lattice distance
(d200)/Å微晶尺寸
Crystallite size
(Cs)/Å相对结晶度
Relative crystallinity
(Cr)/%0 22.31 3.982 75.29 38.63 10 22.33 3.979 78.97 39.61 20 22.42 3.962 80.79 47.02 40 22.37 3.972 81.93 44.21 3. 结 论
本研究主要聚焦于褐腐初期阶段,通过表征南方松边材内部的化学成分变化及宏观、微观结构变化等,阐明褐腐菌进入木材内部的路径及初步降解进程,得出以下结论:
(1)木材腐朽后表面颜色有偏红褐色的趋势。
(2)菌丝通过横向排列的射线薄壁细胞和轴向排列的管胞进入木材,并穿透细胞壁上的纹孔膜,从而抵达木材内部的细胞腔,并于20 d时基本完成初期定植;此时木材的质量损失速率增速最大,同时细胞壁S2层发生严重降解,细胞壁厚度损失率达到18.24%。
(3)腐朽初期,木材细胞壁中的半纤维素最先发生降解,木质素的相对含量增加。对于褐腐初期尚未发生显著降解的纤维素而言,其结晶结构发生变化;褐腐20 d时,纤维素的晶格间距最小,相对结晶度最大,可能会阻碍褐腐菌代谢产物对纤维素的分解。
-
![]()
图 2 3种情景下7月份水面范围与水深分布
Figure 2. Water depth distribution under three scenarios in July
![]()
图 3 3种情景下研究河段平均水面高度分布
Figure 3. Average water surface height distribution under three scenarios
![]()
图 4 3种情景下研究河段7月份流速分布
Figure 4. Velocity distribution and Max. velocity under three scenarios
![]()
图 6 不同期洪水脉冲流量下水面范围及水深分布
Figure 6. Water depth distribution under different pulse flow discharges
![]()
图 7 不同期洪水脉冲流量下研究河段平均水面高度分布
Figure 7. Average water surface height distribution under different pulse flow discharges
![]()
图 8 不同洪水脉冲流量下流速分布
Figure 8. Velocity distribution under different pulse flow discharges
表 1 Tennant法中河流水生栖息地状态与年平均流量关系
Table 1 Ecological flow of the study area relations between aquatic habitat condition and mean annual flow described by the Tennant method for river
水生栖息地状态
Aquatic habitat condition for river4—9月年平均
流量百分比
Percentage of mean annual flow from
April to September/%10月—次年3月年
平均流量百分比
Percentage of mean annual flow
from October to March/%脉冲/最大
Flushing flow/Max.200 200 最佳范围
Optimum range60 ~ 100 60 ~ 100 极好 Outstanding 60 40 好 Excellent 50 30 较好 Good 40 20 一般 Fair 30 10 较差 Poor 10 10 严重退化
Severe degradation< 10 < 10  下载: 导出CSV
表 2 研究区生态流量计算结果
Table 2 Ecological flow of the study area
栖息地状态
Aquatic habitat condition各月份生态流量值 Monthly ecological flow/(m3·s−1) 总量/亿m3
Total discharge/
108 m31月
Jan.2月
Feb.3月
Mar.4月
Apr.5月
May6月
Jun.7月
Jul.8月
Aug.9月
Sep.10月
Oct.11月
Nov.12月
Dec.极好 Outstanding 7.04 7.82 28.24 23.80 8.97 17.12 78.85 56.36 31.07 13.78 10.23 8.03 7.72 好 Excellent 5.28 5.87 21.18 19.83 7.48 14.27 65.71 46.97 25.90 10.33 7.67 6.02 6.27 较好 Good 3.52 3.91 14.12 15.86 5.98 11.42 52.56 37.57 20.72 6.89 5.11 4.01 4.81 一般 Fair 1.76 1.96 7.06 11.90 4.49 8.56 39.42 28.18 15.54 3.44 2.56 2.01 3.36 较差 Poor 1.76 1.96 7.06 3.97 1.50 2.85 13.14 9.39 5.18 3.44 2.56 2.01 1.45 月平均流量(1920—1951年)
Mean monthly flow (1920−1951)17.59 19.56 70.61 39.66 14.95 28.54 131.41 93.93 51.79 34.44 25.57 20.07 14.53
下载: 导出CSV
表 3 模拟流量输入设定
Table 3 Flow discharge inputs for simulations
模拟情景 Simulation scenario 流量设定 Flow discharge input 长期模拟
Lomg-term modeling好状态对应流量 Discharge of excellent condition 丰水期50%,枯水期30% 50% in wet season, 30% in dry season 一般状态对应流量 Discharge of fair condition 丰水期30%,枯水期10% 30% in wet season, 10% in dry season 较差状态对应流量 Discharge of poor condition 丰水期10%,枯水期10% 10% in wet season, 10% in dry season 短期模拟
Short-term modeling1年一遇 1-year return period flood 130 m3/s 2年一遇 2-year return period flood 190 m3/s 3年一遇 3-year return period flood 380 m3/s 5年一遇 5-year return period flood 820 m3/s
下载: 导出CSV
表 4 3种情景下研究区水面面积
Table 4 Water surface area under the three scenarios
水面面积/hm2
Water surface area/haS1
(好 Excellent)S2
(一般 Fair)S3
(较差 Poor)全年平均水面面积
Annual average water
surface area439.35 439.29 462.74 最大水面面积
Max. water surface area531.70 518.92 501.82 最小水面面积
Min. water surface area404.37 414.20 442.06 差值 Difference 127.33 104.72 59.76
下载: 导出CSV
表 5 3种情景下河流动态变化过程中发生侵蚀、沉积的范围 hm2
Table 5 Erosion and deposition areas in the three scenarios
ha 项目
ItemS1
(好 Excellent)S2
(一般Fair)S3
(较差 Poor)侵蚀区域 Erosion area 77.94 65.91 52.18 沉积区域 Deposition area 101.39 86.52 61.70
下载: 导出CSV
表 6 不同洪水脉冲流量下研究区水面面积分布统计
Table 6 Wetted area under different pulse flow discharges
项目
Item1年一遇
1-year return period2年一遇
2-year return period3年一遇
3-year return period5年一遇
5-year return period水面面积/hm2 Water surface area/ha 637.58 651.58 705.38 769.25
下载: 导出CSV
表 7 流速及护岸材质类型
Table 7 Channel velocity and suggested bank materials
流速 Flow velocity/(m·s−1) 护岸类型 Riverbank type 备注 Note < 0.5 自然状态 Natural bank 种植各类湿生植物均可 Planted with riparian vegetation 1 草坪、芦苇等 Grasses and reeds, etc 覆盖率70%以上 > 70% coverage 2 草坪及灌木 Grasses and shrubs 耐水湿灌木 Riparian shrubs 3 生态袋等柔性材料 Biodegradable geotextiles 生态袋、抛石等 Geotextile erosion control bags or stone 4 石笼、竹笼等 Stone or bamboo cages, etc 可种植灌木 Resprouting shrubs > 5 硬质护岸 Concrete revetments 混凝土坡框较好 Concrete frame 注:此表引自参考文献[38]。Note: this table is cited from reference [38].
下载: 导出CSV
-
[1] Belletti B, Nardi L, Rinaldi M, et al. Assessing restoration effects on river hydromorphology using the process-based morphological quality index in eight European river reaches[J]. Environmental Management, 2018, 61: 69−84.
[2] 王文君, 黄道明. 国内外河流生态修复研究进展[J]. 水生态学杂志, 2012, 33 (4):142−146. Wang W J, Huang D M. Research progress of river restoration research at home and abroad[J]. Journal of Hydroecology, 2012, 33 (4): 142−146.
[3] Sear D A. River restoration and geomorphology[J]. Aquatic Conservation: Marine and Freshwater Ecosystems, 1994, 4: 169−177. doi: 10.1002/aqc.3270040207
[4] Karr J R. Defining and measuring river health[J]. Freshwater Biology, 1999, 41(2): 221−234. doi: 10.1046/j.1365-2427.1999.00427.x
[5] Vietz G J, Finlayson B L. Geomorphological effects of flow alteration on rivers[M]//Horne A C, Webb J A, Stewardson M J, et al. Water for the environment: from policy and science to implementation and management. New York: Academic Press, 2017: 83−100.
[6] Poff N L, Allan J D, Bain M B, et al. The natural flow regime[J]. BioScience, 1997, 47: 769−784. doi: 10.2307/1313099
[7] Molnar P, Burlando P, Wolfgang R. Integrated catchment assessment of riverine landscape dynamics[J]. Aquatic Sciences, 2002, 64: 129−140. doi: 10.1007/s00027-002-8061-1
[8] Poff N L, Richter B D, Arthington A H, et al. The ecological limits of hydrologic alteration (ELOHA): a new framework for developing regional environmental flow standards[J]. Freshwater Biology, 2010, 55(1): 147−170. doi: 10.1111/j.1365-2427.2009.02204.x
[9] Lytle D H, Poff N L. Adaptation to natural flow regimes[J]. Trends in Ecology and Evolution, 2004, 19: 94−100. doi: 10.1016/j.tree.2003.10.002
[10] Richter B D, Thomas G A. Restoring environmental flows by modifying dam operations[J]. Ecology and Society, 2007, 12(1): 12. doi: 10.5751/ES-02014-120112
[11] Arthington A H, Naiman R J, McClain M E, et al. Preserving the biodiversity and ecological services of rivers: new challenges and research opportunities[J]. Freshwater Biology, 2010, 55(1): 1−16. doi: 10.1111/j.1365-2427.2009.02340.x
[12] 张君伟, 万超, 杜志国, 等. 永定河生态用水保障机制研究[J]. 北京水务, 2020(5):1−4. Zhang J W, Wan C, Du Z G, et al. Study on the protection mechanism of ecological water usage of Yongding River[J]. Beijing Water, 2020(5): 1−4.
[13] 董哲仁, 孙东亚, 王俊娜, 等. 河流生态学相关交叉学科进展[J]. 水利水电技术, 2009, 40(8):36−43. doi: 10.3969/j.issn.1000-0860.2009.08.010 Dong Z R, Sun D Y, Wang J N, et al. Progresses of interdisciplines to river ecology[J]. Water Resources and Hydropower Engineering, 2009, 40(8): 36−43. doi: 10.3969/j.issn.1000-0860.2009.08.010
[14] 董哲仁, 张晶, 赵进勇. 环境流理论进展述评[J]. 水利学报, 2017, 48(6):670−677. Dong Z R, Zhang J, Zhao J Y. Comments upon progress of environmental flows assessments[J]. Journal of Hydraulic Engineering, 2017, 48(6): 670−677.
[15] 杨志峰, 崔保山, 孙涛, 等. 湿地生态需水机理、模型和配置[M]. 北京: 科学出版社, 2012. Yang Z F, Cui B S, Sun T, et al. Mechanism, model and allocation of ecological water requirement for wetlands[M]. Beijing: Science Press, 2012.
[16] Tharme R E. A global perspective on environmental flow assessment: emerging trends in the development and application of environmental flow methodologies for rivers[J]. River Research and Applications, 2003, 19(5−6): 397−441. doi: 10.1002/rra.736
[17] Tennant D L. Instream flow regimens for fish, wildlife, recreation and related environmental resources[J]. Fisheries, 1976, 1(4): 6−10. doi: 10.1577/1548-8446(1976)001<0006:IFRFFW>2.0.CO;2
[18] Mosley M P. Flow requirements for recreation and wildlife in New Zealand rivers: a review[J]. Journal of Hydrology, 1983, 22(2): 152−174.
[19] 吕孙云, 许银山, 兰岚, 等. 基于优化-模拟技术的生态库容研究[J]. 水科学进展, 2013, 24(3):402−409. Lü S Y, Xu Y S, Lan L, et al. Study of ecological storage based on optimization simulation technique[J]. Advances in Water Science, 2013, 24(3): 402−409.
[20] 雍婷, 许银山, 梅亚东. 基于生态流量要求的调度图优化及生态库容研究[J]. 水力发电学报, 2013, 32(1):89−95. Yong T, Xu Y S, Mei Y D. Study on optimization of operation curve and ecological storage based on ecological flow demand[J]. Journal of Hydroelectric Engineering, 2013, 32(1): 89−95.
[21] 张士锋, 刘晓菲, 李瑞, 等. 永定河北京段生态需水量研究[J/OL]. 水资源研究, 2016(2): 108−119 [2020−03−03]. http://qikan.cqvip.com/Qikan/Article/Detail?id=668952103. Zhang S F, Liu X F, Li R, et al. Study on environmental flow in Beijing section of Yongding River [J/OL]. Journal of Water Resources Research, 2016 (2): 108−119 [2020−03−03]. http://qikan.cqvip.com/Qikan/Article/Detail?id=668952103.
[22] 顾斌杰, 王富世, 宋磊, 等. 永定河官厅山峡生态需水量计算及配置方案研究[J]. 北京水务, 2017(2):12−18. doi: 10.3969/j.issn.1673-4637.2017.02.004 Gu B J, Wang F S, Song L, et al. Calculation and configuration of ecological water requirements for Yongding River Guanting Gorge[J]. Beijing Water, 2017(2): 12−18. doi: 10.3969/j.issn.1673-4637.2017.02.004
[23] Li C W, Kang L. A new modified Tennant method with spatial-temporal variability[J]. Water Resource Management, 2014, 28: 4911−4926. doi: 10.1007/s11269-014-0746-4
[24] 董哲仁, 张晶, 赵进勇. 生态流量的科学内涵[J]. 中国水利, 2020(15):15−19. doi: 10.3969/j.issn.1000-1123.2020.15.007 Dong Z R, Zhang J, Zhao J Y. Scientific connotation of ecological flow[J]. China Water Resources, 2020(15): 15−19. doi: 10.3969/j.issn.1000-1123.2020.15.007
[25] 中央人民政府水利部水文局. 华北区水文资料海河流域永定河水系水位、气象(1912—1949年)[R]. 北京: 中央人民政府水利部水文局, 1954. Ministry of Water Resources Hydrographic Office of Central People’s Government. Water level and weather hydrological data in 1912−1949 of Yongding River System in Haihe River Basin[R]. Beijing: Ministry of Water Resource Hydrographic office of Central People’s Government, 1954.
[26] 中央人民政府水利部水文局. 华北区水文资料海河流域永定河水系流量、含沙量(1918—1949)[R]. 北京: 中央人民政府水利部水文局, 1954. Ministry of Water Resources Hydrographic Office of Central People’s Government. Flow and sediment concentration data in 1918−1949 of Yongding River System in Haihe River Basin[R]. Beijing: Ministry of Water Resource Hydrographic Office of Central People’s Government, 1954.
[27] Junk W J, Bayley P B, Sparks R E. The flood pulse concept in river-floodplain systems[J]. Canadian Journal of Fisheries and Aquatic Sciences, 1989, 106: 110−127.
[28] Death R G, Fuller I C, Macklin M G. Resetting the river template: the potential for climate-related extreme floods to transform river geomorphology and ecology[J]. Freshwater Biology, 2015, 60(12): 2477−2496. doi: 10.1111/fwb.12639
[29] Talbot C J, Bennett E M, Cassell K, et al. The impact of flooding on aquatic ecosystem services[J]. Biogeochemistry, 2018, 141: 439−461. doi: 10.1007/s10533-018-0449-7
[30] 潘安君. 永定河“以水开路、用水引路”生态补水探索[J]. 北京水务, 2020(3):1−3. Pan A J. Ecological water replenishment in Yongding River[J]. Beijing Water, 2020(3): 1−3.
[31] Coulthard T J, Hicks D M, van de Wiel M J. Cellular modelling of river catchments and reaches: advantages, limitations and prospects[J]. Geomorphology, 2007, 90: 192−207. doi: 10.1016/j.geomorph.2006.10.030
[32] Coulthard T J, Neal J C, Bates P D, et al. Integrating the LISFLOOD-FP 2D hydrodynamic model with the CAESAR model implications for modelling landscape evolution[J]. Earth Surface Processes and Landform, 2013, 38(15): 1897−1906. doi: 10.1002/esp.3478
[33] Coulthard T J, van de Wiel M J. Quantifying fluvial non linearity and finding self organized criticality? Insights from simulations of river basin evolution[J]. Geomorphology, 2007, 91(3−4): 216−235. doi: 10.1016/j.geomorph.2007.04.011
[34] 谢军, 汪明, 刘凯. 震后极端降雨下流域产沙及物质运移规律模拟: 以四川省洪溪河流域为例[J]. 水土保持研究, 2019, 26(1):1−7. Xie J, Wang M, Liu K. Material migration patterns of basin after earthquake under extreme rainfall: a case study on Hongxi Basin of Sichuan Province[J]. Research of Soil and Water Conservation, 2019, 26(1): 1−7.
[35] Coulthard T J, Macklin M G, Kirkby M J. A cellular model of Holocene upland river basin and alluvial fan evolution[J]. Earth Surface Processes and Landforms, 2002, 27: 269−288. doi: 10.1002/esp.318
[36] van de Wiel M J, Coulthard T J, Macklin M G, et al. Embedding reach-scale fluvial dynamics within the CAESAR cellular automaton landscape evolution model[J]. Geomorphology, 2007, 90: 283−301. doi: 10.1016/j.geomorph.2006.10.024
[37] Beechie T J, Sear D A, Olden J D, et al. Process-based principles for restoring river ecosystems[J]. BioScience, 2010, 60(3): 209−222. doi: 10.1525/bio.2010.60.3.7
[38] 刘毅, 朱晨东, 李其军. 生态型河流护岸工程指南[Z]. 日本河边整备中心(北京水利协会内部资料), 2003: 31. Liu Y, Zhu C D, Li Q J. Guidelines for ecological riverbank engineering[Z]. Japan River Restoration Center (internal files of Beijing Hydraulic Engineering Society), 2003: 31.
-
期刊类型引用(2)
1. 李建建,贺宸靖,黄小平,向太和. 植物长链非编码RNA调控发育与胁迫应答的研究进展. 生物技术通报. 2023(01): 48-58 .  百度学术
百度学术
2. 黄杰,陈勇,高日芳,毛莹莹,郑柏艳,张帆涛,谢建坤. 长链非编码RNA:与植物发育和胁迫响应相关的新型调控因子. 江西师范大学学报(自然科学版). 2023(06): 615-625 . 百度学术
其他类型引用(3)


计量
- 文章访问数: 1947
- HTML全文浏览量: 590
- PDF下载量: 127
- 被引次数: 5
