
Effects of micro scale underlying surface type and pattern of urban residential area on microclimate: taking Beijing as a case study
-
摘要:目的 城市人居环境中小微尺度是人们日常使用最频繁的基本空间尺度。探究小微尺度下垫面类型及其格局特征对环境微气候的影响机制,是借助风景园林规划设计改善城市热环境的理论基础。方法 本研究基于实地测量,针对城市居住区绿地不同类型下垫面日均空气温度、湿度的差异,以及小微尺度下垫面格局对环境微气候的影响开展定量研究。结果 四季7种下垫面类型的日均温度、湿度均存在显著差异,且7种下垫面类型的排序有季节性变化。高郁闭度植被、水体与中郁闭度植被的降温、增湿效应明显。借助景观格局指数量化不同类型下垫面的格局特征。景观指数与日均温度、湿度的相关性随不同季节而变化。各类下垫面的面积占比、斑块面积是影响小微尺度环境温度、湿度的关键格局特征,破碎度与聚集度也有一定影响。结论 未来进行热舒适型小微尺度户外空间设计时,提高高郁闭度与中郁闭度植被的面积占比和斑块面积,控制其破碎程度,采用聚集式布局形式可有效提高环境相对湿度,降低空气温度。同时应避免配置成片的硬质铺装(占比率高,面积大,分布聚集),降低其热调节负效应。Abstract:Objective The micro-scale environment is a very important human-scale outdoor space unit. Exploring the influence mechanism of micro-scale underlying surface type and pattern on microclimate is the theoretical basis of improving urban thermal environment with the help of landscape design strategies.Method Through field measurements, differences of daily air temperature (AT) and relative humidity (RH) among seven typical underlying surface types of urban residential green space, and correlations between daily AT and RH and various micro-scale underlying surface patterns as explained by landscape metrics were analyzed.Result During the four seasons, there were various differences in daily AT and RH among the seven underlying surface types, and the order of seven types varied seasonally. Overall, high canopy-density vegetation and water body type always had prominent cooling and humidifying effects, whereas highest AT and lowest RH were always found in pavement type. Correlations between landscape metrics and daily AT and RH varied by season. Metrics reflecting the dominance and distribution of underlying surface classifications had closer relationships with microclimate level in the micro-scale environment. The proportion and average patch area of underlying surface classifications were the critical pattern characteristics affecting the daily AT and RH. And the fragmentation and aggregation also had certain influence.Conclusion When designing micro-scale thermal comfort outdoor space, increasing the proportion and patch area of high and moderate canopy-density vegetation, controlling the fragmentation and adopting aggregating layout can significantly reduce AT and increase RH. The impervious pavement with high proportion, large area and concentrated distribution should be avoided to reduce its thermal regulation negative effect.
-
传统的树种分类主要根据形态学差异、杂交亲和力以及地理分布等特征开展[1]。但树木种群内极易发生变异,以及现在的人工杂交种众多,仅根据形态学特征进行分类已不能完全满足需要[2-4]。20世纪中叶,分子进化学被提出,这为生物进化的研究提供更可靠的方法。从核酸和蛋白序列比对分析生物进化原因和进化机制,可以更深层次探究生物进化的原因和关系,比较转录组、分子标记以及单基因克隆技术等都在植物分类和进化研究中被大量采用[5-10]。在转录组学中的应用主要是通过搜索和比较不同物种的同源基因,分析氨基酸或核苷酸替换数(Ka:非同义替换,Ks:同义替换)的差异,并建立不同物种间系统进化树,以分析各物种的进化地位[11]。但由于技术的限制,之前基于二代测序获取的序列读长较短,且拼接过程容易发生错误,很难准确预测直系同源基因全长。随着三代全长转录组测序技术的发展,这一问题迎刃而解,为不同物种进化分析提供了更完整和准确的序列[12-14]。
相对于比较转录组,通过克隆较短的DNA片段以比较物种的基因变异,具有高效快速等特点,被广泛用于鉴定物种亲缘关系。这种亲缘鉴定可分为核DNA(nrDNA)和叶绿体DNA(cpDNA)2种方法。cpDNA属于单亲遗传,研究cpDNA的变化可以反映种内和种间的差异,被前人广泛应用于物种亲缘鉴定[15],但cpDNA不能反映种间杂交和基因渐渗问题。而nrDNA进化速率较快,会发生基因重组,分析nrDNA可以探索物种内和物种间的基因传递,在物种分化和物种系统发育上也被广泛应用[16-18]。因此,结合nrDNA和cpDNA同时分析物种亲缘将提供更可靠的信息。
杨树(Populus spp.)作为林木研究的模式植物,具有生长快、适应性强、用途广等特点,被世界许多国家和地区广泛引种栽培,是人工用材林的重要树种[19]。我国具有丰富的杨树种质资源,有许多种为中国所特有,充分挖掘、开发和利用这些杨树资源,对培育杨树优良新品种具有重要意义。作为我国热带唯一的杨树树种,琼岛杨(P. qiongdaoensis)具有对热带高温高湿等不利于杨树生存环境的适应性[20]。了解物种的起源对于物种的适应性机制的挖掘及新品种的筛选和培育具有重要作用。因此,本研究基于琼岛杨对高温环境的独特适应性,通过高温胁迫处理,采用单分子实时和高通量测序技术比较了琼岛杨、加杨(P. canadensis)和小叶杨(P. simonii)的转录组差异,筛选直系同源基因,并结合nrDNA和cpDNA分析了琼岛杨与其他树种的亲缘关系及进化地位,为抗高温杨树新品种的开发及培育奠定了基础。
1. 材料与方法
1.1 试验材料
研究使用的加杨、琼岛杨和小叶杨幼苗被种植于海南大学的同一温室大棚中。筛选生长一致的幼苗用于对照组和热胁迫处理(40 ℃,1 h),然后收集它们的叶片进行RNA提取及质量检测,通过PacBio Sequel II系统测序获得了三代全长转录组序列,转录组数据已保存在中国科学院北京基因组研究所大数据中心(登录号:CRA002150,CRA002154和CRA002160)[21-23]。20个琼岛杨植株叶片采自其自然分布区域海南省白沙县黎族自治区青松乡。
1.2 DNA提取,PCR扩增及测序
DNA的提取采用传统CTAB法[24]。应用25 μL DNA聚合酶链式反应(PCR)体系,加入琼岛杨DNA 1 μL,正反向引物各1 μL(表1),引物序列来自之前的研究[25-27]、12.5 μL 2 × Taq PCR masterMix(购自TIANGEN公司)、9.5 μL ddH2O于94 ℃预变性3 min,94 ℃变性30 s, 55 ℃退火30 s,72 ℃延伸1 min,35个循环,最后72 ℃延伸5 min,4 ℃保存。PCR产物回收使用DNA纯化回收试剂盒(购自TIANGEN公司),然后送至广州天一辉公司使用Sanger法进行测序。
表 1 琼岛杨扩增序列引物信息Table 1. Amplified sequence primer information of P. qiongdaoensis基因名称
Gene name引物名称
Primer name引物序列
Primer sequenceUDP-SQ DSH3 F: TCTGCTTTCCACTTCTTGC DSH3 R: CATACTCTCCCATTGTCCC POPTRDRAFT_
575699DSH6 F: GCCTCCTGATTATTATGC DSH6 R: TATTACAAGCCCTTCCAG trnF trnL-trnF F: CGAAATTGGTAGACGCTACG trnL-trnF R: ATTTGAACTGGTGACACGAG atpⅠ atpⅠ-atpH F: CCAACCCAGCAGCAATAAC atpⅠ-atpH R: TATTTACAAGTGGTATTCAAGCT 1.3 转录本的注释及CDS预测
使用BLAST搜索NT数据库(e ≤ 10−10)[28-29]。使用Diamond BLASTX搜索NR、KOG、Swiss-Prot、GO和KEGG数据库(e ≤ 10−10)[30-34]。使用Hmmscan分析Pfam数据库[35]。
1.4 推定直系同源基因组中Ka/Ks值的估算
ANGEL软件被用来确定cDNA的蛋白编码序列(CDS),默认采用该软件容错模式。运用OrthoMCL算法对CDS序列进行直系同源基因识别和筛选[36]。采用paml-codeml计算Ks、Ka和Ka/Ks。利用公式T = K/2r估算杨树的分化时间[37],其中,K为遗传分歧,用Ks的平均值表示,r为双子叶植物同义替代率的平均值,为1.5 × 10−8年/位点[38-39]。
1.5 nrDNA和cpDNA基因序列获得与分析
克隆了20株琼岛杨和1株加杨的4个基因序列:糖生物合成酶(UDP-SQ)、POPTRDRAFT_575699、tRNA-Phe(trnF)和ATP合酶CF0A亚基(atpⅠ)基因,并结合从NCBI下载的5个杨树组(15个树种)和1个类外群组(3个树种)的4个基因序列进行分析(表2)。运用BioEdit V7.0.9软件对各基因序列进行多重比较、校对、剪切及拼接,并且对nrDNA的UDP-SQ和POPTRDRAFT_575699,以及cpDNA的trnF和atpⅠ序列进行组合[18]。然后使用MEGA 7.0对琼岛杨各基因及nrDNA和cpDNA组合的种内及种间遗传距离进行计算,分析各基因G+C平均含量、并使用最大似然法(maximum likelihood)和最小进化法(minimum evolution)构建系统发育树[3, 40]。
表 2 NCBI数据库获取的基因序列Table 2. Gene sequences obtained from NCBI database物种名称
Species name序列编号 GenBank atpⅠ trnF UDP-SQ POPTRDRAFT_575699 琼岛杨 Populus qiongdaoensis MW389752 ~ MW389771 MW389731 ~ MW389750 MW389689 ~ MW389708 MW389710 ~ MW389729 山杨 P. davidiana KF941071 KF940742 KF940382 KF940143 毛白杨 P. tomentosa KF941073 KF940744 KF940384 KF940145 响叶杨 P. adenopoda KF941089 KF940760 KF940400 KF940150 大叶杨 P. lasiocarpa KF941086 KF940757 KF940397 KF940158 异叶杨 P. heterophylla KX454634 KX454606 KX417462 KX417432 椅杨 P. wilsonii KX454638 KX454610 KX417466 KX417436 小叶杨 P. simonii KF941080 KF940751 KF940391 KF940152 苦杨 P. laurifolia KF941083 KF940754 KF940394 KF940155 毛果杨 P. trichocarpa KF941091 KF940762 KF940402 KF940163 加杨 P. canadensis MW389772 MW389751 MW389709 MW389730 黑杨 P. nigra KF941087 KF940758 KF940398 KF940159 阿富汗杨 P. afghanica KF941088 KF940759 KF940399 KF940160 美洲黑杨 P. deltoides KF941099 KF940770 KF940410 KF940171 灰胡杨 P. pruinosa KF941092 KF940763 KF940403 KF940164 胡杨 P. euphratica KF941096 KF940767 KF940407 KF940168 冬青叶杨 P. ilicifolia KX454633 KX454605 KX417461 KX417431 三蕊柳 Salix triandra KF941097 KF940768 KF940408 KF940169 钻天柳 S. arbutifolia KF941094 KF940765 KF940405 KF940166 大黄柳 S. raddeana KF941095 KF940766 KF940406 KF940167 2. 结果与分析
2.1 杨树基因注释
转录组测序分别获取了101 791、88 161和66 657个小叶杨、琼岛杨和加杨的全长转录本,平均长度分别为2 400、2 435和2 336 bp。加杨、琼岛杨和小叶杨分别有33 840、39 343和45 217个基因被注释,占比分别为50.77%、44.63%和44.42%(表3)。我们分别从3种杨树中随机选取1 000个转录本在NR数据库中比对,图1显示琼岛杨与毛果杨(P. trichocarpa)的比对率最高(53.38%),然后依次是胡杨(P. euphratica,22.63%)、毛白杨(P. tomentosa,2.84%)。加杨和小叶杨在毛果杨中的比对率也是最高,分别为59.48%和60.59%。
表 3 转录组数据注释结果Table 3. Annotation of transcriptome data注释数据库
Annotation database加杨
P. canadensis琼岛杨
P. qiongdaoensis小叶杨
P. simoniiNt 33 530 (50.30%) 38 920 (44.15%) 44 886 (44.10%) Nr 33 035 (49.56%) 38 338 (43.49%) 44 366 (43.59%) KEGG 32 611 (48.92%) 37 898 (42.99%) 43 820 (43.05%) Swiss-Prot 28 388 (42.59%) 32 860 (37.27%) 38 210 (37.54%) GO 22 121 (33.19%) 25 472 (28.89%) 30 206 (29.67%) Pfam 22 121 (33.19%) 25 472 (28.89%) 30 206 (29.67%) KOG 21 311 (31.97%) 24 422 (27.70%) 28 118 (27.62%) 合计 Total 33 840 (44.42%) 39 343 (44.63%) 45 217 (50.77%) ![]() 图 1 琼岛杨转录本在Nr数据库中的物种分布图Figure 1. Species distribution diagram of P. qiongdaoensis in Nr database
图 1 琼岛杨转录本在Nr数据库中的物种分布图Figure 1. Species distribution diagram of P. qiongdaoensis in Nr database2.2 琼岛杨与其他两种杨树基因功能分类及直系同源基因分析
GO功能注释显示加杨、琼岛杨和小叶杨分别富集到257、322和216个功能组,3种杨树的生物过程富集的基因最多,多为代谢过程和细胞过程。琼岛杨与其他2种杨树基因的GO功能分类结果相差较大,琼岛杨与加杨中仅发现2个共同富集的功能组,分别是碳水化合物代谢过程和单一生物碳水化合物的代谢过程。
KEGG通路分析显示3种杨树的基因均参与了121个相同代谢通路,并且3种杨树各代谢通路中的基因占总基因的比例呈现一致性,加杨、琼岛杨和小叶杨中参与内质网中的蛋白质加工的基因最多,分别为834、709和831个基因(图2)。这显示了琼岛杨与其他2种杨树的基因在代谢过程中的功能具有相似性。
![]() 图 2 3种杨树基因功能分类横坐标为3种杨树富集基因最多的前20条KEGG通路。PPER. 内质网中的蛋白质加工;SP. 剪接体;PHST. 植物激素信号转导;RT. RNA转运;SSM. 淀粉和蔗糖代谢;EN. 胞吞;RI. 核糖体;PPI. 植物与病原体的相互作用;GL. 糖酵解/糖异生;MSP. mRNA监测途径;GDM. 乙醛酸和二羧酸酯代谢;OP. 氧化磷酸化;UMP. 泛素介导的蛋白水解;RD. RNA降解;CFPO. 光合生物中的碳固定;PM. 丙酮酸代谢;PE. 过氧化物;PH. 光合作用;PUM. 嘌呤代谢;ASNS. 氨基糖和核苷酸糖代谢。Abscissa is top 20 KEGG pathways with the most enriched genes in three Populus. PPER, protein processing in endoplasmic reticulum; SP, spliceosome; PHST, plant hormone signal transduction; RT, RNA transport; SSM, starch and sucrose metabolism; EN, endocytosis; RI, ribosome; PPI, plant-pathogen interaction; GL, glycolysis/gluconeogenesis; MSP, mRNA surveillance pathway; GDM, glyoxylate and dicarboxylate metabolism; OP, oxidative phosphorylation; UMP, ubiquitin mediated proteolysis; RD, RNA degradation; CFPO, carbon fixation in photosynthetic organisms; PM, pyruvate metabolism; PE, peroxisome; PH, photosynthesis; PUM, purine metabolism; ASNS, amino sugar and nucleotide sugar metabolism.Figure 2. Function classification in three Populus genes
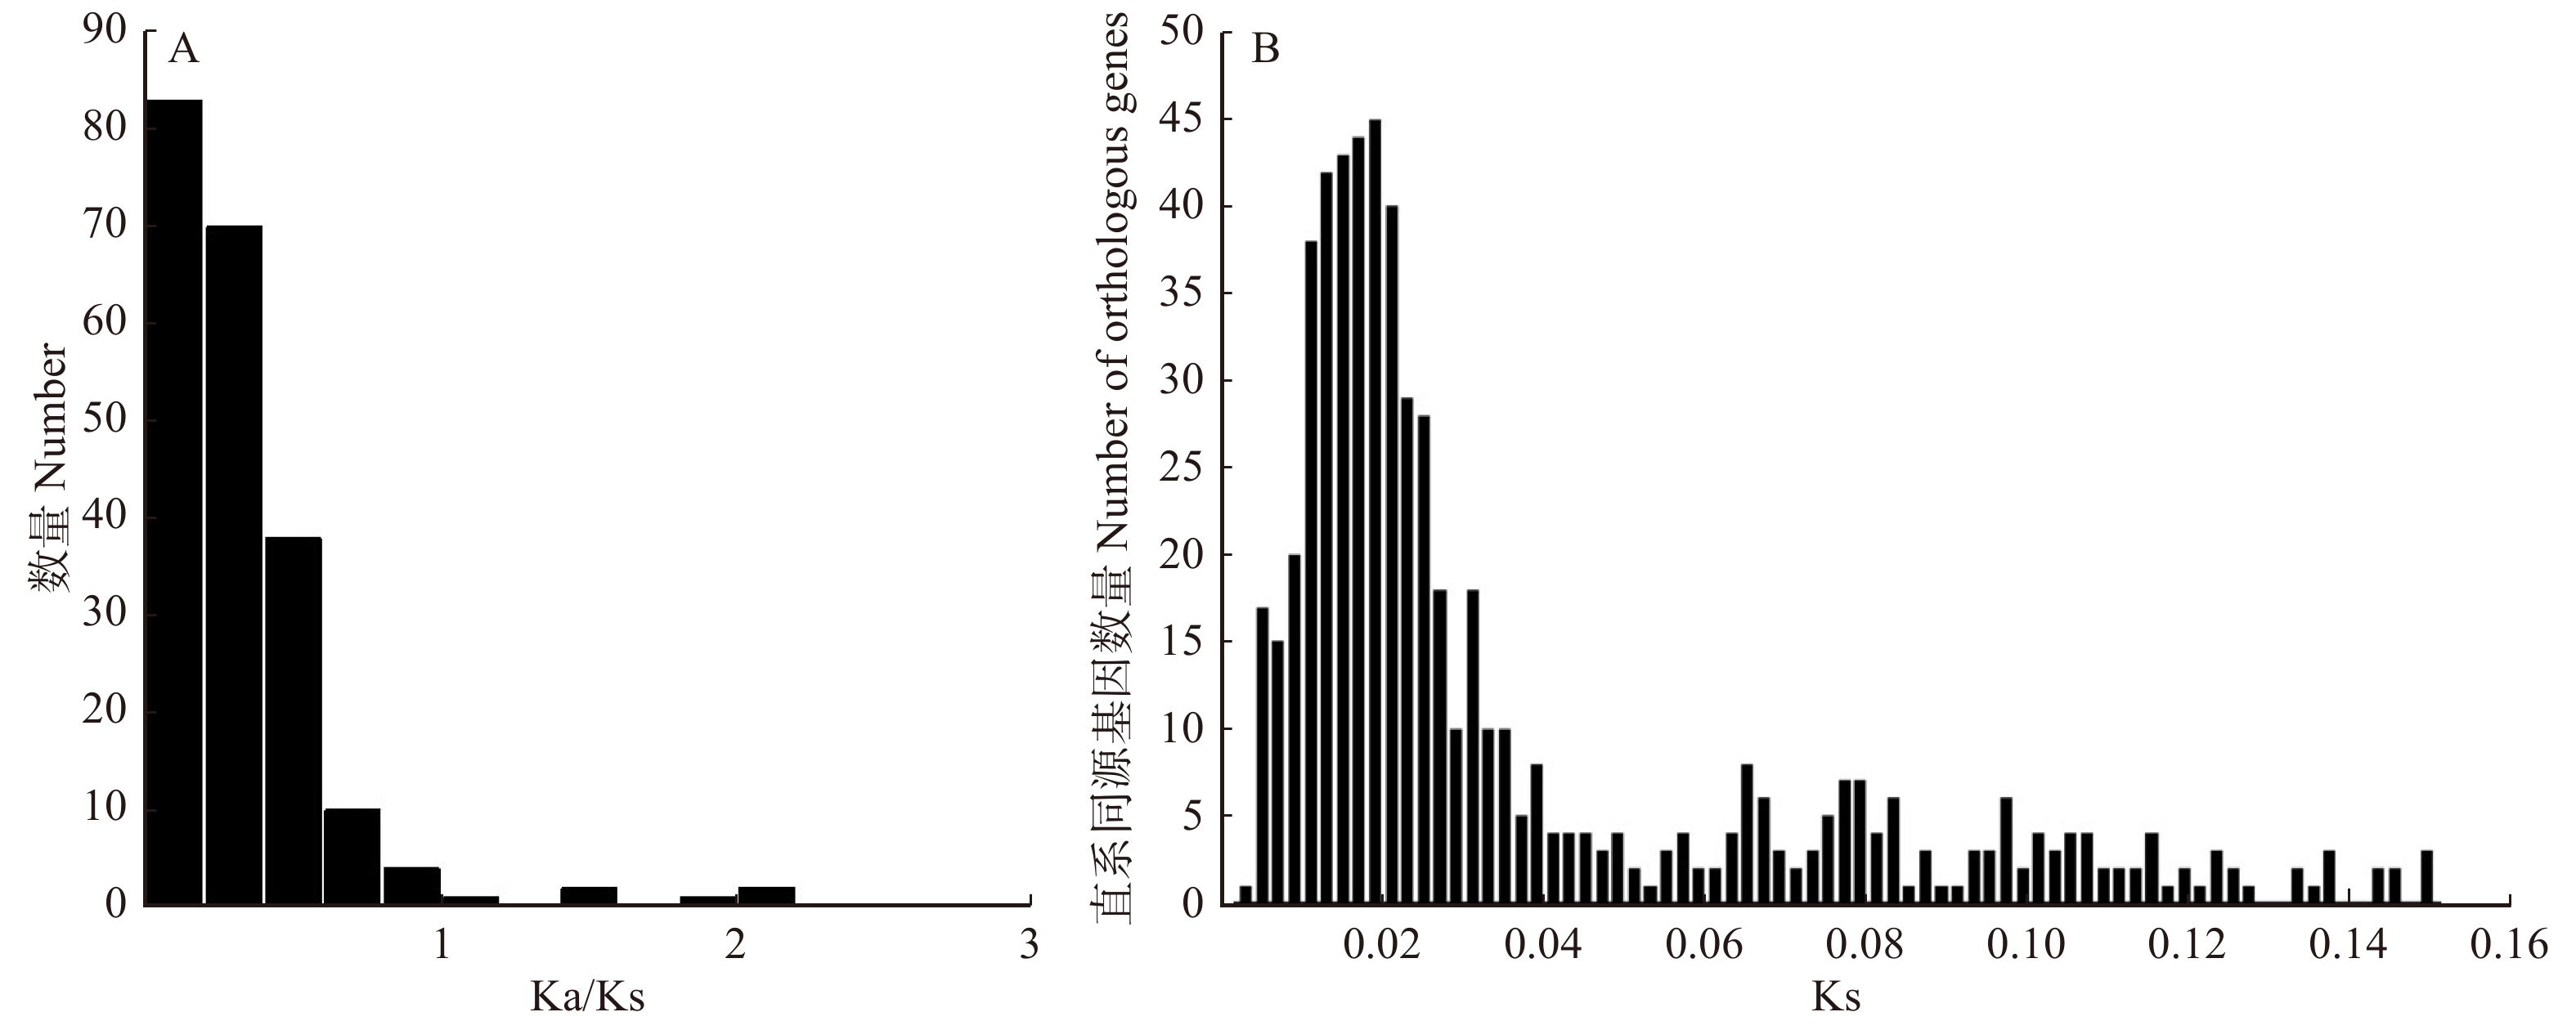
图 2 3种杨树基因功能分类横坐标为3种杨树富集基因最多的前20条KEGG通路。PPER. 内质网中的蛋白质加工;SP. 剪接体;PHST. 植物激素信号转导;RT. RNA转运;SSM. 淀粉和蔗糖代谢;EN. 胞吞;RI. 核糖体;PPI. 植物与病原体的相互作用;GL. 糖酵解/糖异生;MSP. mRNA监测途径;GDM. 乙醛酸和二羧酸酯代谢;OP. 氧化磷酸化;UMP. 泛素介导的蛋白水解;RD. RNA降解;CFPO. 光合生物中的碳固定;PM. 丙酮酸代谢;PE. 过氧化物;PH. 光合作用;PUM. 嘌呤代谢;ASNS. 氨基糖和核苷酸糖代谢。Abscissa is top 20 KEGG pathways with the most enriched genes in three Populus. PPER, protein processing in endoplasmic reticulum; SP, spliceosome; PHST, plant hormone signal transduction; RT, RNA transport; SSM, starch and sucrose metabolism; EN, endocytosis; RI, ribosome; PPI, plant-pathogen interaction; GL, glycolysis/gluconeogenesis; MSP, mRNA surveillance pathway; GDM, glyoxylate and dicarboxylate metabolism; OP, oxidative phosphorylation; UMP, ubiquitin mediated proteolysis; RD, RNA degradation; CFPO, carbon fixation in photosynthetic organisms; PM, pyruvate metabolism; PE, peroxisome; PH, photosynthesis; PUM, purine metabolism; ASNS, amino sugar and nucleotide sugar metabolism.Figure 2. Function classification in three Populus genes加杨、琼岛杨和小叶杨共识别660组直系同源基因,并计算了Ka、Ks和Ka/Ks平均值。如图3A所示,共有18个基因Ka/Ks > 1(2.73%),其中10个基因Ka/Ks > 2,大量基因Ka/Ks < 1(97.27%),这表明大量基因在杨树的进化过程中可能会进行纯化选择。
![]() 图 3 杨树直系同源基因的Ka/Ks (A)及Ks (B)分布图Figure 3. Distribution bar graph of Ka/Ks (A) and Ks (B) of Populus orthologous genes
图 3 杨树直系同源基因的Ka/Ks (A)及Ks (B)分布图Figure 3. Distribution bar graph of Ka/Ks (A) and Ks (B) of Populus orthologous genes660组直系同源基因的Ks平均值为0.150 5,在0.02左右,直系同源基因数量达到峰值(图3B)。基于直系同源基因构建的进化树显示出琼岛杨与其他杨树具有明显差异(图4A),并估计了3种杨树分化时间大概为1.21 百万年前,该时间处于新生代的第四纪的更新世。为了更好的体现琼岛杨与其他杨树的亲缘关系,我们另外结合了毛果杨和簸箕柳(Salix suchowensis)搜索5个树种直系同源基因,共获得220组直系同源基因,并构建了5个物种进化树,图4B显示出毛果杨、加杨和小叶杨被聚为一个分支,琼岛杨和簸箕柳各为一分支。
![]() 图 4 琼岛杨系统进化树A.琼岛杨、加杨和小叶杨直系同源基因进化树;B.琼岛杨、加杨、小叶杨毛果杨和簸箕柳直系同源基因进化树。A, phylogenetic tree of orthologous genes of P. qiongdaoensis, P. canadensis and P. simonii; B, phylogenetic tree of orthologous genes of P. qiongdaoensis, P. canadensis, P. simonii, P. trichocarpa and Salix suchowensis.Figure 4. Phylogenetic tree of P. qiongdaoensis
图 4 琼岛杨系统进化树A.琼岛杨、加杨和小叶杨直系同源基因进化树;B.琼岛杨、加杨、小叶杨毛果杨和簸箕柳直系同源基因进化树。A, phylogenetic tree of orthologous genes of P. qiongdaoensis, P. canadensis and P. simonii; B, phylogenetic tree of orthologous genes of P. qiongdaoensis, P. canadensis, P. simonii, P. trichocarpa and Salix suchowensis.Figure 4. Phylogenetic tree of P. qiongdaoensis2.3 3种杨树直系同源基因差异表达模式分析
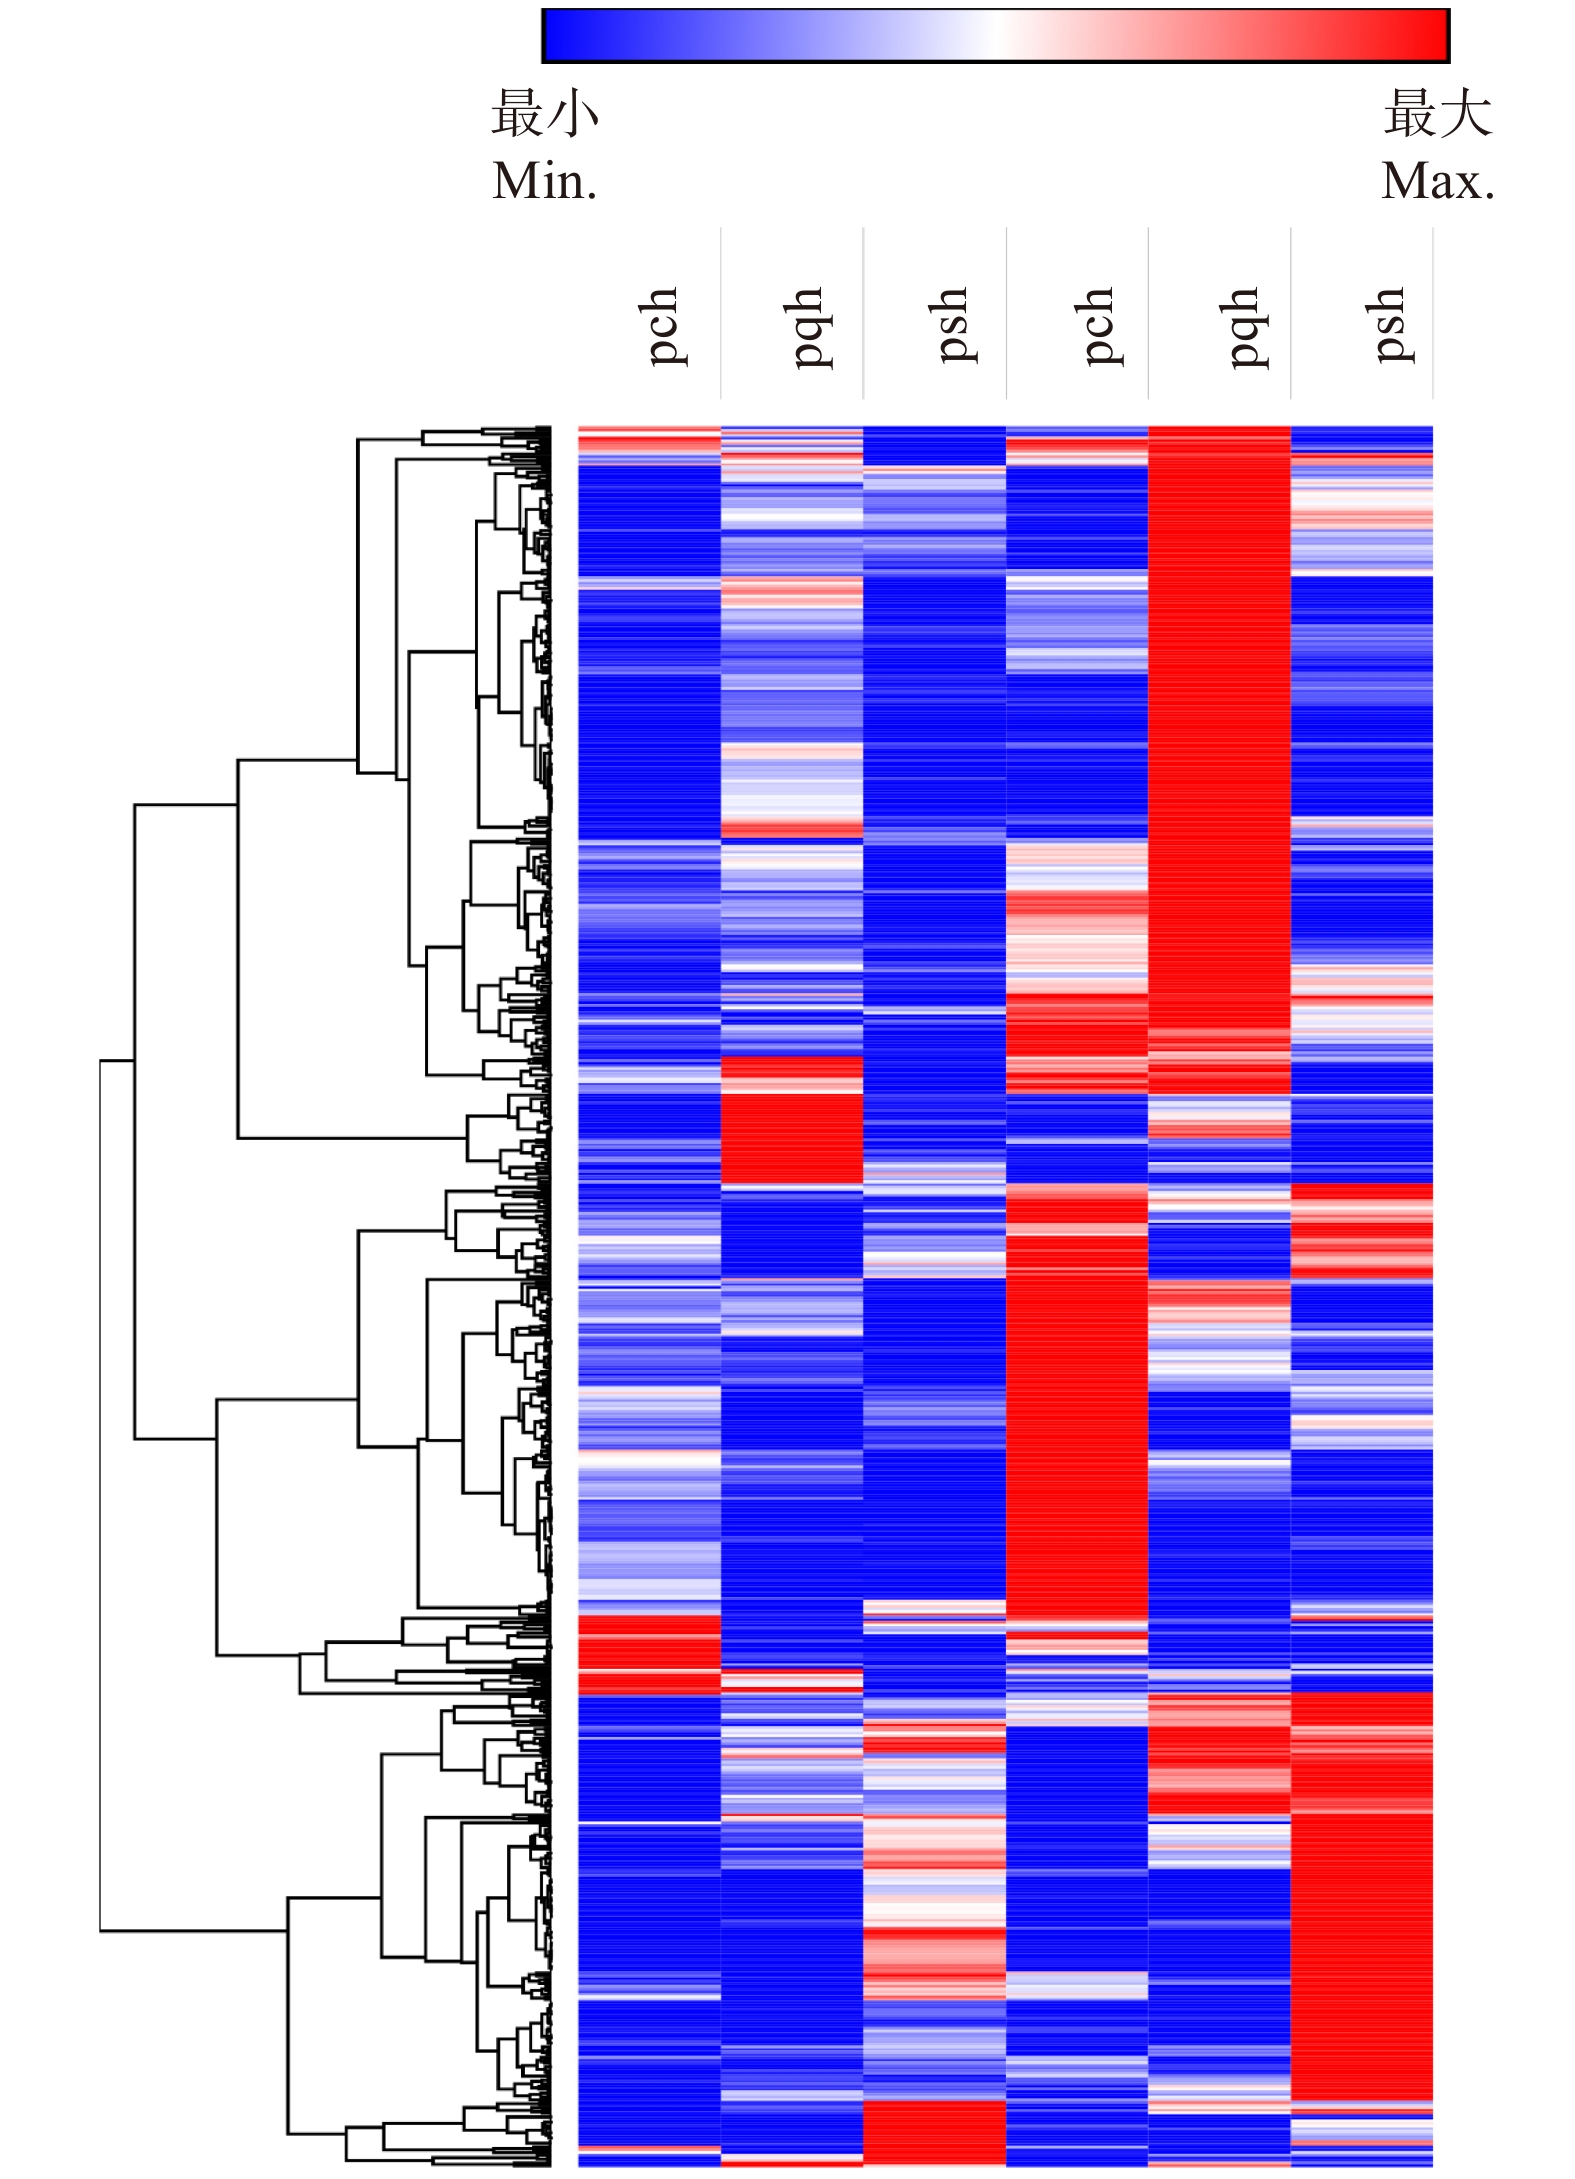
660组直系同源基因表达分析显示:尽管正常状态下,3种杨树基因表达模式具有差异,但在热胁迫下的基因表达模式很相似(图5)。660个直系同源基因组中,加杨有48个基因未表达,琼岛杨中136个基因未表达,小叶杨中142个未表达。加杨、琼岛杨和小叶杨中显著差异表达的基因分别为42、21和17个,其中4个同源基因在3种杨树中都显著差异表达,2个在琼岛杨和小叶杨中显著差异表达,5个在琼岛杨和加杨中都差异表达,且差异表达倍数相近(表4)。
![]() 图 5 3种杨树直系同源基因表达热图pch、pqh和psh分别为加杨、琼岛杨和小叶杨热胁迫处理;pcq、pqq和psq分别为加杨、琼岛杨和小叶杨对照组。The heat stress of P. canadensis, P. qiongdaoensis and P. simonii is named as pch, pqh and psh; the control of P. canadensis, P. qiongdaoensis and P. simonii is named as pcq, pqq and psq.Figure 5. Heat map of orthologus genes in three Populus species表 4 3种杨树差异表达直系同源基因Table 4. Differentially expression of orthologous genes in three Populus
图 5 3种杨树直系同源基因表达热图pch、pqh和psh分别为加杨、琼岛杨和小叶杨热胁迫处理;pcq、pqq和psq分别为加杨、琼岛杨和小叶杨对照组。The heat stress of P. canadensis, P. qiongdaoensis and P. simonii is named as pch, pqh and psh; the control of P. canadensis, P. qiongdaoensis and P. simonii is named as pcq, pqq and psq.Figure 5. Heat map of orthologus genes in three Populus species表 4 3种杨树差异表达直系同源基因Table 4. Differentially expression of orthologous genes in three Populus直系同源基因编号
Gene No. of orthologous gene琼岛杨 P. qiongdaoensis 加杨 P. canadensis 小叶杨 P. simonii 热处理
Heat stress对照
Controllog2FC 热处理
Heat stress对照
Controllog2FC 热处理
Heat stress对照
Controllog2FC OG07438 354.35 35.80 4.56 88.68 7.28 5.05 52.66 4.20 4.56 OG07244 188.23 4.62 6.66 1 329.18 31.22 6.85 103.81 1.39 7.16 OG09422 23.28 0.37 7.43 22.24 0.24 7.97 3.46 0.38 4.18 OG05822 3 381.21 2.03 12.19 318.20 0.48 10.80 370.24 0.11 12.65 OG07321 7.95 118.86 −2.97 6.49 115.96 −2.74 OG07470 75.24 13.14 3.82 17.13 3.28 3.84 OG07300 16.63 0.70 6.06 557.70 1.35 10.04 OG07384 279.51 11.27 6.08 583.29 20.48 6.31 OG09172 1 918.37 35.74 7.28 188.21 21.07 4.62 OG07291 113.69 13.64 4.39 242.96 4.12 6.94 OG07327 366.43 0.47 11.10 254.73 0.59 9.79 注:FC. 差异倍数。Note: FC, fold change. 2.4 琼岛杨cpDNA和nrDNA的序列多态性分析
为寻找琼岛杨更近的亲缘树种,我们采用单基因克隆的方法获得了琼岛杨atpⅠ、trnF、UDP-SQ和POPTRDRAFT_575699基因序列,基因长度分别为1 025、902、608和485 bp;G+C含量分别为29.56%、30.82%、45.23%和45.36%。2个cpDNA序列组合长度为1 927 bp,2个nrDNA序列组合长度为1 093 bp,G+C含量为30.15%和45.29%。nrDNA的G+C含量明显高于cpDNA。
atpⅠ、trnF、UDP-SQ和POPTRDRAFT_575699插入和缺失碱基数分别为27、18、3和0个(表5);单倍型数(单倍型多样性)分别为19(0.995)、18(0.989)、4(0.521)和2(0.100)个;多态位点分别为16、53、16和1个;突变总数分别为18、56、17和1个;简约位点分别为11、37、2和0个;单一位点分别为5、16、14和1个(表5)。综上所述,在琼岛杨中,cpDNA的序列多态性相对较高,进化较快,可提高种间鉴别能力,nrDNA的序列相对保守,进化相对较慢。
表 5 琼岛杨克隆基因序列长度及变异位点信息Table 5. Length and variant site information of amplified sequences of P. qiongdaoensis基因名称
Gene name长度
Length /bp插入/缺失个数
Number of the insertion
or deletion单倍型数
Number of
haplotype单倍型多样性
Haplotype
diversity多态位点
Polymorphic
site突变总数
Number of
mutation简约型位点
Parsimony
informative site单一位点
Single
siteatpⅠ 1 025 27 19 0.995 16 18 11 5 trnF 902 18 18 0.989 53 56 37 16 UDP-SQ 608 4 4 0.521 16 17 2 14 POPTRDRAFT_575699 485 2 2 0.100 1 1 0 1 2.5 nrDNA与cpDNA分析琼岛杨亲缘关系
利用遗传距离法计算琼岛杨组合基因序列cpDNA和nrDNA种内遗传距离以及与19种其他树种的种间遗传距离,结果显示cpDNA序列组合的种内和种间遗传距离分别为0 ~ 0.012和0.011 ~ 0.053,nrDNA序列组合分别为0 ~ 0.010和0.006 ~ 1.088。种间的遗传距离普遍大于种内遗传距离,表明种间的遗传分化明显大于种内的遗传分化,但也出现种间遗传距离小于种内遗传距离的情况,表明这些杨树与琼岛杨亲缘关系非常近。为了更准确地分析琼岛杨与其他树种的亲缘关系,进一步分析琼岛杨atpⅠ,trnF,UDP-SQ,POPTRDRAFT_575699以及组合基因序列cpDNA和nrDNA与其他树种的遗传距离(表6)。所有基因遗传距离的平均值显示出琼岛杨与白杨组亲缘最近,平均值为0.011,之后是青杨组(平均值0.015)和黑杨组(平均值0.016)。白杨组中,琼岛杨与响叶杨(P. adenopoda)遗传距离最近(0.010),毛白杨次之(0.011),最后是山杨(0.012),最大的山杨的平均遗传距离小于与其他派系杨树的遗传距离,显示了琼岛杨与白杨组具有最近亲缘关系。
表 6 琼岛杨与其他树种遗传距离Table 6. Genetic distance between P. qiongdaoensis and other Populus species物种名称
Species name分组
GroupnrDNA组合
nrDNA
combinationcpDNA组合
cpDNA
combinationUDP-SQ POPTRDRAFT_575699 atpⅠ trnF 平均值
Average各组平均值
Average of
each groupP. davidiana 白杨组
Leuce0.009 0.014 0.007 0.004 0.014 0.025 0.012 0.011 P. tomentosa 0.006 0.014 0.007 0.000 0.014 0.023 0.011 P. adenopoda 0.006 0.012 0.007 0.000 0.013 0.023 0.010 P. lasiocarpa 大叶杨组
Leucoides0.013 0.013 0.007 0.007 0.014 0.025 0.013 0.388 P. heterophylla 1.073 0.016 0.013 1.158 0.017 1.169 0.575 P. wilsonii 1.064 0.016 0.009 1.160 0.017 1.193 0.577 P. simonii 青杨组
Tacamahaca0.015 0.013 0.009 0.007 0.014 0.026 0.014 0.015 P. laurifolia 0.015 0.017 0.009 0.007 0.018 0.032 0.016 P. trichocarpa 0.009 0.017 0.009 0.002 0.017 0.029 0.014 P. nigra 黑杨组
Aigeiros0.020 0.011 0.011 0.011 0.012 0.023 0.015 0.016 P. afghanica 0.018 0.014 0.011 0.009 0.014 0.026 0.015 P. canadensis 0.018 0.016 0.010 0.008 0.022 0.026 0.017 P. deltoides 0.018 0.016 0.011 0.009 0.017 0.029 0.017 P. pruinosa 胡杨组
Turanga0.013 0.018 0.013 0.002 0.020 0.027 0.016 0.205 P. euphratica 0.016 0.018 0.015 0.004 0.020 0.027 0.017 P. ilicifolia 1.088 0.018 0.017 1.159 0.020 1.195 0.583 S. triandra 外类群
Outgroup0.083 0.053 0.049 0.040 0.053 0.062 0.057 0.056 S. arbutifolia 0.083 0.052 0.053 0.036 0.051 0.062 0.056 S. raddeana 0.081 0.053 0.047 0.038 0.052 0.062 0.056 我们使用了最大似然法和最小进化法分别构建所有基因及组合基因的系统进化树,所有基因通过两种方法构建的进化树均把琼岛杨聚到一起。我们展示了最大似然法构建的进化树,cpDNA构建的进化树显示琼岛杨与白杨组具有最近亲缘关系,且置信度均超过50,trnF中置信度50,atpⅠ中置信度58,cpDNA序列组合置信度为67(图6A)。nrDNA构建的进化树显示琼岛杨与白杨组也具有较近亲缘关系,置信度均小于50(图6B),UDP-SQ中置信度为15,POPTRDRAFT_575699中置信度为40,且均把类外群分到杨树大分支,显示出nrDNA序列对于琼岛杨与其他物种间的区分度较差。
![]() 图 6 琼岛杨与19个树种的系统进化树A. cpDNA组合序列最大似然进化树;B. nrDNA组合序列最大似然进化树。A, cpDNA combination sequence maximum likelihood phylogenetic tree; B, maximum likelihood evolutionary tree of nrDNA combined sequence.Figure 6. Phylogenetic tree of the P. qiongdaoensis and 19 tree species
图 6 琼岛杨与19个树种的系统进化树A. cpDNA组合序列最大似然进化树;B. nrDNA组合序列最大似然进化树。A, cpDNA combination sequence maximum likelihood phylogenetic tree; B, maximum likelihood evolutionary tree of nrDNA combined sequence.Figure 6. Phylogenetic tree of the P. qiongdaoensis and 19 tree species3. 结论与讨论
鉴定物种的亲缘关系,通过直系同源基因的比较是最直接有效的方法[41]。通过搜索我们获取的转录本数据,加杨、琼岛杨和小叶杨一共获取了660组直系同源基因。计算物种的直系同源基因的Ka、Ks及Ka/Ks值可用于评估物种的亲缘关系、计算分化时间及研究进化过程中受正选择的基因[42-43]。本研究中3个物种的直系同源基因的Ks值平均值为0.150 5,峰值为0.02,Ks值水平相对较低,Ka/Ks < 1占比97.27%,表明3种杨树具有较近亲缘关系。构建的系统发育树也显示琼岛杨与加杨和小叶杨具有较近亲缘关系,但琼岛杨更为进化,并通过T = K/2r估算出琼岛杨与这2个物种的分化时间大概为1.21 百万年前左右的更新世[44]。不同物种相同处理条件下同类基因的表达模式也能反映物种的亲缘关系。在我们研究中,660组直系同源基因表达量分析显示:尽管正常状态下,3种杨树大量的基因表达模式存在差异,但在热胁迫下它们的表达模式却很相似,进一步表明了琼岛杨、加杨和小叶杨具有较近亲缘关系。另外,我们结合毛果杨和簸箕柳搜索了5个树种直系同源基因共220组,基于这些直系同源基因构建了5个树种的进化树,结果显示:加杨、小叶杨和毛果杨被聚为同一分支,琼岛杨和簸箕柳各为一个支。同时,琼岛杨、加杨和小叶杨的转录本与毛果杨的比对率均为最高,说明了这些杨树具有较近亲缘关系,但琼岛杨与其他杨树间具有一定差异。
我们进一步通过单基因克隆的方法分析了琼岛杨在杨属中的进化地位,该技术是用于物种亲缘关系分析的重要方法之一[45-47]。我们在20株琼岛杨上克隆了4个基因序列,通过琼岛杨种内的分析显示atpⅠ和trnF多态位点分别为16和53,明显高于nrDNA的UDP-SQ(16)和POPTRDRAFT_575699(1),这表明cpDNA相对于nrDNA可能进化速率更快,在琼岛杨中cpDNA可能具有更好的物种鉴别能力。另外,为了分析琼岛杨的亲缘关系,我们结合19个树种进行了序列多重比较,通过遗传距离法计算atpⅠ、trnF、UDP-SQ、POPTRDRAFT_575699以及组合基因序列cpDNA和nrDNA与其他树种的遗传距离,平均遗传距离(0.011)均显示琼岛杨与白杨组亲缘最近,这与Wang等[48]的研究一致。使用最大似然法和最小进化法构建的所有基因的系统进化树均把琼岛杨聚到一起,表明该方法适用于琼岛杨亲缘关系分析。其中,cpDNA和nrDNA组合序列构建的进化树均显示琼岛杨与白杨组具有最近亲缘关系,遗传距离和构建的进化树结果表明:琼岛杨确实与白杨组亲缘关系最近。另外,cpDNA序列组合的进化分支置信度明显高于nrDNA序列组合,综上结果表明:在琼岛杨中,cpDNA基因比nrDNA基因更适合用于物种鉴别。
-
![]()
图 1 21个下垫面类型样方和7个复合样方的位置分布示意图
图像来源:2014年9月谷歌地图。Picture source: Google maps, September 2014.Site A ~ G:样方A ~ G;HVC1 ~ 3:高郁闭度植被垫面1 ~ 3;MVC1 ~ 3:中郁闭度植被垫面1 ~ 3;LVC1 ~ 3:低郁闭度植被垫面1 ~ 3;WB1 ~ 3:水体垫面样点1 ~ 3;BS1 ~ 3:裸土垫面样点1 ~ 3;BA1 ~ 3:建筑垫面样点1 ~ 3;PA1 ~ 3:不透水铺装垫面样点。下同。Site A−G: quadrat A−G; HVC1−3: high canopy density vegetation 1−3; MVC1−3: moderate canopy density vegetation 1−3; LVC1−3: low canopy density vegetation 1−3; WB1−3: water-body 1−3; BS1−3: bare soil 1−3; BA1−3: building area 1−3; PA1−3: paved area 1−3. The same below.
Figure 1. Locations of study area, 21 type quadrats and 7 pattern quadrats
![]()
图 2 格局试验复合样方范围内测点示例(样方E、G)
Figure 2. Arrangement example of three measuring points for pattern site (quadrat E and G)
![]()
图 3 四季7种下垫面类型的日平均空气温度
不同小写字母表示多重比较的差异。下同。Different lowercase letters indicate the differences of multiple comparisons. The same below.
Figure 3. Daily average air temperature (AT) among seven underlying surface types in the four seasons
![]()
图 4 四季7种下垫面类型的日平均相对湿度
Figure 4. Daily average relative humidity (RH) among seven underlying surface types in the four seasons
![]()
图 5 四季不同下垫面格局样方的日平均空气温度、湿度分布
Figure 5. Distribution of daily average AT and RH at seven underlying surface pattern quadrats in four seasons
表 1 3类植被垫面的基本信息
Table 1 Details of the sampling vegetation underlying surface
群落编号
Community No.群落类型
Community type郁闭度
Canopy density/%平均株高
Average plant height/m平均冠幅
Average crown diameter/m平均胸径(地径)
Average DBH (GD)/cmHVC1 针阔混交−乔灌草型
Coniferous broadleaved mixed-arbor shrub grass type (M-TSG)89 6.21 4.30 11.25 HVC2 针阔混交−乔灌草型 M-TSG 83 6.93 2.22 15.35 HVC3 针阔混交−乔灌草型 M-TSG 92 4.79 3.91 8.73 MVC1 阔叶−乔灌草型
Broadleaved trees, shrubs and grasses (B-TSG)61 5.40 3.95 16.00 MVC2 针阔混交−乔灌草型 M-TSG 48 8.84 3.26 10.18 MVC3 针阔混交−乔草型
Mixed coniferous and broadleaved
trees and grasses (M-TG)53 9.29 4.46 14.53 LVC1 针阔混交−乔灌草型 M-TSG 38 5.32 1.66 7.23 LVC2 针阔混交−乔草型 M-TG 19 3.98 4.08 7.60 LVC3 针阔混交−乔灌草型 M-TSG 32 8.84 3.26 8.18  下载: 导出CSV
表 2 所选景观指数
Table 2 List of selected landscape indexes
景观指数 Landscape index 水平 Level 描述 Description 单位 Unit 范围 Range 斑块所占景观面积比例
Percent of landscape (PLAND)类型 Type 某一斑块类型占景观的面积比率
Area ratio of a certain patch type to the landscape% 0 ~ 100 斑块密度
Patch density (PD)类型 Type 每公顷某一斑块类型斑块的个数
Number of a certain patch type per hectare个/hm2
number/ha> 0 平均斑块面积
Mean patch size (MPS)类型 Type 某一斑块类型的平均斑块面积
Mean patch size of a certain patch typehm2
ha> 0 破碎度指数
Fragmentation index (FI)类型 Type 某一斑块类型被分割的破碎程度
Degree of fragmentation of a certain patch type> 0 聚集度指数
Aggregation index (AI)类型 Type 某一斑块类型相互聚集的程度
Degree of aggregation of a certain patch type% 0 ~ 100
下载: 导出CSV
表 3 所选格局样方的景观指数信息
Table 3 Landscape index information of selected pattern quadrats
景观指数
Landscape index样方编号 Quadrat No. Site A Site B Site C Site D Site E Site F Site G PA PLAND 50.130 33.523 33.334 58.203 31.113 25.268 50.814 PD 5.391 5.375 4.030 2.695 2.687 2.696 2.694 MPS 0.093 0.062 0.083 0.216 0.116 0.094 0.189 FI 32.258 48.077 24.184 4.630 8.636 10.672 5.302 AI 97.391 95.903 97.281 98.456 96.532 96.076 98.500 BA PLAND 24.661 22.902 48.178 26.951 20.857 18.920 33.127 PD 2.696 4.031 4.030 5.390 8.060 6.739 5.389 MPS 0.092 0.057 0.120 0.050 0.026 0.028 0.062 FI 10.929 35.211 16.722 60.000 193.050 142.349 48.780 AI 99.099 98.592 98.263 97.892 97.103 97.487 97.700 LVC PLAND 3.101 20.618 15.427 9.468 24.448 30.602 10.278 PD 2.696 10.749 13.433 12.128 13.433 9.434 10.778 MPS 0.012 0.019 0.012 0.008 0.018 0.032 0.010 FI 86.957 364.583 782.609 1 025.641 494.505 185.185 736.842 AI 97.909 95.606 93.370 93.152 95.612 96.290 94.260 MVC PLAND 20.903 8.247 2.005 1.919 13.952 17.551 3.700 PD 8.087 4.031 2.687 2.695 9.403 8.087 4.042 MPS 0.026 0.021 0.008 0.007 0.015 0.022 0.009 FI 193.798 97.561 133.333 140.845 405.405 230.415 217.391 AI 97.075 97.003 95.497 94.404 94.949 96.280 96.133 HVC PLAND 1.205 14.710 1.056 3.459 9.631 7.660 2.080 PD 1.348 2.687 1.343 2.695 4.030 2.696 2.694 MPS 0.009 0.055 0.008 0.013 0.024 0.028 0.008 FI 0.000 18.282 0.000 78.125 83.682 35.211 129.870 AI 99.085 98.132 96.856 98.218 97.184 注:HVC:高郁闭度植被垫面;MVC:中郁闭度植被垫面;LVC:低郁闭度植被垫面;BA:建筑垫面样点;PA:不透水铺装垫面样点。下同。Notes: HVC, high canopy density vegetation;MVC, moderate canopy density vegetation; LVC, low canopy density vegetation; BA, building area;PA, paved area. Same as below.
下载: 导出CSV
表 4 四季各景观指数与日平均空气温度与相对湿度的相关性
Table 4 Spearman correlations between landscape indexes and daily average AT and RH in four seasons
景观指数
Landscape index日均空气温度 Daily average AT/℃ 日均相对湿度 Daily average RH/% 冬季 Winter 春季 Spring 夏季 Summer 秋季 Autumn 冬季 Winter 春季 Spring 夏季 Summer 秋季 Autumn PA PLAND 0.852* 0.895** 0.761* 0.808* −0.844* −0.794* −0.823* −0.809* PD 0.089 0.093 −0.245 −0.158 0.076 0.175 0.055 −0.045 MPS 0.616 0.639 0.740 0.736 −0.703 −0.735 −0.675 −0.619 FI −0.040 −0.060 −0.379 −0.281 0.219 0.292 0.193 0.067 AI 0.784* 0.842* 0.933** 0.898** −0.908** 0.897** −0.888** −0.825* BA PLAND 0.362 0.445 0.647 0.564 −0.572 −0.583 0.610 −0.56 PD −0.561 −0.547 −0.236 −0.271 0.427 0.343 0.413 0.484 MPS 0.382 0.453 0.422 0.380 −0.462 −0.408 −0.491 −0.473 FI −0.745 −0.730 −0.489 −0.510 0.655 0.596 0.637 0.708 AI 0.421 0.411 0.041 0.105 −0.25 −0.154 −0.245 −0.322 LVC PLAND −0.759* −0.833* −0.692 −0.72 0.773* 0.684 0.771* 0.759* PD −0.143 −0.065 0.242 0.245 −0.081 −0.174 −0.149 −0.106 MPS −0.709 −0.854* −0.875** −0.917** 0.860* 0.801* 0.907** 0.868 FI 0.536 0.633 0.820* 0.830* −0.745 −0.800* −0.788* −0.724* AI −0.443 −0.507 −0.711 −0.701 0.637 0.715 0.675 0.629 MVC PLAND −0.579 −0.631* −0.767* −0.780* 0.729 0.783* 0.760* 0.763* PD −0.758* −0.758* −0.705 −0.733 0.785* 0.818* 0.791* 0.835* MPS −0.413 −0.511 −0.799* −0.767* 0.669 0.734 0.712 0.635 FI −0.681 −0.598 −0.278 −0.325 0.507 0.504 0.476 0.574 AI −0.035 0.174 −0.429 −0.433 0.291 0.357 0.359 0.211 HVC PLAND −0.485 −0.536 −0.658 −0.539 0.624 0.605 0.599 0.488 PD −0.429 −0.408 −0.228 −0.174 0.367 0.320 0.342 0.345 MPS −0.352 −0.439 −0.656 −0.536 0.556 0.543 0.548 0.407 FI 0.214 0.216 0.473 0.451 −0.326 −0.367 −0.298 −0.287 AI −0.120 −0.119 −0.519 −0.409 0.314 0.364 0.296 0.302 注:粗体为显著变量,**表示极显著相关(P < 0.01),*表示显著相关(P < 0.05)。Notes: significant variables are marked in bold, ** stands for extremely significant correlation (P < 0.01); * stands for significant correlation (P < 0.05).
下载: 导出CSV
-
[1] Gao Z, Hou Y, Chen W. Enhanced sensitivity of the urban heat island effect to summer temperatures induced by urban expansion[J/OL]. Environmental Research Letters, 2019, 14(9)[2020−03−03]. https://doi.org/10.1088/1748-9326/ab2740.
[2] Peng J, Ma J, Liu Q, et al. Spatial-temporal change of land surface temperatureIcross 285 cities in China: an urban-rural contrast perspective[J]. Science of The Total Environment, 2018, 635: 487−497. doi: 10.1016/j.scitotenv.2018.04.105
[3] Rizwan A M, Dennis L Y C, Liu C H. A review on the generation, determination and mitigation of Urban Heat Island[J]. Journal of Environmental Science, 2008, 20(1): 120−128. doi: 10.1016/S1001-0742(08)60019-4
[4] Gosling S N, Lowe J A, Mcgregor G R, et al. Associations between elevated atmospheric temperature and human mortality: a critical review of the literature[J]. Climatic Change, 2009, 92(3−4): 299−341. doi: 10.1007/s10584-008-9441-x
[5] 潘守文. 小气候考察的理论基础及其应用[M]. 北京: 气象出版社, 1989. Pan S W. Theoretical basis and application of microclimate investigation[M]. Beijing: China Meteorological Press, 1989.
[6] Algretawee H, Rayburg S, Neave M. Estimating the effect of park proximity to the central of Melbourne City on Urban Heat Island (UHI) relative to land surface temperature (LST)[J]. Ecological Engineering, 2019, 138: 374−390. doi: 10.1016/j.ecoleng.2019.07.034
[7] Zenghui K, Zhibao W, Xuejun S, et al. Research on the cooling island effects of water body: a case study of Shanghai, China[J]. Ecological Indicators: Integrating, Monitoring, Assessment and Management, 2016, 67: 31−38.
[8] Du H, Cai W, Xu Y, et al. Quantifying the cool island effects of urban green spaces using remote sensing data[J]. Urban Forestry & Urban Greening, 2017, 27: 24−31.
[9] 谢紫霞, 张彪, 佘欣璐, 等. 上海城市绿地夏季降温效应及其影响因素[J]. 生态学报, 2020, 40(19):6749−6760. Xie Z X, Zhang B, She X L, et al. The summer cooling effect and its influencing factors of urban green spaces in Shanghai[J]. Acta Ecologica Sinica, 2020, 40(19): 6749−6760.
[10] Liu F, Zhang X, Murayama Y, et al. Impacts of land cover/use on the urban thermal environment: a comparative study of 10 megacities in China[J/OL]. Remote Sensing, 2020, 12(2): 307 [2020−03−02]. https://doi.org/10.3390/rs12020307.
[11] Fan S, Li X, Han J, et al. Assessing the effects of landscape characteristics on the thermal environment of open spaces in residential areas of Beijing, China[J]. Landscape & Ecological Engineering, 2018, 14: 79−90.
[12] 仇宽彪, 贾宝全, 成军锋. 北京市五环内主要公园冷岛效应及其主要影响因素[J]. 生态学杂志, 2017, 36(7):1984−1992. Qiu K B, Jia B Q, Cheng J F. Cool island effect of urban parks and its influencing factors within the Fifth Ring in Beijing[J]. Chinese Journal of Ecology, 2017, 36(7): 1984−1992.
[13] Gage E A, Cooper D J. Relationships between landscape pattern metrics, vertical structure and surface Urban Heat Island formation in a Colorado suburb[J]. Urban Ecosystems, 2017, 20(6): 1229−1238. doi: 10.1007/s11252-017-0675-0
[14] 陈爱莲, 孙然好, 陈利顶. 传统景观格局指数在城市热岛效应评价中的适用性[J]. 应用生态学报, 2012, 23(8):2077−2086. Chen A L, Sun R H, Chen L D. Applicability of traditional landscape metrics in evaluating urban heat island effect[J]. Chinese Journal of Applied Ecology, 2012, 23(8): 2077−2086.
[15] Chen A, Yao L, Sun R, et al. How many metrics are required to identify the effects of the landscape pattern on land surface temperature?[J]. Ecological Indicators, 2014, 45(1): 424−433.
[16] 邹婧, 曾辉. 城市地表热环境与景观格局的关系: 以深圳市为例[J]. 北京大学学报(自然科学版), 2017, 53(3):436−444. Zou J, Zeng H. Relationships between urban landscape pattern and land surface temperature: a case study of Shenzhen[J]. Acta Scientiarum Naturalium Universitatis Pekinensis, 2017, 53(3): 436−444.
[17] 花利忠, 孙凤琴, 陈娇娜, 等. 基于Landsat-8影像的沿海城市公园冷岛效应: 以厦门为例[J]. 生态学报, 2020, 40(22):1−11. Hua L Z, Sun F Q, Chen J N, et al. Quantifying the cool-island effects of urban parks using Landsat-8 imagery in a coastal city, Xiamen, China[J]. Acta Ecologica Sinica, 2020, 40(22): 1−11.
[18] Hai Y, Fan W, Li D. Influence of a large urban park on the local urban thermal environment[J]. Science of the Total Environment, 2018, 622−623(May1): 882−891.
[19] Zhao J, Zhao X, Liang S, et al. Assessing the thermal contributions of urban land cover types[J/OL]. Landscape and Urban Planning, 2020, 204 [2020−03−10]. https://doi.org/10.1016/j.landurbplan.2020.103927.
[20] Wu Z, Chen L. Optimizing the spatial arrangement of trees in residential neighborhoods for better cooling effects: Integrating modeling with in-situ measurements[J]. Landscape and Urban Planning, 2017, 167: 463−472. doi: 10.1016/j.landurbplan.2017.07.015
[21] Coseo P, Larsen L. How factors of land use/land cover, building configuration, and adjacent heat sources and sinks explain Urban Heat Islands in Chicago[J]. Landscape & Urban Planning, 2014, 125: 117−129.
[22] Sun R, Chen L. Effects of green space dynamics on urban heat islands: mitigation and diversification[J]. Ecosystem Services, 2017, 23: 38−46. doi: 10.1016/j.ecoser.2016.11.011
[23] Skelhorn C, Lindley S, Levermore G. The impact of vegetation types on air and surface temperatures in a temperate city: a fine scale assessment in Manchester, UK[J]. Landscape & Urban Planning, 2014, 121: 129−140.
[24] 朱春阳, 李树华, 纪鹏. 城市带状绿地结构类型与温湿效应的关系[J]. 应用生态学报, 2011, 22(5):1255−1260. Zhu C Y, Li S H, Ji P. Relationships between urban green belt structure and temperature-humidity effect[J]. Chinese Journal of Applied Ecology, 2011, 22(5): 1255−1260.
[25] Srivanit M, Hokao K. Evaluating the cooling effects of greening for improving the outdoor thermal environment at an institutional campus in the summer[J]. Building and Environment, 2013, 66(Suppl. C): 158−172.
[26] Skelhorn C, Lindley S, Levermore G. The impact of vegetation types on air and surface temperatures in a temperate city: a fine scale assessment in Manchester, UK[J]. Landscape & Urban Planning, 2014, 121(1): 129−140.
[27] 高吉喜, 宋婷, 张彪, 等. 北京城市绿地群落结构对降温增湿功能的影响[J]. 资源科学, 2016, 38(6):1028−1038. Gao J X, Song T, Zhang B, et al. The relationship between urban green space community structure and air temperature reduction and humidity increase in Beijing[J]. Resources Science, 2016, 38(6): 1028−1038.
[28] Lin T, Ho Y, Huang Y. Seasonal effect of pavement on outdoor thermal environments in subtropical Taiwan[J]. Building and Environment, 2007, 42(12): 4124−4131. doi: 10.1016/j.buildenv.2006.11.031
[29] 刘娇妹, 杨志峰. 北京市冬季不同景观下垫面温湿度变化特征[J]. 生态学报, 2009, 29(6):3241−3252. doi: 10.3321/j.issn:1000-0933.2009.06.056 Liu J M, Yang Z F. Dynamicss of temperature and humidity in underlaying surface of different landscape type in winter in Beijing City, China[J]. Acta Ecologica Sinica, 2009, 29(6): 3241−3252. doi: 10.3321/j.issn:1000-0933.2009.06.056
[30] Dimoudi A, Nikolopoulou M. Vegetation in the urban environment: microclimatic analysis and benefits[J]. Energy & Buildings, 2003, 35(1): 69−76.
[31] Koc C B , Osmond P , Peters A. Evaluating the cooling effects of green infrastructure: a systematic review of methods, indicators and data sources[J]. Solar Energy, 2018, 166: 486−508.
[32] 邹春城, 张友水, 黄欢欢. 福州市城市不透水面景观指数与城市热环境关系分析[J]. 地球信息科学学报, 2014, 16(3):490−498. Zou C C, Zhang Y S, Huang H H. Impacts of impervious surface area and landscape metrics on Urban Heat Environment in Fuzhou City, China[J]. Journal of Geo-Information Science, 2014, 16(3): 490−498.
[33] Sahar S, Huiwen Z, Xiaoli C, et al. The influence of spatial configuration of green areas on microclimate and thermal comfort[J]. Urban Forestry & Urban Greening, 2018, 34: 85−96.
[34] Masoudi M, Tan P Y. Multi-year comparison of the effects of spatial pattern of urban green spaces on urban land surface temperature[J]. Landscape and Urban Planning, 2019, 184: 44−58. doi: 10.1016/j.landurbplan.2018.10.023
-
期刊类型引用(3)
1. 饶丹丹,韩豫,吴二焕,陈彧. 不同光强下琼岛杨幼苗生长和光合特性. 山西农业大学学报(自然科学版). 2024(01): 61-69 .  百度学术
百度学术
2. 韩霜,徐浩,余静雅,韩赟,张发起. 藏茵陈基源植物皱边喉毛花的全长转录组信息分析. 广西植物. 2023(07): 1335-1346 . 百度学术
3. 郝豆豆,张勇群,施静,拉多,雷鸣. 报春花科3种植物对青藏高原适应性进化的转录组学研究. 西部林业科学. 2022(04): 141-147 . 百度学术
其他类型引用(2)


计量
- 文章访问数: 1398
- HTML全文浏览量: 568
- PDF下载量: 171
- 被引次数: 5
