
Construction and optimization of ecological network in Beijing section of Yongding River Basin based on ecosystem services
-
摘要:目的 随着流域城镇化进程加快,自然资源的开发及城镇用地扩张,导致流域生态环境逐步恶化,生态系统服务功能也随之减弱。构建生态网络对于改善和修复流域生态系统结构与功能,进一步实现流域生态的可持续发展具有重要意义。方法 以永定河流域北京段为例,对流域水源涵养、土壤保持、生境质量3种生态系统服务进行定量评估,利用Getis-Ord GI*热点分析法识别生态源地,运用最小累积阻力模型提取生态廊道及生态节点,最终构建生态网络。并使用网络闭合度(α指数)、线点率(β指数)和网络连接度(γ指数)评价其生态网络完善程度,进一步探讨绿色生态发展目标下的生态网络优化策略。结果 研究表明:永定河流域内共识别出16个生态源地,23条生态廊道,19个生态节点。其中:生态源及生态节点分布在研究区北部及中部,主要由林地、耕地组成;生态廊道总长度为52.03 km,成网状沿农田、林地及河流分布。基于对生态网络分析评价,设置生态源及生态廊道的生态缓冲区,并识别生态节点盲区,对生态网络空间结构进行优化。结论 本文通过对永定河流域北京段生态网络的构建与优化,明确了流域内生态保护与修复的重点区域,以期为流域未来的生态建设及修复规划提供空间指引。
-
关键词:
- 生态系统服务 /
- Getis-Ord GI*热点分析 /
- 生态网络 /
- 生态廊道 /
- 永定河流域
Abstract:Objective With the accelerated urbanization of the watershed, the development of natural resources and the expansion of urban land have led to the gradual deterioration of watershed ecological environment and the weakening of ecosystem service functions. It is important to construct an ecological network to improve and repair the structure and function of the watershed ecosystem and further realize the sustainable ecological development of the watershed.Method Taking Beijing section of Yongding River Basin as an example, this paper quantitatively assesses three ecosystem services, namely water content, soil conservation and habitat quality, and identifies ecological source sites using Getis-Ord GI* hotspot analysis; extracts ecological corridors and ecological nodes using the minimum cumulative resistance model; and finally constructs an ecological network. And the ecological network perfection degree was evaluated by the network closure (α index), line point rate (β index) and network connectivity (γ index) to further explore the ecological network optimization strategy under the green ecological development goal.Result 16 ecological sources, 23 ecological corridors and 19 ecological nodes were identified in the Yongding River Basin. The ecological sources and nodes were distributed in the northern and central parts of the study area, mainly consisting of woodland and cropland; the total length of ecological corridors was 52.03 km, distributed in a network along farmland, woodland and rivers. Based on the analysis and evaluation of the ecological network, ecological buffer zones of ecological sources and ecological corridors were set, and blind areas of ecological nodes were identified to optimize the spatial structure of the ecological network.Conclusion Through the construction and optimization of the ecological network of Beijing section of the Yongding River Basin, this paper clarifies the key areas for ecological protection and restoration in the basin to provide spatial guidelines for the future ecological construction and restoration planning of the basin. -
有数据显示,全球陆地土壤碳含量为1 750 Pg,植被碳含量为550 Pg,总量约为大气碳含量的3倍[1],即无论土壤作为“碳源”还是“碳汇”都将对气候变化产生巨大影响,故在全球气候变化和生态扰动背景下,陆地生态系统有机碳(SOC)分布与动态变化受到广大学者的广泛重视。尤其表层土壤,是SOC的集中分布层,其SOC含量更显著的受到微地形[2]、植被类型[3-4]、枯落物数量[5-6]、人为扰动[7]等因素的影响,使其在空间分布上具有更强的异质性,而成为研究者关注的一个焦点。
在不同空间尺度上,SOC分布的异质性为SOC储量的科学估算及关键影响因素的研究提出了挑战,故随着地统计分析工具的出现,广大学者采用地统计学的方法针对不同生态类型、空间尺度等条件下SOC的分布特征及空间变异性进行了研究,并表明地统计学是研究SOC空间分布的一种有效工具[8]。如Gao等[9]基于地统计方法研究得出中国北方丘陵地区SOC的空间异质性受随机性和结构性因素的共同控制。Göl等[10]研究发现球状模型可以很好地模拟黑海不同土地利用方式SOC的空间分布。SOC的空间分布还具有尺度效应[11],然而在区域、县域等大、中尺度下的空间分布与预测往往简化了某些生态过程,可能增加碳研究的不确定性[12],相比之下,小尺度下的空间预测反映的信息量更加丰富[13],因此揭示小尺度SOC的空间分布格局及其影响因素对于精确估算SOC含量是必要的。
青藏高原属于典型的生态脆弱区和气候变化的敏感区,在全国乃至全球都具有重要的生态地位。近年来,随着交通不断便利,不少学者开展了青藏高原土壤碳循环研究,如王建林等[14]关于草地土壤化学计量特征的大尺度空间分布研究,从宏观上了揭示青藏高原的土壤养分状况。叶成龙等[15]人基于野外定点试验和室内试验的研究表明,氮输入将增加预测青藏高原高寒草甸地区土壤碳排放的不确定性。其他研究如吕韶利[16]、刘合满[17]等,研究结果为高寒地区土壤碳循环研究奠定了丰富的理论和技术参考。青藏高原地形、植被、气候等具有显著的差异,导致SOC含量具有高度的空间异质性,然而目前针对SOC的空间分布与模拟研究仍少见报道,尤其是在小尺度空间范围,这将阻碍我们对于青藏高原这一特殊生态系统土壤碳动态变化的认识。为科学阐明高寒地区典型植被类型表层SOC及SOCD的空间分布特征与影响因素,本研究以西藏东南部色季拉山西坡广泛分布的草甸和杜鹃灌丛土壤为研究对象,采用地统计分析方法,旨在阐明小尺度下不同植被类型SOC及SOCD的空间变异及格局,以期为高寒环境下土壤有机碳循环研究及土壤碳储量的准确估算提供理论支撑。
1. 研究区概况与研究方法
1.1 研究区概况
本研究以色季拉山西坡相邻分布的灌丛、草甸为研究样地,其海拔4 200 ~ 4 400 m,地理位置29°36′N、94°38′E。根据色季拉山道班阴坡林外(29°35′51″N,94°36′43″E,4 390 m)2005 — 2012年的观测数据,该区域年均气温约为0.64 ℃,年均相对湿度为77%,年降雨量为877 mm。土壤类型属于亚高山林灌草甸土、沼泽草甸土[18]。
本研究所选样区主要包含苔草高寒草甸(Carex alpine meadow,CAM)、林芝杜鹃灌丛(Rhododendron tanastylum shrub,RTS)、雪山杜鹃灌丛(Rhododendron aganniphum shrub,RAS)3种植被类型。苔草高寒草甸,地面以苔草为建群种,其中还分布有委陵菜(Potentilla chinensis)、老鹳草(Geranium wilfordii)、阜莱氏马先蒿(Pedicularis fletcherii)、西藏糙苏(Phlomis tibetica)、偃卧繁缕(Stellaria decumbens)、蒲公英(Taraxacu mmongolicum)等,地面凹凸不平,存在沟壑。林芝杜鹃灌丛是以林芝杜鹃(Rhododendron tanastylum)为优势种,红枝小檗(Berberis erythroclada)和雪层杜鹃(Rhododendron nivale)为亚优势种的灌草丛地,植被分布不均一。雪山杜鹃灌丛主要生长雪山杜鹃(Rhododendron aganniphum),并伴有高山柏(Sabina squamata)和急尖长苞冷杉(Abies georgei var. smithii)零星分布,地面有较厚的枯落物层(最厚可达10 cm)。样地概况如表1所示。
表 1 样地基本概况Table 1. Basic condition of sample plots植被类型
Vegetation
type海拔
Altitude/m植被盖度
Vegetation
coverage/%坡度
Slope/(°)全氮
Total nitrogen
(TN)/(g·kg−1)全磷
Total phosphorus
(TP)/(g·kg−1)pH 含水率
Water
content/%土壤密度
Soil density/
(g·cm−3)黏粒
Clay/%粉粒
Silt/%砂粒
Sand/%CAM 4242 95 16 6.54 1.12 5.59 55.37 0.81 3.82 62.76 33.42 RTS 4264 75 14 3.29 0.39 5.47 72.01 0.82 3.55 61.45 35.00 RAS 4387 > 95 25 5.48 0.37 4.30 72.62 0.46 3.19 62.07 34.75 注:CAM为苔草高寒草甸;RTS为林芝杜鹃灌丛;RAS为雪山杜鹃灌丛。黏粒粒径< 0.002 mm,粉粒粒径在0.002~0.05 mm之间,砂粒粒径在0.05~2 mm之间。下同。Notes: CAM is Carex alpine meadow; RTS is Rhododendron tanastylum shrub; RAS is Rhododendron aganniphum shrub. Clay particle size is less than 0.002 mm; silt particle size is between 0.002−0.05 mm; sand particle size is between 0.05−2 mm. The same below. 1.2 样品采集与处理
于2018年10月,在野外考察的基础上,选择坡度较缓,植被类型连续的区域作为研究区(图1),采用10 m × 10 m网格法采样。即在3种植被类型区采用测量绳分别划定一个50 m × 50 m的样地,然后按照10 m × 10 m网格设置采样点,共计36个采样点。分别采集0 ~ 10 cm层次土壤和原状土壤样品,共获得土壤样品和环刀土样各108个,详细记录每一采样点的地形(海拔、坡度、坡位、凸起、沟壑)、植被覆盖等信息。采集的样品去杂置于风干盘自然风干后,经研磨使其分别通过2.00、0.25 mm土壤筛,用以测定土壤碳、氮等理化性质。SOC采用重铬酸钾容量−外加热法测定,全氮(TN)采用半微量凯氏法测定,全磷(TP)采用钼锑抗比色法测定,土壤密度、机械组成分别采用环刀法和激光粒度分布仪(Bettersize2000,丹东百特仪器有限公司)测定,以上实验过程参照文献[19-20]进行。
1.3 土壤有机碳密度计算
SOCD的计算采用如下公式:
SOCD=CDE(1−G)/100 式中:
C 为有机碳含量(g/kg),D 为土壤密度(g/cm3),E 为土层厚度(cm),G 为直径 > 2 mm石砾百分含量(%),这里忽略G 后计算SOCD[21]。1.4 数据处理与分析
在SPSS 22.0中计算SOC及SOCD的最大值、最小值、平均值、标准差、变异系数(Coefficient of variation, CV),其中CV值在0 ~ 10%、10% ~ 100%和 > 100%之间时,分别属于弱、中等和强变异。对不同植被类型SOC、SOCD的差异显著性检验采用LSD法(P < 0.01)。在GS+ 9.0中建立半方差函数模型,模型拟合可以得到块金值(C0)、基台值(C0 + C)、变程(A0)3个评价空间变异程度的参数,其中块金值与基台值的比值(C0/(C0 + C))即结构比,反映了随机性因素引起的空间变异占系统总变异的比值,比值在 < 25%、25% ~ 75%、> 75%范围,分别表示强、中、弱的空间自相关性,随机性因素引起的空间变异逐渐增大[22],变程反映了区域化变量存在空间自相关性的距离上限。基于半方差函数模型,在ArcGIS10.2中完成克里格插值。冗余分析采用Canoco 5.0进行,并采用Forward selection和Monte Carlo permutation test进行环境因子重要性排序和显著性检验。
2. 结果与分析
2.1 SOC及SOCD的分布特征
不同植被类型的SOC、SOCD差异显著(P < 0.01)(表2),SOC含量表现为RAS(146.45 g/kg) > CAM(95.60 g/kg) > RTS(60.43 g/kg),RAS分别较CAM和RTS的SOC含量高53.19%、142.35%,SOCD表现为CAM(7.34 kg/m2) > RAS(6.32 kg/m2) > RTS(4.80 kg/m2),CAM分别较RAS和RTS高22.31%、61.04%。该研究区SOC和SOCD均具有中等程度的空间变异。
表 2 SOC及SOCD的描述性统计特征Table 2. Descriptive statistics of SOC and SOCD指标
Item植被类型
Vegetation type样本量
Sample size平均值
Mean最大值
Max.最小值
Min.变异系数
CV/%P 分布类型
Distribution typeSOC/(g·kg−1) CAM 33 95.60 ± 44.31b 219.85 49.63 46.35 0.169 N RTS 36 60.43 ± 25.73a 148.31 24.01 42.58 0.359 N RAS 36 146.45 ± 49.67c 252.15 69.10 33.92 0.500 N SOCD/(kg·m−2) CAM 36 7.73 ± 2.39c 12.77 4.50 30.92 0.538 L RTS 36 4.80 ± 2.01a 8.92 1.90 41.88 0.943 N RAS 36 6.32 ± 1.98b 11.22 1.53 31.33 0.747 N 注:不同小写字母表示植被类型之间SOC或SOCD差异显著(P < 0.01)。N为正态分布;L为对数正态分布。Notes: different lowercase letters indicate significant differences in SOC or SOCD between vegetation types (P < 0.01). N means normal distribution; L means lognormal distribution. 在K-S检验结果如表2所示,CAM的SOC在剔除3个异常值后符合正态分布,SOCD则符合对数正态分布,RTS及RAS的SOC和SOCD均符合正态分布。
2.2 SOC及SOCD的空间自相关性
本研究以最大间距的1/2(35.56 m)为样本变化范围,以最小间距(10 m)为步长,并以平均预测误差(ME)最接近于0,决定系数(R2)和均方根标准预测误差(RMSSE)最接近于1交叉验证模型精度,最优模型如图2所示。
在不考虑各向异性的前提下,除RAS外,CAM和RTS的SOC、SOCD均得到了较好的拟合(表3)。CAM、RTS的SOC最优拟合为球状模型(spherical model),R2分别达0.998、0.432,ME依次为3.268、0.506,RMSSE为0.920、1.057;RAS的SOC最佳拟合模型为线性模型(linear model),R2为0.091,拟合效果较差。3种植被类型SOCD的拟合效果均较好,CAM、RTS及RAS分别符合指数模型(exponential model)、球状模型和线性模型,R2达0.965、0.864和0.996,ME在−0.145 ~ 0.021之间,RMSSE在1.017 ~ 1.059之间。
表 3 不同植被类型SOC及SOCD半方差函数模型及交叉验证Table 3. Semivariogram and cross-validation of SOC and SOCD under different vegetation types指标
Item植被类型
Vegetation
type理论模型
Theoretical model块金值
Nugget
(C0)基台值
Sill
(C0 + C)结构比
Structure ratio
(C0/(C0 + C))/%变程
Range (A0)/
m决定系数
Determination
coefficient (R2)预测误差 Prediction error ME RMSSE SOC CAM 球状模型 Spherical model 25.00 1716.00 1.46 30.29 0.998 −3.268 0.920 RTS 球状模型 Spherical model 58.00 721.30 8.04 17.68 0.432 0.506 1.057 RAS 线性模型 Linear model 2338.32 2338.32 100.00 32.69 0.091 −1.009 1.068 SOCD CAM 指数模型 Exponential model 0.01 4.67 2.14 20.31 0.965 −0.145 1.042 RTS 球状模型 Spherical model 0.58 4.64 12.51 17.44 0.864 0.021 1.059 RAS 线性模型 Linear model 4.00 4.00 100.00 32.69 0.996 −0.065 1.017 从结构比来看,除RAS外,其他植被类型的SOC及SOCD均具有强烈的空间自相关性。CAM与RTS的SOC结构比分别为1.46%、8.04%,SOCD结构比分别为2.14%、12.51%,即CAM < RTS < 25%,结构性因素引起的空间变异大于75%,具有较强的空间依赖性。RAS的SOC及SOCD块金值等于基台值,结构比达100%,属于纯块金方差,空间自相关性较弱,随机性因素控制为主。
从变程来看,SOC、SOCD的空间变异尺度存在差异,反映出不同程度的空间连续性。3种植被类型SOC的变程表现为RAS(32.69 m) > CAM(30.29 m) > RTS(17.68 m),SOCD为RAS(32.69 m) > CAM(20.31 m) > RTS(17.44 m),即SOC、SOCD的空间连续性从RAS、CAM到RTS逐渐变差。除RNS外,CAM和RTS的空间变程均表现为SOC > SOCD,即SOC可能较SOCD具有更大的空间自相关距离,在考察SOC含量时的采样可以适当加大采样间距。
2.3 SOC及SOCD的空间分布
本研究RAS的SOC及SOCD空间上主要受随机因素控制,故不适合做空间插值[23]。CAM及RTS的SOC及SOCD的空间分布如图3所示。总体而言,SOC及SOCD呈斑状或条带状分布,并且同一植被类型的SOC与SOCD空间分布相似。其中CAM的SOC、SOCD高值区集中分布在样地南部和东部边缘,分别在90.29 ~ 219.85 g/kg、8.05 ~ 14.05 kg/m2之间,并且由北部、西部边缘向中部延伸分别形成两个低值分布带,值在49.63 ~ 90.29 g/kg、8.05 ~ 14.50 kg/m2之间。RTS的SOC、SOCD具有相似的高低值分布区,高值区SOC、SOCD分别为56.63 ~ 148.31 g/kg、5.31 ~ 13.09 kg/m2范围,低值区分别在24.01 ~ 56.63 g/kg和2.67 ~ 5.31 kg/m2范围,但与CAM相比,RTS的SOC及SOCD均未表现出明显的边缘效应,而呈高低值交错分布的特征,空间连续性较差。
![]() 图 3 SOC及SOCD的水平分布格局Figure 3. Horizontal distribution patterns of SOC and SOCD under different vegetation types
图 3 SOC及SOCD的水平分布格局Figure 3. Horizontal distribution patterns of SOC and SOCD under different vegetation types2.4 SOC和SOCD与土壤因子的相关性分析
如图4所示,RDA排序图的典型轴1和轴2解释了SOC、SOCD与土壤性质总体变异的58.2%。土壤含水率、TN在SOC箭头连线上的投影长度最长,表明其与SOC呈较强的正相关性,土壤密度、pH在SOC箭头反向延长线上的投影较长,表明二者与SOC呈较强的负相关性,而土壤机械组成、坡度、TP与SOC的相关性不大。SOCD与SOC呈正相关性,但与土壤各性质的相关性不如SOC显著,主要与TP、TN的关系较为密切。
![]() 图 4 SOC及SOCD与土壤因子相关性的冗余分析排序图SOC. 土壤有机碳;SOCD. 土壤有机碳密度;TN. 全氮;TP. 全磷;Water content. 含水率;Soil density. 土壤密度;Slope. 坡度;Clay. 黏粒;Silt.粉粒;Sand. 砂粒。SOC, soil organic carbon.; SOCD, soil organic carbon density; TN, total nitrogen; TP, total phosphorus.Figure 4. Redundancy analysis on the correlation between SOC and SOCD with soil properties
图 4 SOC及SOCD与土壤因子相关性的冗余分析排序图SOC. 土壤有机碳;SOCD. 土壤有机碳密度;TN. 全氮;TP. 全磷;Water content. 含水率;Soil density. 土壤密度;Slope. 坡度;Clay. 黏粒;Silt.粉粒;Sand. 砂粒。SOC, soil organic carbon.; SOCD, soil organic carbon density; TN, total nitrogen; TP, total phosphorus.Figure 4. Redundancy analysis on the correlation between SOC and SOCD with soil properties由表4可知,各土壤因子对SOC、SOCD的影响存在一定差异。各土壤因子对SOC、SOCD影响的重要性排序从大到小依次为含水率 > 土壤密度 > pH > TN > 黏粒 > 砂粒 > 粉粒 > 坡度 > TP,除TP对SOC、SOCD的影响未达显著水平外(P > 0.05),其他土壤因子对SOC、SOCD的影响均达极显著水平(P < 0.01),其中含水率、土壤密度和pH因子对SOC、SOCD空间变异的贡献率较高,分别为69.60%、65.70%、53.50%,其次是TN和黏粒,贡献为44.20%和30.10%。表明土壤含水率、土壤密度、pH是影响研究区SOC、SOCD空间分布的关键因素。
表 4 土壤因子解释量及显著性检验Table 4. Explanation rate and significance test of soil factors土壤因子
Soil
factor重要性排序
Importance
ranking因子解释量
Factor explanation
rate/%F P 含水率 Water content 1 69.60 98.40 0.002 土壤密度 Soil density 2 65.70 88.30 0.002 pH 3 53.50 62.10 0.002 全氮 TN 4 44.20 46.60 0.002 黏粒 Clay 5 30.10 27.80 0.002 砂粒 Silt 6 17.50 14.60 0.002 粉粒 Sand 7 15.80 13.00 0.002 坡度 Slope 8 12.50 10.00 0.004 全磷 TP 9 0.20 0.10 0.740 3. 讨 论
3.1 植被类型对SOC和SOCD的影响
本研究中植被类型显著影响了表层0 ~ 10 cm土壤有机碳含量(P < 0.01),与前人研究结果一致[24-25]。表层SOC含量为RAS > CAM > RTS,与植被覆盖度规律一致(表1),即RAS(> 95%) > CAM(95%) > RTS(75%)。这是因为自然生态系统植被枯落物是表层土壤有机碳的重要来源,并与植被覆盖度显著正相关。研究区SOC含量处于较高水平,均值达100.97 g/kg,显著高于全国0 ~ 10 cm土壤水平(24.56 g/kg)[26]。与相似生态类型区比较,CAM的SOC(95.60 g/kg)亦高于青海省河南县杂类草型草甸(74.99 g/kg)[27]和江西省武功山草甸(63.52 g/kg)[28],两种灌丛SOC的平均含量(103.44 g/kg)亦显著高于燕山北部绣线菊(Spiraea salicifolia)灌丛(37.65 g/kg)和榛子(Corylus heterophylla)灌丛(64.74 g/kg)[29]。这可能与低温抑制酶活性、减缓土壤有机质的矿化分解有关[30],该区域年均气温仅0.64 ℃,且降水丰富,年降雨达877 mm,有利于表层有机质的积累。SOCD与SOC的表现基本一致,CAM(7.73 kg/m2)、RTS(4.8 kg/m2)和RAS(6.32 kg/m2)的SOCD显著高于全国10 cm土壤厚度的SOCD(1.21 kg/m2)[31],表明色季拉山高海拔区土壤有机碳储量较丰富,可能成为未来大气CO2浓度升高的潜在碳源。
3.2 SOC及SOCD的空间异质性
本研究小空间尺度上,植被类型影响了表层土壤有机碳的空间分布与变异特征。SOC和SOCD的空间变异半方差函数分析结果表明,拟合度以CAM最佳,其次为RTS,而RAS则较差。这可能是由于小空间尺度上RAS地表地形及植被、枯落物等基本立地条件较为破碎有关,故可能需要增加采样点或缩小采样间距[32]。结构比反映了引起变量空间异质性的主要影响因素,本研究中CAM、RTS的SOC、SOCD结构比均小于13%,由结构性因素引起的空间异质性占总空间异质性的87.49% ~ 98.54%,表明小尺度空间范围,在气候、土壤类型一致的前提下,地面枯落物量、微地形、土壤理化性质等结构性因素是表层SOC、SOCD空间变异的主要原因。而RAS的SOC、SOCD表现为以人为干扰等随机因素控制为主,考虑是采样间距大于其空间变异尺度引起的[33]。
变程反映的是变量的空间自相关范围,在变程内的变量才具有空间自相关性[23]。本研究中CAM和RTS的SOC、SOCD变程均大于取样距离(10 m),表明本研究在该小尺度下设置的采样间距是合理的,可以反映SOC、SOCD的空间异质性。对于RAS而言,10 m可能超出了其SOC、SOCD空间自相关的最大距离,而未表现出空间结构性,反映了SOC、SOCD的尺度效应。本研究中,SOC由空间自相关部分引起的变异占总变异的91.96% ~ 98.54%,表现在30.29 m以下的范围,与辽东山区次生林[34]土壤有机质由空间自相关引起的变异占总变异的65.40%,发生在46.77 m尺度以内相比,本研究SOC在较小尺度内存在较强的空间自相关性,表明色季拉山微生境比较复杂,SOC的空间破碎化严重。
3.3 SOC及SOCD水平分布格局的影响因素分析
SOC空间分布受多种因素的综合影响,其中土壤含水率、微地形是影响该研究区SOC空间分布格局的重要环境变量。CAM样地东、南边缘是SOC、SOCD高值的集中分布区,该边缘与嵩草沼泽化草甸接壤,土壤含水率较高(多数采样点超过100%),在低温通气不良的条件下,微生物活动受限,植物残体和根系不易分解,使土壤有机物质大量积累,符合冗余分析中SOC与土壤含水率极显著正相关的规律。在CAM的中部到北部边缘,存在一条东西方向的沟壑,在地面径流的作用下,导致土壤中可溶性有机碳向地势较低的东部边缘迁移,可能是CAM北部低值分布带形成的主要原因,与石峰[35]关于土壤无机氮的研究结果一致,表明在小尺度空间范围,微地形可能成为土壤养分空间分布的主要驱动因子[36-37]。在本研究中,坡度与SOC、SOCD的相关性较低(P > 0.05),这与Ritchie等[38]的研究结果相异,可能是水、热等条件的差异弱化了小尺度下坡度对SOC、SOCD的影响[39]。
研究区RTS样地为裸地、草本和灌丛镶嵌性分布,可能是其SOC、SOCD空间连续性较CAM差,破碎化程度高的原因。有研究表明土壤有机碳含量与灌丛凋落物生物量呈正相关性[40],在本研究中,灌丛斑块地上凋落物数量明显高于灌丛间裸地、草地斑块,导致交错分布的不同斑块下表层SOC存在差异,从而表现出空间异质性,与何俊龄[41]的研究结果一致,其研究亦表明金露梅(Potentilla fruticosa)灌丛表层土壤养分含量显著高于灌丛间草地。本研究未对RAS的SOC、SOCD进行空间插值,但其纯块金效应的出现表明其SOC、SOCD的空间连续性可能较差,事实上RAS微地形较复杂,平均坡度达25°,且地面枯落物分布不均匀,厚度0 ~ 10 cm不等,因此有待更小尺度的研究。
土壤密度、pH、TN、机械组成亦是影响SOC及SOCD空间分布格局的重要因素。冗余分析结果表明,土壤密度、pH是影响研究区SOC、SOCD空间变异的关键因子,与SOC、SOCD呈极显著负相关,这一结果与卓志清等[42]、贡璐等[43]人的研究结果一致,SOC含量提高时有利于改善土壤结构,使土壤疏松多孔,降低土壤紧实度。同时在一定范围内,随着土壤酸性增强,微生物活动受限,从而导致碳的积累。土壤中TN大部分来源于土壤有机质,因此与SOC极显著正相关。本研究SOC、SOCD与土壤黏粒、粉粒呈负相关,与砂粒正相关,这是因为黏粒、粉粒含量的降低,有利于提高土壤透气性,从而加快微生物分解释放养分元素,与马文瑛等[44]、Igor等[45]的研究结果相似。
4. 结 论
(1)SOC、SOCD显著受植被类型的影响,本研究区SOC表现为RAS > CAM > RTS,SOCD为CAM > RAS > RTS。
(2)研究区CAM、RTS的SOC和SOCD主要受结构性因素的影响,具有较强的空间自相关性,二者空间自相关的最大距离在17.44 ~ 30.29 m之间,表明本研究采取的地统计采样间隔是合理的。RAS的SOC、SOCD具有纯块金效应,即随采样间隔变化,其方差均为一常量,说明本研究采取的10 m间隔采样超出了RAS 的SOC、SOCD的空间变异尺度。
(3)在水平方向,CAM的SOC、SOCD主要受含水率、微地形影响,而在样地的东部、南部边缘存在高值区,在北部存在东西向的低值分布带。RTS的SOC、SOCD呈高低值交错分布,破碎化程度高,可能与地面覆被物的镶嵌性分布有关。
(4)冗余分析表明,土壤含水率、土壤密度、pH、TN是影响表层SOC、SOCD空间变异的关键要素。
-
![]()
图 1 2017年永定河流域北京段土地利用类型
Figure 1. Land use types of Beijing section of the Yongding River Basin in 2017
![]()
图 3 永定河流域北京段3种生态系统服务的空间格局
Figure 3. Spatial pattern of three ecosystem services in Beijing section of the Yongding River Basin
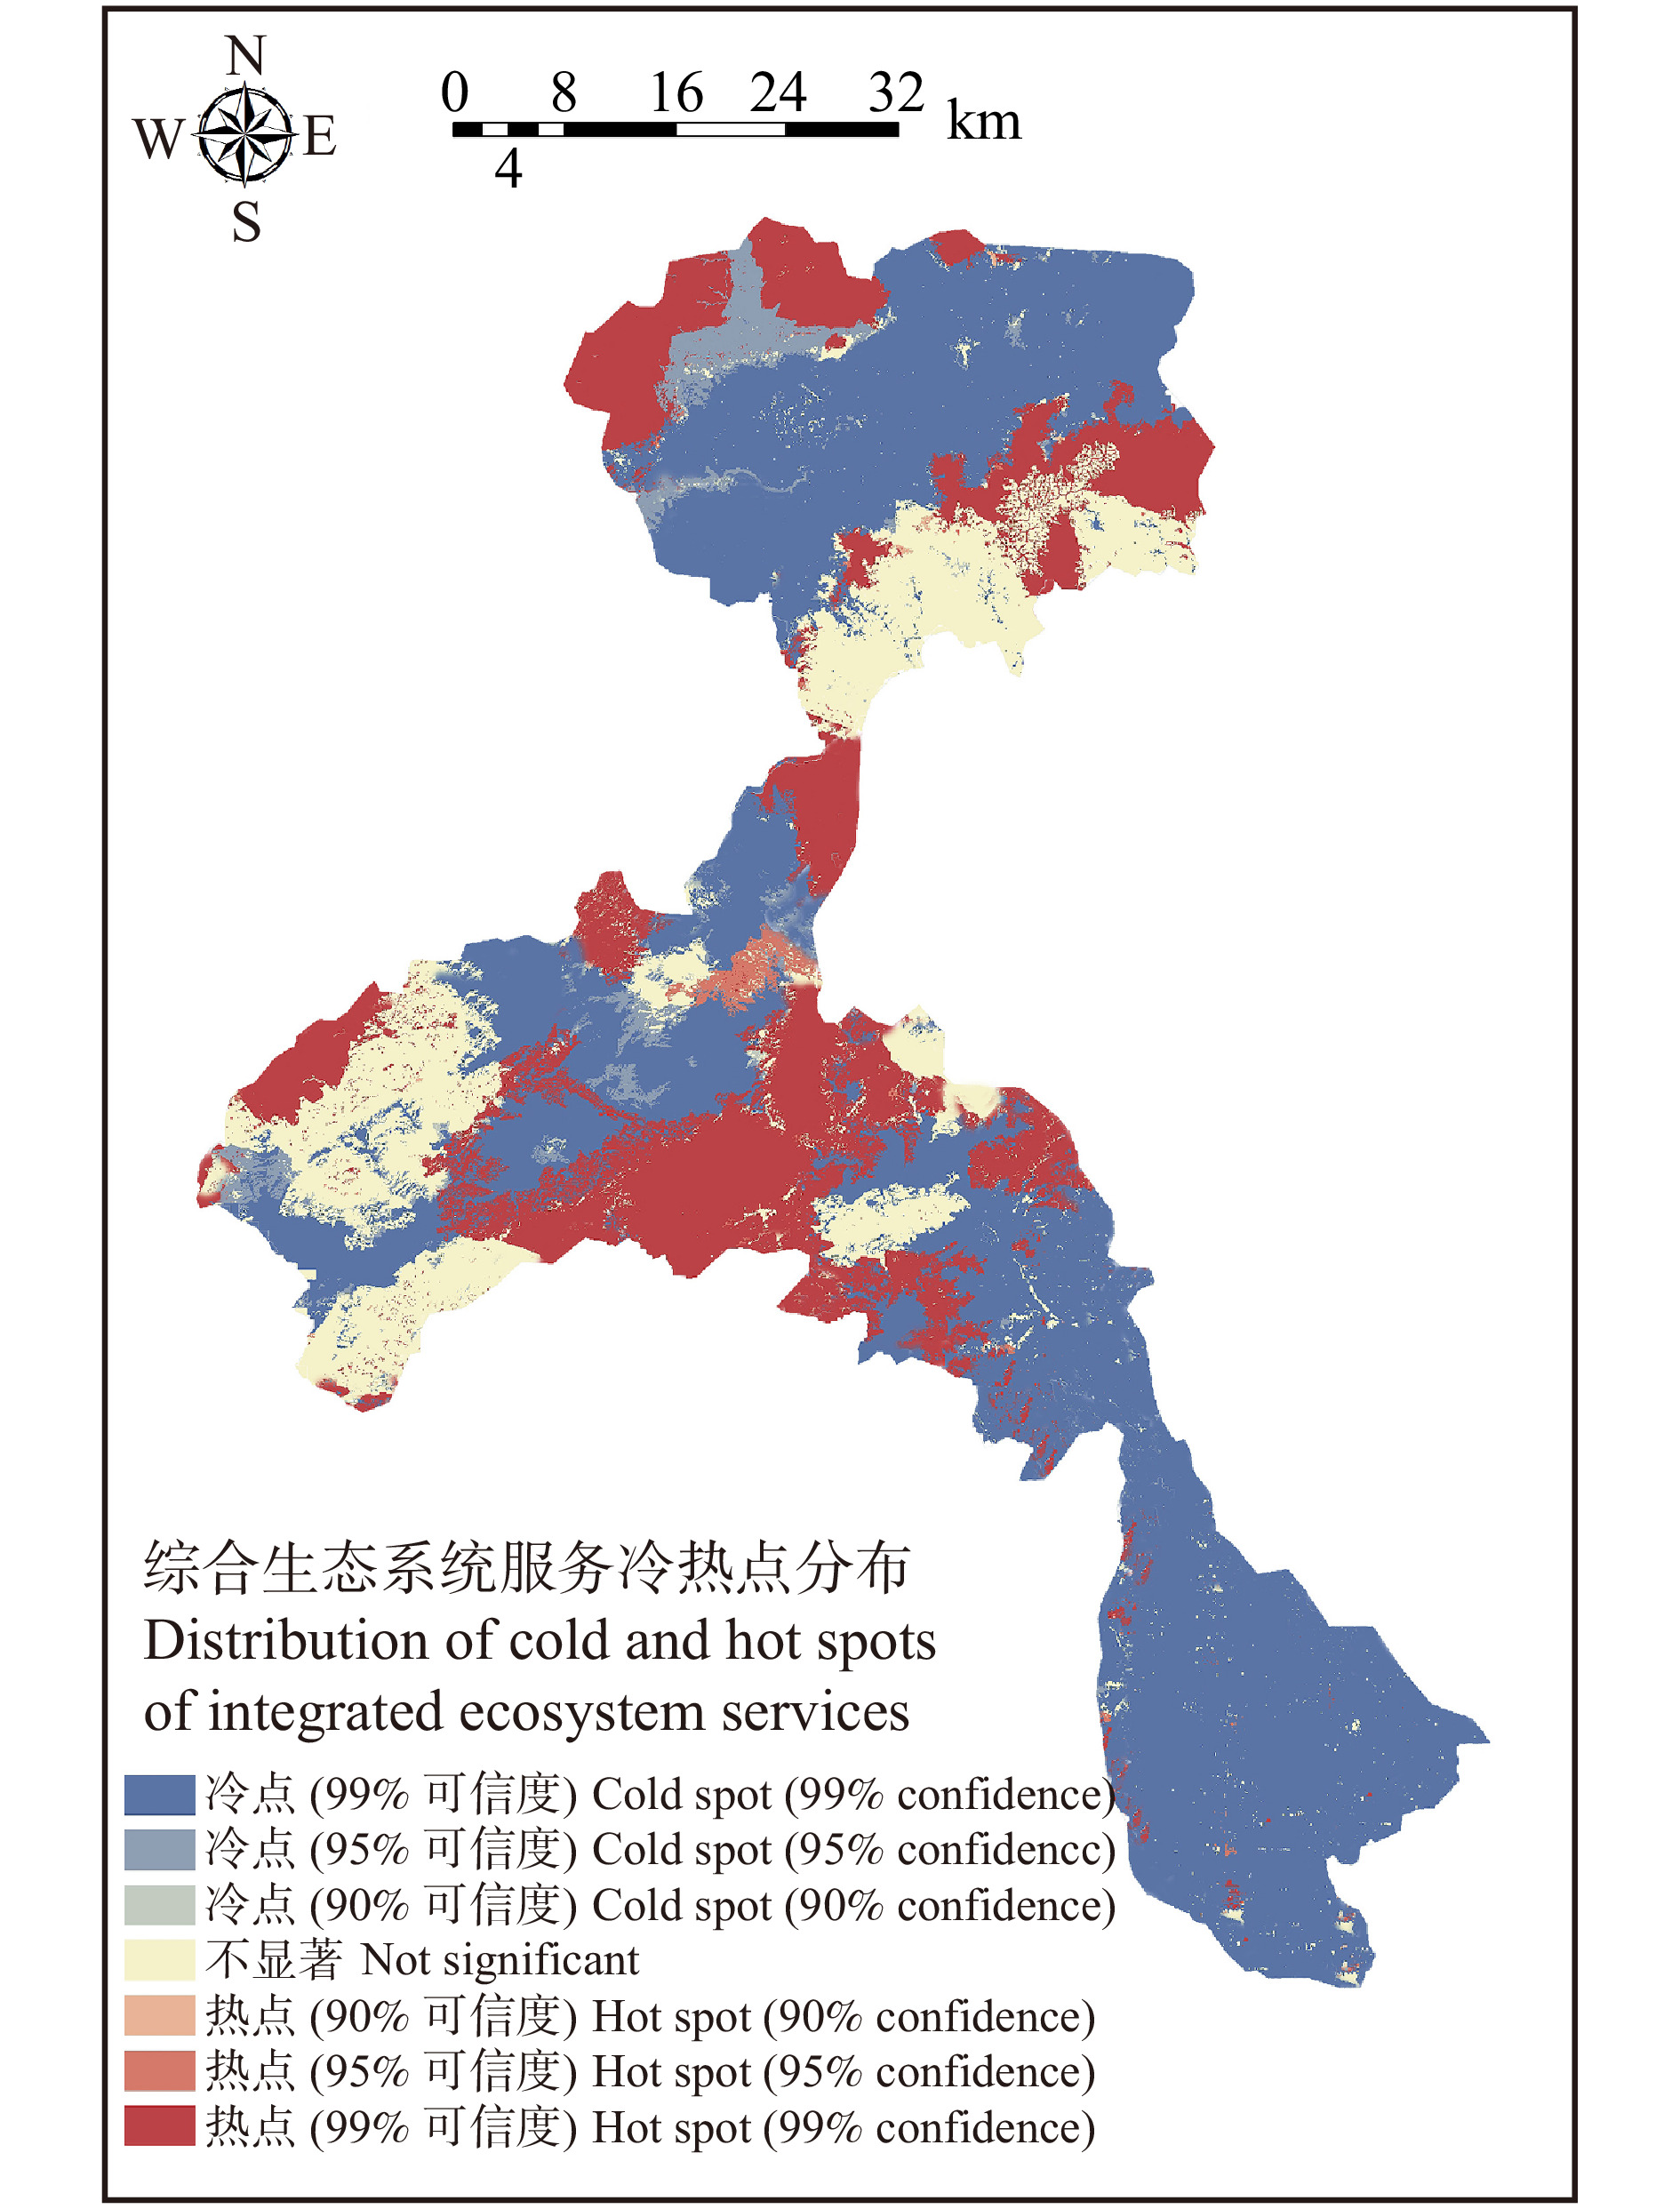
![]()
图 4 永定河流域北京段生态系统服务冷热点区域空间分布
Figure 4. Spatial distribution of cold and hot spots of ecosystem services in Beijing section of Yongding River Basin
![]()
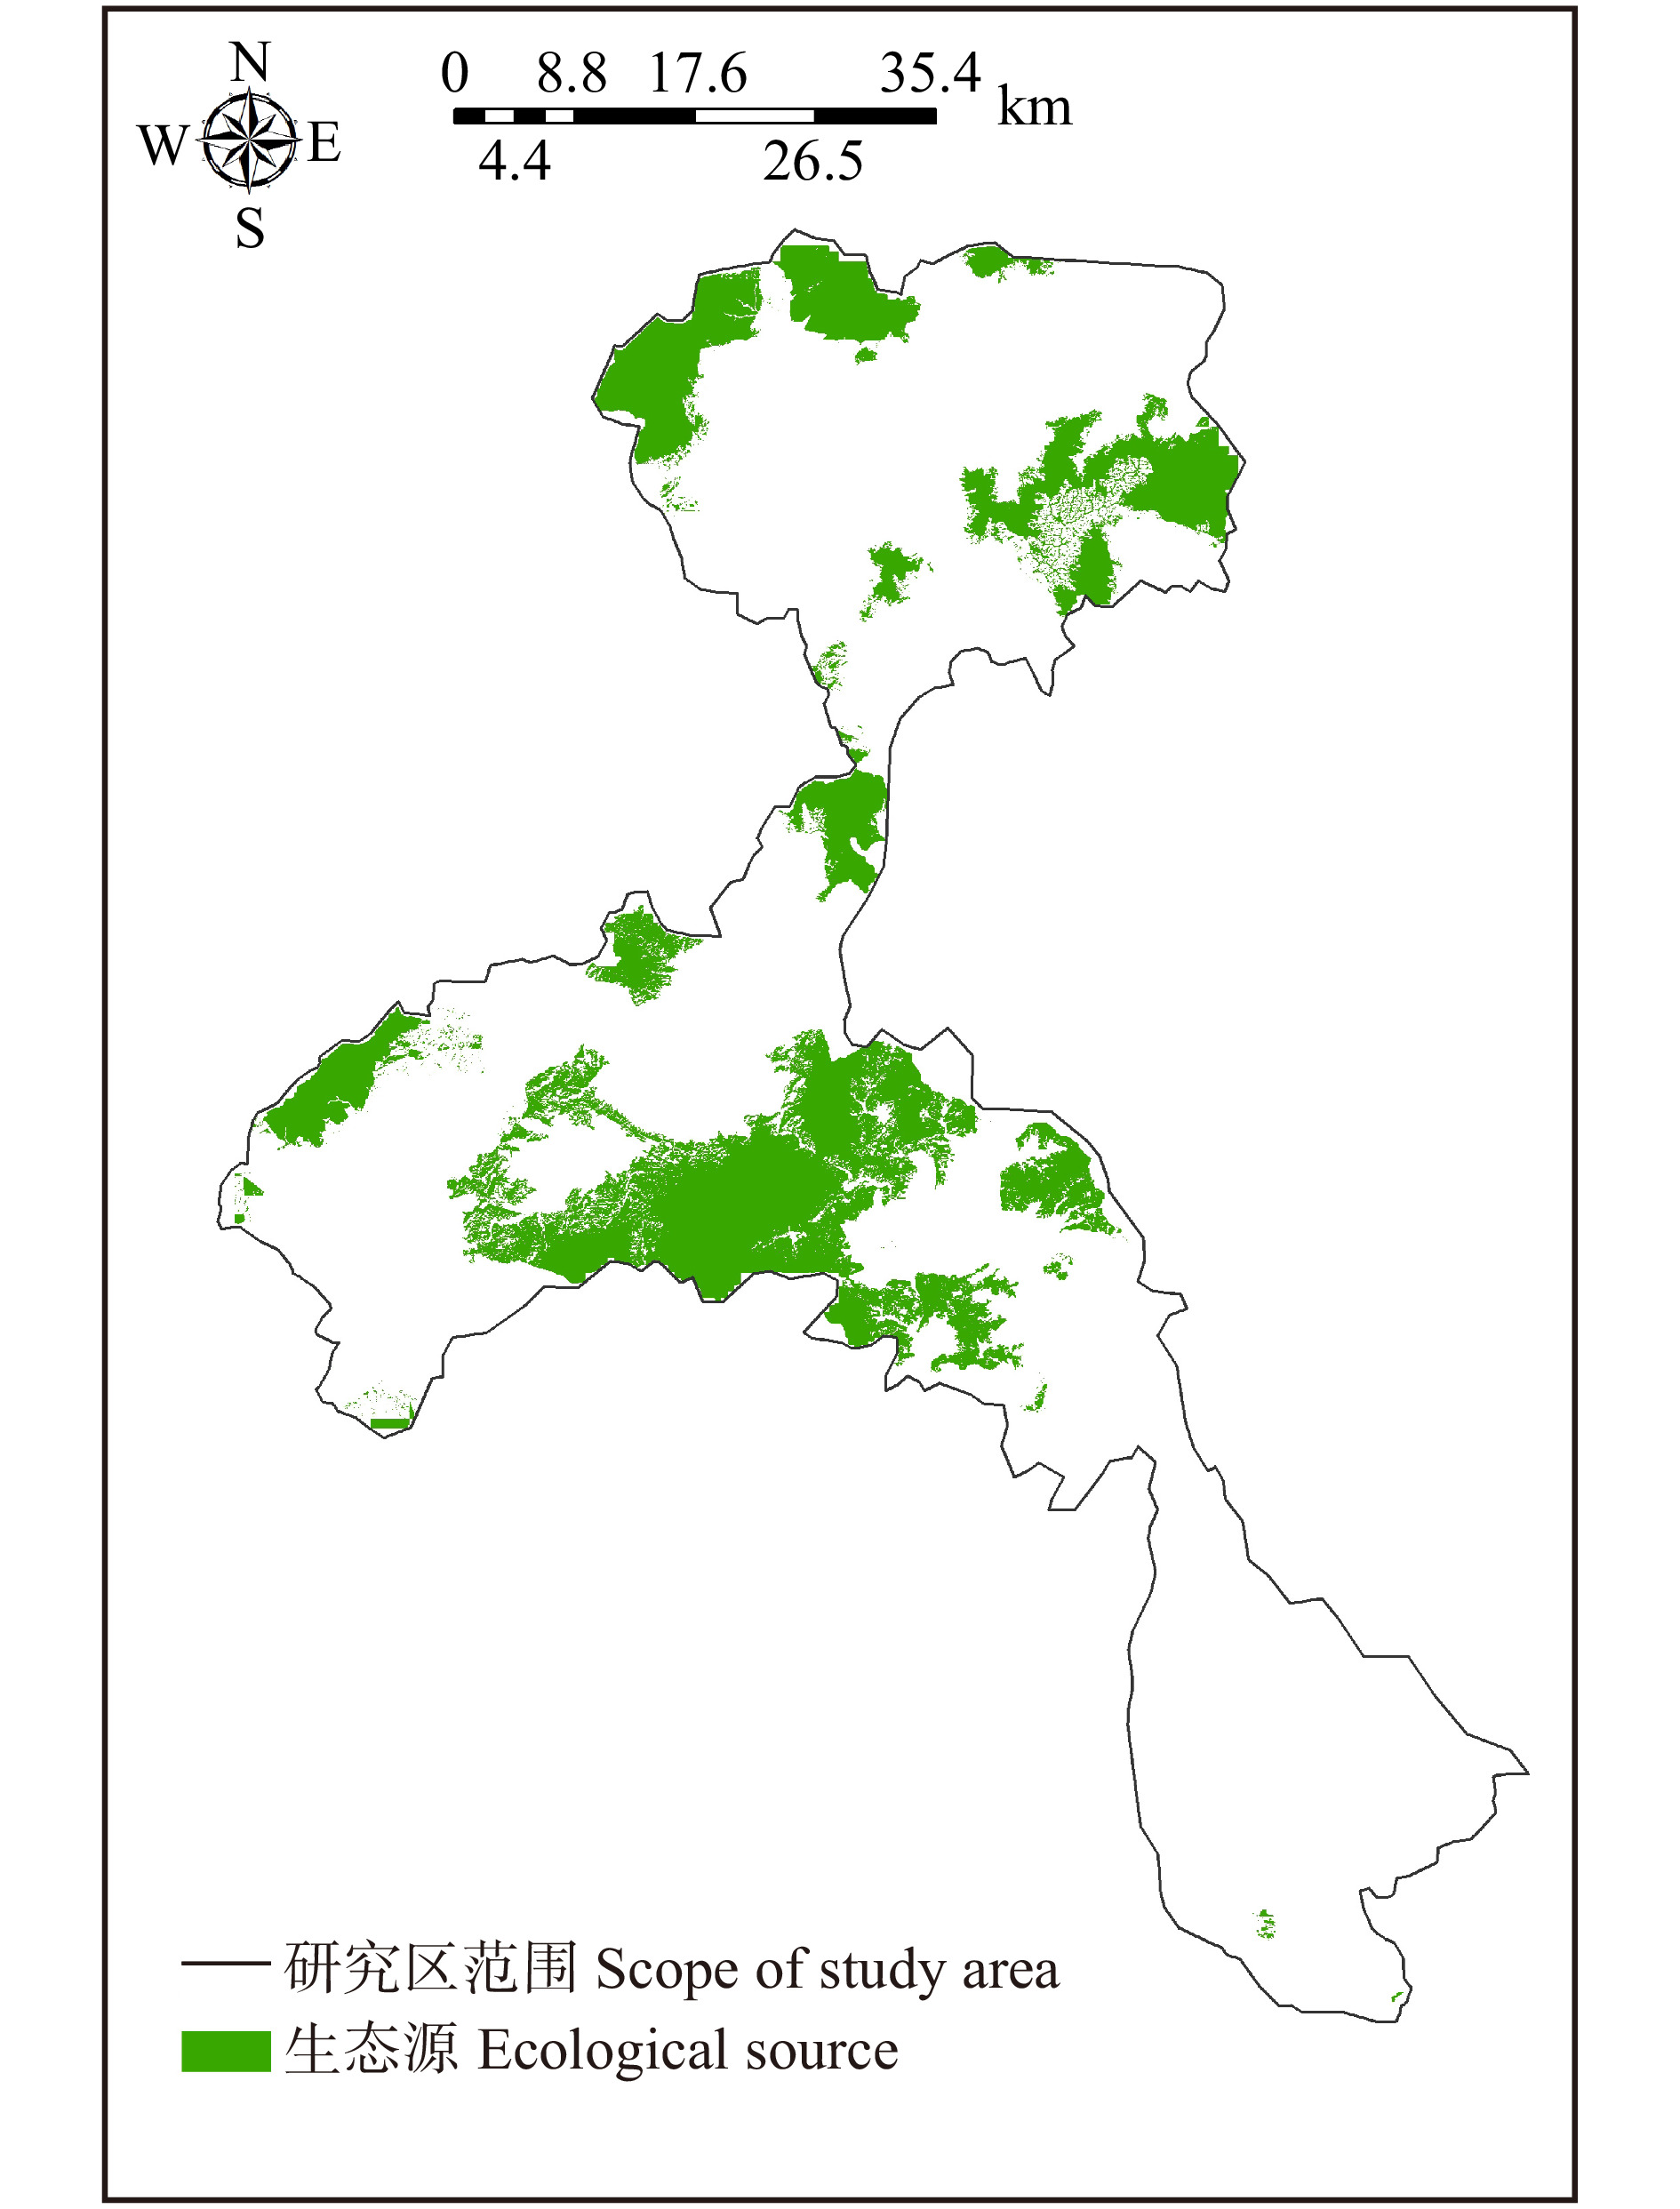
图 5 永定河流域北京段生态源分布
Figure 5. Distribution of ecological sources in Beijing section of Yongding River Basin
![]()
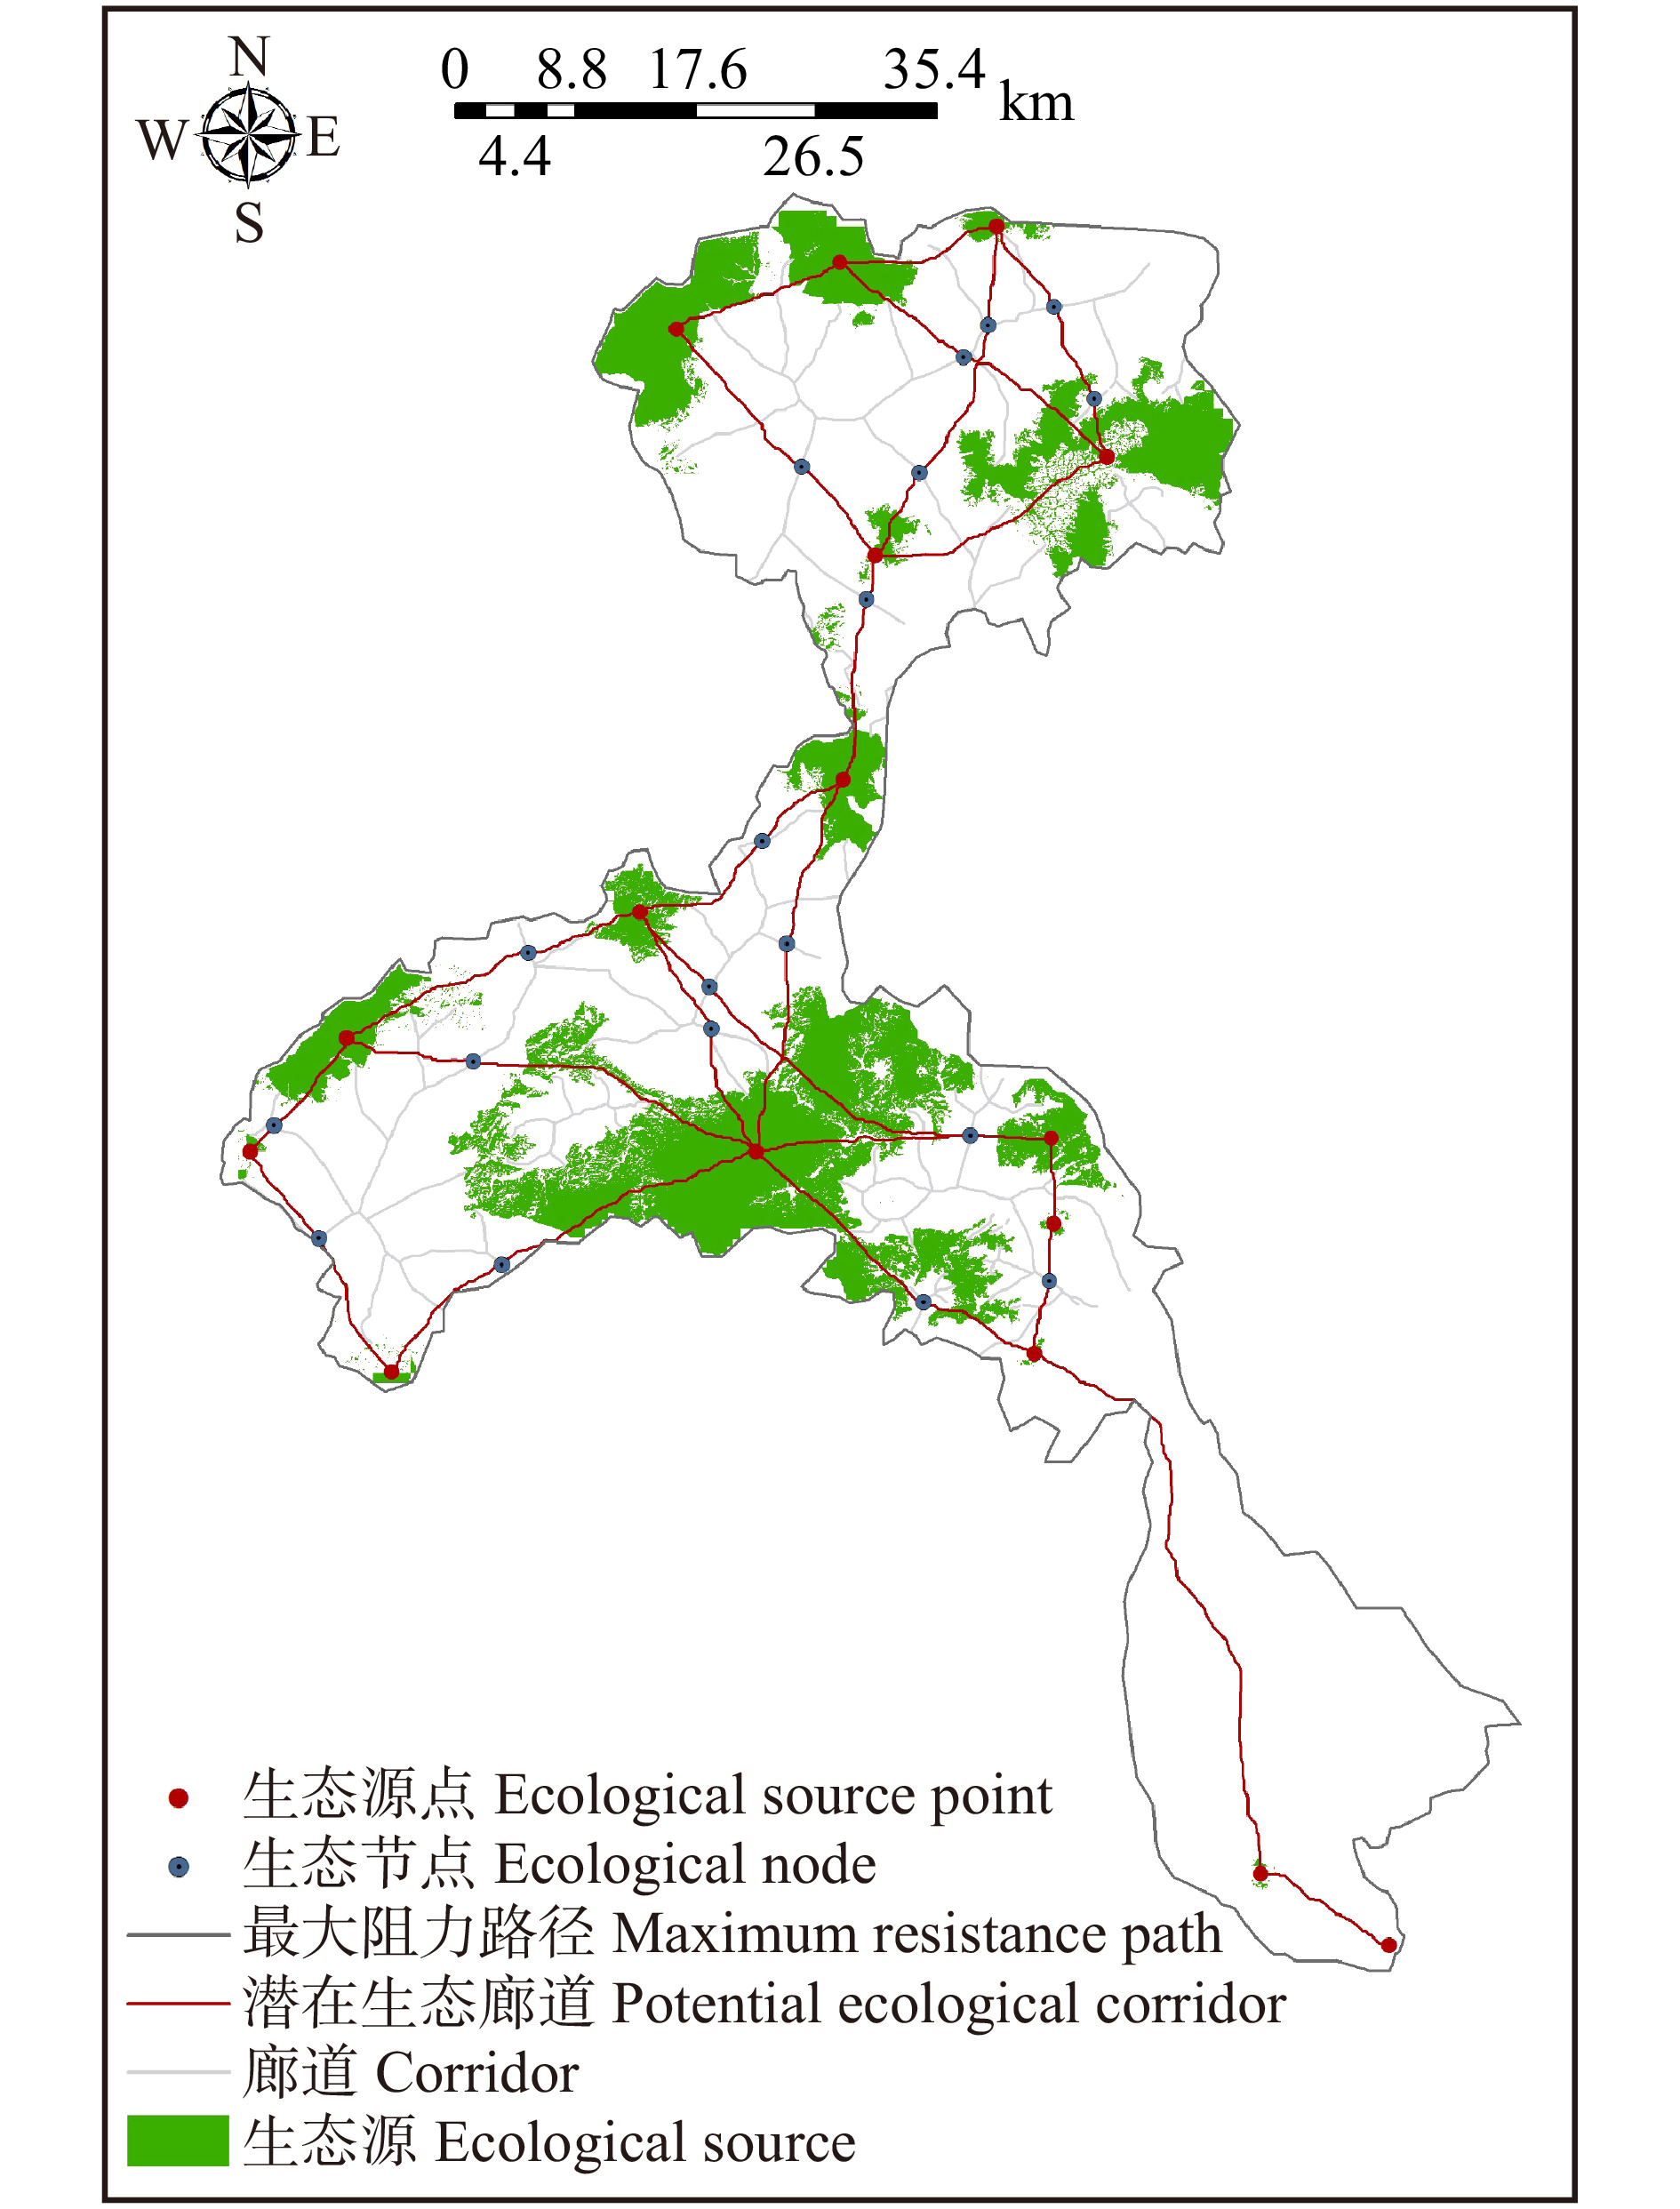
图 6 永定河流域北京段生态网络构建
Figure 6. Construction of ecological network in Beijing section of Yongding River Basin
![]()
图 7 永定河流域北京段生态源结构连接度优化结果
Figure 7. Optimization results of ecological source structure connectivity in Beijing section of Yongding River Basin
![]()
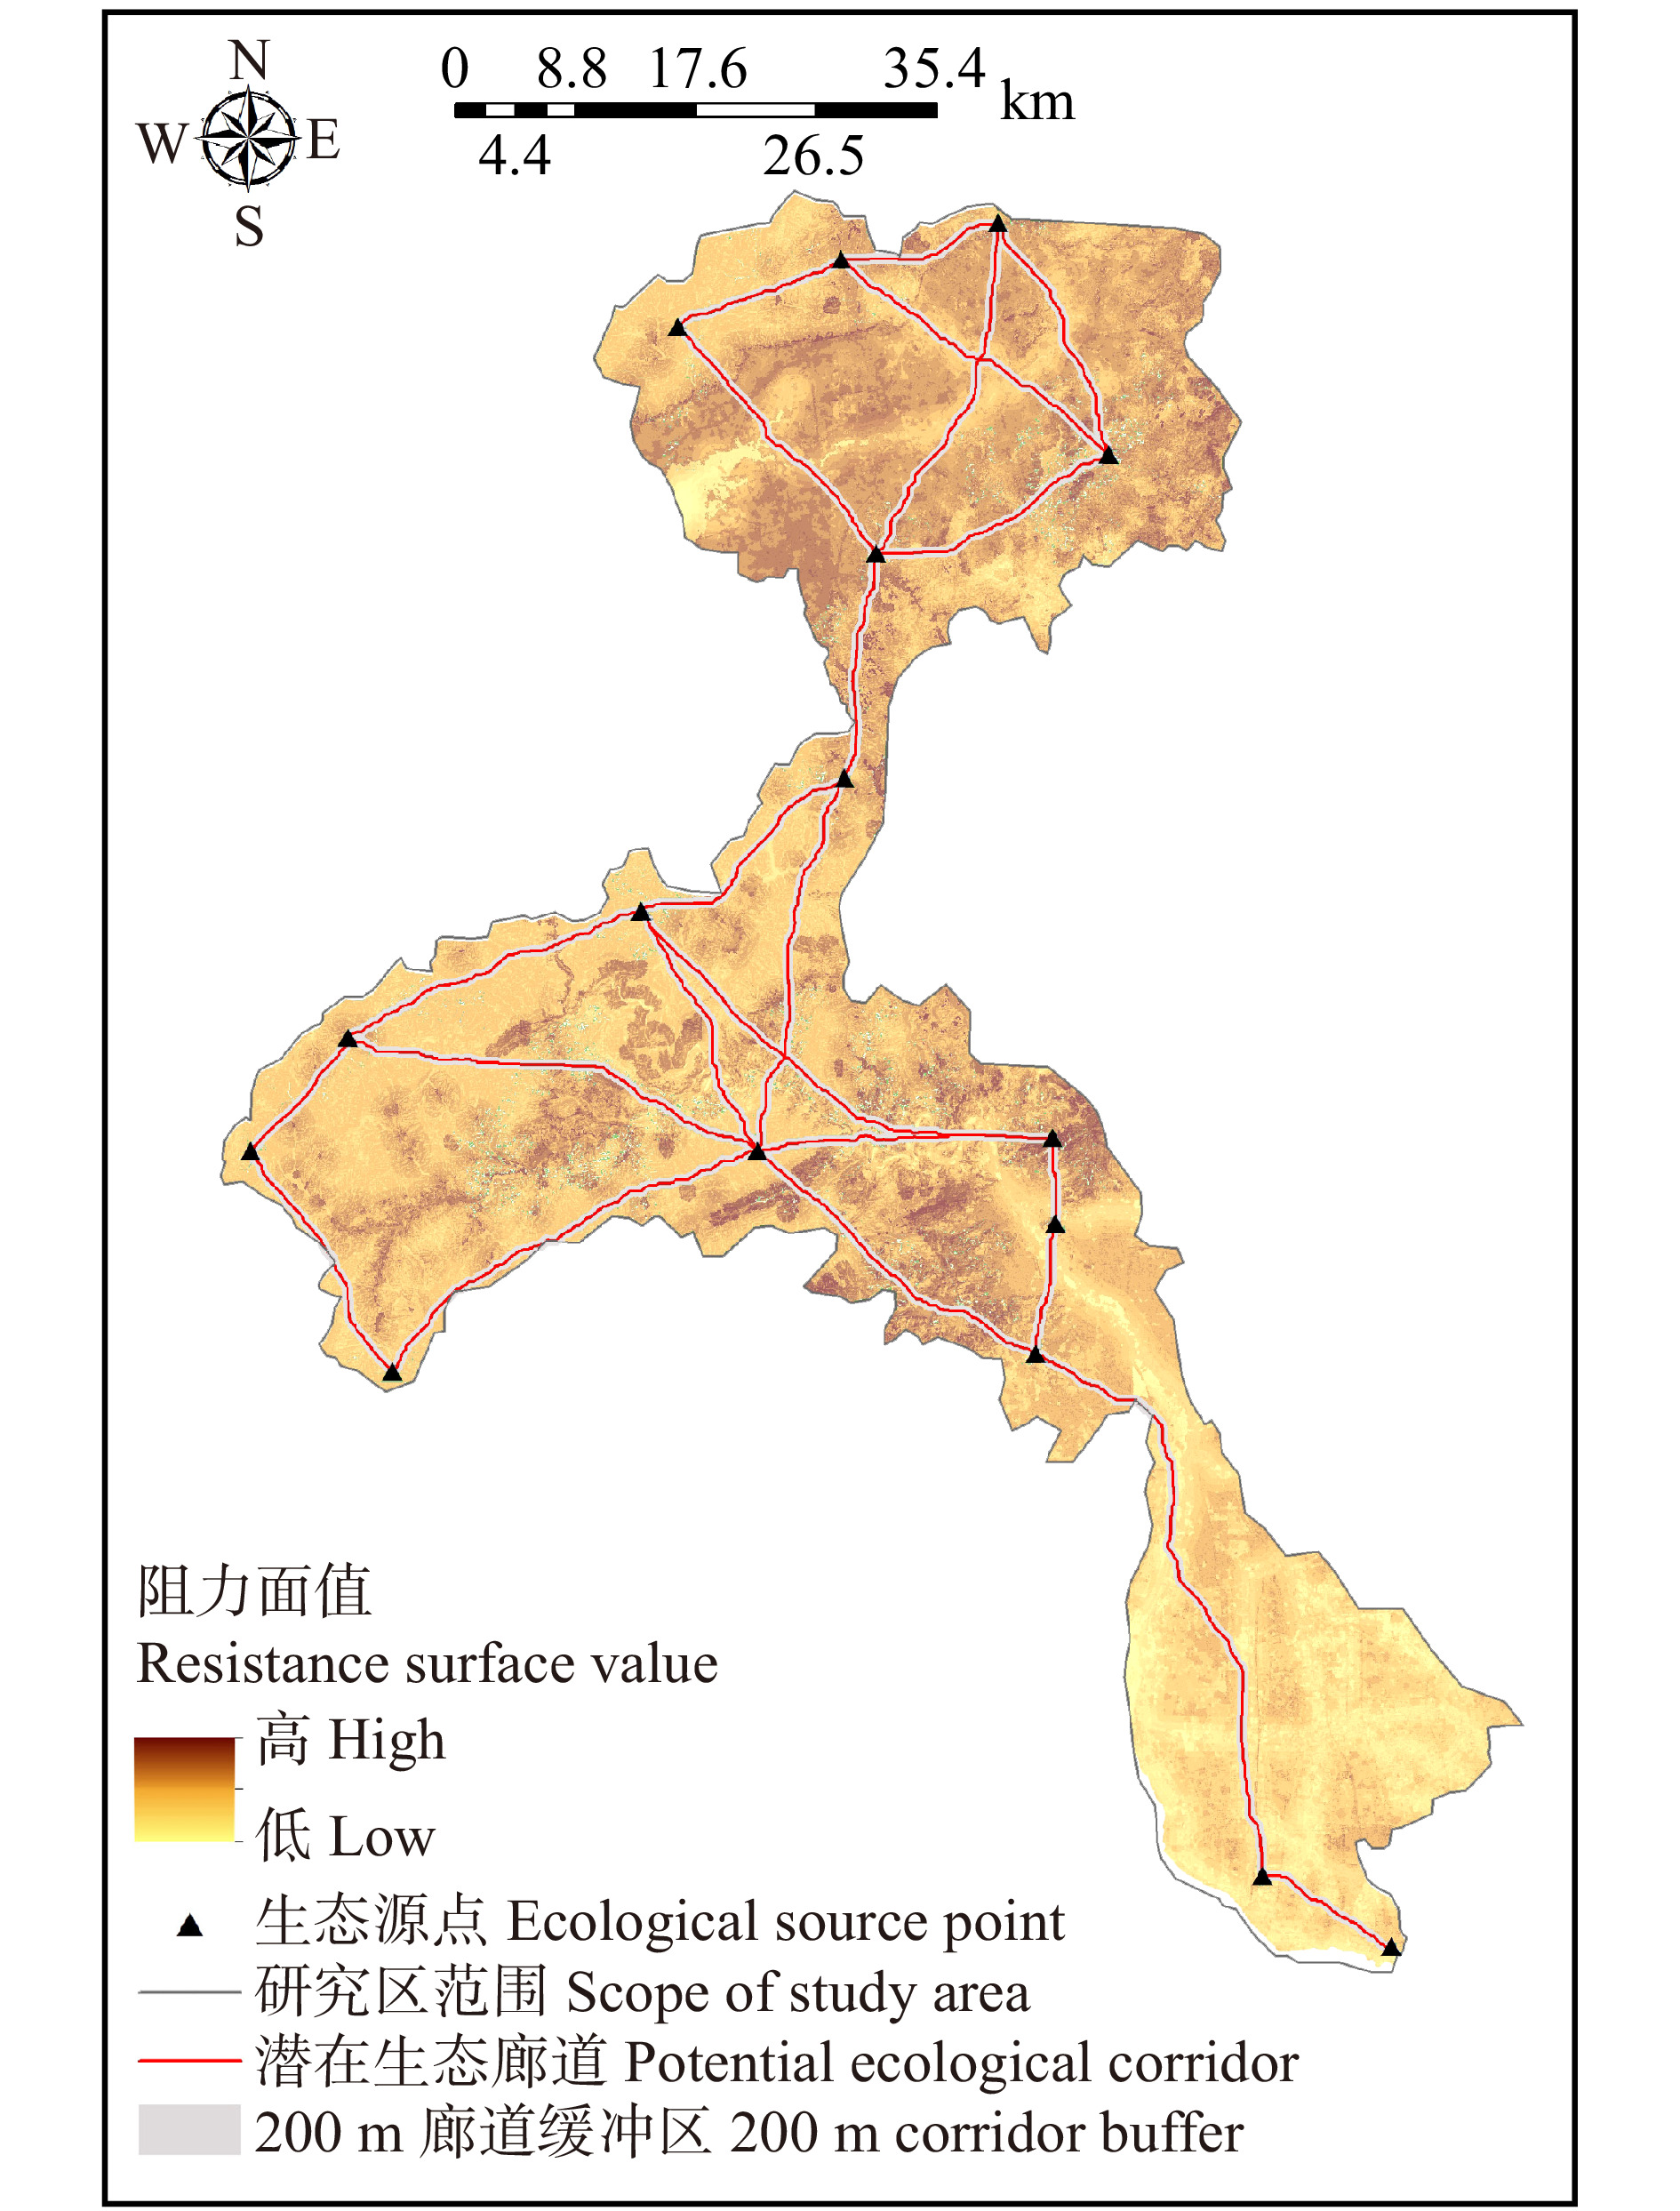
图 8 永定河流域北京段生态廊道结构连接度优化结果
Figure 8. Optimized results for structural connectivity of ecological corridors
![]()
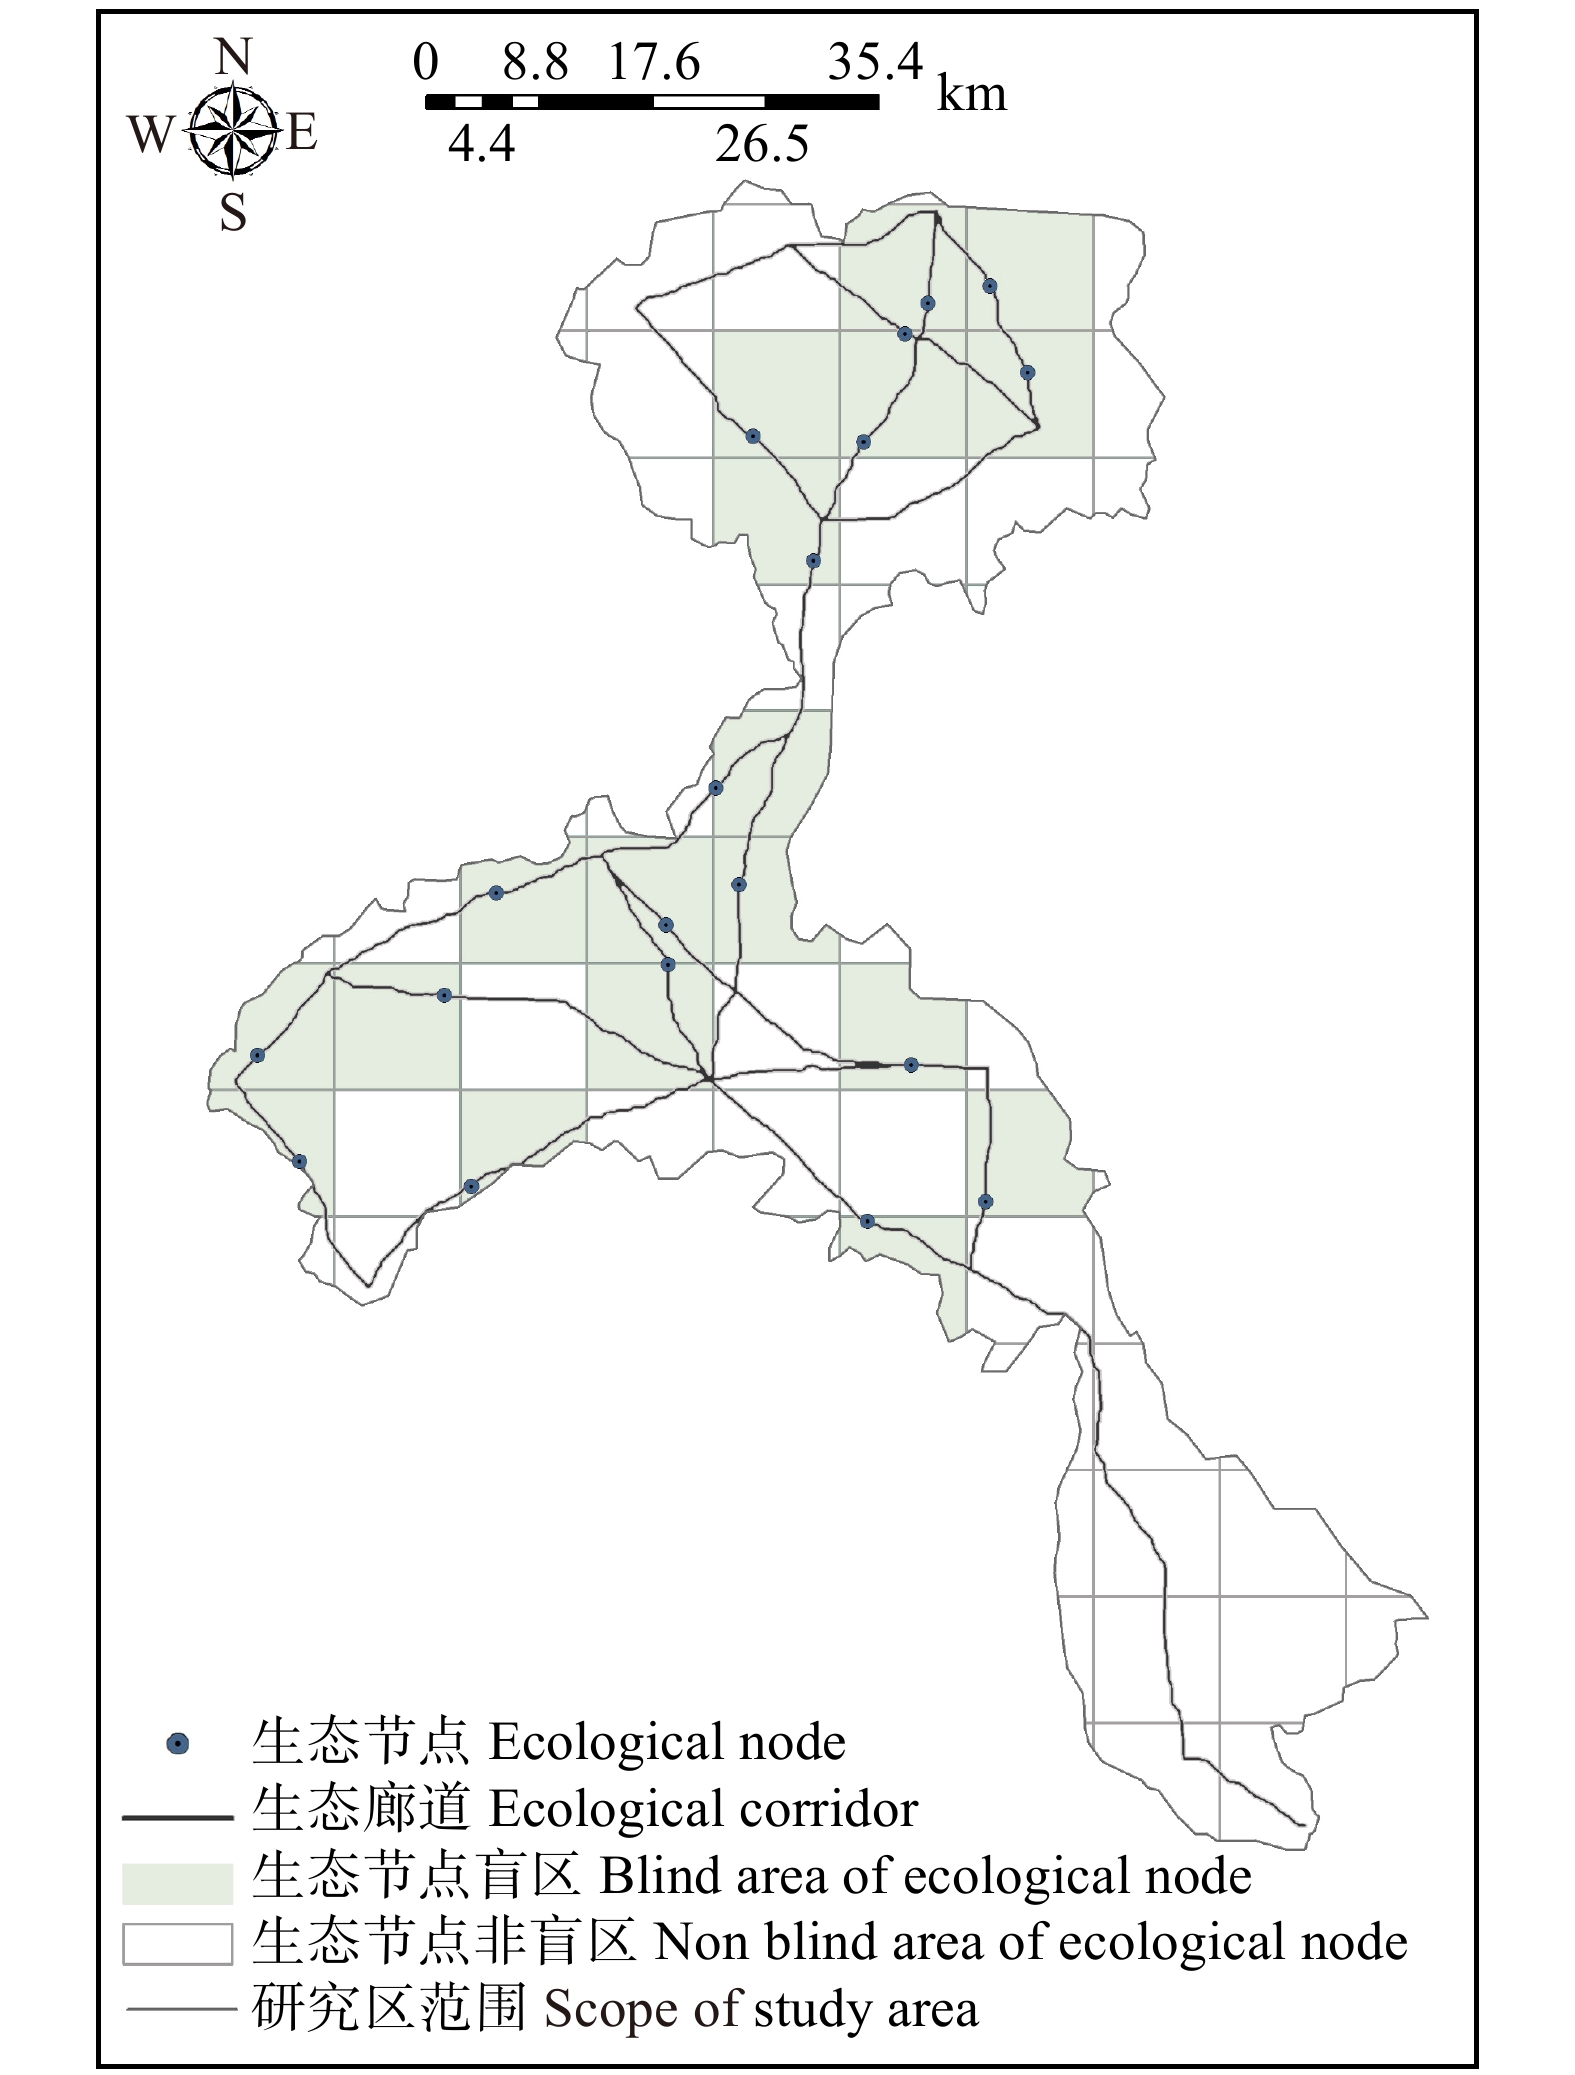
图 9 永定河流域北京段生态节点盲区识别
Figure 9. Identification of ecological node blind area in Beijing section of Yongding River Basin
表 1 产水量模块生物物理系数
Table 1 Biophysical coefficients for water yield modules
地类代码
Land use type code地类描述
Land use type description蒸散系数
Evaporation coefficient(Kc)根系深度
Root depth/mm1 耕地 Arable land 0.650 2 100 2 林地 Woodland 1 7 000 3 草地 Grassland 0.850 2 600 4 灌木地 Shrubland 0.398 5 100 5 湿地 Wetland 1 1 000 6 水域 Water area 1 1 000 7 建设用地 Construction land 0.400 1  下载: 导出CSV
表 2 不同土地利用类型的植被经营管理因子(Ci)
和土壤保持措施因子参数(Pi) Table 2 Vegetation management factor (Ci) and soil conservation measure factor parameter (Pi)
for different land use types 项目
Item耕地
Arable land林地
Woodland草地
Grassland灌木地
Shrubland湿地
Wetland水域
Water area建设用地
Construction landCi 0.500 0.030 0.010 0.010 0.001 0.001 0.001 Pi 0.400 0.200 0.200 0.200 0.001 0.001 0.001
下载: 导出CSV
表 3 威胁源属性
Table 3 Threat source attributes
威胁因子
Threat factor最大影响距离
Maximum impact distance/km权重
Weight衰减方式
Attenuation mode耕地 Arable land 1 0.6 线性 Linear 道路 Road 5 0.5 线性 Linear 城镇用地 Urban land 7 0.8 指数 Exponential 村民居住点 Village settlement 3 0.4 指数 Exponential 工矿用地 Industrial and mining land 8 0.6 线性 Linear
下载: 导出CSV
表 4 生境适宜度及其对不同威胁源的相对敏感程度
Table 4 Habitat suitability and its relative sensitivity to different threat sources
土地利用类型
Land use type生境适宜度
Habitat suitability耕地
Arable land城镇用地
Urban land道路
Road村名居住点
Village settlement工矿用地
Industrial and mining land耕地 Arable land 0.40 0.30 0.50 0.10 0.35 0.6 林地 Woodland 1 0.85 1 0.65 0.90 0.8 草地 Grassland 0.75 0.45 0.65 0.25 0.50 0.4 灌木地 Shrubland 1 0.40 0.60 0.20 0.45 0.5 湿地 Wetland 1 0.70 0.95 0.55 0.80 1 水域 Water area 1 0.70 0.90 0.50 0.80 1 建设用地
Construction land0 0 0 0 0 0
下载: 导出CSV
表 5 阻力因子及阻力值
Table 5 Resistance factors and resistance values
序号
No.权重
Weight评价指标
Evaluation index阻力值 Resistance value 1级
Level 12级
Level 23级
Level 34级
Level 41 0.18 高程 Elevation/m < 100 100 ~ 200 200 ~ 300 > 300 2 0.23 坡度 Slope/(°) < 7 7 ~ 15 15 ~ 25 > 25 3 0.30 土地利用类型 Land use type 林地(针/阔)、水体 Woodland (needle/broadleaved), water area 灌木地、草地
Shrubland, grassland耕地、其他用地 Arable land, other land 建设用地 Construction land 4 0.13 距建设用地距离 Distance from construction land/m > 1 500 1 000 ~ 1 500 500 ~ 1 000 < 500 5 0.16 距水域距离 Distance from water area/m < 500 500 ~ 1 000 1 000 ~ 1 500 > 1 500
下载: 导出CSV
表 6 永定河流域北京段生态网络结构评估
Table 6 Evaluation of ecological network structure in Beijing section of Yongding River Basin
廊道数量
Corridor number节点数量
Node number网络闭合度
Network closure(α)线点率
Line point rate(β)网络连接度
Network connectivity(γ)23 19 0.151 5 1.210 5 0.450 9
下载: 导出CSV
-
[1] 肖笃宁, 陈文波, 郭福良. 论生态安全的基本概念和研究内容[J]. 应用生态学报, 2002, 13(3): 354−358. Xiao D N, Chen W B, Guo F L. On the basic concepts and contents of ecological security[J]. Chinese Journal of Applied Ecology, 2002, 13(3): 354−358.
[2] Bolliger J, Lischke H, Green D G. Simulating the spatial and temporal dynamics of landscapes using generic and complex models[J]. Ecological Complexity, 2005, 2(2): 107−116. doi: 10.1016/j.ecocom.2004.11.005
[3] 孔阳, 王思元. 基于MSPA模型的北京市延庆区城乡生态网络构建[J]. 北京林业大学学报, 2020, 42(7): 113−121. Kong Y, Wang S Y. Construction of urban-rural ecological network in Yanqing District, Beijing based on MSPA model[J]. Journal of Beijing Forestry University, 2020, 42(7): 113−121.
[4] 刘宇舒, 赵天宇. 景观生态视角下镇域生态服务评价与网络构建[J]. 中国园林, 2015(10): 77−81. Liu Y S, Zhao T Y. Evaluation and network construction of township ecological services from a landscape ecology perspective[J]. Chinese Landscape Architecture, 2015(10): 77−81.
[5] Samways M J, Bazelet C S, Pryke J S. Provision of ecosystem services by large scale corridors and ecological networks[J]. Biodiversity & Conservation, 2010, 19(10): 2949−2962.
[6] de Montis A, Caschili S, Mulas M, et al. Urban-rural ecological networks for landscape planning[J]. Land Use Policy, 2016, 50: 312−327. doi: 10.1016/j.landusepol.2015.10.004
[7] 陈德超, 施祝凯, 王祖静, 等. 苏州环太湖地区生态网络构建与空间冲突识别[J]. 生态与农村环境学报, 2020, 36(6): 778−787. Chen D C, Shi Z K, Wang Z J, et al. Construction of ecological network and identification of spatial conflicts in the Taihu Lake Rim of Suzhou[J]. Journal of Ecology and Rural Environment, 2020, 36(6): 778−787.
[8] Liquete C, Kleeschulte S, Dige G. Mapping greezn infrastructure based on ecosystem services and ecological networks: a Pan-European case study[J]. Environmental Science & Policy, 2015, 54: 268−280.
[9] With K A, King A W. Analysis of landscape sources and sinks: the effect of spatial pattern on avian demography[J]. Biological Conservation, 2001, 99(1): 75−88.
[10] 周锐, 王新军, 苏海龙, 等. 平顶山新区生态用地的识别与安全格局构建[J]. 生态学报, 2015, 35(6): 2003−2012. Zhou R, Wang X J, Su H L, et al. Identification of ecological land in Pingdingshan New Area and construction of security pattern[J]. Acta Ecologica Sinica, 2015, 35(6): 2003−2012.
[11] 彭建, 汪安, 刘焱序, 等. 城市生态用地需求测算研究进展与展望[J]. 地理学报, 2015, 70(2): 333−346. doi: 10.11821/dlxb201502013 Peng J, Wang A, Liu Y X, et al. Research progress and prospect on measuring urban ecological land demand[J]. Acta Geographica Sinica, 2015, 70(2): 333−346. doi: 10.11821/dlxb201502013
[12] 彭建, 郭小楠, 胡熠娜, 等. 基于地质灾害敏感性的山地生态安全格局构建: 以云南省玉溪市为例[J]. 应用生态学报, 2017, 28(2): 627−635. Peng J, Guo X N, Hu Y N, et al. Construction of mountain ecological security pattern based on geological hazard sensitivity: Yuxi City, Yunnan Povince as an example[J]. Chinese Journal of Applied Ecology, 2017, 28(2): 627−635.
[13] 邵明, 李雄, 刘志成, 等. 基于LUCC的承德市域生态系统服务价值演变分析与优化研究[J]. 北京林业大学学报, 2021, 43(3): 106−116. doi: 10.12171/j.1000-1522.20190480 Shao M, Li X, Liu Z C, et al. Analysis and optimization of the evolution of ecosystem service value in Chengde City based on LUCC[J]. Journal of Beijing Forestry University, 2021, 43(3): 106−116. doi: 10.12171/j.1000-1522.20190480
[14] Newton A C , Hodder K , Cantarello E . Cost-enefit analysis of ecological networks assessed through spatial analysis of ecosystem services[J]. Journal of Applied Ecology, 2012, 49(3): 571−580.
[15] Niemel J, Saarela S R, Sderman T, et al. Using the ecosystem services approach for better planning and conservation of urban green spaces: a Finland case study[J]. Biodiversity & Conservation, 2010, 19(11): 3225−3243.
[16] 和娟, 师学义, 付扬军. 基于生态系统服务的汾河源头区域生态安全格局优化[J]. 自然资源学报, 2020, 35(4): 814−825. doi: 10.31497/zrzyxb.20200406 He J, Shi X Y, Fu Y J. Optimization of ecological security pattern in Fen River headwaters region based on ecosystem services[J]. Journal of Natural Resources, 2020, 35(4): 814−825. doi: 10.31497/zrzyxb.20200406
[17] 黄智洵, 王飞飞, 曹文志. 耦合生态系统服务供求关系的生态安全格局动态分析: 以闽三角城市群为例[J]. 生态学报, 2018, 38(12): 4327−4340. Huang Z X, Wang F F, Cao W Z. Dynamic analysis of ecological security pattern with coupled ecosystem service supply and demand: taking the Min Delta urban agglomeration as an example[J]. Acta Ecologica Sinica, 2018, 38(12): 4327−4340.
[18] Beier P, Majka D R, Spencer W D. Forks in the road: choices in procedures for designing wildland linkages[J]. Conservation Biology, 2008, 22(4): 836−851. doi: 10.1111/j.1523-1739.2008.00942.x
[19] Saura S, Rubio L. A common currency for the different ways in which patches and links can contribute to habitat availability and connectivity in the landscape[J]. Ecography, 2010, 33(3): 523−537.
[20] Beier P, Spencer W, Baldwin R F, et al. Toward best practices for developing regional connectivity maps[J]. Conservation Biology, 2011, 25(5): 879−892. doi: 10.1111/j.1523-1739.2011.01716.x
[21] 吴健生, 马洪坤, 彭建. 基于“功能节点−关键廊道”的城市生态安全格局构建: 以深圳市为例[J]. 地理科学进展, 2018, 37(12): 79−87. Wu J X, Ma H K, Peng J. Construction of urban ecological security pattern based on “functional nodes-critical corridors”: the case of Shenzhen City[J]. Progress in Geography, 2018, 37(12): 79−87.
[22] 陈昕, 彭建, 刘焱序. 基于“重要性−敏感性−连通性”框架的云浮市生态安全格局构建[J]. 地理研究, 2017, 36(3): 471−484. Chen X, Peng J, Liu Y X. Construction of ecological security pattern in Yunfu City based on “importance-sensitivity-connectivity” framework[J]. Geographical Research, 2017, 36(3): 471−484.
[23] 吴健生, 岳新欣, 秦维. 基于生态系统服务价值重构的生态安全格局构建: 以重庆两江新区为例[J]. 地理研究, 2017, 36(3): 429−440. Wu J S, Yue X X, Qin W. Construction of ecological security pattern based on ecosystem service value reconstruction: taking chongqing liangjiang new area as an example[J]. Geographical Research, 2017, 36(3): 429−440.
[24] 胡炳旭, 汪东川, 王志恒, 等. 京津冀城市群生态网络构建与优化[J]. 生态学报, 2018, 38(12): 4383−4392. Hu B X, Wang D C, Wang Z H, et al. Construction and optimization of ecological network in Beijing-Tianjin-Hebei city cluster[J]. Acta Ecologica Sinica, 2018, 38(12): 4383−4392.
[25] 王楚琦, 闫晋钰, 李冠衡. 基于ENVI技术的永定河段景观格局演变与优化研究[J]. 北京林业大学学报, 2021, 43(6): 118−129. doi: 10.12171/j.1000-1522.20200204 Wang C Q, Yan J Y, Li G H. Study on the evolution and optimization of landscape pattern in Yongding River section based on ENVI technology[J]. Journal of Beijing Forestry University, 2021, 43(6): 118−129. doi: 10.12171/j.1000-1522.20200204
[26] Dong R, Zhang X, Li H. Constructing the ecological security pattern for sponge city: a case study in Zhengzhou, China[J]. Water, 2019, 11(2): 284. doi: 10.3390/w11020284
[27] de Groot R, Brander L, van der Ploeg S, et al. Global estimates of the value of ecosystems and their services in monetary unit[J]. Ecosystem Services, 2012, 1(1): 50−61. doi: 10.1016/j.ecoser.2012.07.005
[28] 宋婷, 李岱青, 张林波, 等. 秦巴山脉区域生态系统服务重要性评价及生态安全格局构建[J]. 中国工程科学, 2020, 22(1): 64−72. Song T, Li D Q, Zhang L B, et al. Evaluation of the importance of regional ecosystem services and construction of ecological security pattern in the Qinba Mountains[J]. Strategic Study of CAE, 2020, 22(1): 64−72.
[29] 肖楚楚. 密云水库流域建设用地扩张对生态系统水质净化功能的影响[D]. 长沙: 湖南农业大学, 2013. Xiao C C. Impact of construction land expansion on water purification function of ecosystem in Miyun Reservoir Watershed[D]. Changsha: Hunan Agricultural University, 2013.
[30] Bai Y, Ochuodho T O, Yang J. Impact of land use and climate change on water-related ecosystem services in Kentucky, USA[J]. Ecological Indicators, 2019, 102: 51−64. doi: 10.1016/j.ecolind.2019.01.079
[31] 环境保护部, 国家发展和改革委员会. 生态保护红线划定指南[Z/OL]. [2020−06−06]. http://sthjt.jl.gov.cn/xxfb/jgsz/gcs/zrstbhc/zrbhq_84151/201711/P020171117571999569371.pdf. Ministry of Environmental Protection of the People’s Republic of China, National Development and Reform Commission. Ecological protection red line delineation guide[Z/OL]. [2020−06−06]. http://sthjt.jl.gov.cn/xxfb/jgsz/gcs/zrstbhc/zrbhq_84151/201711/P020171117571999569371.pdf.
[32] Wischmeier W H. Predicting rainfall erosion losses: a guide to conservation planning[J]. Agriculture Handbook, 1978, 537: 285−291.
[33] 许丁雪, 吴芳, 何立环, 等. 土地利用变化对生态系统服务的影响: 以张家口−承德地区为例[J]. 生态学报, 2019, 39(20): 7493−7501. Xu D X, Wu F, He L H, et al. Impact of land use change on ecosystem services: the case of Zhangjiakou-Chengde region[J]. Acta Ecologica Sinica, 2019, 39(20): 7493−7501.
[34] 陈泓宇, 李雄. 基于MSPA-InVEST模型的北京中心城区绿色空间生境网络优化[J]. 风景园林, 2021, 28(2): 16−21. Chen H Y, Li X. Optimization of green space habitat network in central Beijing based on MSPA-InVEST model[J]. Landscape Architecture, 2021, 28(2): 16−21.
[35] 张梦迪, 张芬, 李雄. 基于InVEST模型的生境质量评价: 以北京市通州区为例[J]. 风景园林, 2020, 27(6): 95−99. Zhang M D, Zhang F, Li X. Habitat quality evaluation based on the InVEST model: the example of Tongzhou District, Beijing[J]. Landscape Architecture, 2020, 27(6): 95−99.
[36] 谢余初, 巩杰, 张素欣, 等. 基于遥感和InVEST模型的白龙江流域景观生物多样性时空格局研究[J]. 地理科学, 2018, 38(6): 979−986. Xie Y C, Gong J, Zhang S X, et al. Spatial and temporal patterns of landscape biodiversity in the Bailong River Basin based on remote sensing and InVEST model[J]. Scientia Geographica Sinica, 2018, 38(6): 979−986.
[37] 褚琳, 张欣然, 王天巍, 等. 基于CA-Markov和InVEST模型的城市景观格局与生境质量时空演变及预测[J]. 应用生态学报, 2018, 29(12): 4106−4118. Chu L, Zhang X R, Wang T W, et al. Spatial and temporal evolution and prediction of urban landscape patterns and habitat quality based on CA-Markov and InVEST models[J]. Chinese Journal of Applied Ecology, 2018, 29(12): 4106−4118.
[38] 陈妍, 乔飞, 江磊. 基于 InVEST 模型的土地利用格局变化对区域尺度生境质量的影响研究: 以北京为例[J]. 北京大学学报(自然科学版), 2016, 52(3): 553−562. Chen Y, Qiao F, Jiang L. Impact of land use pattern change on regional scale habitat quality based on InVEST model: a case study of Beijing[J]. Journal of Peking University (Natural Science Edition), 2016, 52(3): 553−562.
[39] Schröter M, Remme R P. Spatial prioritisation for conserving ecosystem services: comparing hotspots with heuristic optimisation[J]. Landscape Ecology, 2016, 31(2): 1−20.
[40] Li Y J, Zhang L W, Yan J P, et al. Mapping the hotspots and coldspots of ecosystem services in conservation priority setting[J]. Journal of Geographical Sciences, 2017, 27(6): 681−696. doi: 10.1007/s11442-017-1400-x
[41] 李双成. 生态系统服务地理学[M]. 北京: 科学出版社, 2014. Li S C. Ecosystem services geography[M]. Beijing: Science Press, 2014.
[42] 李方正, 刘阳, 施瑶, 等. 基于生态系统服务功能模拟演算的绿色空间规划框架: 以北京市浅山区为例[J]. 北京林业大学学报, 2019, 41(11): 125−136. Li F Z, Liu Y, Shi Y, et al. A green spatial planning framework based on ecosystem service simulation and calculation: a case study of shallow mountainous areas in Beijing[J]. Journal of Beijing Forestry University, 2019, 41(11): 125−136.
[43] Bryan B A, Raymond C M, Crossman N D, et al. Targeting the management of ecosystem services based on social values: where, what, and how?[J]. Landscape & Urban Planning, 2010, 97(2): 111−122.
[44] 王旭熙, 彭立, 苏春江, 等. 基于景观生态安全格局的低丘缓坡土地资源开发利用: 以四川省泸县为例[J]. 生态学报, 2016, 36(12): 3646−3654. Wang X X, Peng L, Su C J, et al. Development and utilization of land resources on low hills and slow slopes based on landscape ecological security patterns: a case study of Luxian County, Sichuan Province[J]. Acta Ecologica Sinica, 2016, 36(12): 3646−3654.
[45] 张继平, 乔青, 刘春兰, 等. 基于最小累积阻力模型的北京市生态用地规划研究[J]. 生态学报, 2017, 37(19): 28−36. Zhang J P, Qiao Q, Liu C L, et al. Research on ecological land use planning in Beijing based on the minimum cumulative resistance model[J]. Acta Ecologica Sinica, 2017, 37(19): 28−36.
[46] 殷炳超, 何书言, 李艺, 等. 基于陆海统筹的海岸带城市群生态网络构建方法及应用研究[J]. 生态学报, 2018, 38(12): 4374−4382. Yin B C, He S Y, Li Y, et al. Research on the construction method and application of ecological network of coastal zone city cluster based on the integration of land and sea[J]. Acta Ecologica Sinica, 2018, 38(12): 4374−4382.
[47] Kong F, Yin H, Nakagoshi N, et al. Urban green space network development for biodiversity conservation: identification based on graph theory and gravity modeling[J]. Landscape & Urban Planning, 2010, 95(1−2): 16−27.
[48] 陈小平, 陈文波. 鄱阳湖生态经济区生态网络构建与评价[J]. 应用生态学报, 2016, 27(5): 1611−1618. Chen X P, Chen W B. Construction and evaluation of ecological network in Poyang Lake ecological and economic zone[J]. Chinese Journal of Applied Ecology, 2016, 27(5): 1611−1618.
[49] 古璠, 黄义雄, 陈传明, 等. 福建省自然保护区生态网络的构建与优化[J]. 应用生态学报, 2017, 28(3): 1013−1020. Gu F, Huang Y X, Chen C M, et al. Construction and optimization of ecological network for nature reserves in Fujian Province, China[J]. Chinese Journal of Applied Ecology, 2017, 28(3): 1013−1020.
[50] 符小静. 北京市景观格局分析及生态网络空间优化研究[D]. 北京: 中国矿业大学, 2019. Fu X J . Analysis of landscape patterns and spatial optimization of ecological network in Beijing[D]. Beijing: China University of Mining and Technology, 2019.
[51] 朱强, 俞孔坚, 李迪华. 景观规划中的生态廊道宽度[J]. 生态学报, 2005, 25(9): 2406−2412. doi: 10.3321/j.issn:1000-0933.2005.09.037 Zhu Q, Yu K J, Li D H. Ecological corridor width in landscape planning[J]. Acta Ecologica Sinica, 2005, 25(9): 2406−2412. doi: 10.3321/j.issn:1000-0933.2005.09.037
-
期刊类型引用(1)
1. 杨冲,张子木,朱麒轩,杜瑶,李黎,罗斌. 基于中密度纤维板磨削的定组态砂带寿命研究. 林业机械与木工设备. 2023(03): 62-66+75 .  百度学术
百度学术
其他类型引用(4)


计量
- 文章访问数: 1439
- HTML全文浏览量: 518
- PDF下载量: 136
- 被引次数: 5
