
Wind tunnel simulation of complex deformation law on retaining wall under aeolian sand environment
-
摘要:目的 风沙防护是干旱环境下人类基础设施建设和维护的关键工程问题之一,为探明不透风防风阻沙措施风沙运移的变化规律,筛选特殊风沙区域防护体系构建合适设置参数。方法 采用风洞模拟对不同风向夹角条件下防风挡沙墙的气流速度场、风沙流结构以及沙粒阻截率/输导率的变化规律进行研究。结果 (1)迎风侧模型4倍障高处始终为气流急剧变化的拐点,且不随着指示风速的变化而变化;当指示风速小于10 m/s,背风侧弱风区或静风区的范围随着指示风速的增大而增大,大于12 m/s则呈相反规律;同一指示风速作用下,随风向夹角的增大有效防护范围逐渐增加。(2)迎风侧积沙主要集中于近地表0 ~ 10 cm,平均占总输沙量的85.31%;45°、60°、75°与 90°4 种风向夹角条件下背风侧输沙量主要集中在20 ~ 30 cm高度范围内,分别占总输沙量的71.25%、88.75%、85.25%、86.00%。(3)背风侧0 ~ 10 cm高度层沙粒截留随指示风速的增加而增加,75°夹角时最大,平均为95.64%;10 ~ 30 cm高度层沙粒输导随着指示风速的增加有增大趋势,45°夹角时最大,平均为81.09%。结论 指示风速的变化对防风挡沙墙气流速度场变化规律影响不显著,而对背风侧弱风区或静风区的范围影响较大,75°时有效防护范围最佳;迎风侧输沙量随高度的增加逐渐减少,背风侧随高度的增大呈现出先增加后减少的变化趋势;作为防风阻沙措施风向夹角应设置为75°左右。Abstract:Objective Wind and sand protection is one of the key engineering issues in the construction and maintenance of human infrastructure in arid environment. This paper aims to find out the complex law of wind and sand migration, and to select the appropriate setting parameters of special wind and sand protection system.Method Wind tunnel simulation was used to study the variation of wind velocity field, sand flow structure and sand interception ratio/permeability under different wind direction angles.Result (1) The height of 4 times barrier on the windward side model was always the inflection point of the sharp change of the airflow, and did not change with the indicated wind speed. When the indicated wind speed was less than 10 m/s, the leeward area of weak wind or calm wind area increased with the indicated wind speed, and the opposite law was presented when the indicated wind speed was greater than 12 m/s. Under the action of the same indication wind speed, the effective protection range increased gradually with the increase of wind direction angle. (2) The windward sediment mainly concentrated at 0−10 cm near the surface, accounting for 85.31% of the total sediment transport. The leeward sediment transport under different wind direction angle measures mainly concentrated in the range of 20−30 cm height, accounting for 71.25%, 88.75%, 85.25% and 86.00% of the total sediment transport, respectively. (3) Sand interception in leeward layer at 0−10 cm height increased with the increase of indicated wind speed, and reached the maximum at the included angle of 75°, averaging 95.64%. The sand transport in the 10−30 cm height layer had an increasing trend with the increase of indicated wind speed, and the maximum was 81.09% on average when the included angle was 45°.Conclusion The variation of indicated wind speed has no significant influence on the variation law of the airflow velocity field of retaining wall, but has a greater influence on the leeward side of the weak wind area or the range of the calm wind area, and the effective protection range is the best at 75°. The sand transport on the windward side gradually decreases with the increase of height, while that on the leeward side climb up and then decline with the increase of height. The wind angle should be set at about 75° as a measure to prevent wind and sand.
-
风沙区植被稀少、风力强劲、风中携带沙物质较多以及时空分布不均的特点严重影响了交通、建筑以及人类生产生活等[1]。为保护环境、减少流沙危害,不同防风固沙、阻沙措施被广泛应用于干旱、半干旱风沙区域,如防护林[2]、高立式沙障[3-4]、平铺式沙障[5-6]等防风阻沙措施[7-9]及其形成的综合防护体系[10-11]。高立式防风阻沙措施作为风沙区不可或缺的工程治沙措施之一,尤其在风沙灾害严重区域,线性工程上风向的阻挡作用尤为重要。科研学者已利用野外观测、风洞试验与数值模拟等方法对其气流速度场特征、风沙流结构、蚀积搬运规律以及防护效益等方面进行了大量研究[12-15],找出了功能性上疏下密型HDPE(high density poly ethylene)网防沙效果较好[16-17],斜插板挡沙措施消能作用明显[18];确定了孔隙度为40% ~ 45%时挡沙效果最佳[19],行间距为5H(H为模型高度)时防风阻沙效益最优[20]。自20世纪初以来,透风措施得到了广泛的研究,主要涉及风荷载、空气动力学和诱导形态动力学。简单地说,孔隙率及其分布通常被认为是驱动设计和控制一定高度和来风的防沙措施性能最重要的单一参数。相反,据我们所知,关于风吹沙固体屏障的空气动力学和形态动力学,即无孔隙率的科学研究却非常少。仅Baines[21]、Good等[22]和Luca等[23]利用风洞试验模拟了二维条件下的固体垂直壁的空气动力学特性,而这种不透风挡沙措施风沙运移规律明显不同于透风措施,其在背风侧的气流特征、风沙流结构研究也相对较少;加之在防沙技术措施影响下,风沙运动规律发生显著变化,在气流向下风向运动过程中,风速持续降低,但降幅缓慢,这一趋势不会无限延续,风速随着防护距离的增大逐渐稳定,风速与输沙在变化过程中呈现出一种非线性衰减趋势[24],尤其在实际防沙工程中,固沙带宽度的设计差异显著[25]。显然,缺乏这种防沙技术措施的复杂变化作用规律的研究。
受野外观测的局限性与风沙区环境条件下数值模拟的不确定性,高大不透风挡沙措施的风沙运移规律不易获得、不同高度下防风阻沙效益也不易监测;加之在特定风沙环境条件下,线性工程风沙防护体系最外侧需要不透风的高大措施的阻挡,避免风沙流对线路和机车的直接危害。因此,采用风洞试验模拟不透风高大防风挡沙墙风沙运移规律成为有效途径。本文通过对不同风向夹角条件下不透风挡板模型附近气流速度场、阻沙特征的风洞模拟试验,分析挡板模型附近气流运动规律与挡板作用下风沙流作用规律及其阻沙效率,旨在揭示风沙区特殊沙害环境中防风挡沙墙作用下风沙运移规律,为线性工程沙害防治措施作用机理及其应用提供理论依据与数据支撑。
1. 材料与方法
1.1 试验设备
风洞试验在中国科学院寒区旱区环境与工程研究所沙漠与沙漠化重点实验室完成。由动力段、整流段、试验段和扩散段组成的直流闭口吹气式风洞,建成于1967年,并于2005年进行改建。风洞层流测速系统洞体全长37.78 m,试验段长16.23 m,截面积1.0 m × 0.6 m,可以测量1 ~ 40 m/s的风速范围,测试过程中通过调速控制组件达到测试的同步性。
根据相似性原理,对象流动可达到紊流状态,并进入自模化状态,能够满足模型流场与实物流场分布相似[26]。同一模型在不同雷诺数时测得的气动特性有一定差别,但当模拟流动的雷诺数Re大于临界雷诺数Rec(3 × 10⁵ ~ 1 × 10⁷)时,此时的平均风速剖面、湍流度、表面摩擦阻力等边界层流动特征参数与雷诺数Re大小无关,对象流动可达到紊流状态,并进入自模化状态,能够满足模型流场与实物流场分布相似[27]。因此,本文采用雷诺数值判断风洞气动特性相似性,以此确定试验设计模型是否符合模拟要求,计算结果如表1。
表 1 不同模型风洞内雷诺数值Table 1. Reynolds values of different models in wind tunnels模型高度 Model height/cm 平均风速 Mean wind speed/(m·s−1) 温度 Temperature/℃ 气压 Air pressure/hPa 雷诺数 Reynolds number 5 8 ~ 14 13 855 3.87 × 10⁵ ~ 6.78 × 10⁵ 10 8 ~ 14 13 854 3.87 × 10⁵ ~ 6.78 × 10⁵ 20 8 ~ 14 15 860 3.84 × 10⁵ ~ 6.72 × 10⁵ 30 8 ~ 14 13 858 3.89 × 10⁵ ~ 6.79 × 10⁵ 1.2 试验材料
(1)模型材料及规格:既要考虑模拟精度,也要考虑试验的可操作性,最终确定模型材质为木质。本文预试验共设置5、10、20和30 cm 4种模型高度,相似比分别为1∶20、1∶10、1∶5和1∶3.33,其中30 cm模型因高度为洞体高度的一半,试验过程中对风速及洞体影响较大,后期未选择其进行其他试验。对不同相似比模型的风速脉动特性进行分析,得到10 cm高度模型对风速影响最小,因此,本文确定模型高度为10 cm,相似比为1∶10。
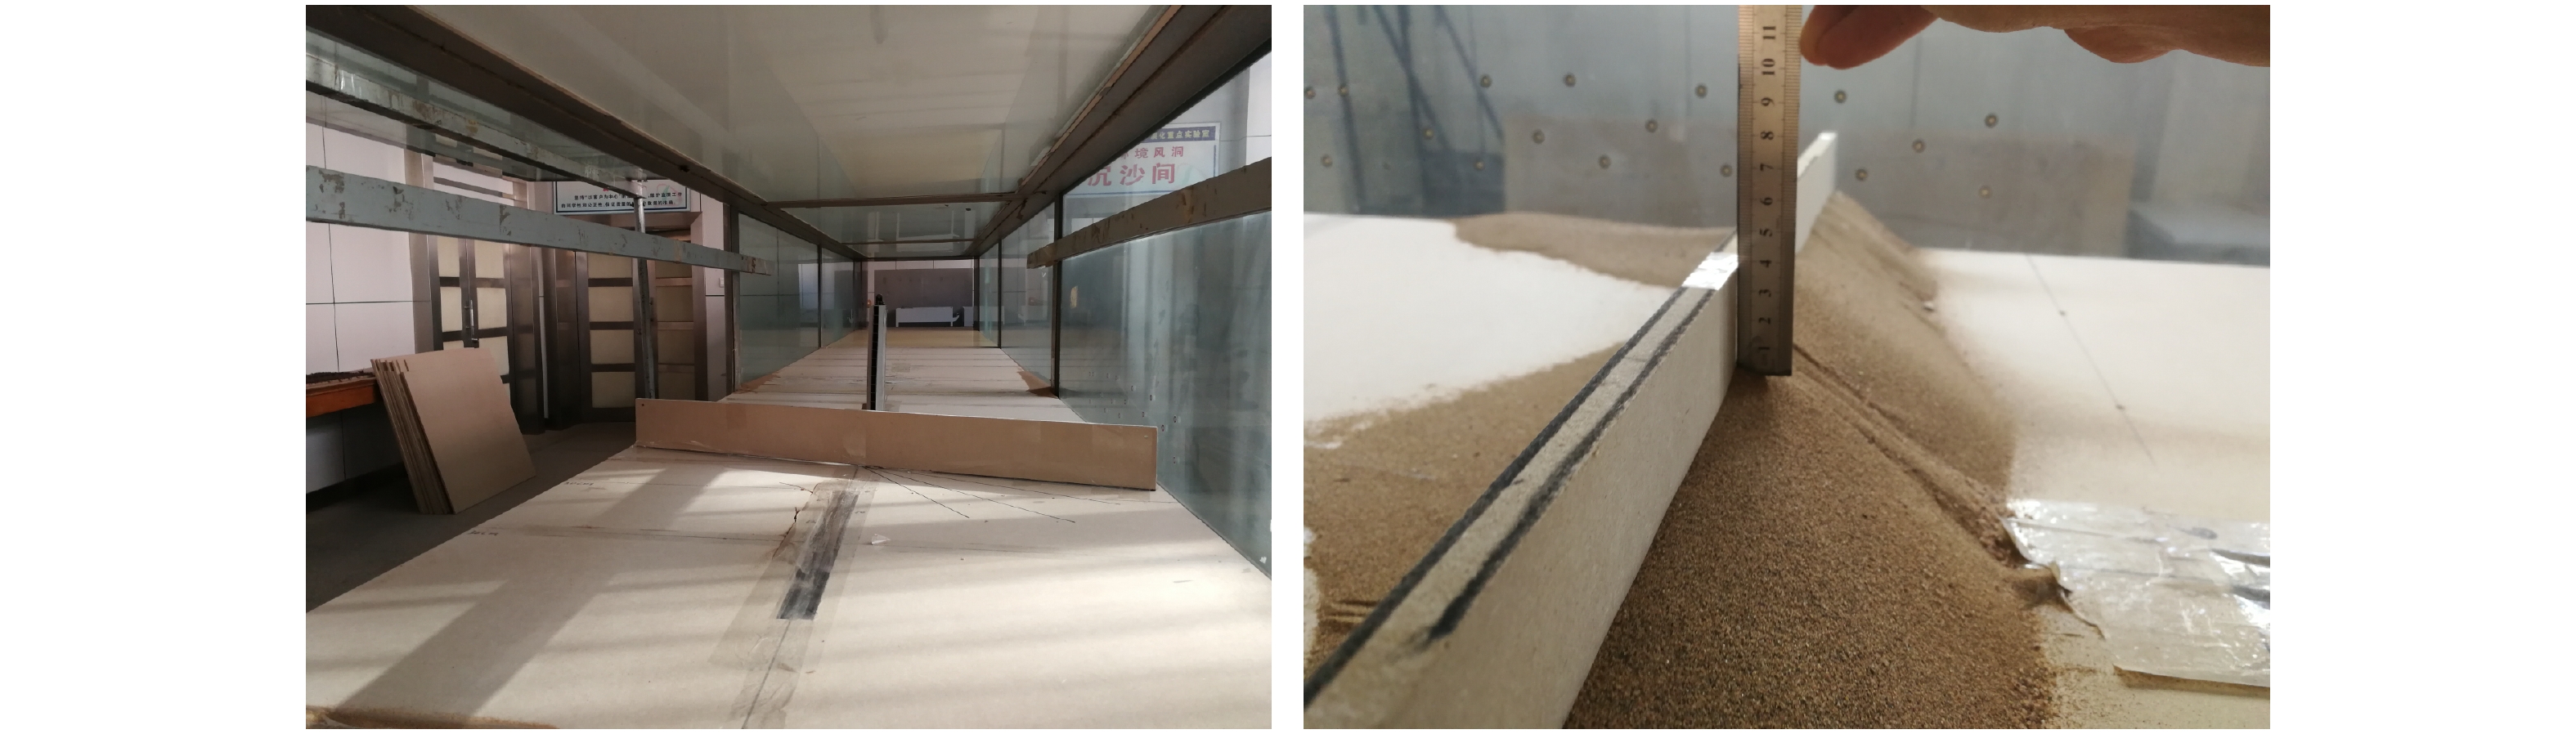
(2)沙物质:本次试验不涉及沙物质粒度特征对阻沙措施模型的响应,沙物质的差异不会影响试验测试精度和一般风沙规律的凝练。因此,在实验室就近的腾格里沙漠边缘获取风成沙物质样品。试验场景如图1。
1.3 试验方案
因防沙措施应与主害风方向大角度相交,固本试验共设置4个风向夹角:45°、60°、75°和90°,分析气流速度场及其阻沙特征在不同风向夹角作用下的复杂变化规律。
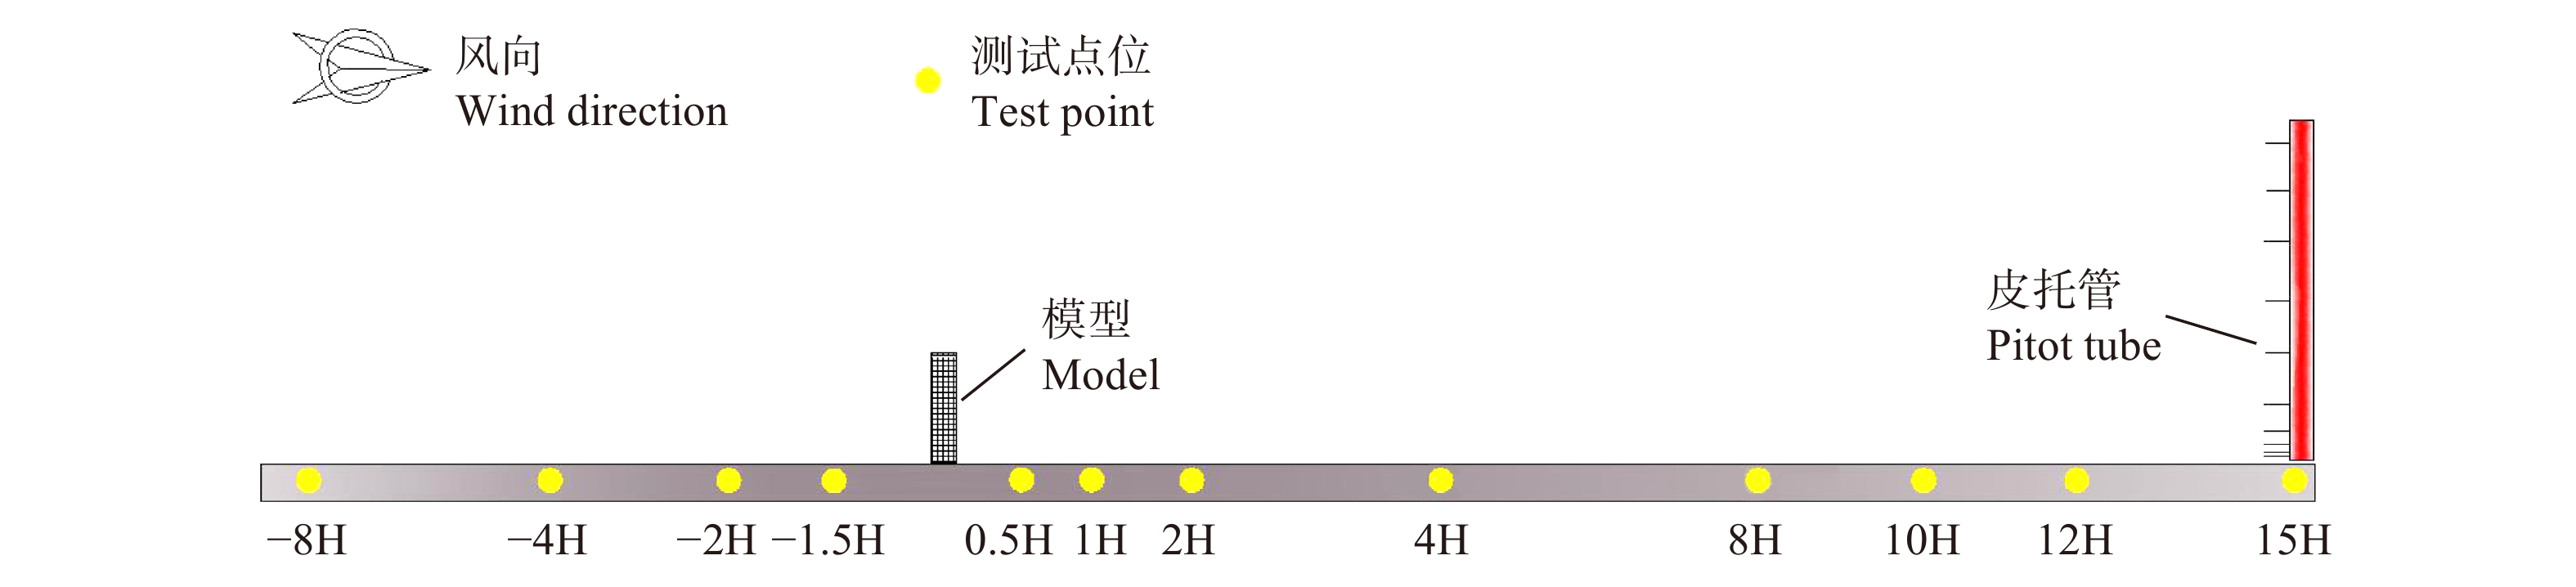
(1)气流速度:在净风条件下进行风速流场观测,选择不同指示风速梯度(8、10、12和14 m/s),待气流稳定后,开始记录吹刮时间,设置为2 min。风速采用FSKX-10数字式风速廓线采集仪测定,测风高度分别为:0.2、0.5、1、2、4、8、12、16、20和24 cm;测点位置为:模型迎风侧1.5H、2H、4H、8H,模型背风侧:0.5H、1H、2H、4H、8H、10H、12H、15H,其中H表示模型高度,本文取值10 cm。如图2所示。
(2)风沙流:在挟沙风条件下进行风沙流观测,同样选择8、10、12和14 m/s 4个指示风速梯度,在模型迎风侧、背风侧测定防风挡沙墙的风沙流结构,风沙流结构采用连续等高阶梯式集沙仪测定。因集沙仪集沙数量有限,不同指示风速条件下设置吹刮时间也不相同,试验开始后,待气流吹刮一定时间稳定后,开始记录时间。14 m/s条件下设置为1 min、随着指示风速的减小,吹刮时间逐渐增加,12 m/s对应2 min、10 m/s对应4 min、8 m/s对应6 min。风沙流观测点设置在距离防风挡沙墙模型迎风侧和背风侧的3H处,本文选用的集沙仪为阶梯式连续等高集沙仪,高度为30 cm,单一集沙口断面为2 cm × 2 cm。
(3)模型截留率/输导率:将地面沙物质的侵蚀过程假设为纯风切变应力与含沙风冲击磨损的叠加效应,引用截留率[28]的概念,并将其作为主要参数之一,可定量评价防风挡沙墙模型对低层沙物质颗粒截留或高层沙物质颗粒输导的影响。即侵蚀沙粒通过模型时,部分沙粒被截留/输导,被截留/输导的沙粒占沙粒总量的百分比称为模型截留率/输导率。根据公式(1)计算。
n=W−QW×100% (1) 式中:n为模型截留率/输导率;W为同一风速下同高度层旷野输沙通量,g/(cm2·min);Q为模型影响后剩余输沙通量,g/(cm2·min)。
![]() 图 2 气流速度场测点分布示意图H为模型高度,取值10 cm。H is model height, 10 cm.Figure 2. Layout diagram measuring points of the airflow velocity field
图 2 气流速度场测点分布示意图H为模型高度,取值10 cm。H is model height, 10 cm.Figure 2. Layout diagram measuring points of the airflow velocity field2. 结果与分析
2.1 防风挡沙墙水平气流速度场的变化规律
图3(a、b、c、d)分别为45°、60°、75°与90°4种风向夹角条件下,模型在不同指示风速8、10、12和14 m/s作用下的纵向气流速度场变化规律。由图3可看出,在距离模型较远处,不同指示风速条件下各流线均呈平行状排列,当气流遇防风挡沙墙阻挡后发生显著变化。气流在−4H处开始出现波动,低层气流受挡板干扰流线加密,风速抬升,−3H至模型迎风侧是一段气流抬升区,并在防风挡沙墙顶部形成强气流区,而在阻沙措施的背风侧近地层气流波动较小,形成了一定范围的弱风区或静风区;随着离地高度的增加,气流开始扩散变化,并且在10 ~ 12H后开始逐渐恢复。随着指示风速的增大,气流仍在迎风侧−4H处开始波动,低层气流受挡板影响逐渐开始抬升,并在其背风一侧形成一定范围的弱风区或静风区。8 m/s风速作用于不同模型时,4种风向夹角条件下迎风侧和背风侧有效防护范围分别为−2H ~ 7H、−2H ~ 8H、−2H ~ 9H和−2H ~ 10H,当指示风速增大至10 m/s时,有效防护范围分别为−2H ~ 7H、−2H ~ 7H、−2H ~ 9H和−2H ~ 10H,而随着指示风速继续增大,迎风侧的弱风区或静风区变为−1H开始,背风侧也有减小趋势,较低风速条件下平均减少了1H ~ 2H。
而在不同指示风速作用下,随着风向夹角的增大,其在背风一侧弱风区或静风区的有效防护距离逐渐增大,当风向夹角为45°时,−4H处依然是迎风侧气流变化的拐点,−8H ~ −4H区间气流变化平缓,−4H处之后气流变化逐渐加强,且形成的弱风区高度有提升趋势,−2H至模型迎风侧是一段气流抬升区,在挡板模型右上方形成一个强风区,而模型背风一侧气流下层形成明显的弱风区或静风区,上层气流发生扩散变化。随着风向夹角的增大,迎风侧变化幅度较小,而背风侧气流下层形成的弱风区或静风区范围逐渐增大,60°时背风侧0 ~ 6H区间旋涡已连成一片,75°时背风侧0 ~ 9H区间形成弱风区或静风区,而当风向夹角增加到90°时,背风侧弱风区或静风区范围与75°时差异较小。
2.2 防风挡沙墙垂向气流速度廓线的变化规律
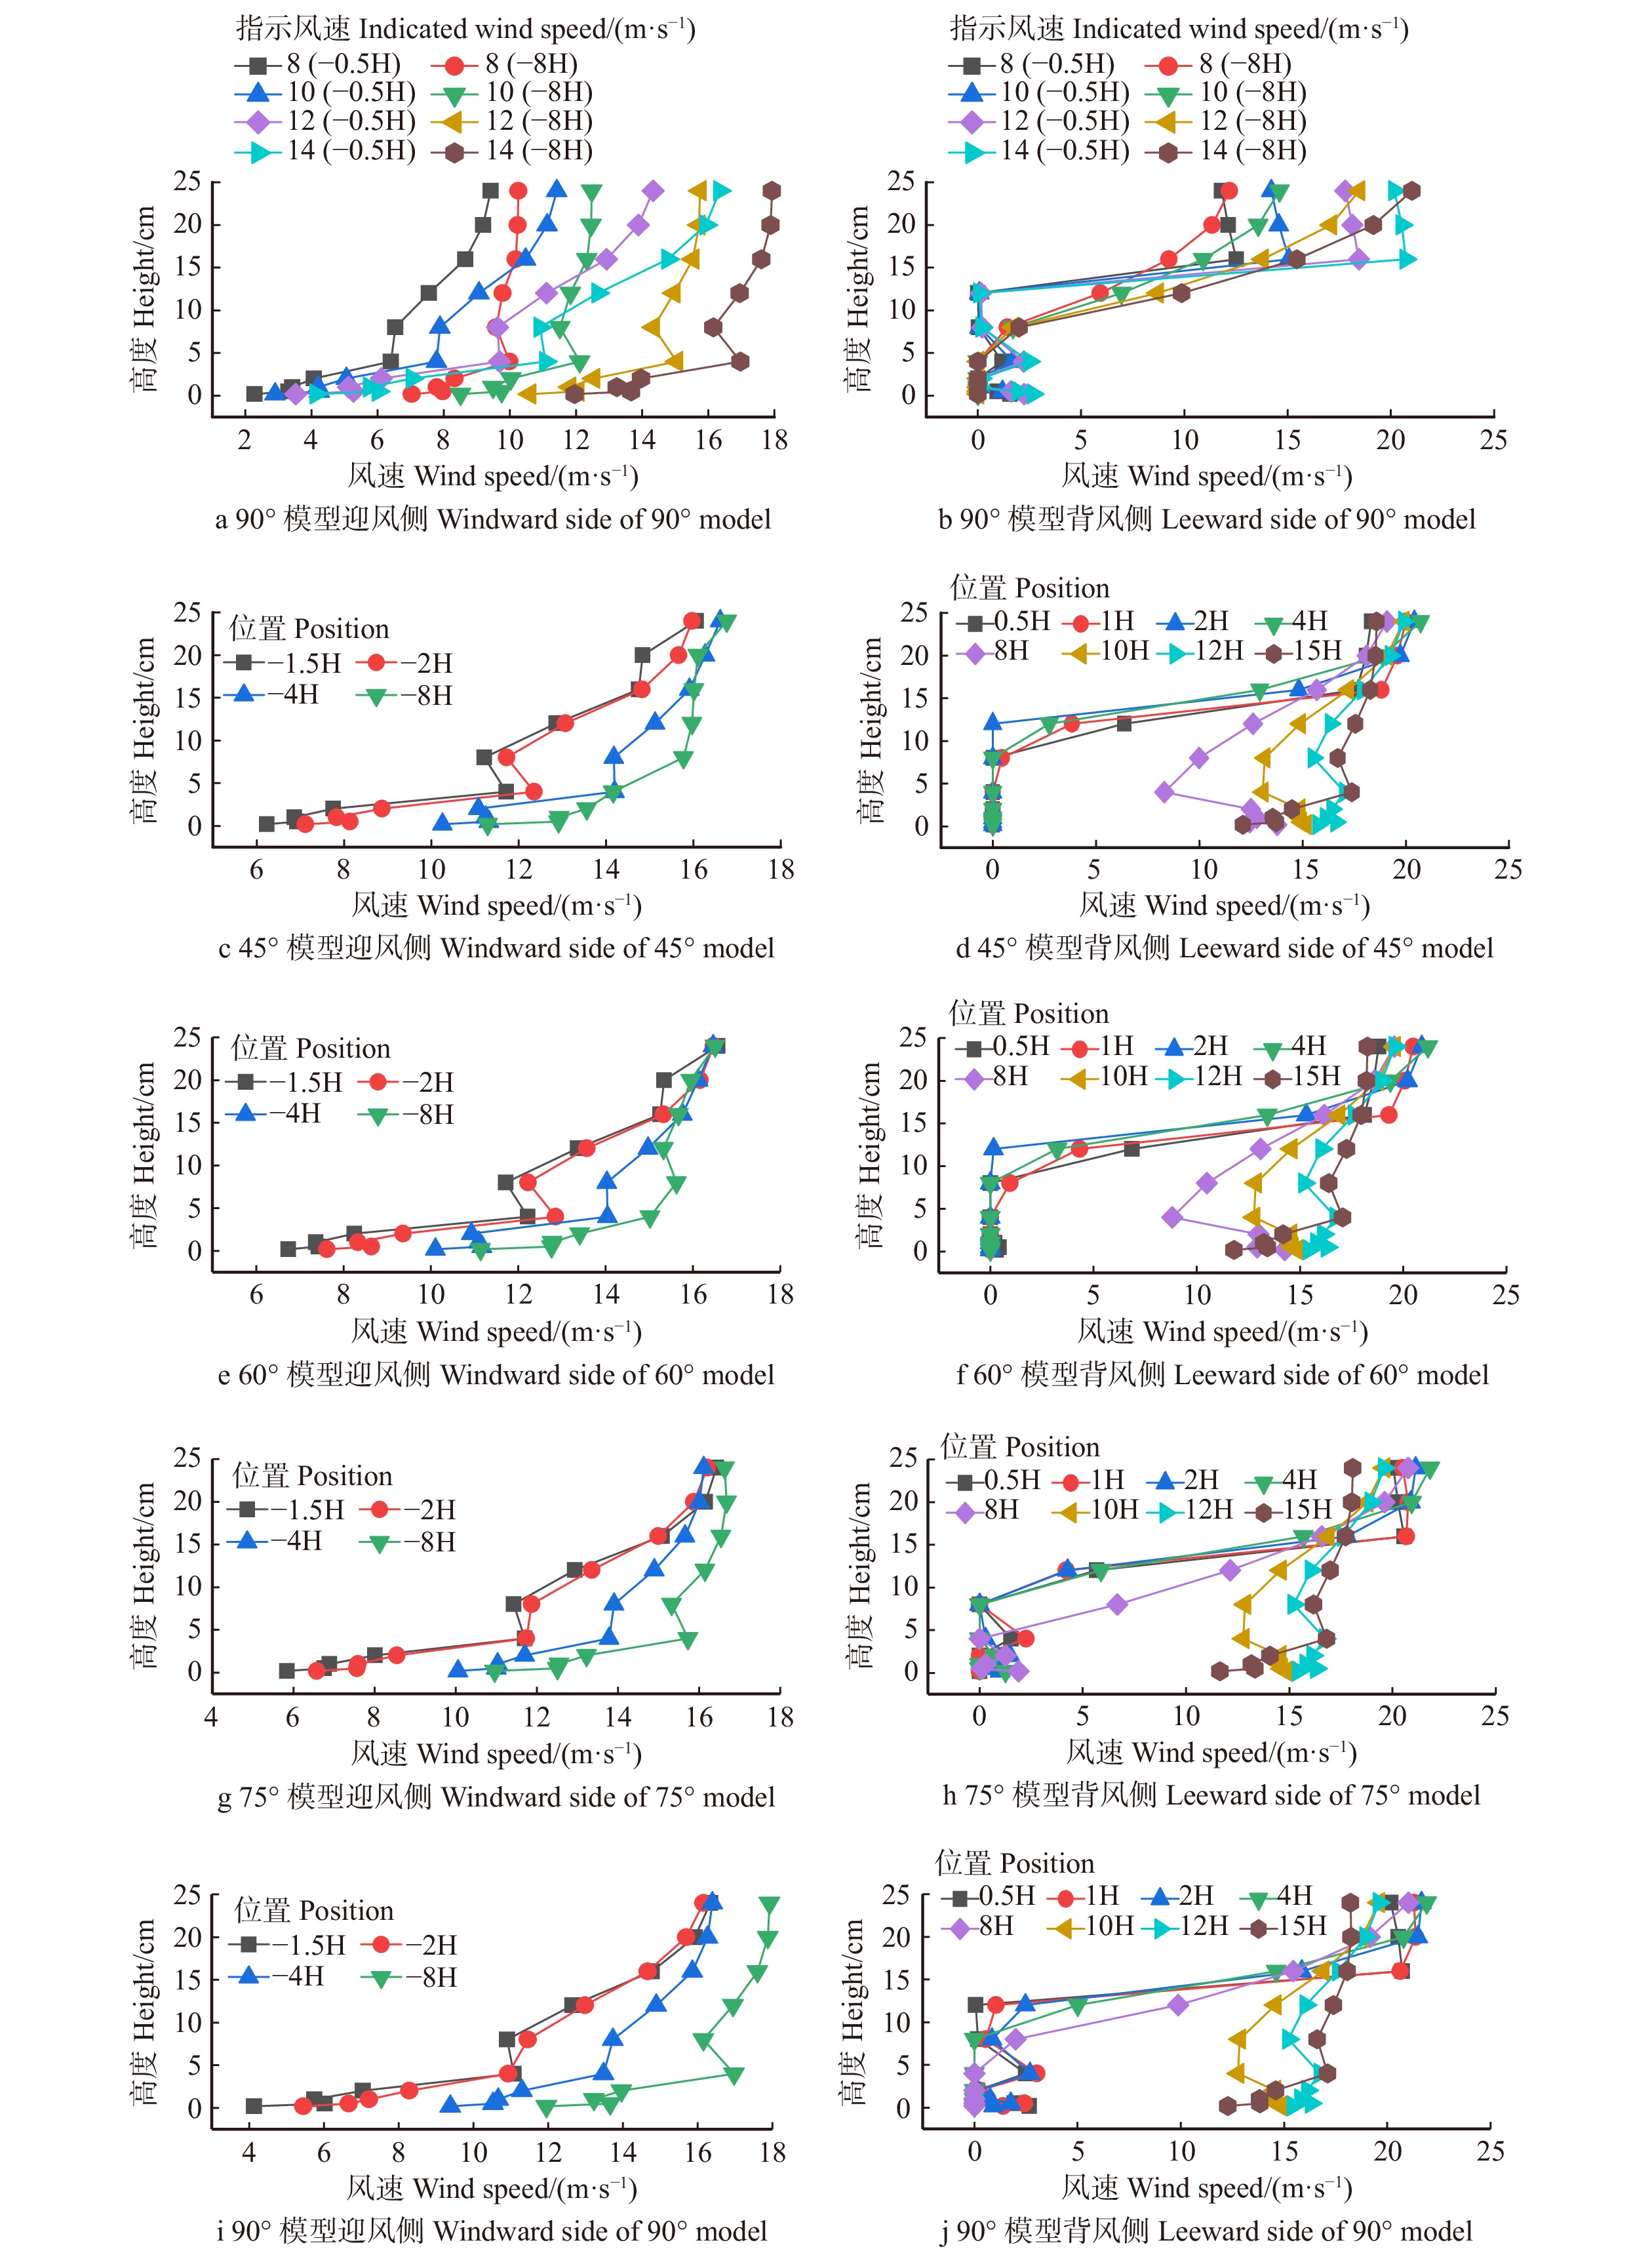
图4为不同风向夹角防风挡沙墙迎风侧和背风侧不同位置垂向气流速度廓线变化规律,图4a和4b为90°风向夹角时,不同风速条件下模型模拟迎风侧和背风侧(0.5H和8H)垂向气流速度变化规律。由图可以看出,在4种不同指示风速作用下,同一模型相同位置气流速度廓线变化规律差异较小,同时表明指示风速的波动情况对气流速度廓线的变化规律作用不明显。因此,图4c ~ 4j重点分析了同一指示风速(14 m/s)时,不同风向夹角、不同位置的气流速度廓线变化规律。由图可以看出,4种风向夹角在模型迎风侧0 ~ 2H处风速随高度的增加均发生了不同程度的抬升,其中气流在近地层2 cm以下受挡板影响显著,其平均气流速度降至7.47、7.97、7.22、6.32 m/s,分别较指示风速降低了46.64%、43.07%、48.43%、54.86%,90°降幅最为明显;随着垂向高度的增加,气流加速过程逐渐增强,气流速度分别增大了7.79%、8.71%、12.43%、12.12%,75°增幅最为明显;而当垂直高度超过2H时,气流速度已基本不受挡板模型的影响,恢复至指示风速。受模型影响,模型背风侧近地层0 ~ 12 cm风速减速过程最为明显,在背风侧0 ~ 4H范围,风速甚至降为零。随着风向夹角的增大,气流在不同位置波动过程逐渐增强,75°与90°差异不显著。随着垂向高度的增大,高于20 cm的气流速度已基本不受模型的影响,恢复至指示风速。
![]()
2.3 防风挡沙墙风沙流分布的变化特征
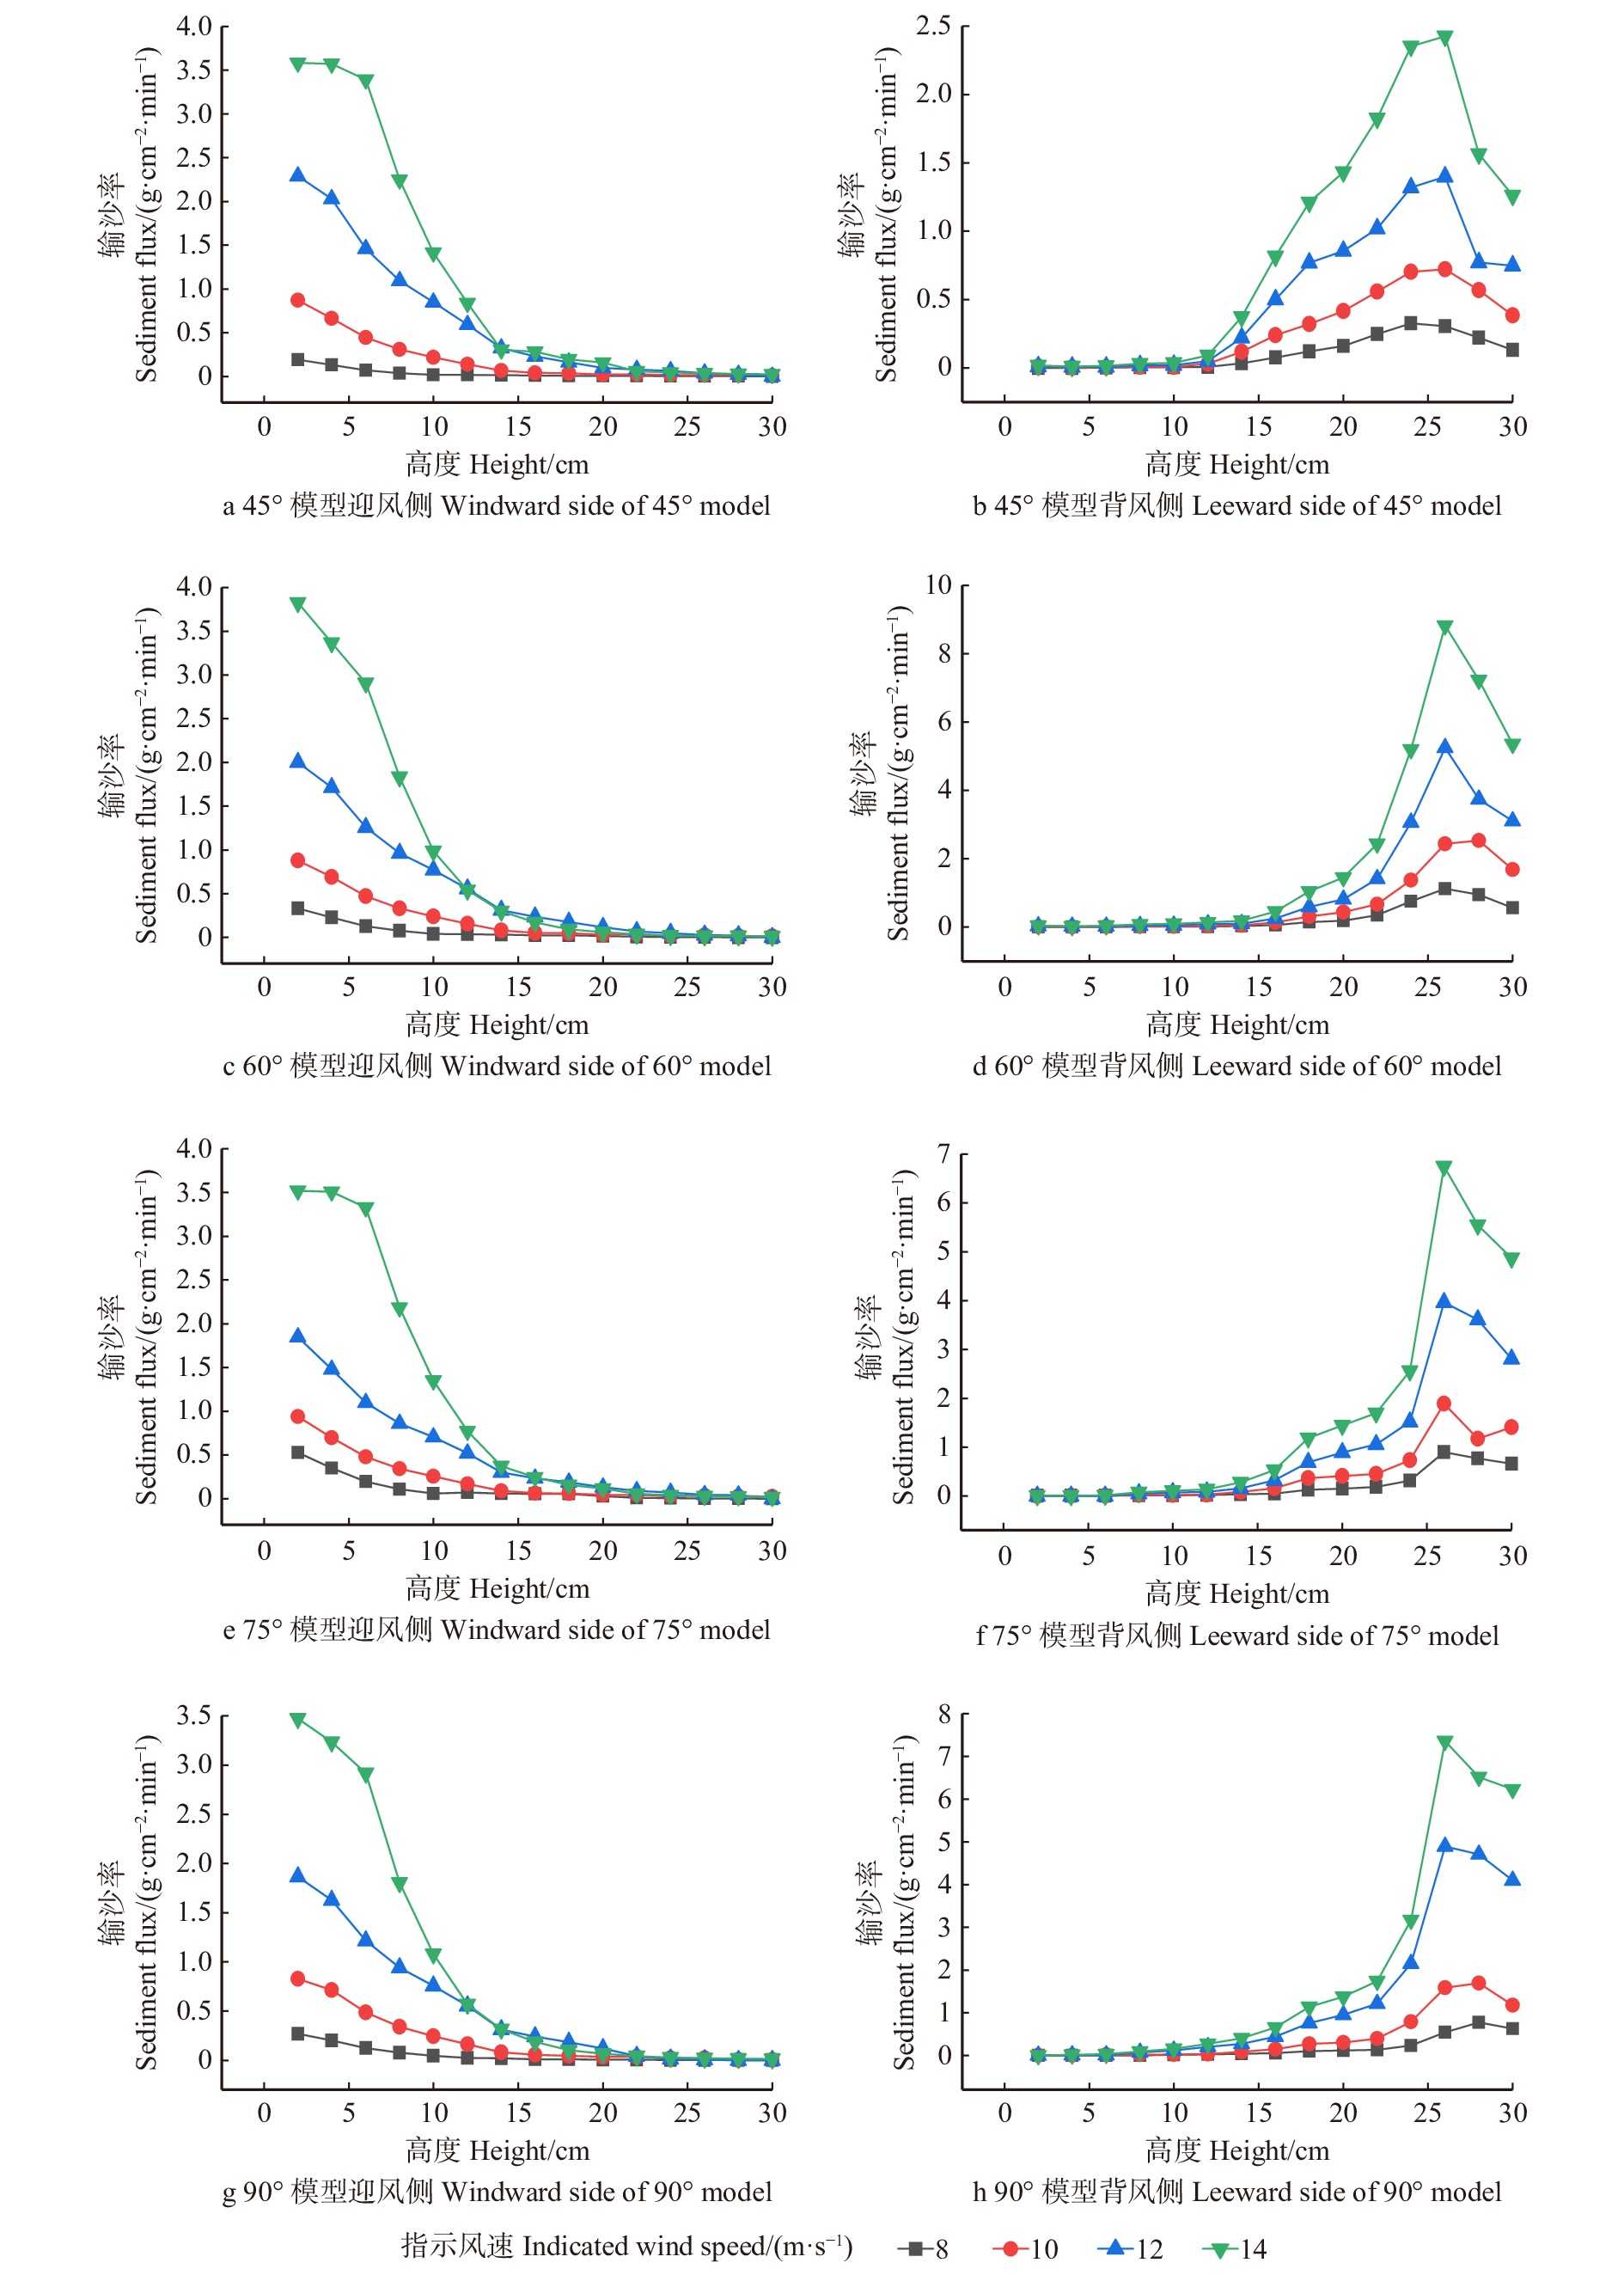
图5为不同指示风速8、10、12和14 m/s作用下,不同风向夹角模型迎风侧和背风侧不同位置风沙流垂直分布变化曲线。由图可知,不同指示风速下,不同风向夹角模型在迎风一侧变化规律相似,输沙主要集中在0 ~ 10 cm高度内,45°、60°、75°与90° 4种风向夹角模型迎风侧0 ~ 10 cm输沙分别占总输沙量的87.00%、85.50%、82.50%、86.25%。受防风挡沙墙的影响,背风侧输沙量随着高度的增大呈现出先增大后减小的变化趋势,不再遵循风沙流结构规律,4种风向夹角模型输沙主要集中在20 ~ 30 cm高度范围内,分别占总输沙量的71.25%、88.75%、85.25%、86.00%;且其最大输沙量均出现在26 cm位置处。这种变化规律同样不受指示风速的影响,但随着指示风速的增大,每层平均输沙量显著增加,8 m/s时背风侧基本不起沙,14 m/s较12 m/s增大了1.65倍,较10 m/s增大了3.68倍,且随着指示风速的增加,这种作用过程逐渐增强。而随着风向夹角的增大,风沙流在其迎风侧和背侧变化规律差异较小,由此可以表明,风向夹角对风沙流规律的影响不显著。为进一步分析不同风向夹角条件下,防风挡沙墙对沙粒的阻截特征,本文对不同高度层输沙特征(表2)以及模型迎风侧后沙粒截留率/输导率(表3)进行了分析。
表 2 防风挡沙墙风沙流结构变化Table 2. Wind-sand flow structure changes of retaining wall模型与风向夹角
Angle of model and wind
direction angle/(°)指示风速
Indicated wind
speed/(m·s−1)QF/
(g·cm−2·min−1)QB/
(g·cm−2·min−1)Q0 ~ 10/QF/% Q0 ~ 10/QB/% Q10 ~ 20/QB/% Q20 ~ 30/QB/% 45 8 0.50 1.65 0.90 0.01 0.24 0.75 10 2.88 4.10 0.87 0.01 0.28 0.72 12 9.32 7.72 0.83 0.01 0.31 0.68 14 16.18 13.47 0.88 0.01 0.29 0.70 60 8 0.94 4.23 0.85 0.01 0.11 0.88 10 3.07 9.76 0.85 0.01 0.10 0.89 12 8.26 18.63 0.81 0.01 0.10 0.89 14 14.18 32.62 0.91 0.01 0.10 0.89 75 8 1.53 3.25 0.81 0.01 0.12 0.87 10 3.29 6.74 0.82 0.01 0.15 0.84 12 7.59 15.22 0.79 0.01 0.14 0.85 14 15.71 25.21 0.88 0.01 0.14 0.85 90 8 0.80 2.71 0.89 0.01 0.13 0.86 10 3.06 6.56 0.85 0.01 0.13 0.86 12 7.87 19.93 0.81 0.01 0.13 0.86 14 13.87 29.19 0.90 0.01 0.13 0.86 注:QF为模型迎风侧3H处输沙总量;QB为模型背风侧3H处输沙总量。Notes: QF is total amount of sediment transport at 3H on the windward side of the model, QB is total amount of sediment transport at 3H on the leeward side of the model. 表 3 防风挡沙墙阻截率/输导率Table 3. Rejection rate/conducting rate of retaining wall% 风速
Wind speed/(m·s−1)近地面高度层
Near ground height level/cm模型与风向夹角 Angle of model and wind direction/(°) 45 60 75 90 8 0 ~ 10 −97.34 −95.15 −97.25 −94.44 10 ~ 20 +88.14 +71.31 +30.73 +80.68 20 ~ 30 +99.04 +99.56 +99.56 +99.29 10 0 ~ 10 −98.62 −97.12 −98.75 −95.85 10 ~ 20 +73.43 +62.88 +59.86 +56.37 20 ~ 30 +97.27 +98.81 +98.81 +97.22 12 0 ~ 10 −99.14 −97.31 −99.03 −96.58 10 ~ 20 +41.55 +25.41 +36.30 +46.70 20 ~ 30 +96.23 +98.99 +99.00 +98.13 14 0 ~ 10 −99.21 −97.73 −99.54 −97.49 10 ~ 20 +54.89 +64.87 +53.62 +67.83 20 ~ 30 +98.00 +99.66 +99.66 +99.24 注:−为模型截留率,+为模型输导率。Notes: − is the model rejection rate, + is the model conducting rate. 表3为不同指示风速为8、10、12和14 m/s作用下,不同风向夹角阻沙措施沙粒在不同高度层截留率/输导率的变化特征。由表可知,在0 ~ 10 cm高度层模型背风侧对沙粒的作用表现为阻截,而10 ~ 20 cm和20 ~ 30 cm高度层表现为输导。随着指示风速的增大,0 ~ 10 cm高度层截留率和20 ~ 30 cm高度层输导率逐渐增大,而10 ~ 20 cm高度层输导率有减弱趋势。当在同一指示风速作用下,随着风向夹角的增大,75°夹角时0 ~ 10 cm高度层沙粒截留率最大,平均为95.64%;10 ~ 30 cm高度层沙粒输导率对风向夹角增加没有明显增大或减小趋势,整体表现为45°输导率最大,75°输导率最小,平均为72.19%。综述可以表明,指示风速的变化对阻沙措施截留率/输导率的影响起主导作用。
3. 讨 论
不同防沙技术措施均可看作流沙地表形态之上的一种人为障碍物,它的存在使原来流经地表的“一次流”成为一种特殊形式的“二次流”,导致其周围气流速度场发生改变,水平流速度变化规律反映了气流在不同高度层上的变化规律[28-29]。现有研究多集中于单一措施气流速度场变化规律,受地形、沙源及障碍物形态参数的影响,不同防沙技术措施水平气流运动规律差异显著[30]。不透风直立式模型影响下,近地表气流会在沙障迎风侧和背风侧附近形成顺时针涡旋,且这种逆风涡旋越大,积沙潜力越大[31-32]。本文结果显示气流在措施体附近运行时,迎风侧表现出近地层气流逐渐减小,上层气流逐渐增大;模型上方开始抬升,并出现分离;导致在背风一侧逐渐降低,形成一定范围的弱风区或静风区,甚至会产生一些反向气流的变化规律,这种不透风措施影响下气流速度场变化规律也较为复杂,不同指示风速、不同风向夹角带来的差异也较大。而在本文通过对不透风型防风挡沙措施的风洞模拟,分析了气流速度与指示风速、风向夹角的变化规律,结果表明指示风速的改变对阻沙措施气流速度场变化规律的影响较小,对于背风侧弱风区或静风区范围影响较大(风速 ≤ 10 m/s时较大,风速 ≥ 12 m/s时开始减小);而随着风向夹角的增大其有效防护范围有增大趋势,当风向夹角为75°时有效防护范围最大。
这种不透风挡沙措施对其背风侧近地层弱风区或静风区影响范围较大,而也是这种不透风性质导致其上层气流的抬升作用较为明显,这也就导致其特殊的输沙变化规律。风洞模拟结果显示,阻沙措施迎风侧符合风沙流结构特征,受措施体影响,其在背风一侧不再遵循风沙流规律,且随着措施体高度的增加,垂直方向主要输沙量所在层数逐渐增高,即在较短距离内,悬移质风沙流不易坠落形成积沙;而随着风向夹角的增大,近地层输沙量有减小趋势。这样的风沙运移规律决定了其在措施体背风侧形成的积沙形态差异较大,与透风阻沙措施相比,其在背风侧风沙流结构存在显著差异,气流穿过孔隙对障后近地表产生风蚀作用,形成与障前相似的风沙流结构,只是相对输沙量远远小于障前[16-17]。本文利用截留率/输导率分析阻沙措施风沙变化规律,找出了指示风速、风向夹角与阻截率/输沙率的关系。防风阻沙作为线性工程风沙防护体系的重要环节,不同类型防沙措施广泛应用于公路、铁路防护体系,然而,对于不同措施的合理铺设夹角一直没有形成统一定论,多数以垂直主风向布设。本文进一步分析了下层(0 ~ 10 cm)范围内沙粒的截留率变化特征,75°夹角时阻截率最大,而上层(10 ~ 30 cm)范围内沙粒的输导率变化结果显示75°风向夹角时输导率最小。
4. 结 论
(1)迎风侧4H处始终为气流急剧变化的拐点,且不随着指示风速的变化而变化;当指示风速小于10 m/s,背风侧弱风区或静风区的范围随着指示风速的增大而增大,而当大于12 m/s则呈相反规律;同一指示风速作用下,随风向夹角的增大有效防护范围逐渐增加,75°夹角最佳。
(2)受阻沙措施影响,不同指示风速作用下迎风侧符合风沙流结构特征,积沙主要集中于近地表0 ~ 10 cm,平均占总输沙量的85.31%;背风侧不再遵循风沙流规律,不同风向夹角措施体输沙量主要集中在20 ~ 30 cm高度范围内,分别占总输沙量的71.25%、88.75%、85.25%、86.00%。
(3)不透风挡沙措施作用下,背风侧0 ~ 10 cm高度层沙粒截留明显,且随着指示风速的增加而增加,75°夹角时0 ~ 10 cm高度层沙粒截留率最大,平均为95.64%;背风侧10 ~ 30 cm高度层沙粒输导明显,且随着指示风速的增加有增大趋势,75°夹角时输导率最小,平均为72.19%。
-
![]()
图 2 气流速度场测点分布示意图
H为模型高度,取值10 cm。H is model height, 10 cm.
Figure 2. Layout diagram measuring points of the airflow velocity field
![]()
表 1 不同模型风洞内雷诺数值
Table 1 Reynolds values of different models in wind tunnels
模型高度 Model height/cm 平均风速 Mean wind speed/(m·s−1) 温度 Temperature/℃ 气压 Air pressure/hPa 雷诺数 Reynolds number 5 8 ~ 14 13 855 3.87 × 10⁵ ~ 6.78 × 10⁵ 10 8 ~ 14 13 854 3.87 × 10⁵ ~ 6.78 × 10⁵ 20 8 ~ 14 15 860 3.84 × 10⁵ ~ 6.72 × 10⁵ 30 8 ~ 14 13 858 3.89 × 10⁵ ~ 6.79 × 10⁵  下载: 导出CSV
表 2 防风挡沙墙风沙流结构变化
Table 2 Wind-sand flow structure changes of retaining wall
模型与风向夹角
Angle of model and wind
direction angle/(°)指示风速
Indicated wind
speed/(m·s−1)QF/
(g·cm−2·min−1)QB/
(g·cm−2·min−1)Q0 ~ 10/QF/% Q0 ~ 10/QB/% Q10 ~ 20/QB/% Q20 ~ 30/QB/% 45 8 0.50 1.65 0.90 0.01 0.24 0.75 10 2.88 4.10 0.87 0.01 0.28 0.72 12 9.32 7.72 0.83 0.01 0.31 0.68 14 16.18 13.47 0.88 0.01 0.29 0.70 60 8 0.94 4.23 0.85 0.01 0.11 0.88 10 3.07 9.76 0.85 0.01 0.10 0.89 12 8.26 18.63 0.81 0.01 0.10 0.89 14 14.18 32.62 0.91 0.01 0.10 0.89 75 8 1.53 3.25 0.81 0.01 0.12 0.87 10 3.29 6.74 0.82 0.01 0.15 0.84 12 7.59 15.22 0.79 0.01 0.14 0.85 14 15.71 25.21 0.88 0.01 0.14 0.85 90 8 0.80 2.71 0.89 0.01 0.13 0.86 10 3.06 6.56 0.85 0.01 0.13 0.86 12 7.87 19.93 0.81 0.01 0.13 0.86 14 13.87 29.19 0.90 0.01 0.13 0.86 注:QF为模型迎风侧3H处输沙总量;QB为模型背风侧3H处输沙总量。Notes: QF is total amount of sediment transport at 3H on the windward side of the model, QB is total amount of sediment transport at 3H on the leeward side of the model.
下载: 导出CSV
表 3 防风挡沙墙阻截率/输导率
Table 3 Rejection rate/conducting rate of retaining wall
% 风速
Wind speed/(m·s−1)近地面高度层
Near ground height level/cm模型与风向夹角 Angle of model and wind direction/(°) 45 60 75 90 8 0 ~ 10 −97.34 −95.15 −97.25 −94.44 10 ~ 20 +88.14 +71.31 +30.73 +80.68 20 ~ 30 +99.04 +99.56 +99.56 +99.29 10 0 ~ 10 −98.62 −97.12 −98.75 −95.85 10 ~ 20 +73.43 +62.88 +59.86 +56.37 20 ~ 30 +97.27 +98.81 +98.81 +97.22 12 0 ~ 10 −99.14 −97.31 −99.03 −96.58 10 ~ 20 +41.55 +25.41 +36.30 +46.70 20 ~ 30 +96.23 +98.99 +99.00 +98.13 14 0 ~ 10 −99.21 −97.73 −99.54 −97.49 10 ~ 20 +54.89 +64.87 +53.62 +67.83 20 ~ 30 +98.00 +99.66 +99.66 +99.24 注:−为模型截留率,+为模型输导率。Notes: − is the model rejection rate, + is the model conducting rate.
下载: 导出CSV
-
[1] Xie S B, Qu J J, Pang Y J. Dynamic wind differences in the formation of sand hazards at high and low altitude railway sections[J]. Journal of Wind Engineering & Industrial Aerodynamics, 2017, 169: 39−46.
[2] Zhao W Z, Hu G L, Zhang Z H, et al. Shielding effect of oasis-protection systems composed of various forms of wind break on sand fixation in an arid region: a case study in the Hexi Corridor, northwest China[J]. Ecological Engineering, 2008, 33(2): 119−125. doi: 10.1016/j.ecoleng.2008.02.010
[3] 屈建军, 刘贤万, 雷加强, 等. 尼龙网栅栏防沙效应的风洞模拟实验[J]. 中国沙漠, 2001(3):62−66. doi: 10.3321/j.issn:1000-694X.2001.01.012 Qu J J, Liu X W, Lei J Q, et al. Simulation experiments on sand-arresting effect of nylon net fence in wind tunnel[J]. Journal of Desert Research, 2001(3): 62−66. doi: 10.3321/j.issn:1000-694X.2001.01.012
[4] Xiao J H, Yao Z Y, Qu J J. Influence of Golmud-Lhasa section of Qinghai-Tibet Railway on blown sand transport[J]. Chinese Geographical Science, 2015, 25: 39−50. doi: 10.1007/s11769-014-0722-1
[5] Zhang C L, Li Q, Zhou N, et al. Field observations of wind profiles and sand fluxes above the windward slope of a sand dune before and after the establishment of semi-buried straw checkerboard barriers[J]. Aeolian Research, 2016, 20: 59−70. doi: 10.1016/j.aeolia.2015.11.003
[6] Zhang S, Ding G D, Yu M H, et al. Effect of straw checkerboards on wind proofing, sand fixation, and ecological restoration in shifting sandy land[J/OL]. Environmental Research and Public Health, 2018, 15(10): 2184 [2018−10−06]. https://doi.org/10.3390/ijerph15102184.
[7] Xu X L, Zhang K L, Kong Y P, et al. Effectiveness of erosion control measures along the Qinghai-Tibet Highway, Tibet Plateau, China[J]. Transportation Research Part D: Transport and Environment, 2006, 11(4): 302−309. doi: 10.1016/j.trd.2006.06.001
[8] Dong Z, Li H L, Wang J, et al. Wind tunnel test on effect of controlling windand deposited sand of geogrid sand-barrier[J]. Journal of Soil and Water Conservation, 2007, 5: 35−39.
[9] 程建军, 蒋富强, 杨印海, 等. 戈壁铁路沿线风沙灾害特征与挡风沙措施及功效研究[J]. 中国铁道科学, 2010, 31(5):15−20. Cheng J J, Jiang F Q, Yang Y H, et al. Study on the hazard characteristics of the drifting sand along the railway in Gobi area and the efficacy of the control engineering measures[J]. China Railway Science, 2010, 31(5): 15−20.
[10] Zhang K, Qu J, Liao K, et al. Damage by wind-blown sand and its control along Qinghai-Tibet railway in China[J]. Aeolian Research, 2010, 1: 143−146. doi: 10.1016/j.aeolia.2009.10.001
[11] Cheng J J, Xue C X. The sand-damage-prevention engineering system for the railway in the desert region of the Qinghai-Tibet Plateau[J]. Journal of Wind Engineering and Industrial Aerodynamics, 2014, 125: 30−37. doi: 10.1016/j.jweia.2013.11.016
[12] 韩致文, 王涛, 董治宝, 等. 风沙危害防治的主要工程措施及其机理[J]. 地理科学进展, 2004(1):13−21. doi: 10.11820/dlkxjz.2004.01.002 Han Z W, Wang T, Dong Z B, et al. Main engineering measurements and mechanism of blown sand hazard control[J]. Progress in Geography, 2004(1): 13−21. doi: 10.11820/dlkxjz.2004.01.002
[13] Zhang C L, Zou X Y, Pan X H, et al. Near-surface airflow field and aerodynamic characteristics of the railway-protection system in the Shapotou region and their significance[J]. Journal of Arid Environments, 2007, 71: 169−187. doi: 10.1016/j.jaridenv.2007.03.006
[14] Li B, Sherman D J. Aerodynamics and morphodynamics of sand fences: a review[J]. Aeolian Research, 2015, 17: 33−48. doi: 10.1016/j.aeolia.2014.11.005
[15] Luca B, Davide F, Aandrea L G. Solid barriers for windblown sand mitigation: aerodynamic behavior and conceptual design guidelines[J]. Journal of Wind Engineering & Industrial Aerodynamics, 2018, 173: 79−90.
[16] 屈建军, 喻文波, 秦晓波. HDPE功能性固沙障防风效应试验[J]. 中国沙漠, 2014, 34(5):1185−1193. Qu J J, Yu W B, Qin X B. Wind-protecting efficiency of HDPE functional sand-fixing barriers[J]. Journal of Desert Research, 2014, 34(5): 1185−1193.
[17] 何志辉, 李生宇, 王海峰, 等. 塔克拉玛干沙漠4种结构尼龙阻沙网的防风阻沙效益对比[J]. 干旱区研究, 2014, 31(2):369−374. He Z H, Li S Y, Wang H F, et al. Comparison of wind prevention and sand blocking effects of 4 types of sand blocking nylon nets in the central Taklimakan Desert[J]. Arid Zone Research, 2014, 31(2): 369−374.
[18] 李凯崇, 石龙, 孔令伟, 等. 兰新高铁沿线不同挡沙措施防护效果评价[J]. 铁道工程学报, 2017, 34(3):11−14, 21. doi: 10.3969/j.issn.1006-2106.2017.03.003 Li K C, Shi L, Kong L W, et al. Protection effect of different kinds of sand-barriers along Lanzhou-Xinjiang High-Speed Railway[J]. Journal of Railway Engineering Society, 2017, 34(3): 11−14, 21. doi: 10.3969/j.issn.1006-2106.2017.03.003
[19] 辛文栋. 风区高速铁路路基沙害防治研究与设计[J]. 铁道工程学报, 2015, 32(10):61−65, 72. doi: 10.3969/j.issn.1006-2106.2015.10.011 Xin W D. Sand disaster prevention research and design for high speed railway subgrade in the wind zone[J]. Journal of Railway Engineering Society, 2015, 32(10): 61−65, 72. doi: 10.3969/j.issn.1006-2106.2015.10.011
[20] 袁鑫鑫, 王海峰, 雷加强, 等. 不同间距双排尼龙阻沙网防风效应的风洞模拟[J]. 中国沙漠, 2016, 36(5):1238−1246. Yuan X X, Wang H F, Lei J Q, et al. Wind tunnel simulation of windbreak effect of double-row nylon net fence with different interval[J]. Journal of Desert Research, 2016, 36(5): 1238−1246.
[21] Baines W. Effects of velocity distribution on wind loads and flow patterns on buildings [C]// Proceedings of the symposium on wind effects on buildings and structures. Teddington: National Physical Laboratories, 1963: 198−225.
[22] Good M C, Joubert P N. The form drag of two-dimensional bluff-plates immersed in turbulent boundary layers[J]. Journal of Fluid Mechanics, 1968, 31(3): 547−582. doi: 10.1017/S0022112068000327
[23] Luca B, Marko H, Lorenzo R. Windblown sand along railway infrastructures: a review of challenges and mitigation measures[J]. Journal of Wind Engineering & Industrial Aerodynamics, 2018, 177: 340−365.
[24] 张克存, 屈建军, 牛清河, 等. 青藏铁路沿线砾石方格固沙机理风洞模拟研究[J]. 地球科学进展, 2010, 25(3):284−289. Zhang K C, Qu J J, Niu Q H, et al. Simulative research on the mechanism of rocky checkerboard sand barriers along Qinghai-Tibet Railway in wind tunnel[J]. Advances in Earth Science, 2010, 25(3): 284−289.
[25] 韩致文, 陈广庭, 胡英娣, 等. 塔里木沙漠公路防沙体系建设几个问题的探讨[J]. 干旱区资源与环境, 2000, 14(2):35−40. doi: 10.3969/j.issn.1003-7578.2000.02.007 Han Z W, Chen G T, Hu Y T, et al. Discussion on problems about construction of sand-controlling systems along desert highway in Tarim Basin, Taklimakan Desert[J]. Journal of Arid Land Resources and Environment, 2000, 14(2): 35−40. doi: 10.3969/j.issn.1003-7578.2000.02.007
[26] 吴望一. 流体力学[M]. 北京: 北京大学出版社, 1982. Wu W Y. Hydromechanics[M]. Beijing: Peking University Press, 1982.
[27] Liu H Y, Hou Z F, Chen Z, et al. Effects of standing stubble on the interception of soil erosion particles[J]. Land Degradation & Development, 2019, 30(3): 1−9.
[28] Mcewan I K, Willetts B B. Adaptation of the near-surface wind to the development of sand transport[J]. Journal of Fluid Mechanics, 1993, 252: 99−101. doi: 10.1017/S0022112093003684
[29] Liu X P, Dong Z B. Experimental investigation of concentration profile of a blowing sand cloud[J]. Geomorphology, 2004, 60(3): 371−381.
[30] Dong Z B, Wang H T, Zhang X H, et al. Height profile of particle concentration in an aeolian saltating cloud: a wind tunnel investigation by PIV MSD[J]. Geophysical Research Letters, 2004, 30(19): 1−4.
[31] 李凯崇, 薛春晓, 刘贺业, 等. 不同类型挡沙措施风沙防护机理的风洞实验研究[J]. 铁道工程学报, 2015, 32(1):17−21. doi: 10.3969/j.issn.1006-2106.2015.01.004 Li K C, Xue C X, Liu H Y, et al. Wind tunnel test on sand-preventing mechanism of different kinds of sand-barriers[J]. Journal of Railway Engineering Society, 2015, 32(1): 17−21. doi: 10.3969/j.issn.1006-2106.2015.01.004
[32] 左合君. 临策铁路防沙明洞防风阻沙机理及对风沙环境的影响[D]. 呼和浩特: 内蒙古农业大学, 2013. Zuo H J. The impact of opencut tunnel on wind and sand resistance and its around environment in Lin-Ce Railway[D]. Hohhot: Inner Mongolia Agricultural University, 2013.
-
期刊类型引用(4)
1. 牛丹妮,马瑞,刘虎俊,张瑜忠. 不同种植点配置的梭梭林防风效应的风洞试验. 北京林业大学学报. 2023(07): 76-87 .  本站查看
本站查看
2. 徐铮铮,高永,韩彦隆,张超,田晓宁,王鹏. 基于风洞模拟的不同出风口高度导风板的聚风效应. 水土保持研究. 2023(06): 284-294+306 . 百度学术
3. 杨若婷,牛清河,屈建军,谢胜波,王彦奎,马超. 青海共和盆地固定支架式光伏阵列对阵内风场的影响. 中国沙漠. 2022(05): 114-121 . 百度学术
4. 闫敏,左合君,贾光普,席成. 不同防沙措施的风沙流及其携沙粒度垂直分异特征. 干旱区地理. 2022(05): 1513-1522 . 百度学术
其他类型引用(3)


计量
- 文章访问数: 1212
- HTML全文浏览量: 392
- PDF下载量: 33
- 被引次数: 7
