
Spatiotemporal dynamics and its driving mechanism of the Quanzhou Bay Estuary Wetland, Fujian Province of eastern China
-
摘要:目的 为探究福建泉州湾河口湿地生态系统环境破坏及景观结构变化的原因,方法 以泉州湾河口湿地为研究区域,基于Landsat TM遥感影像提取地物信息,构建土地利用动态度模型,运用景观格局指数分析景观空间结构特征;建立不同时期土地利用转移概率矩阵,确定土地类型间数量转移关系;应用灰色关联度模型分析红树林湿地面积变化驱动力。结果 (1)1990—2018年天然湿地面积占比呈减少趋势,人工湿地呈增加趋势;从景观水平看,湿地斑块分布呈规则化,聚拢程度减少,景观类型丰富。(2)红树林、互花米草群落动态度波动大,红树林面积比例以2000年为分界点,呈先减后增趋势;1990—2000年红树林主要向水域、养殖池转出,2010—2018年滩涂和互花米草群落转出为红树林。(3)2000年来,红树林面积大小与其他土地类型面积变化关联性强,尤其受到国内生产总值、园林绿地面积影响较大。结论 泉州湾河口湿地红树林呈恢复趋势,互花米草群落蔓延速率减缓,生态环境逐步改善。该研究为湿地保护与生态恢复提供科学实践依据。Abstract:Objective The natural conditions of Quanzhou Bay estuary wetland are superior, including mangrove, tidal flats and wetlands. In recent years, due to human activities and other factors, its ecological environment and wetland landscape structure have been damaged to a certain extent.Method Taking Quanzhou Bay estuary wetland as the research area, we extracted information based on the Landsat TM remote sensing images. We constructed a dynamic land-use model, using landscape pattern index to analyze its landscape spatial structure characteristics. By establishing Markov matrixes of land types between different periods, we could determine the number transfer relationship between land types. We used the Grey Incidence Analysis to study the driving force of mangrove wetland area change.Result (1) From 1990 to 2018, the proportion of natural wetland areas showed a decreasing trend and the ratio of constructed wetland showed an increasing trend. From the landscape-level perspective, the types were abundant, and their distributions of wetland patches were regular.The degree of aggregation illustrated a reducing trend. (2) The dynamics of mangrove and Spartina alterniflora communities fluctuated widely, and the proportion of mangroves was the cut-off point in 2000, showing a trend of first decreasing and then increasing. From 1990 to 2000, mangroves mainly transferred into water areas and culture ponds, and from 2010 to 2018, many tidal flats and Spartina alterniflora communities moved into mangroves. (3) Since 2000, mangrove’s area had a strong correlation with other land types affected by human activities; among the social and economic factors, GDP and green space area had great influence on it.Conclusion According to the temporal and spatial changes of wetland types, mangroves’ area showed a recovery trend. The spread of Spartina alterniflora communities slowed down, and the ecological environment was gradually improved, which provides scientific and practical basis for wetland protection and ecological restoration.
-
湿地是地球生态系统的重要组成部分,也是生态环境保护的重要领域。河口湿地是由河流与海洋相互作用形成的湿地,具有复杂的生态系统,在维持生物多样性、栖息地保护和涵养水源方面具有不可替代的生态作用[1-2]。目前,湿地退化已成为引发世界关注的生态问题,人类对湿地资源的不合理开发利用导致景观格局发生改变,生态系统功能受损,加速湿地生态系统退化[3-6]。湿地景观是各种生态过程综合作用的结果,从景观水平上揭示不同时空尺度湿地变化规律及其驱动机制,从整体上把握湿地动态变化趋势及成因,对湿地保护具有重要参考价值。
泉州湾河口湿地位于晋江、洛阳江出海口,生物资源丰富,拥有许多国家重点保护野生动物和珍稀植物。由于人口经济快速增长,泉州湾地区生态环境备受压力[7],红树林大面积减少,互花米草(Spartina alterniflora)群落蔓延速度加快。近年来,泉州湾湿地生态服务价值、保护区分区和湿地土壤性质等问题逐渐备受关注[8-10],王雨岚等[11]采用监督分类方法监测泉州湾滨海湿地变化,该方法因受光谱变异影响对同种地物产生噪声现象,可能影响湿地生态系统监测与评估可靠性;叶翔等[12]仅定性分析湿地围填海、养殖及人工生态系统工程等,未考虑社会经济因素及湿地土地类型间相互关系;路春燕等[13]结合质心迁移分析该地区红树林动态变化及驱动因素,但随着迁移方向不断变化,与驱动因素间难以建立有效数量关系。为此,以泉州湾河口湿地为研究对象,针对1990—2018年湿地资源遥感动态监测,依泉州湾湿地及非湿地分类体系,采用面向对象分类方法提取湿地变化特征,构建土地利用动态度模型及景观格局指数,建立Markov转移矩阵,筛选出红树林湿地面积变化驱动力因素,旨在为其变化过程监管及决策制定提供理论参考。
1. 研究区概况
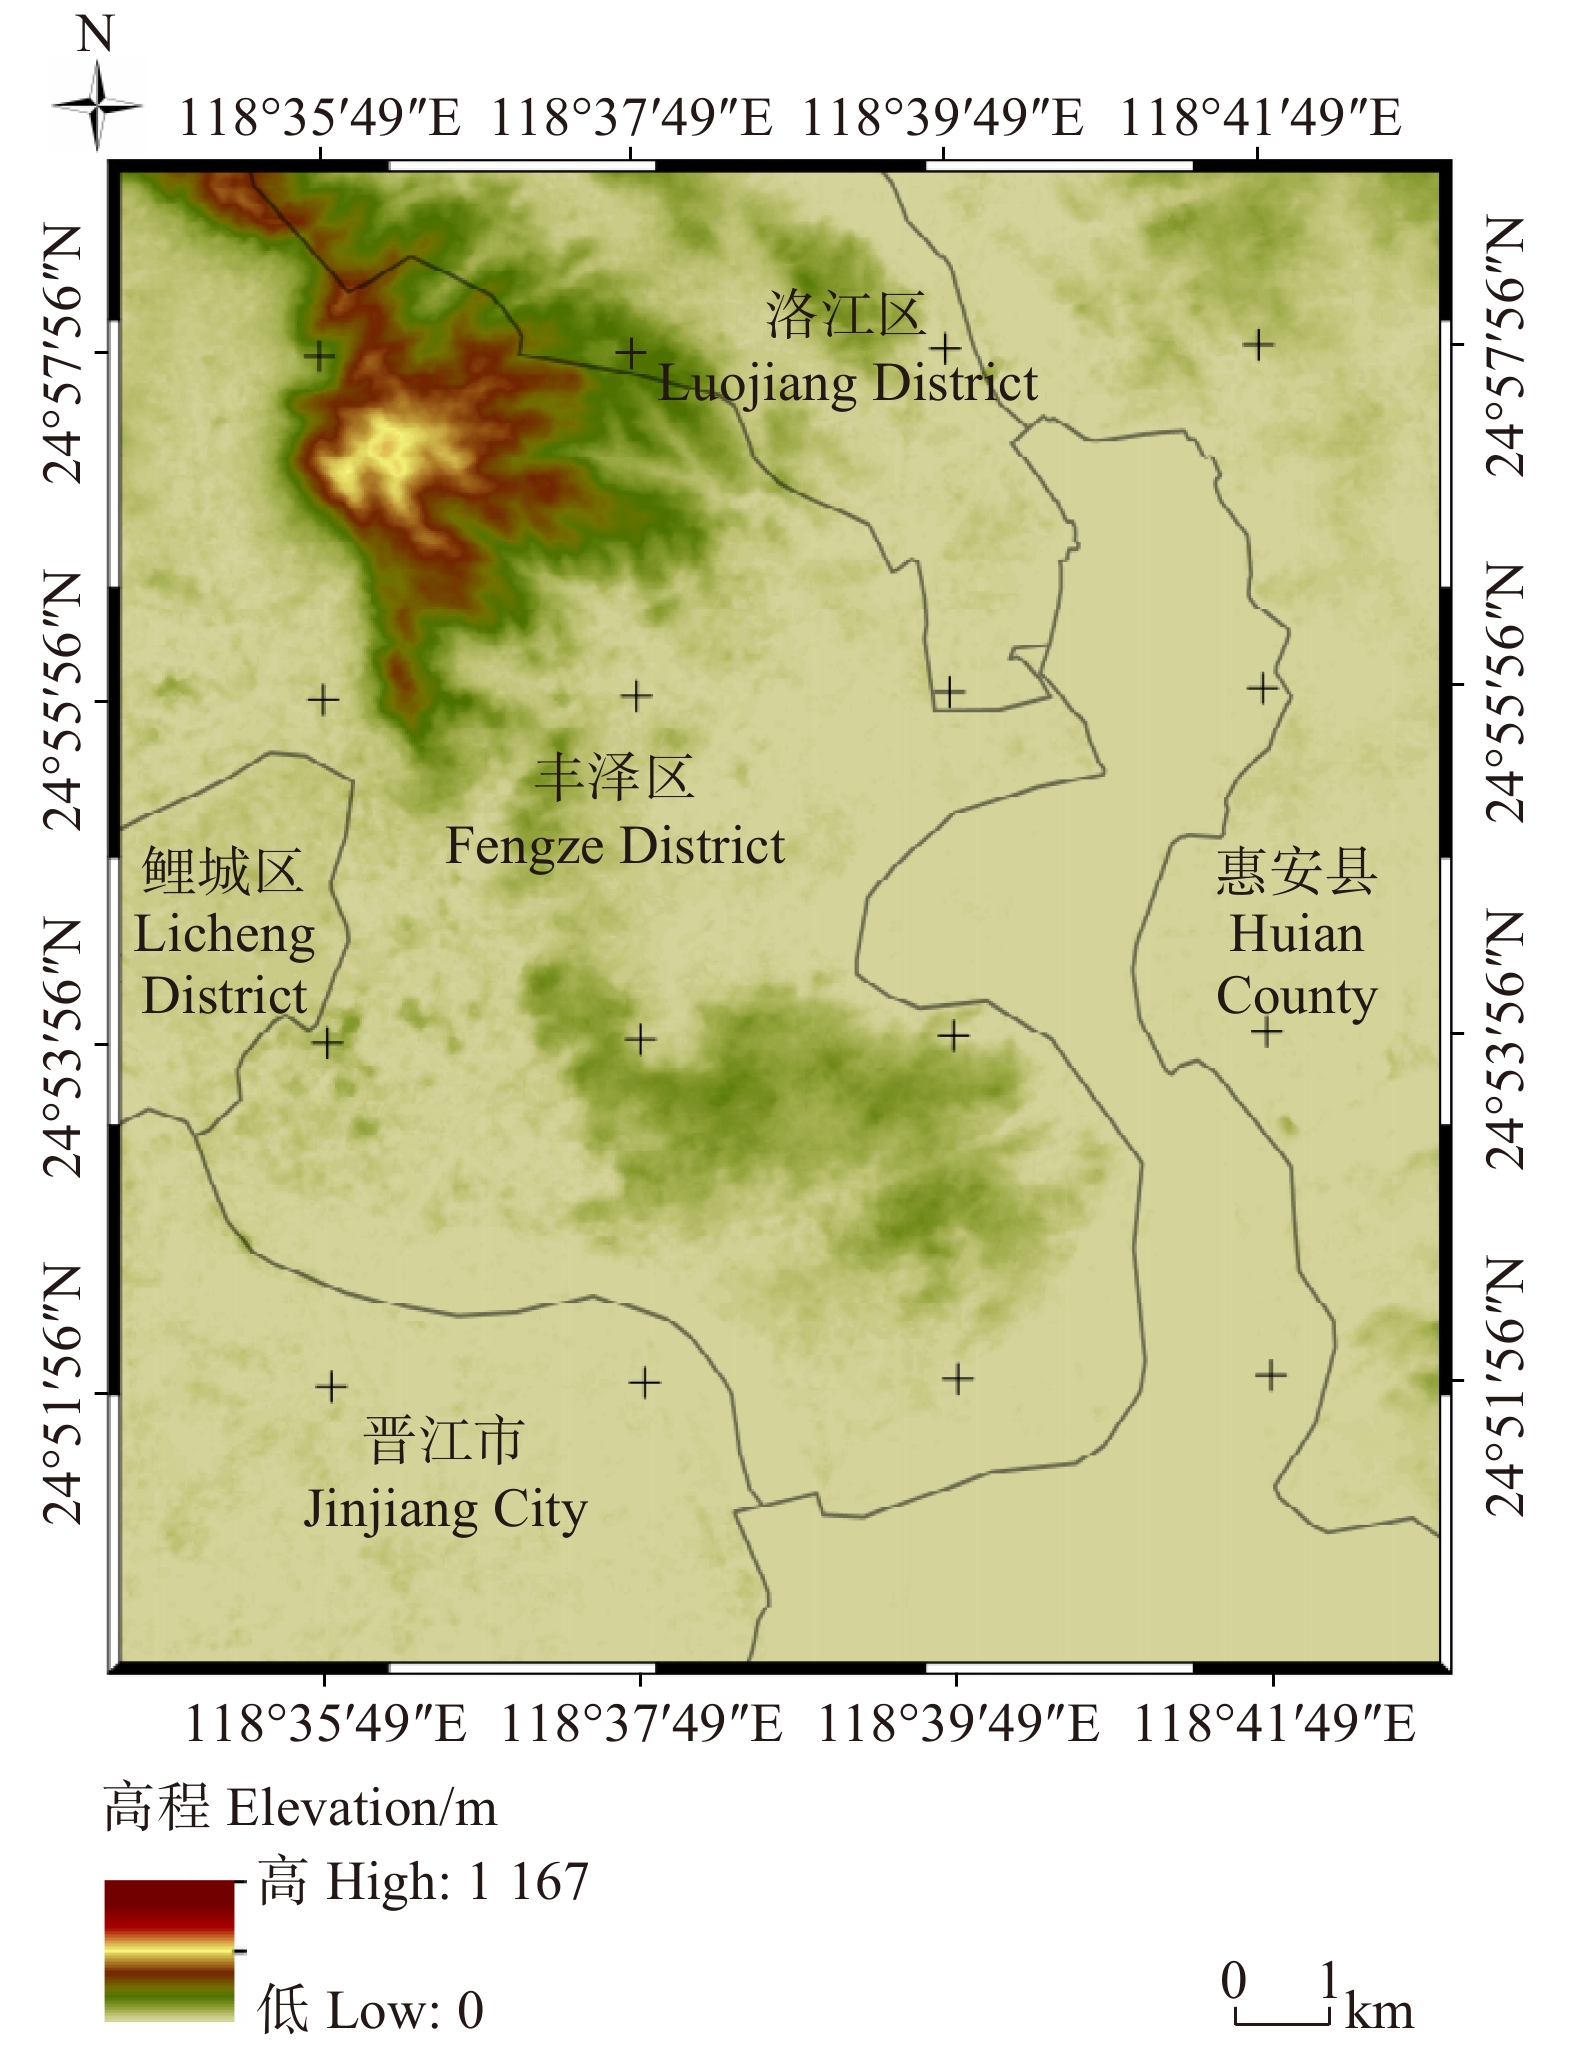
泉州湾河口湿地自然保护区位于福建省泉州市东南部,以惠安县的崇武半岛为起点,南至石狮市祥芝角(图1)。属南亚热带海洋季风气候,年平均气温为19.9 ℃,年降水量为1 095.4 mm,年相对湿度为78%。该地区生物多样性丰富,生长着许多珍稀植物,具有红树林、河口沼泽植被、河口沙生植被和浅水植被等4类植被类型[14],其中红树植物:秋茄(Kandelia candel)、桐花树(Aegiceras corniculatum)、白骨壤(Avicennia marina)等,国家重点保护野生动物:中华白海豚(Sousa chinensis)、中华鲟(Acipenser sinensi)、黄嘴白鹭(Egretta eulophotes)等。
2. 研究方法
2.1 数据来源
数据源为1990、1995、2000、2005、2010和2018年的Landsat TM遥感数据,投影方式为UTM-WGS84,空间投影分辨率为30 m。运用ArcGIS、eCognition Developer、ENVI和Fragstats软件处理与分析数据。选择邻近月份及云量覆盖少的影像数据,通过ENVI软件进行几何配准及大气校正,减少图像反射及大气造成的误差[15]。将矫正后的影像数据裁剪,获得研究区域遥感数据(24°49′00″ ~ 25°01′00″N,118°34′00″ ~ 118°43′00″E)。参考《湿地公约》[16]及中国湿地调查的分类系统[17],建立泉州湾湿地及非湿地分类体系,即天然湿地(含红树林、互花米草、滩涂和水域)、人工湿地(含养殖池)、非湿地(含林地、农地、建设及居民用地和道路)。考虑影像各波段的光谱信息丰富度、信息冗余程度和波段之间相关程度,采用432标准假彩色波段组合方案,以充分体现湿地复杂多样的植被特征及地物信息[18]。
2.2 面向对象湿地信息提取
基于光谱信息特征,面向对象分类法综合遥感影像的纹理信息、几何特征、语义、空间位置及相邻像元之间关联信息[19]。选择适宜分割参数,设置最优分割尺度为5、各个波段权重值为1、形状信息因子与紧密度分别设置为0.1、0.6。为减少特征变量冗余,优化分割完成后的特征样本。运用标准最邻近分类法[20],结合Google Earth泉州湾地区高清卫星图像,通过目视解译进行误差修正,可得1990—2018年泉州湾河口湿地土地利用变化分类图(图2)。
![]() 图 2 泉州湾河口湿地不同年份土地利用分类Figure 2. Land use classification map of Quanzhou Bay Estuary Wetland
图 2 泉州湾河口湿地不同年份土地利用分类Figure 2. Land use classification map of Quanzhou Bay Estuary Wetland2.3 土地利用动态度模型
土地利用动态度反映湿地土地变化的强度和土地利用类型转换率[21-22],计算公式:
Z=(Kb−Ka)Ka×1T×100% (1) 式中:Z表示一段时间内某类型的土地利用动态度,Kb表示研究期末某类型土地的面积,Ka表示研究初期某类型土地的面积,T表示研究时长。
2.4 景观格局指数
景观格局指数主要描述景观组成单元的类型、数目及空间配置等特征。从景观水平选取面积加权平均形状指数、蔓延度指数、香农多样性指数、香农均匀度指数等景观指数(表1),借助Fragstats 4.2软件,计算2005、2010及2018年该区域景观格局指数。
表 1 景观指数公式及参数含义[23]Table 1. Landscape index formula and its parameter meaning指标 Index 公式 Formula 意义说明 Explanation of meaning 面积加权平均形状指数
Area-weighted mean shape index (SA)SA=n∑j=1[xij(aijn∑j=1aij)] 指斑块形状复杂与不规则程度
It refers to the complex shape and irregular degree of patches蔓延度指数
Contagion index (CONTAG)CONTAG=1+∞∑i=1∞∑j=1Pijln(Pij)Pijln(Pij)2ln(m) 反应景观相邻之间的空间网格数量
The number of spatial grids between adjacent landscapes, reflecting the agglomeration degree香农多样性指数
Shannon’s diversity index (SHDI)SHDI=−∞∑i=1(PilnPi) 描述景观格局的景观类型的多样性以及异质性
It describes the diversity and heterogeneity of landscape types of landscape patterns香农均匀度指数
Shannon’s evenness index (SHEI)SHEI=−∞∑i=1Pi×lnPiln(m) 反应各景观类型面积的均匀程度
It indicates the uniformity of the area of each landscape type注:aij为某一斑块的面积,i表示类型,j表示斑块;xij表示某个斑块的周长;Pij表示表示类型i和类型j之间相邻的格网单元数目;Pi表示i占整个景观中所占面积的比例;m为景观类型中斑块类型数。Notes: aij is the area of a patch,i refers to the type,j refers to the patch;xij refers to the circumference of the patch;Pij refers to the number of adjacent grid cells between type i and type j;Pi refers to the ratio of i to the area occupied by the entire landscape;m is the number of patch types in the landscape type. 2.5 灰色关联度模型
灰色关联可用于分析系统因素间变化的关联性大小,将离散数据通过线性插值方式构造分段连续折线,比较研究对象与驱动力因素的折线形状贴合程度,确定序列之间关联程度[24-25]。由于影响湿地系统的因素具有复杂性,存在认知程度限制,即部分信息已知或未知,采用灰色关联度模型可挖掘红树林面积变化驱动力及其变化机制。
设有n个原始序列,每个序列有m个数据,为避免数据单位对分析影响,通过取平均值处理方法对原始序列数据进行变换,将变换后序列数据记为Xi = {Xi(1),Xi(2),···,Xi(k),···,Xi(m)},i = 1,2,···,n;k = 1,2,···,m。设序列X0为参考序列,通过计算灰色关联系数描述各因素发展趋势,计算公式为:
L(X0(k),Xi(k))=min (2) 式中:|X0(k)−Xi(k)|为k时刻Xi与X0的绝对差,
\mathop {{\rm{min}}}\limits_i \mathop {{\rm{min}}}\limits_k |X0(k)−Xi(k)|为两极最小差;\mathop {{\rm{max}}}\limits_i \mathop {{\rm{max}}}\limits_k |X0(k)−Xi(k)|为两极最大差,ρ为分辨系数,通常取0.5。考虑集中灰色关联序列信息,可将各时刻灰色关联系数取平均值得到灰色关联度,见式(3),其中L(X0,Xi)表示变量间关联度大小。
L({X_{\rm{0}}},{X_i}) = \frac{{\rm{1}}}{n}\sum\limits_{k = 1}^n {L({X_{\rm{0}}}(k),{X_i}(k))} (3) 3. 结果与分析
3.1 泉州湾湿地时空动态
3.1.1 湿地结构及动态度特征
1990—2018年天然湿地面积占比减少,人工湿地整体增加;具体到各个土地利用类型,互花米草群落、建设及居民用地、道路面积比例增加,林地面积快速缩减,红树林及农地面积波动大。互花米草群落面积占比上升2.21%,红树林面积比例以2000年为分界点先减后增,农地面积比例呈先增后减趋势。
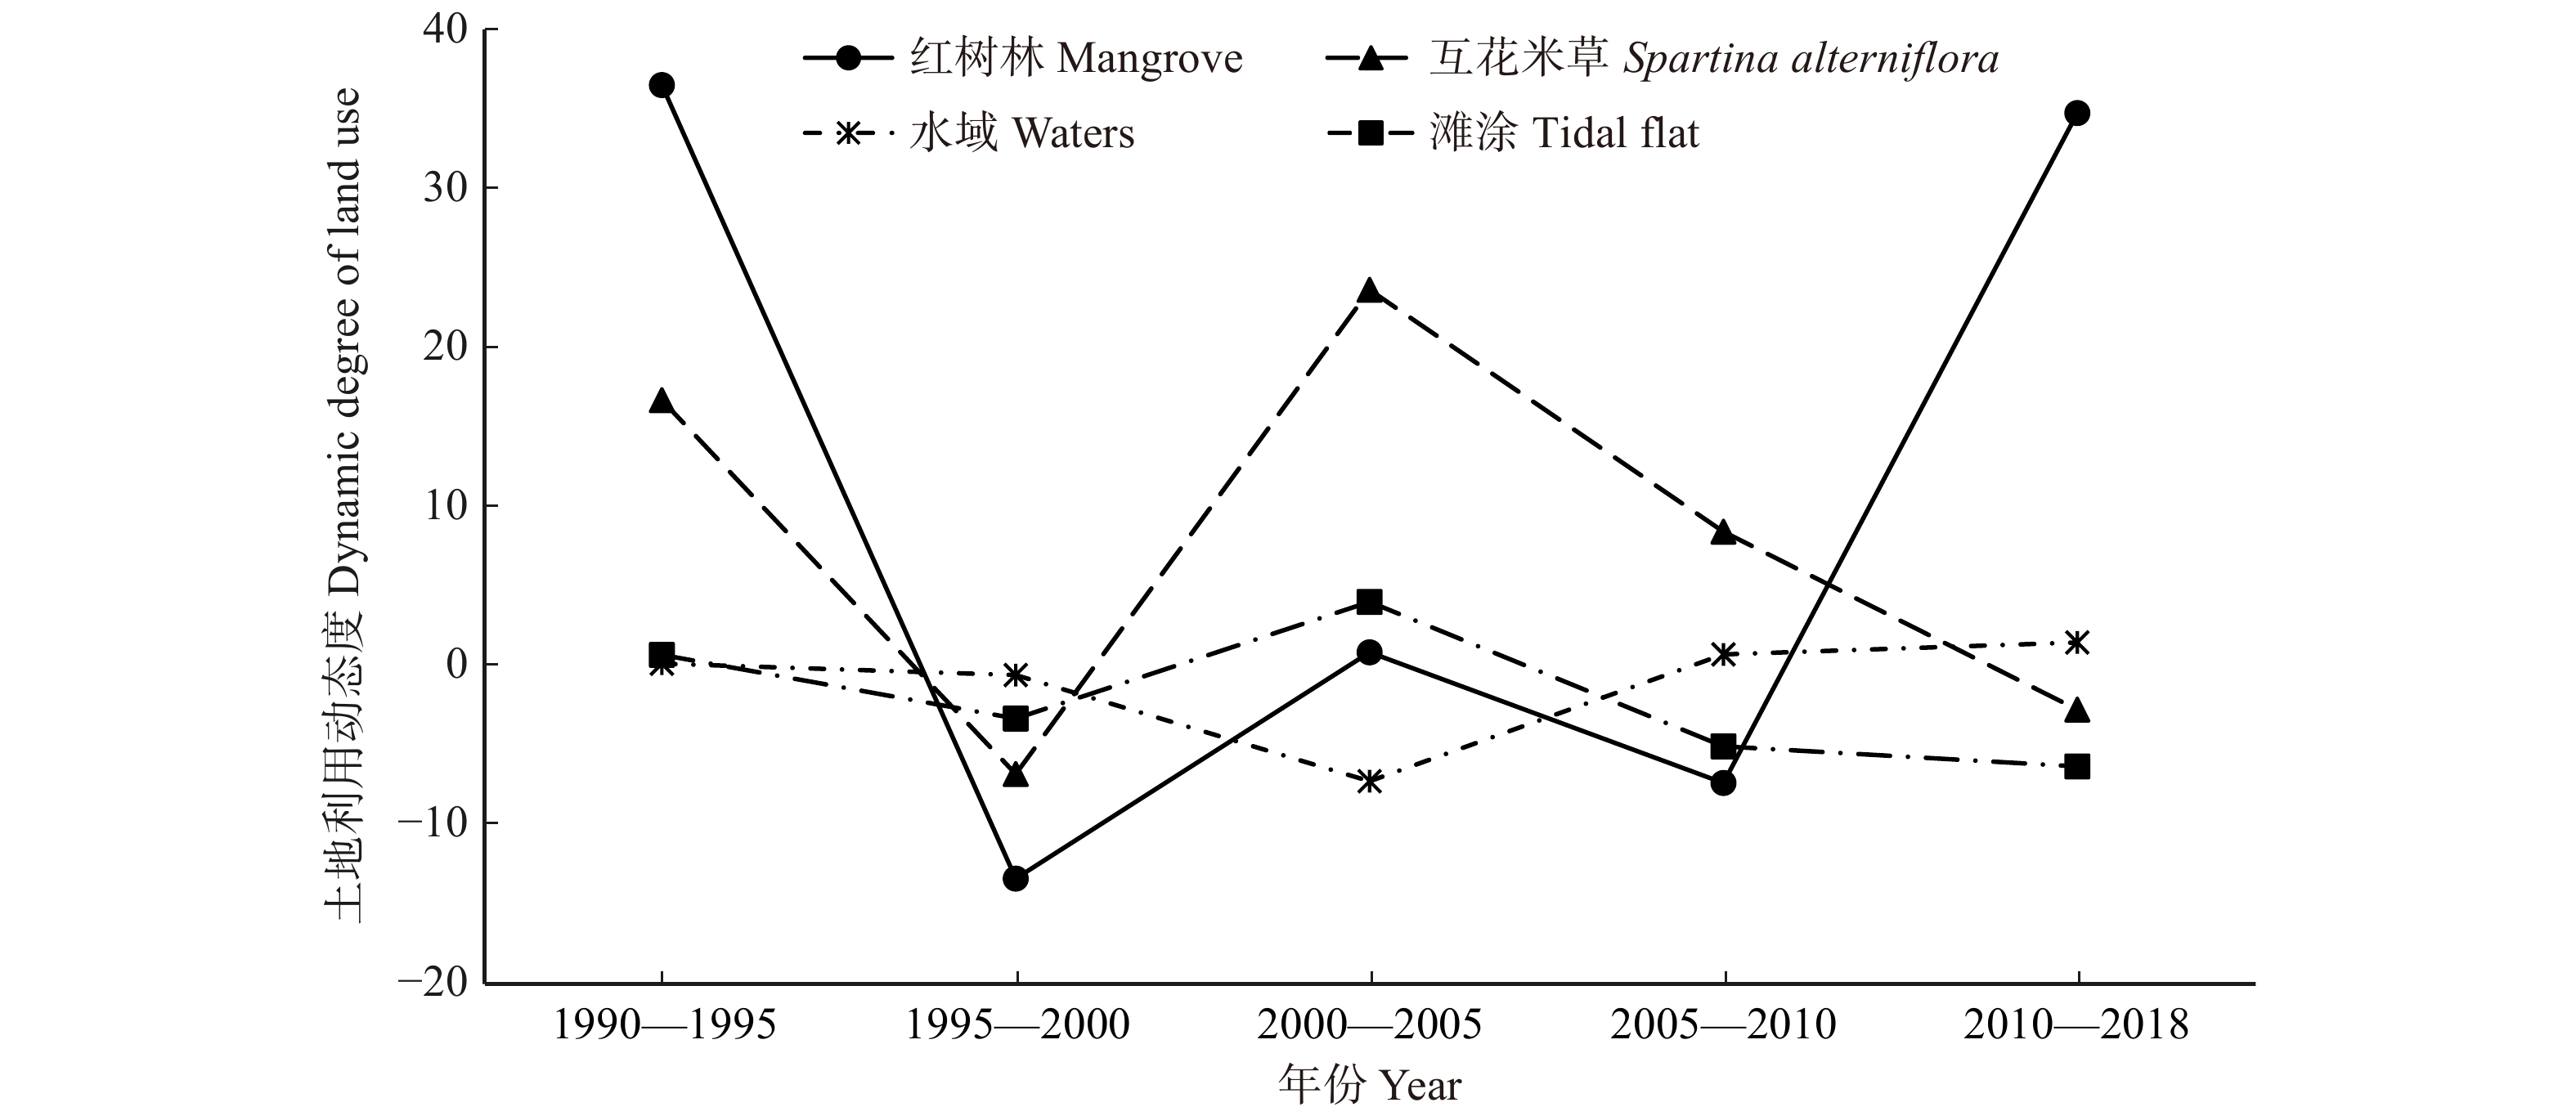
基于土地利用动态度模型,计算不同时间段各土地类型动态度,正值表示该土地类型面积增加,负值表示该土地类型面积减少,计算结果见图3。1990—2018年9类土地类型动态度(不计正负)红树林 > 互花米草群落 > 道路 > 养殖池 > 滩涂 > 建设及居民用地 > 水域 > 林地 > 农地。红树林、互花米草群落动态度波动大,其中互花米草群落2000—2005年动态度达到最高23.52%,随后呈减少趋势;而红树林1990—1995年动态度达到最高即36.39%,2010—2018年动态度达次高水平。
![]() 图 3 泉州湾河口湿地土地利用动态度Figure 3. Dynamic degree of land use in Quanzhou Bay Estuary Wetland
图 3 泉州湾河口湿地土地利用动态度Figure 3. Dynamic degree of land use in Quanzhou Bay Estuary Wetland3.1.2 湿地景观格局变化
泉州湾河口湿地景观类型丰富,景观格局整体趋于破碎化、斑块形状规则化,面积均匀程度较2005年有所提高。由表2可知2005—2018年蔓延度指数(CONTAG)下降幅度为9.64%,即景观类型斑块的聚拢程度减少,景观格局呈现出分散趋势;面积加权平均形状指数(SA)整体呈减少趋势,下降幅度为17.5%,景观斑块形状规则化,反映该区域可能受到一定人类活动干扰;香农多样性指数(SHDI)增加3.79%,表现为斑块复杂程度增加,景观类型多样性丰富度增大;均匀度指数(SHEI)总体呈上升趋势,即不同类型土地面积比例逐步趋向一致。
表 2 不同时期研究区域的景观指数Table 2. Landscape index of regional landscape level in different periods年份 Year SA CONTAG SHDI SHEI 2005 5.572 41.262 1.799 0.819 2010 6.340 41.533 1.764 0.803 2018 4.622 37.285 1.867 0.850 3.1.3 湿地转化数量特征
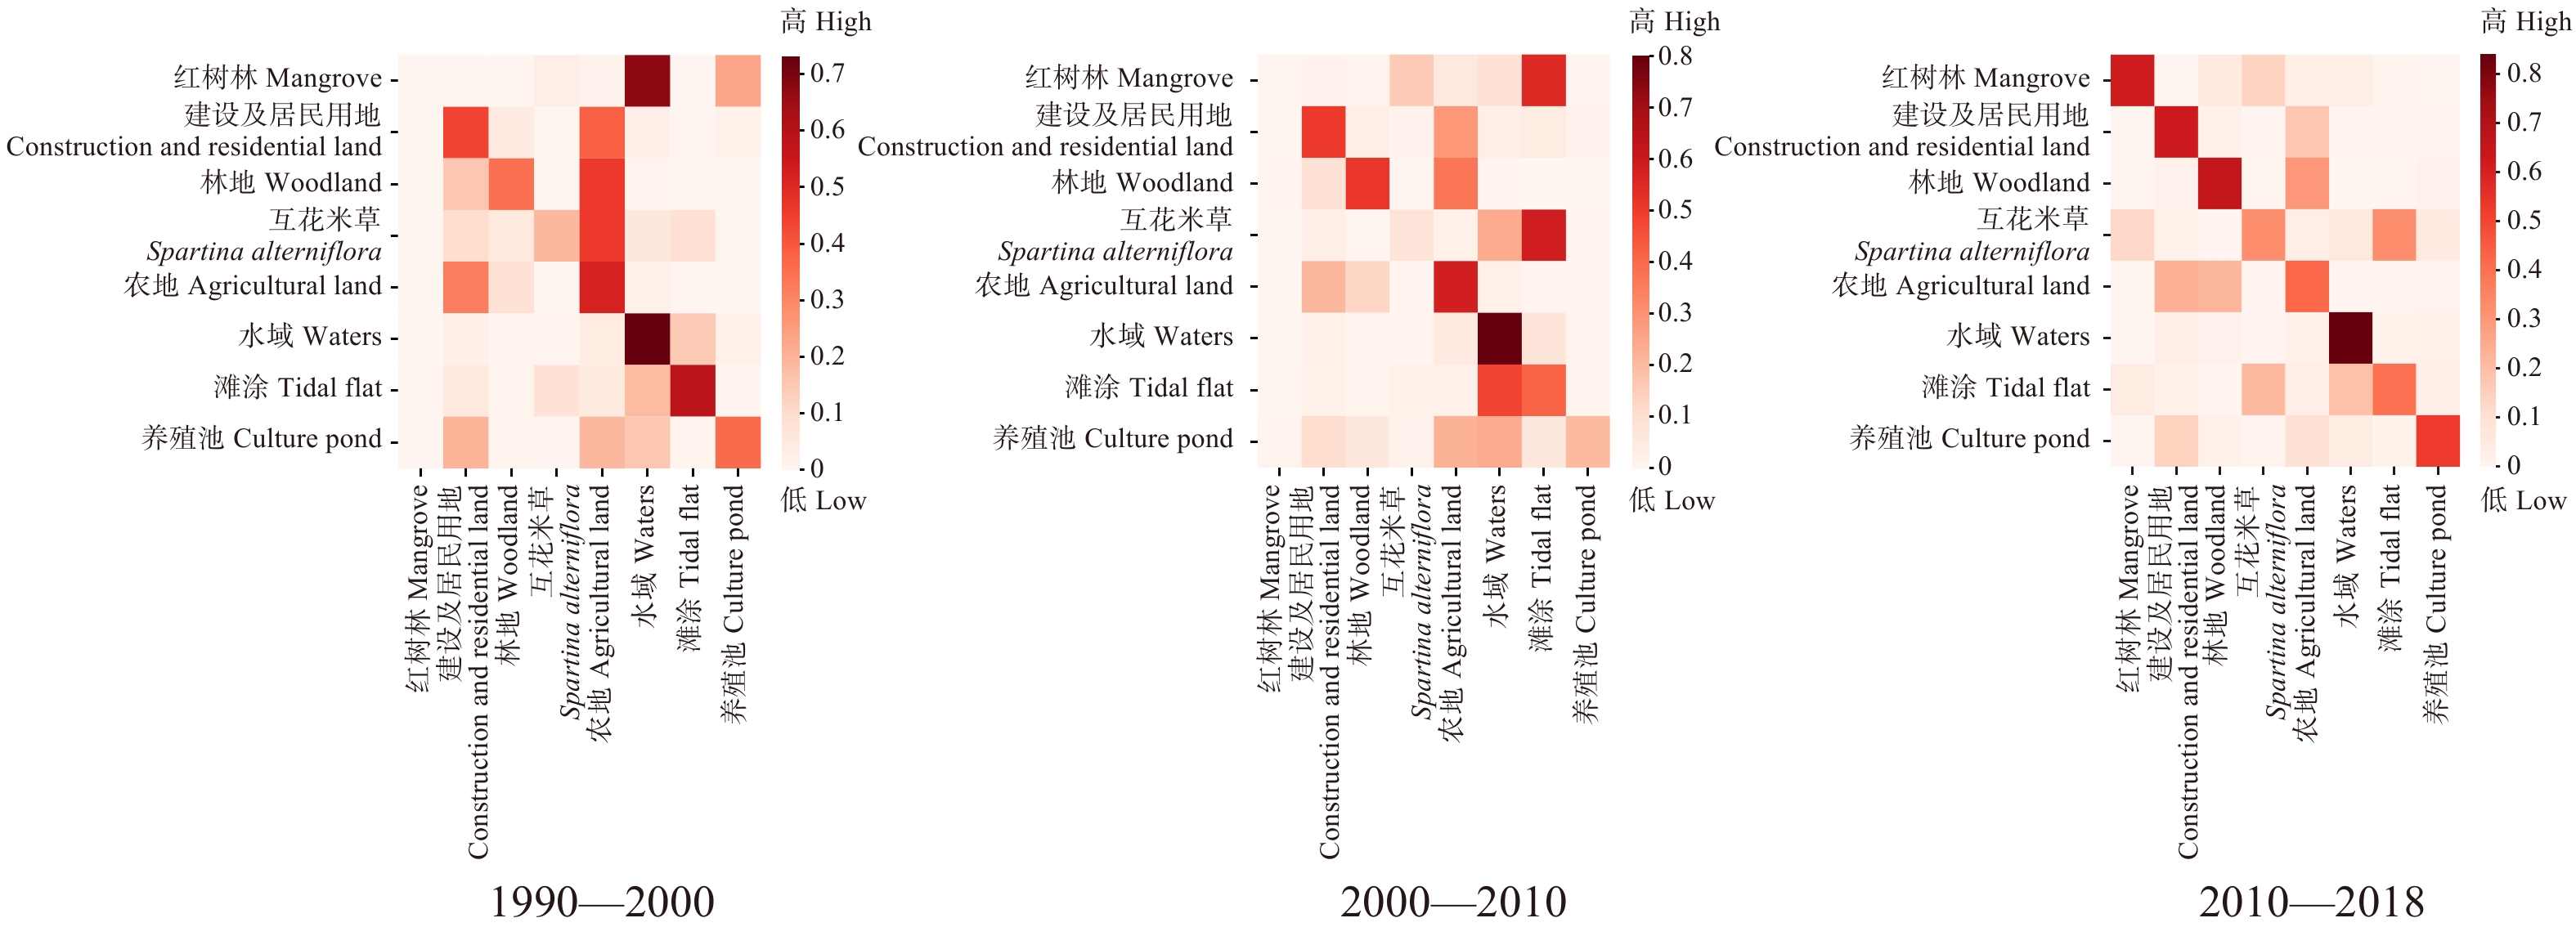
泉州湾河口湿地面积转移变化显著,由图4可知不同时段各土地类型间转移的数量关系:红树林在1990—2000年主要向水域及养殖池转出,人为破坏导致大量非法围堰开垦用于水产养殖,可能成为该地区红树林减少的主要原因之一;2000—2010年,大部分红树林转移为滩涂,占红树林总面积的55.22%;互花米草群落面积自2000年以来大面积向滩涂、红树林转出,2000—2010年、2010—2018年互花米草群落转移为滩涂,其转移面积占比分别为58.64%、32.49%;2010—2018年互花米草群落转移为红树林,其转移面积占比为12.71%。水域在1990—2000年、2000—2010年、2010—2018年均保持相对稳定,自转移概率均大于70%。
![]() 图 4 研究区域不同时段土地利用面积百分比转移矩阵数值范围在[0,1],行代表转出的土地类型、列代表转入的土地类型。The value range is [0,1],the row represents the land type transferred out and the column represents the land type transferred in.Figure 4. Transfer matrix of percentage of land use area in different periods
图 4 研究区域不同时段土地利用面积百分比转移矩阵数值范围在[0,1],行代表转出的土地类型、列代表转入的土地类型。The value range is [0,1],the row represents the land type transferred out and the column represents the land type transferred in.Figure 4. Transfer matrix of percentage of land use area in different periods3.2 红树林面积变化驱动力
3.2.1 社会经济因子对红树林面积的影响
随着社会经济发展、物质条件改善,人们对生态环境、生态产品的需求提高,加大红树林湿地保护投入。由表3可知,国内生产总值是影响红树林面积的最重要因素,即灰色关联度为0.89,经济发展初期,泉州湾地区红树林被严重破坏,导致面积和质量不断下降,使湿地功能急剧下降;随着GDP增长,泉州湾地区基础设施得到完善,投入红树林湿地保护的资金力量不断增加。园林绿地面积变化是影响红树林面积变化的第二驱动力,即灰色关联度为0.82,绿地面积的增加是衡量城市拥有绿地和公园的重要指标,湿地生态公园的增加一定程度上保护红树林面积。
表 3 社会经济因子与红树林面积的灰色关联度Table 3. Grey correlation degree between social economic factors and mangrove area年份
Year总人口
Total
population国内生产
总值/万元
Gross domestic
product/104 CNY地方财政一般
预算内支出/万元
General budget
expenditure of local
finance/104 CNY全社会固定资产
投资额/万元
Fixed asset investment
of the whole society/
104 CNY农作物播种
面积/103 hm2
Sown area of
crops/103 ha公路通车
里程
Highway
mileage/km园林绿地
面积/hm2
Area of garden
green space/ha2000 650 400 951.82 323 713.00 118 727.00 334.93 8 014.00 1 325.00 2005 1 003 300 3 400.96 271 902.00 1 215 695.00 293.16 6 038.00 2 962.00 2010 7 860 000 3 069.40 1 869 036.00 8 228 216.00 257.79 14 131.00 3 228.00 2018 7 423 300 7 547.82 6 378 083.00 4 123 802.00 260.65 17 656.00 8 865.00 L({X_{\rm{0}}},{X_i}) 0.67 0.89 0.68 0.55 0.66 0.64 0.82 注:社会经济因子数据来源于文献[26-29]。X0为不同年份红树林面积的参考序列,Xi为被比较序列,L(X0,Xi)表示与红树林面积的灰色关联度。下同。Notes: data of social economic factors are cited from reference [26-29]. X0 is the reference sequence of mangrove area in different years,Xi is the comparison sequence,L(X0,Xi) is the grey correlation degree with mangrove area. The same below. 3.2.2 其他土地类型面积对红树林面积的影响
由表4可知,道路面积、农地面积、建设及居民用地面积、养殖池面积与红树林面积关联度强,即灰色关联度均大于0.8,表明人类活动对红树林面积干扰强;互花米草群落面积、滩涂面积也与红树林面积均存在强关联,即灰色关联度分别为0.82、0.81,而泉州湾互花米草入侵、大面积滩涂养殖,导致互花米草群落快速扩散,改变土壤环境,影响红树林的生长环境。
表 4 其他土地类型与红树林面积的灰色关联度Table 4. Grey correlation between other land types and mangrove area年份
Year道路面
积/hm2
Road
area/ha建设及居民
用地面积/hm2
Construction and
residential land area/ha林地面
积/hm2
Woodland
area/ha互花米草群
落面积/hm2
Spartina Alterniflora
area/ha农地面
积/hm2
Agricultural
land area/ha水域面
积/hm2
Water
area/ha滩涂面
积/hm2
Tidal flat
area/ha养殖池
面积/hm2
Area of culture
pond/ha2000 11 921 56 438 28 100 3 009 85 174 37 538 22 072 3 385 2005 12 363 63 239 24 924 6 547 80 464 23 733 23 993 8 997 2010 12 926 60 854 27 491 9 271 86 438 24 452 17 793 5 643 2018 24 989 64 785 40 139 7 946 60 720 26 116 12 072 6 360 L({X_{\rm{0}}},{X_i}) 0.99 0.91 0.69 0.82 0.97 0.63 0.81 0.86 4. 结论与讨论
4.1 结 论
运用面向对象分类方法提取湿地信息,采用土地利用动态度模型,分析泉州湾河口湿地结构、动态特征及其景观格局变化规律,通过Markov转移概率矩阵描述湿地转化数量特征关系,主要结论为:
(1)泉州湾河口湿地景观类型丰富,各土地类型面积转移变化明显,尤其红树林、互花米草群落面积波动剧烈,互花米草引入后迅速生长繁殖,群落面积整体增加,影响海水交换能力抑制红树林生长,1995—2000年红树林面积减少556 hm2,导致该区生态环境受损。2000年泉州市政府实施5年生态环境保护计划,经生态修复,互花米草群落增长速率减缓,红树林面积得到一定恢复,减少与其他土地利用类型面积差异,使景观类型面积均匀度有所提高。2010—2018年红树林动态度达次高水平,可能与2010年展开新一轮生态修复工程取得成效有关。
(2)泉州湾河口湿地自然保护区毗邻城市用地,保护与利用矛盾突出,其红树林面积与受人类生产活动影响大的土地类型有较强关联,即关联度均大于0.8,结合图2、表4可知,道路面积、农地面积、建设及居民用地面积朝内陆方向增加,市中心整体向内陆移动,导致其远离红树林所在位置,减少人为干扰和影响,促进红树林面积总体上增加;泉州湾实验区作为重要水产养殖水域,创造了一定经济价值,也带来生态威胁,即跨海环湾大桥的修建和施工一定程度上也影响湿地保护。
(3)社会经济因素中,国内生产总值及园林绿地面积对红树林湿地面积变化具有很大影响,关联度均大于0.8;随着城市发展和经济水平提高,人们环保意识增强,增加对红树林保护投入,通过湿地生态公园建设加强保护。
4.2 讨 论
(1)通过定量遥感等手段分析1990—2018年湿地时空变化特征,对湿地保护政策制定提供一定参考。但湿地变化是复杂的生态过程,影响因素多,很有必要进一步探讨各影响因素不同时空作用下影响差异,结合时空统计分析模型进行地理分析、空间推理。
(2)研究数据来源于空间分辨率为30 m的Landsat-7光学遥感影像,通过植被分出水体、分辨潮湿土壤,仍存在一些象元混合度高情况造成解译精确度不够。为此可考虑结合面向对象与深度学习分类方法或融合其他影像数据来提高其精度问题。
(3)灰色关联度分析针对样本容量小的不完全信息能进行量化,比较各种驱动因子关联程度,但自变量间多重相关性方面就显得不足,需结合数据趋势及研究经验判断正负相关影响。
-
![]()
图 2 泉州湾河口湿地不同年份土地利用分类
Figure 2. Land use classification map of Quanzhou Bay Estuary Wetland
![]()
图 3 泉州湾河口湿地土地利用动态度
Figure 3. Dynamic degree of land use in Quanzhou Bay Estuary Wetland
![]()
图 4 研究区域不同时段土地利用面积百分比转移矩阵
数值范围在[0,1],行代表转出的土地类型、列代表转入的土地类型。The value range is [0,1],the row represents the land type transferred out and the column represents the land type transferred in.
Figure 4. Transfer matrix of percentage of land use area in different periods
表 1 景观指数公式及参数含义[23]
Table 1 Landscape index formula and its parameter meaning
指标 Index 公式 Formula 意义说明 Explanation of meaning 面积加权平均形状指数
Area-weighted mean shape index (SA){\rm{SA} } = \displaystyle\sum\limits_{j = 1}^n {\left[ { {x_{ij} }\left( {\dfrac{ { {a_{ij} } } }{ {\displaystyle\sum\limits_{j = 1}^n { {a_{ij} } } } } } \right)} \right]} 指斑块形状复杂与不规则程度
It refers to the complex shape and irregular degree of patches蔓延度指数
Contagion index (CONTAG){\rm{CONTAG} } = {\rm{1} } + \displaystyle\sum\limits_{ {\rm{i} } = 1}^\infty {\displaystyle\sum\limits_{j = 1}^\infty { {P_{ij} }{\rm{ln} }({P_{ij} })\dfrac{ { {P_{ij} }{\rm{ln} }({P_{ij} })} }{ {2{\rm{ln} }(m)} } } } 反应景观相邻之间的空间网格数量
The number of spatial grids between adjacent landscapes, reflecting the agglomeration degree香农多样性指数
Shannon’s diversity index (SHDI){\rm{SHDI} } = - \displaystyle\sum\limits_{ {\rm{i} } = 1}^\infty {({P_i}\ln {P_i})} 描述景观格局的景观类型的多样性以及异质性
It describes the diversity and heterogeneity of landscape types of landscape patterns香农均匀度指数
Shannon’s evenness index (SHEI){\rm{SHEI} } = \dfrac{ { - \displaystyle\sum\limits_{i = 1}^\infty { {P_i} \times {\rm{ln} }{P_i} } } }{ { {\rm{ln} }(m)} } 反应各景观类型面积的均匀程度
It indicates the uniformity of the area of each landscape type注:aij为某一斑块的面积,i表示类型,j表示斑块;xij表示某个斑块的周长;Pij表示表示类型i和类型j之间相邻的格网单元数目;Pi表示i占整个景观中所占面积的比例;m为景观类型中斑块类型数。Notes: aij is the area of a patch,i refers to the type,j refers to the patch;xij refers to the circumference of the patch;Pij refers to the number of adjacent grid cells between type i and type j;Pi refers to the ratio of i to the area occupied by the entire landscape;m is the number of patch types in the landscape type.  下载: 导出CSV
表 2 不同时期研究区域的景观指数
Table 2 Landscape index of regional landscape level in different periods
年份 Year SA CONTAG SHDI SHEI 2005 5.572 41.262 1.799 0.819 2010 6.340 41.533 1.764 0.803 2018 4.622 37.285 1.867 0.850
下载: 导出CSV
表 3 社会经济因子与红树林面积的灰色关联度
Table 3 Grey correlation degree between social economic factors and mangrove area
年份
Year总人口
Total
population国内生产
总值/万元
Gross domestic
product/104 CNY地方财政一般
预算内支出/万元
General budget
expenditure of local
finance/104 CNY全社会固定资产
投资额/万元
Fixed asset investment
of the whole society/
104 CNY农作物播种
面积/103 hm2
Sown area of
crops/103 ha公路通车
里程
Highway
mileage/km园林绿地
面积/hm2
Area of garden
green space/ha2000 650 400 951.82 323 713.00 118 727.00 334.93 8 014.00 1 325.00 2005 1 003 300 3 400.96 271 902.00 1 215 695.00 293.16 6 038.00 2 962.00 2010 7 860 000 3 069.40 1 869 036.00 8 228 216.00 257.79 14 131.00 3 228.00 2018 7 423 300 7 547.82 6 378 083.00 4 123 802.00 260.65 17 656.00 8 865.00 L({X_{\rm{0}}},{X_i}) 0.67 0.89 0.68 0.55 0.66 0.64 0.82 注:社会经济因子数据来源于文献[26-29]。X0为不同年份红树林面积的参考序列,Xi为被比较序列,L(X0,Xi)表示与红树林面积的灰色关联度。下同。Notes: data of social economic factors are cited from reference [26-29]. X0 is the reference sequence of mangrove area in different years,Xi is the comparison sequence,L(X0,Xi) is the grey correlation degree with mangrove area. The same below.
下载: 导出CSV
表 4 其他土地类型与红树林面积的灰色关联度
Table 4 Grey correlation between other land types and mangrove area
年份
Year道路面
积/hm2
Road
area/ha建设及居民
用地面积/hm2
Construction and
residential land area/ha林地面
积/hm2
Woodland
area/ha互花米草群
落面积/hm2
Spartina Alterniflora
area/ha农地面
积/hm2
Agricultural
land area/ha水域面
积/hm2
Water
area/ha滩涂面
积/hm2
Tidal flat
area/ha养殖池
面积/hm2
Area of culture
pond/ha2000 11 921 56 438 28 100 3 009 85 174 37 538 22 072 3 385 2005 12 363 63 239 24 924 6 547 80 464 23 733 23 993 8 997 2010 12 926 60 854 27 491 9 271 86 438 24 452 17 793 5 643 2018 24 989 64 785 40 139 7 946 60 720 26 116 12 072 6 360 L({X_{\rm{0}}},{X_i}) 0.99 0.91 0.69 0.82 0.97 0.63 0.81 0.86
下载: 导出CSV
-
[1] 孙广友. 中国湿地科学的进展与展望[J]. 地球科学进展, 2000, 15(6):666−672. doi: 10.3321/j.issn:1001-8166.2000.06.008 Sun G Y. Development and prospect of wetland science in China[J]. Advances in Earth Science, 2000, 15(6): 666−672. doi: 10.3321/j.issn:1001-8166.2000.06.008
[2] 黄桂林, 何平, 侯盟. 中国河口湿地研究现状及展望[J]. 应用生态学报, 2006, 17(9):1751−1756. doi: 10.3321/j.issn:1001-9332.2006.09.038 Huang G L, He P, Hou M. Present status and prospects of estuarine wetland research in China[J]. Chinese Journal of Applied Ecology, 2006, 17(9): 1751−1756. doi: 10.3321/j.issn:1001-9332.2006.09.038
[3] Roach N S, Barrett K. Managed habitats increase occupancy of black rails(Laterallus jamaicensis) and may buffer impacts from sea level rise[J]. Wetlands, 2015, 35(6): 1065−1076. doi: 10.1007/s13157-015-0695-6
[4] Zhang Y M, Zhao S D, Guo R C. Global wetlands: status and trends, scenarios and response options[J]. Advances in Earth Science, 2008, 23(4): 415−420.
[5] 韩大勇, 杨永兴, 杨杨, 等. 湿地退化研究进展[J]. 生态学报, 2012, 32(4):289−303. Han D Y, Yang Y X, Yang Y, et al. Recent advances in wetland degradation research[J]. Acta Ecologica Sinica, 2012, 32(4): 289−303.
[6] 杨永兴. 国际湿地科学研究的主要特点、进展与展望[J]. 地理科学进展, 2002, 21(2):111−120. doi: 10.3969/j.issn.1007-6301.2002.02.003 Yang Y X. Main Characteristics, progress and rospect of nternational wetland science research[J]. Advances in Earth Science, 2002, 21(2): 111−120. doi: 10.3969/j.issn.1007-6301.2002.02.003
[7] 李经建, 林永源. 泉州湾河口湿地保护现状及发展对策[J]. 湿地科学与管理, 2006, 2(1):47−50. Li J J, Lin Y Y. Current protective situations and development countermeasures of Quanzhou Bay estuarine wetland[J]. Wetland Science & Management, 2006, 2(1): 47−50.
[8] 游惠明, 韩建亮, 潘德灼, 等. 泉州湾河口湿地生态系统服务价值的动态评价及驱动力分析[J]. 应用生态学报, 2019, 30(12):4286−4292. You H M, Han J L, Pan D Z, et al. Dynamic evaluation and driving forces of ecosystem services in Quanzhou Bay estuary wetland in China[J]. Chinese Journal of Applied Ecology, 2019, 30(12): 4286−4292.
[9] 林志玮, 涂伟豪, 洪宇, 等. 结合多空间特性的保护区功能分区最优化设计[J]. 森林与环境学报, 2019, 39(3):248−255. Lin Z W, Tu W H, Hong Y, et al. Optimal design of functional zoning of nature reserves based multiple spatial characteristics[J]. Journal of Forest and Environment, 2019, 39(3): 248−255.
[10] 李云桑, 党玮, 郭沛涌, 等. 泉州湾滨海退化湿地红树林修复工程对土壤酶活性的影响[J]. 浙江大学学报(理学版), 2020, 47(5):624−629. Li Y S, Dang W, Guo P Y, et al. Effects of mangrove restoration on the soil enzyme activity at Quanzhou Bay degraded coastal wetland[J]. Journal of Zhejiang University (Science Edition), 2020, 47(5): 624−629.
[11] 王雨岚, 王远东, 郑衡泌. 基于多时相遥感的泉州湾滨海湿地变化监测[J]. 赣南师范大学学报, 2017, 38(3):102−107. Wang Y L, Wang Y D, Zheng H B. Monitoring dynamic changes of coastal wetlands and its surrounding areas in Quanzhou Bay based on multi-temporal remote[J]. Journal of Gannan Normal University, 2017, 38(3): 102−107.
[12] 叶翔, 王爱军, 马牧, 等. 高强度人类活动对泉州湾滨海湿地环境的影响及其对策[J]. 海洋科学, 2016, 40(1):94−100. doi: 10.11759/hykx20131205002 Ye X, Wang A J, Ma M, et al. Effects of high-intensity human activities on the environment variations of coastal wetland in the Quanzhou Bay in China[J]. Marine Sciences, 2016, 40(1): 94−100. doi: 10.11759/hykx20131205002
[13] 路春燕, 高弋斌, 陈远丽, 等. 基于RS/GIS的泉州湾红树林湿地时空动态变化分析[J]. 森林与环境学报, 2019, 39(2):143−152. Lu C Y, Gao Y B, Chen Y L, et al. Dynamic change analysis of mangrove swamps based on RS/GIS in Quanzhou Bay[J]. Journal of Forest and Environment, 2019, 39(2): 143−152.
[14] 王荣芬. 我国沼泽资源开发利用现状[J]. 地理科学, 1994, 14(3):261−269, 296. Wang R F. Development and utilization of swamp resources in China[J]. Scientia Geographica Sinica, 1994, 14(3): 261−269, 296.
[15] 姚薇, 李志军, 姚珙, 等. Landsat卫星遥感影像的大气校正方法研究[J]. 大气科学学报, 2011, 34(2):251−256. doi: 10.3969/j.issn.1674-7097.2011.02.016 Yao W, Li Z J, Yao G, et al. Atmospheric correction model for Landsat images[J]. Transactions of Atmospheric Sciences, 2011, 34(2): 251−256. doi: 10.3969/j.issn.1674-7097.2011.02.016
[16] 李禄康. 湿地与湿地公约[J]. 世界林业研究, 2001, 14(1):1−7. doi: 10.3969/j.issn.1001-4241.2001.01.001 Li L K. Wetlands and wetland convention[J]. World Forestry Research, 2001, 14(1): 1−7. doi: 10.3969/j.issn.1001-4241.2001.01.001
[17] 唐小平, 黄桂林. 中国湿地分类系统的研究[J]. 林业科学研究, 2003, 16(5):531−539. doi: 10.3321/j.issn:1001-1498.2003.05.003 Tang X P, Huang G L. Study on wetland classification system in China[J]. Forest Research, 2003, 16(5): 531−539. doi: 10.3321/j.issn:1001-1498.2003.05.003
[18] 常虹, 詹福雷, 杨国东, 等. 面向对象的高分遥感影像信息提取技术研究.[J]. 测绘通报, 2015, 61(1):99−101. Chang H, Zhan F L, Yang G D, et al. Research on objects-oriented information extraction technology for high resolution remote sensing image[J]. Bulletin of Surveying and Mapping, 2015, 61(1): 99−101.
[19] 陈秋晓, 骆剑承, 周成虎, 等. 基于多特征的遥感影像分类方法[J]. 遥感学报, 2004, 8(3):239−245. doi: 10.11834/jrs.20040308 Chen Q X, Luo J C, Zhou C H, et al. Classification of remotely sensed imagery using multi-features based approach[J]. National Remote Sensing Bulletin, 2004, 8(3): 239−245. doi: 10.11834/jrs.20040308
[20] Walter V. Object-based classification of remote sensing data for change detection[J]. ISPRS Journal of Photogrammetry and Remote Sensing, 2004, 58(3−4): 225−238. doi: 10.1016/j.isprsjprs.2003.09.007
[21] 刘盛和, 何书金. 土地利用动态变化的空间分析测算模型[J]. 自然资源学报, 2002, 17(5):533−540. doi: 10.3321/j.issn:1000-3037.2002.05.002 Liu S H, He S J. A spatial analysis model for measuring the rate of land use change[J]. Journal of Natural Resources, 2002, 17(5): 533−540. doi: 10.3321/j.issn:1000-3037.2002.05.002
[22] 王秀兰, 包玉海. 土地利用动态变化研究方法探讨[J]. 地理科学进展, 1999, 18(1):83−89. Wang X L, Bao Y H. Study on the methods of land use dynamic change research[J]. Progress in Geography, 1999, 18(1): 83−89.
[23] Gustafson E J. Quantifying landscape spatial pattern: what is the state of the art[J]. Ecosystems, 1998, 1(2): 143−156. doi: 10.1007/s100219900011
[24] 刘思峰, 蔡华, 杨英杰, 等. 灰色关联分析模型研究进展[J]. 系统工程理论与实践, 2013, 33(8):2041−2046. doi: 10.3969/j.issn.1000-6788.2013.08.018 Liu S F, Cai H, Yang Y J, et al. Advance in grey incidence analysis modelling[J]. Systems Engineering-Theory & Practice, 2013, 33(8): 2041−2046. doi: 10.3969/j.issn.1000-6788.2013.08.018
[25] 谭学瑞, 邓聚龙. 灰色关联分析: 多因素统计分析新方法[J]. 统计研究, 1995, 12(3):46−48. Tan X R, Deng J L. Grey incidence analysis: a new method of multivariate statistical analysis[J]. Statistical Research, 1995, 12(3): 46−48.
[26] 王丽娟, 陈兴鹏, 庞芳兰, 等. 兰州市土地利用变化及其社会驱动力研究[J]. 西北师范大学学报(自然科学版), 2007, 43(2):88−92. Wang L J, Chen X P, Pang F L, et al. Research on the process and social driving forces of land use change in Lanzhou City[J]. Journal of Northwest Normal University (Natural Science), 2007, 43(2): 88−92.
[27] 莫权芳, 钟仕全. 基于Landsat数据的铁山港区红树林变迁及其驱动力分析研究[J]. 科学技术与工程, 2014, 14(23):8−14. doi: 10.3969/j.issn.1671-1815.2014.23.002 Mo Q F, Zhong S Q. Analysis of mangrove changes and its driving forces based on Landsat data in Tieshangang[J]. Science Technology and Engineering, 2014, 14(23): 8−14. doi: 10.3969/j.issn.1671-1815.2014.23.002
[28] 李晓俞, 张东水, 马宇, 等. 1990 ~ 2015年间四省红树林变化监测及其驱动力分析[J]. 地理空间信息, 2020, 18(2):76−80, 87. doi: 10.3969/j.issn.1672-4623.2020.02.022 Li X Y, Zhang D S, Ma Y, et al. Monitoring and driving force analysis of mangrove change in four provinces from 1990 to 2015[J]. Geospatial Information, 2020, 18(2): 76−80, 87. doi: 10.3969/j.issn.1672-4623.2020.02.022
[29] 吴健生, 王政, 张理卿, 等. 景观格局变化驱动力研究进展[J]. 地理科学进展, 2012, 31(12):1739−1746. doi: 10.11820/dlkxjz.2012.12.021 Wu J S, Wang Z, Zhang L Q, et al. Research progresses on driving forces of the changes of landscape pattern[J]. Progress in Geography, 2012, 31(12): 1739−1746. doi: 10.11820/dlkxjz.2012.12.021
-
期刊类型引用(11)
1. 秦孝天,郭梦鸽,秦少华,陈瑞丹. 梅花新品种‘治章骨红重翠’跨品种群特性机制探究. 生物工程学报. 2024(01): 239-251 .  百度学术
百度学术
2. 周成宇,武怀燕,圣倩倩,曹福亮,祝遵凌. 33个观赏文冠果品系花瓣色彩的动态变化特征分析. 西部林业科学. 2023(05): 84-94 . 百度学术
3. 苏江硕,贾棣文,王思悦,张飞,蒋甲福,陈素梅,房伟民,陈发棣. 中国菊花遗传育种60年回顾与展望. 园艺学报. 2022(10): 2143-2162 . 百度学术
4. 付瀚森,张亚雯,赵阳阳,罗婷婷,邓慧杰,孟晨伟,王彩云. 菊花‘绿叮当’与毛华菊杂交后代花部性状杂种优势与混合遗传分析. 园艺学报. 2021(01): 96-106 . 百度学术
5. 周琦,赵峰,张慧会,祝遵凌. 香水莲花色素成分及含量的初步研究. 黑龙江农业科学. 2021(04): 72-78 . 百度学术
6. 侯瑞丽,武倩,闫星蓉,张芸香,郭晋平. 观赏型文冠果新品种花期颜色特征及其表型稳定性研究. 西北农业学报. 2021(01): 143-151 . 百度学术
7. 吴芳芳,原鑫,苏少文,贺丹,刘艺平,孔德政. 荷花品种的花器官表型性状及花色多样性分析. 河南农业大学学报. 2020(01): 24-29+37 . 百度学术
8. 赵晋陵,金玉,叶回春,黄文江,董莹莹,范玲玲,马慧琴,江静. 基于无人机多光谱影像的槟榔黄化病遥感监测. 农业工程学报. 2020(08): 54-61 . 百度学术
9. 丁苏芹,孙忆,李玺,唐东芹,史益敏. 小苍兰品种花色表型数量分类研究. 北方园艺. 2019(04): 85-91 . 百度学术
10. 袁培森,任守纲,翟肇裕,徐焕良. 基于半监督主动学习的菊花表型分类研究. 农业机械学报. 2018(09): 27-34 . 百度学术
11. 刘海英,高远,邢晨涛,甄俊琦,陆顺丽,王玉芝. 花青素苷提取专用菊种质及适宜采收期的筛选. 河南农业科学. 2018(09): 120-125 . 百度学术
其他类型引用(14)


计量
- 文章访问数: 1233
- HTML全文浏览量: 537
- PDF下载量: 75
- 被引次数: 25
