
Dynamic analysis of Capreolus pygargus home range in Saihanwula Nature Reserve, Inner Mongolia of northern China
-
摘要:目的 了解在自然保护区相对隔离环境中西伯利亚狍家域的季节和年度动态,分析狍对微生境和捕食风险的适应,为促进种群恢复和栖息地保护提供依据。方法 在内蒙古赛罕乌拉国家级自然保护区使用无线电遥测技术,以三角形法则进行个体定位,利用最小凸多边形法计算家域面积。结果 本次研究共捕捉到8只西伯利亚狍,其中3只以红外相机影像确认被猞猁捕食,面临较高的捕食风险。狍的年度和季节家域面积存在差异,春季的家域显著大于其他3个季节,同时,活动范围在冬季有从较高海拔山坡向沟底迁移的趋势。繁殖期与非繁殖期、亚成体与成体家域面积也存在差异。个体年度家域存在重叠,显示核心家域较为稳定。结论 影响西伯利亚狍个体家域年度和季节变化的因素为觅食机会、捕食风险和能量需求。据此提出了补加营养盐和越冬饲料的管理对策,促进保护区狍种群的复壮。Abstract:Objective This paper aims to understand the annual and seasonal dynamics of home ranges for Siberian roe deer (Capreolus pygargus) in the relatively isolated habitat of nature reserve and reveal its adaptation to the microhabitat and predation risk, so as to provide basic information for promoting population restoration and habitat protection.Method Radio telemetry and triangular positioning were carried out on the ground and the model of the minimum convex polygon was applied in the calculation of home range in Saihanwula National Nature Reserve of Inner Mongolia, northern China.Result A total of 8 animals were captured in this study, 3 of which were confirmed been preyed by lynx through camera trapping, which indicated an increasing predation risk in the study area. There were some differences between the annual and seasonal home ranges of roe deer and the spring home range was obviously larger than the other three seasons. The roe deer tended to migrate from the hillside at high altitudes to the lower valley in winter. There were also some differences between the breeding and non-breeding periods, between sub-adults and adults in home range variations. There were overlaps in the annual home ranges of the individuals, indicating that the core home range was relatively stable.Conclusion The influencing factors shaping the variations of annual and seasonal home ranges of the Siberian roe deer could be attributed to foraging opportunities, predation risk and energy requirements in the nature reserve. Accordingly, management strategies of supplying nutrient salt blocks and overwintering feeds are proposed to support the recovery of the roe deer population in the study area.
-
Keywords:
- Siberian roe deer /
- home range area /
- radio telemetry /
- minimum convex polygon /
- seasonal variation
-
土壤有机碳(soil organic carbon,SOC)是植物和微生物生长所必需的物质能量来源,是影响土壤肥力、生产力和养分有效性的关键因素,对土壤理化特性具有重要调节作用[1]。SOC储量分布特征是其长期累积的结果,与土壤剖面的发育密切相关。人工林生态系统具有较强的碳汇和增汇潜能[2],被认为是实现“双碳”目标最经济、最安全的有效途径之一[3]。人工林大面积营建改良了土壤质量,改变了土壤有机质的输入与分解方式,利于SOC贮存和积累[4],人工林土壤碳库库容较大,能维持较稳定的碳储量[5−6]。然而,人工林SOC的贮存受土壤理化性质、植被类型和地形等诸多因素的影响[7−8],关于不同人工林下SOC分布特征尚未达成共识。大量研究基于土壤表层或单一林分,吴慧等[9]研究得出热带山地雨林次生林在0 ~ 50 cm垂直方向上土壤有机碳质量分数随土壤深度增加而减小;王越等[10]通过文献整合分析得出油松(Pinus tabuliformis)林0 ~ 20 cm有机碳储量最高,20 ~ 60 cm稳定且保持较低水平;张智勇等[11]认为陕北黄土区沙棘林有机碳储量优于草地和油松林。据《全球森林评估》报道,我国人工林面积居世界前列[12],人工林生态系统对森林生态系统碳储量增加的贡献较大[13],因此阐明不同人工林SOC储量的分布特征在宏观方向上研究森林碳汇尤为重要。
黄土高原生境脆弱,水土流失严重。随着“退耕还林还草”生态工程的实施,黄土高原植被覆盖大幅增加[14],不同人工林土壤固碳问题逐渐成为研究者们关注的热点问题[15]。土地利用变化的改变增强了土壤碳汇功能[16]。Zhang等[17]研究得出退耕后土壤有机碳储量在0 ~ 20 cm以36.67 g/(m2· a)的速率发生巨大的变化,包玉斌[18]研究了2000—2010年陕北黄土高原退耕年间,其退耕地土壤碳固存总量增加。目前,关于黄土高原SOC储量的研究多集中在大尺度空间分布[19]、单一人工林[20]、模型拟合[21]和浅层土壤(0 ~ 100 cm)[11]。这些研究仅是土地利用前后或退耕后单一林地与草地或农田之间的对比研究,而对于退耕后不同人工林及深层土壤SOC储量的研究较少。相关研究表明,土壤是一个不均匀且不连续的时空变异体[22],其演化过程十分复杂。土壤碳库的分布特征,因缺乏连续、可靠、统一的土壤剖面资料,区域SOC储量实测及代表性数据贫乏[23],存在明显的不确定性[24]。因此,准确评估退耕后小尺度不同人工林SOC储量的分布特征,对森林土壤有机碳库的精确估算以及土壤碳汇研究具有重要意义。
鉴于此,本研究以黄土丘陵区典型同一退耕年限的人工油松林、山杏(Armeniaca sibirica)林、沙棘(Hippophae rhamnoides)林和天然草地0 ~ 200 cm土壤为研究对象,探究不同人工林SOC储量的垂直分布特征,以期为准确计算黄土高原有机碳储量提供数据支撑,为建立黄土高原土壤碳库,优化人工林土壤固碳格局提供理论依据。
1. 研究区概况与研究方法
1.1 研究区概况
研究区位于陕西省吴起县(107°38′57″ ~ 108°32′49″ E,36°33′33″ ~ 37°24′27″ N),海拔高度1 233 ~ 1 809 m,是典型的黄土高原丘陵沟壑区。吴起县地处中温带半湿润—半干旱区域,温带大陆性季风气候特征明显,年均温7.8 ℃,年平均降水量483.4 mm,时空分布不均,主要集中在7—9月,年无霜期146 d。主要土壤类型为黄绵土,结构疏松、持水力低、易侵蚀。自1999年坡耕地转变为林地以来,形成了刺槐(Robinia pseudoacacia)、油松、侧柏(Platycladus orientalis)、山杏、沙棘、柠条(Caragana sinica)、白莲蒿(Artemisia stechmanniana)、达乌里胡枝子(Lespedeza daurica)等以及自然恢复草地为主的乔灌草植物群落,全县林草覆盖率显著增加,生态环境得以改善。
1.2 土壤样品采集与处理
于2020年9月进行样品采集,在研究区选择相同退耕年限的典型人工油松林、山杏林、沙棘林和天然草地,分别布设25 m × 25 m大样方,利用GPS采集地理信息数据,样地基本信息如表1。使用内径6 cm的土钻,在样方内,采用五点采样法,以0 ~ 20 cm、20 ~ 40 cm、40 ~ 60 cm、60 ~ 100 cm、100 ~ 150 cm、150 ~ 200 cm分层采集土壤样品,带回实验室进行分析。待土壤样品风干后,研磨、过筛,进行理化性质测定。土壤密度采用环刀法测定,土壤有机碳采用重铬酸钾稀释热法测定,全氮采用半微量凯式定氮法测定,全磷采用硫酸−高氯酸消煮−钼锑抗比色法定,全碳通过元素分析仪测定,无机碳根据全碳、有机碳之间关系获得,碱解氮采用碱解扩散法测定,速效磷采用钼锑抗比色法测定,土壤粒度组成使用激光粒度分析仪(Mastersize-zer 3000)测定[25]。
表 1 样地基本信息Table 1. Basic information of the sample plots人工林
Plantation海拔
Elevation/m坡度
Gradient/(°)坡向
Aspect平均高度
Average
height/m平均胸径
Average DBH/cm郁闭度或盖度
Crown density or
coverage林下优势种
Dominant understory
species油松 Pinus tabuliformis 1 362.6 20 SFS 8.5 11.3 0.65 MO, LB, ASB 山杏 Armeniaca sibirica 1 459.7 21 SFS 7.3 10.4 0.62 ASB, PS, LB, PC 沙棘 Hippophae rhamnoides 1 389.9 6 NFS 2.9 3.5 0.71 LS, ASW, LB 草地 Grassland 1 376.7 33 SFS 0.86 LB, LS, SC 注:SFS. 阳坡;NFS. 阴坡;MO. 草木犀;LB. 胡枝子;ASB. 白莲蒿;PS. 败酱;PC. 委陵菜;LS. 赖草;ASW. 猪毛蒿;SC. 针茅。Notes: SFS, south-facing slope; NFS, north-facing slope; MO, Melilotus officinalis; LB, Lespedeza bicolor; ASB, Artemisia stechmanniana; PS, Patrinia scabiosaefolia; PC, Potentilla chinensis; LS, Leymus secalinus; ASW, Artemisia scoparia; SC, Stipa capillata. 土壤有机碳储量计算公式为
SOC储量=wSOCi×ρBDi×Di×0.01 式中:SOC储量表示土壤有机碳储量(g/m2),wSOCi表示第i层的土壤有机碳含量(g/kg),ρBDi表示第i层的土壤密度(g/cm3),Di表示第i层的土层厚度。
1.3 数据处理
应用SPSS26.0对数据进行统计分析,采用单因素方差分析(ANOVA)对比不同人工林、不同土层深度有机碳储量之间的差异;应用Origin2018对土壤有机碳储量与土壤理化性质、不同人工林、地形等影响因素之间的关系强弱和作用机理进行PCA分析并绘图;应用R4.2.1对土壤有机碳储量和各环境变量的贡献关系进行冗余分析。
2. 结果与分析
2.1 有机碳储量分布特征
研究区0 ~ 200 cm土层平均SOC储量由大到小为山杏(16.190 g/m2) > 草地(15.403 g/m2) > 沙棘(11.449 g/m2) > 油松(10.188 g/m2)(表2)。不同人工林SOC储量变异系数在10% ~ 30%,为中等程度变异,表现为沙棘(0.219) > 山杏(0.136) > 油松(0.124) > 草地(0.115)。变异系数表征了SOC储量的空间异质性,沙棘的SOC储量空间异质性最大,草地的SOC储量空间异质性最低。
表 2 不同人工林土壤有机碳储量描述统计Table 2. Description statistical characteristics of soil organic carbon stocks content in different plantations人工林
Plantation土层 Soil
layer/cm平均值
Mean value/(g·m−2)最大值
Max. value/(g·m−2)最小值
Min. value/(g·m−2)标准差
Standard deviation变异系数
Variation coefficient占比
Proportion油松
Pinus tabuliformis0 ~ 20 11.658 12.197 10.627 0.893 0.077 0.191 20 ~ 40 7.009 9.253 4.457 2.412 0.344 0.115 40 ~ 60 7.691 8.506 7.267 0.706 0.092 0.126 60 ~ 100 10.246 12.052 8.016 2.051 0.200 0.167 100 ~ 150 13.491 13.844 13.040 0.411 0.030 0.221 150 ~ 200 11.035 11.050 11.010 0.022 0.002 0.180 0 ~ 200 10.188 13.490 7.008 1.082 0.124 山杏
Armeniaca sibirica0 ~ 20 19.049 20.198 16.988 1.789 0.094 0.196 20 ~ 40 13.201 17.450 10.940 3.683 0.279 0.136 40 ~ 60 11.359 12.901 10.199 1.390 0.122 0.117 60 ~ 100 19.106 23.617 15.815 4.041 0.211 0.197 100 ~ 150 20.097 22.132 19.009 1.764 0.088 0.207 150 ~ 200 14.332 14.670 14.033 0.320 0.022 0.147 0 ~ 200 16.190 20.097 11.359 2.184 0.136 沙棘
Hippophae rhamnoides0 ~ 20 19.692 24.417 16.385 4.199 0.214 0.287 20 ~ 40 9.659 13.084 7.616 2.984 0.309 0.141 40 ~ 60 5.912 8.583 4.269 2.333 0.395 0.086 60 ~ 100 8.850 10.196 7.530 1.333 0.151 0.128 100 ~ 150 13.247 15.749 11.861 2.171 0.164 0.193 150 ~ 200 11.333 12.417 10.544 0.971 0.086 0.165 0 ~ 200 11.449 19.691 5.912 2.331 0.219 草地 Grassland 0 ~ 20 19.906 22.351 16.274 3.208 0.161 0.215 20 ~ 40 10.066 11.177 8.118 1.692 0.168 0.109 40 ~ 60 9.256 10.564 8.160 1.216 0.131 0.100 60 ~ 100 14.409 15.494 12.767 1.446 0.100 0.156 100 ~ 150 20.021 20.836 18.609 1.228 0.061 0.217 150 ~ 200 18.760 20.178 17.629 1.299 0.069 0.203 0 ~ 200 15.403 20.021 9.255 1.681 0.115 在不同人工林中(图1),在0~200 cm剖面上SOC储量呈现出山杏(97.145 g/m2) > 草地(92.418 g/m2) > 沙棘(68.695 g/m2) > 油松(61.130 g/m2)的分布格局,山杏的SOC储量与油松、沙棘差异显著(P < 0.05)。人工油松林,山杏林,沙棘林与天然草地0 ~ 60 cm SOC储量占整个剖面的43.11%、44.89%、51.33%、42.45%,表层碳储量高。垂直分布上,油松、山杏、沙棘的SOC储量自表层向下随深度增加变异系数先增大后减小,在20 ~ 40 cm土层变异系数达到最大,草地的SOC储量自表层向下随深度增加变异系数减小。在不同深度土层中,油松的SOC储量与山杏、沙棘、草地在0 ~ 20 cm、20 ~ 40 cm、150 ~ 200 cm土层差异显著(P < 0.05),沙棘的SOC储量与山杏、油松、草地在40 ~ 60 cm、60 ~ 100 cm土层差异显著(P < 0.05),油松、沙棘的SOC储量与山杏、草地在100 ~ 150 cm土层差异显著(P < 0.05)。
![]() 图 1 不同人工林土壤有机碳储量的垂直分布Figure 1. Vertical distribution of soil organic carbon stocks in different plantations
图 1 不同人工林土壤有机碳储量的垂直分布Figure 1. Vertical distribution of soil organic carbon stocks in different plantations2.2 环境因素对典型人工林土壤有机碳储量的影响
典型人工林SOC储量空间变异的主成分分析如下(图2),第一轴和第二轴解释值分别为39.70%和22.70%。第一主成分与部分环境指标的相关系数在0.37以上,其中,PC1与粉粒、黏粒、坡度正相关,与砂粒负相关,第一主成分主要包含了土壤物理性质信息;第二主成分与部分环境指标的相关系数0.5以上,其中PC2与全碳、碱解氮、全氮正相关,主要包含了土壤化学信息,第一和第二主成分反映的信息量占总信息量的62.40%。
![]() 图 2 土壤有机碳储量与土壤环境因子的主成分分析TP. 全磷;TN. 全氮;TC. 全碳;SIC. 土壤无机碳;AP. 速效磷;AN. 碱解氮;Clay. 黏粒;Silt. 粉粒;Sand. 砂粒;ELE. 海拔;SA. 坡向;SG. 坡度。下同。PC1. 第一主成分;PC2. 第二主成分。TP, total phosphorus; TN, total nitrogen; TC, total carbon; SIC, soil inorganic carbon; AP, available phosphorus; AN, alkali-hydrolyzable nitrogen; Clay, clay; Silt, silt; Sand, sand; ELE, elevation; SA, slope aspect; SG, slope gradient. The same below. PC1, the first principal component; PC2, the second principal component.Figure 2. Principal component analysis of soil organic carbon stocks and soil environmental factors
图 2 土壤有机碳储量与土壤环境因子的主成分分析TP. 全磷;TN. 全氮;TC. 全碳;SIC. 土壤无机碳;AP. 速效磷;AN. 碱解氮;Clay. 黏粒;Silt. 粉粒;Sand. 砂粒;ELE. 海拔;SA. 坡向;SG. 坡度。下同。PC1. 第一主成分;PC2. 第二主成分。TP, total phosphorus; TN, total nitrogen; TC, total carbon; SIC, soil inorganic carbon; AP, available phosphorus; AN, alkali-hydrolyzable nitrogen; Clay, clay; Silt, silt; Sand, sand; ELE, elevation; SA, slope aspect; SG, slope gradient. The same below. PC1, the first principal component; PC2, the second principal component.Figure 2. Principal component analysis of soil organic carbon stocks and soil environmental factors2.3 环境因素对土壤剖面有机碳储量垂直分布的影响
不同环境因素对SOC储量垂直变化的贡献度不同(图3)。土壤化学性质、土壤物理性质、地形和植被群落分别对0 ~ 200 cm土壤剖面中SOC储量分布差异的影响约占51.84%、13.58%、30.71%和3.87%。在土壤化学性质中,0 ~ 200 cm SOC储量的变化受全磷影响最大(11.99%),受全氮影响最小(5.64%);在土壤物理性质中,0 ~ 200 cm SOC储量的变化受砂粒影响最大(5.65%),受黏粒影响最小(2.89%);在地形因素中,0 ~ 200 cm SOC储量的变化受海拔影响最大(19.66%),受坡向影响最小(4.97%);植物群落对0 ~ 200 cm SOC储量变化影响较小。
![]() 图 3 土壤化学性质、土壤物理性质、地形和植物群落对土壤有机碳储量变化的相对贡献SCP. 土壤化学性质;SPP. 土壤物理性质;Topo. 地形;PT. 植物群落。SCP, soil chemical property, SPP, soil physical property, Topo, topography, PT, phytocoenosium.Figure 3. Relative contribution of soil chemistry, soil physical properties, topography and phytocoenosium to changes in soil organic carbon stocks
图 3 土壤化学性质、土壤物理性质、地形和植物群落对土壤有机碳储量变化的相对贡献SCP. 土壤化学性质;SPP. 土壤物理性质;Topo. 地形;PT. 植物群落。SCP, soil chemical property, SPP, soil physical property, Topo, topography, PT, phytocoenosium.Figure 3. Relative contribution of soil chemistry, soil physical properties, topography and phytocoenosium to changes in soil organic carbon stocks3. 讨 论
3.1 不同人工林土壤有机碳储量分布差异的对比
本研究发现SOC储量富集在土壤表层,呈现出明显的“表聚性”,这与王文静等[26]的研究结论一致。不同植被群落在土壤浅层聚集了大量的根系和凋落物,凋落物分解产生有机质归还于土壤,通过养分的循环进入土壤[27],因此,大量的有机碳在土壤表层形成和累积。
本研究中,山杏林表现出最优的土壤固碳效益,草地次之,油松林最差,这与李龙波等[28]对乔灌草固碳效益效果的研究结果不一致。植被类型和植被生长间的差异会导致土壤温度、湿度、凋落物数量和根系分泌物等的显著不同[29],进而影响土壤的固碳效益。本研究中草地植被覆盖度高于油松和沙棘林下植被覆盖度(表1),单位面积的植被残体、根系分泌物、枯枝落叶量多,有机质输入量更高,同时,适宜的土壤温度和湿度促进了微生物的生长代谢,提高了植被残体的分解速率,使得草地土壤固碳效率提高。不同人工林中,植物生产力和质量的巨大差异导致SOC储量空间分布的显著差异[30]。且有研究表明,在年平均降水量 < 510 mm区域,草地比灌木和林地积累更多的有机碳[31],本研究区位于黄土丘陵区,年降水量483.4 mm,草地SOC储量高于沙棘和油松。落叶乔木在增加枯落物归还量方面明显优于常绿乔木,这在诸多研究中均有报道[32]。本研究中山杏SOC储量远高于油松,是因为落叶阔叶乔木比常绿针叶乔木产生更多的枯落物凋落量[32],山杏林表层枯落物多,根密度大,不断更替的根系结合不断积累的地表枯落物,不仅改变了土壤腐殖质,也改善了土壤质地,增加了土壤有机碳的积累,因此山杏林具有较高的土壤碳储量,碳汇功能表现较强。
3.2 土壤有机碳储量空间差异的主要影响因素和作用机制
本研究中,不同人工林土壤有机碳储量与黏粒、粉粒和坡度正相关,砂粒与土壤有机碳储量负相关,这阐释了土壤粒径及坡度与土壤有机碳储量之间的关系,这与李顺姬等[33]的研究结果一致。土壤结构是影响有机质分解的主导因素[34],黏粒对土壤有机碳有很好的保护作用,砂质土壤有机碳的矿化更为迅速[33]。当土壤黏粒含量较高时,具有较大的表面积,易形成较多的毛细管,有较强的毛管作用,完整的土壤孔隙为有机碳自表层向下层传输提供了通道,促进深层土壤有机碳固存[35],具有较强的固碳能力。而当土壤砂粒含量较高时,有效土层薄,土壤生物作用弱,土壤有机碳矿化作用较弱,微生物群落质量较低,土壤固碳能力较低。黄土丘陵区“退耕还林还草”工程对土壤机械组成产生一定的影响,使土壤物理性质发生变化。土壤机械组成影响土壤孔隙度、密度,改变土壤的透气性和持水能力,改变植物根系的生长发育及微生物活动条件,进而影响有机碳的储存[36]。坡度显著影响土壤有机碳固存,坡度通过影响水分运移、植被分布及土壤机械组成等间接影响土壤有机碳储量。
本研究中,土壤化学性质对SOC储量的影响较大,全氮、碱解氮、全磷对土壤有机碳储量正向效应显著,阐释了土壤有机碳与土壤养分之间的关系。土壤全氮和碱解氮对土壤有机碳的转化和固存有重要作用。全氮对有机碳储量起正向效应,较高的全氮可以降低凋落物中的碳氮比,避免微生物与植物的“争氮”现象,利于凋落物矿化分解[37],促进土壤有机碳储存。这与王越等[10]研究得出全氮对土壤有机碳呈显著正效应的结果一致。有研究表明,地形显著影响土壤发育、迁移等活动,从而影响土壤碳的输入输出过程[38]。黄土丘陵区水土流失导致了流域内水土资源的重新分配,冗余分析表明,海拔对土壤剖面有机碳储量贮存起主要贡献(图3),通过调控水热条件,进而影响土壤有机碳的积累[39]。
4. 结 论
(1)研究区不同人工林土壤碳储量不同,表现为山杏 > 草地 > 沙棘 > 油松。因此,在黄土高原地区进行人工林营建时,可优先配置山杏林与适宜草种,以增加黄土高原土壤固碳。
(2)研究区不同人工林土壤有机碳储量与土壤机械组成和土壤养分显著相关,黏粒、粉粒、砂粒、全氮、碱解氮是影响黄土丘陵区不同人工林土壤有机碳储量空间分布的主导因子。
(3)研究区人工林土壤有机碳储量在土壤剖面中差异较大,土壤有机碳储量的垂直分布主要受地形的影响。其中,海拔通过影响有机碳的转化与固存对土壤有机碳储量的贮存起主要贡献作用。
-
![]()
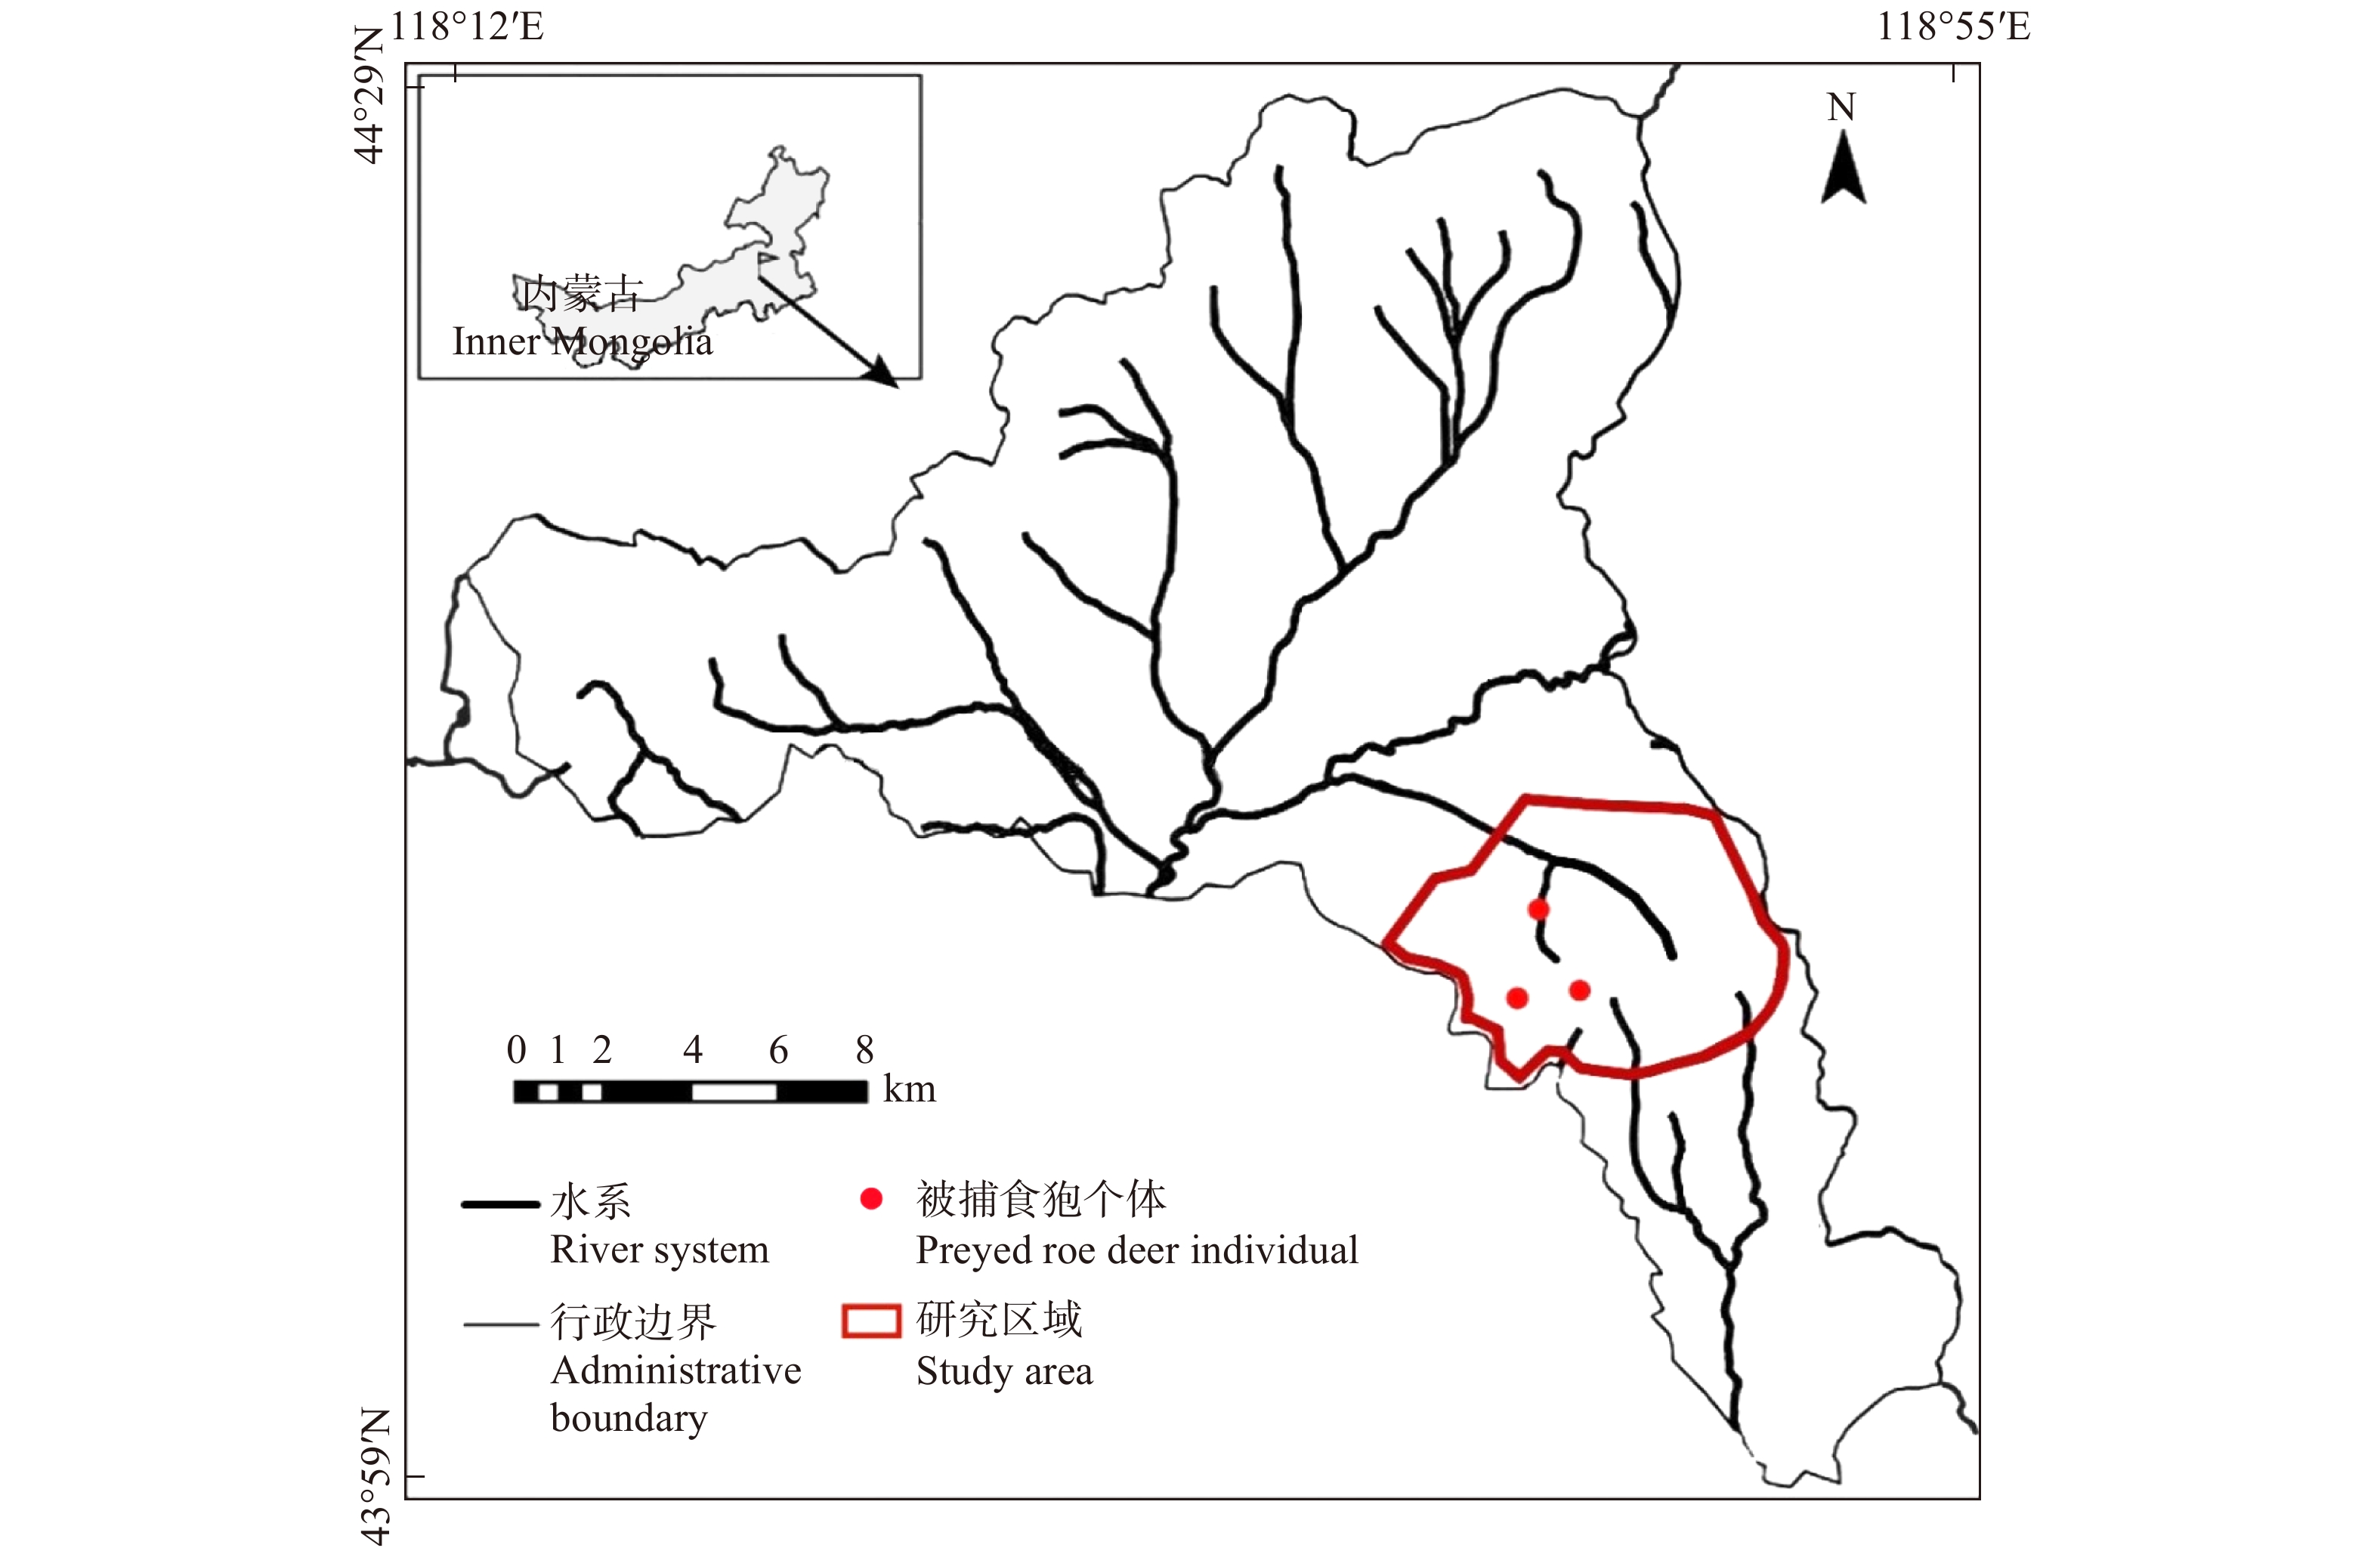
图 1 内蒙古赛罕乌拉国家级自然保护区地理位置图及本研究区域
Figure 1. Geographical location map of Saihanwula National Nature Reserve in Inner Mongolia and this study area
![]()
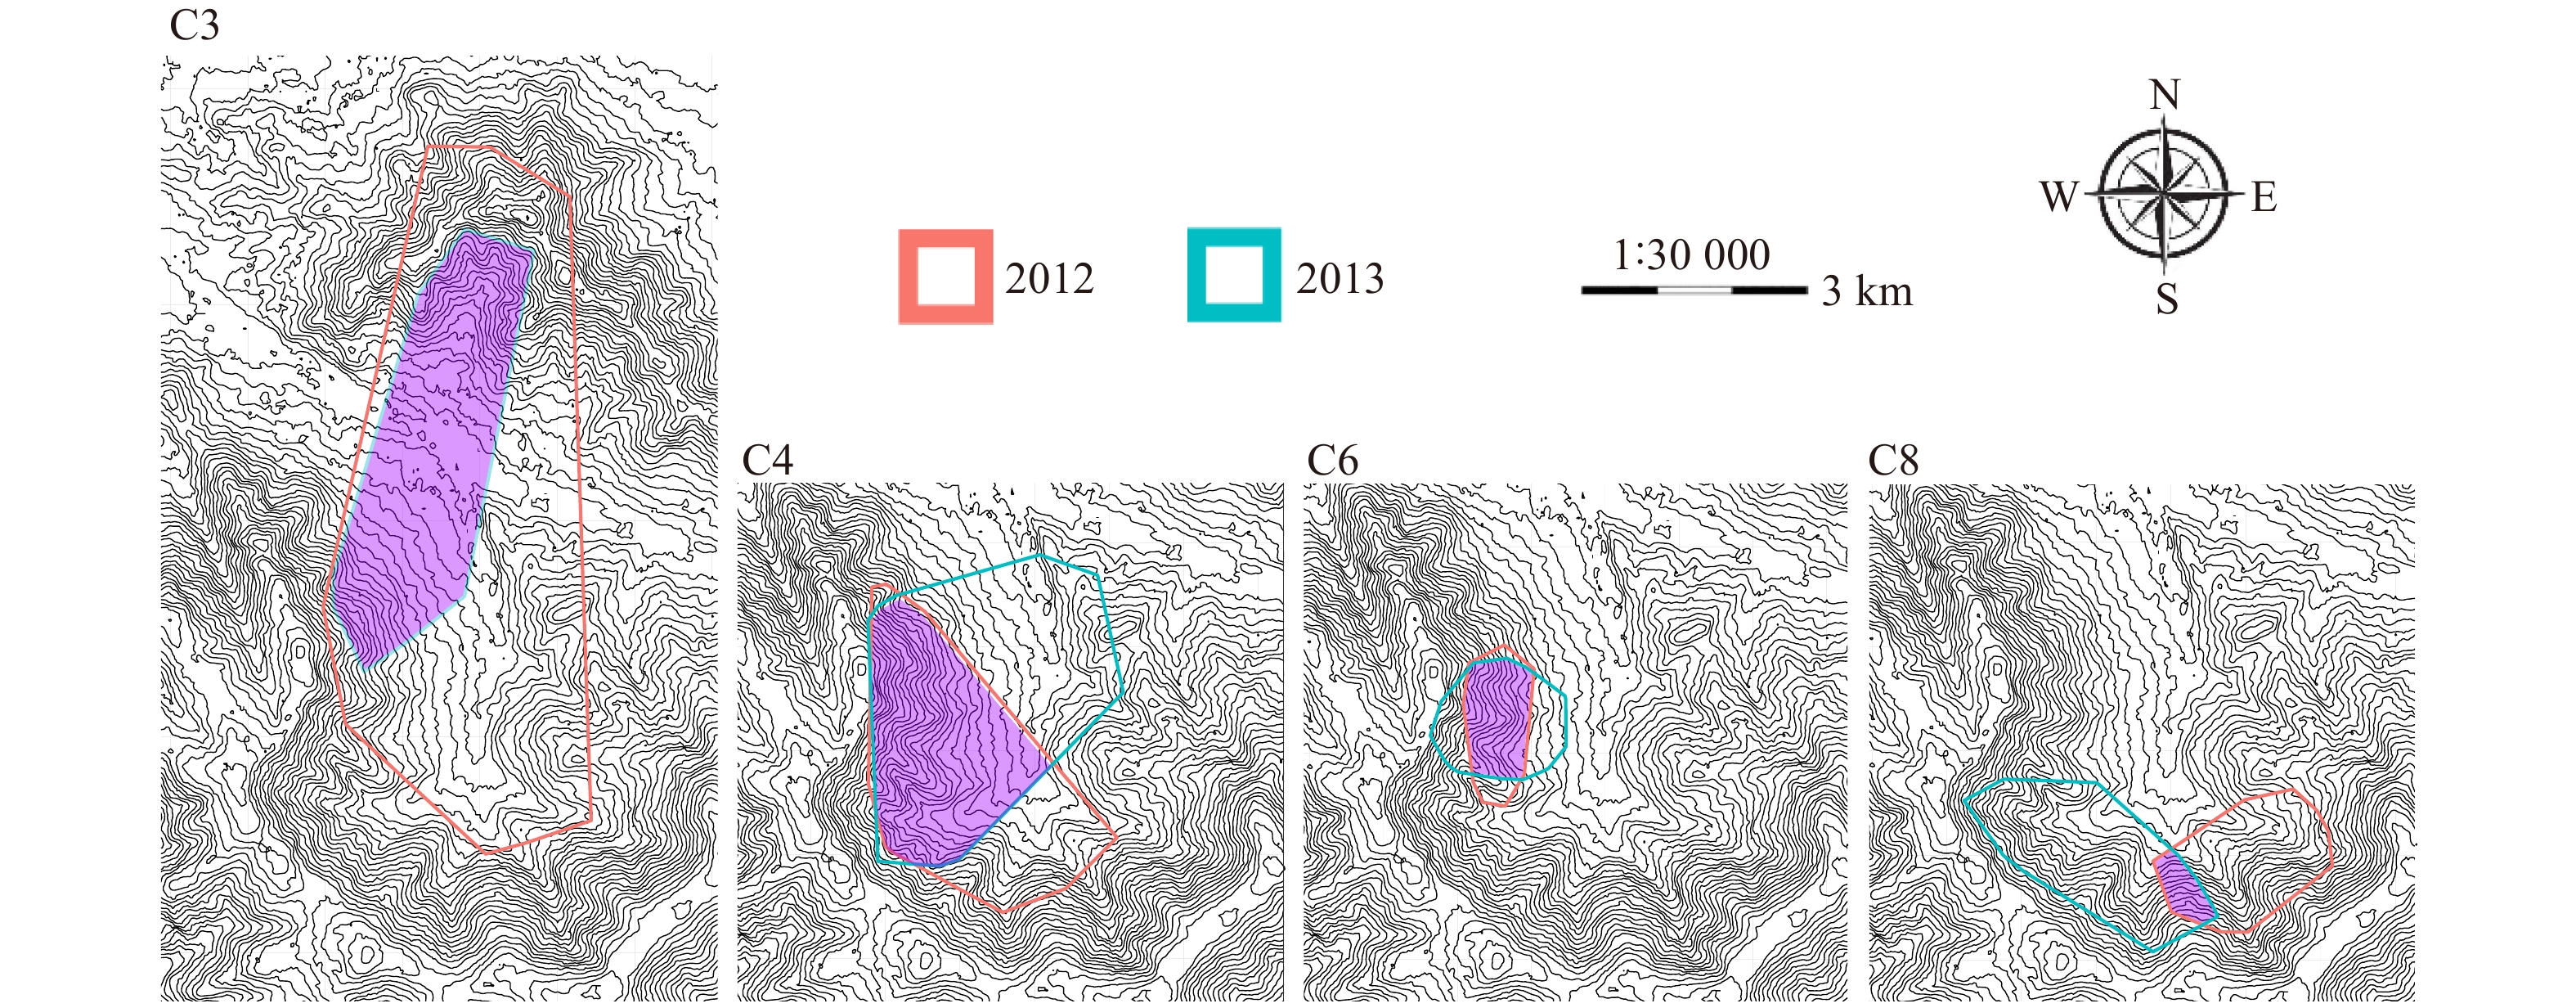
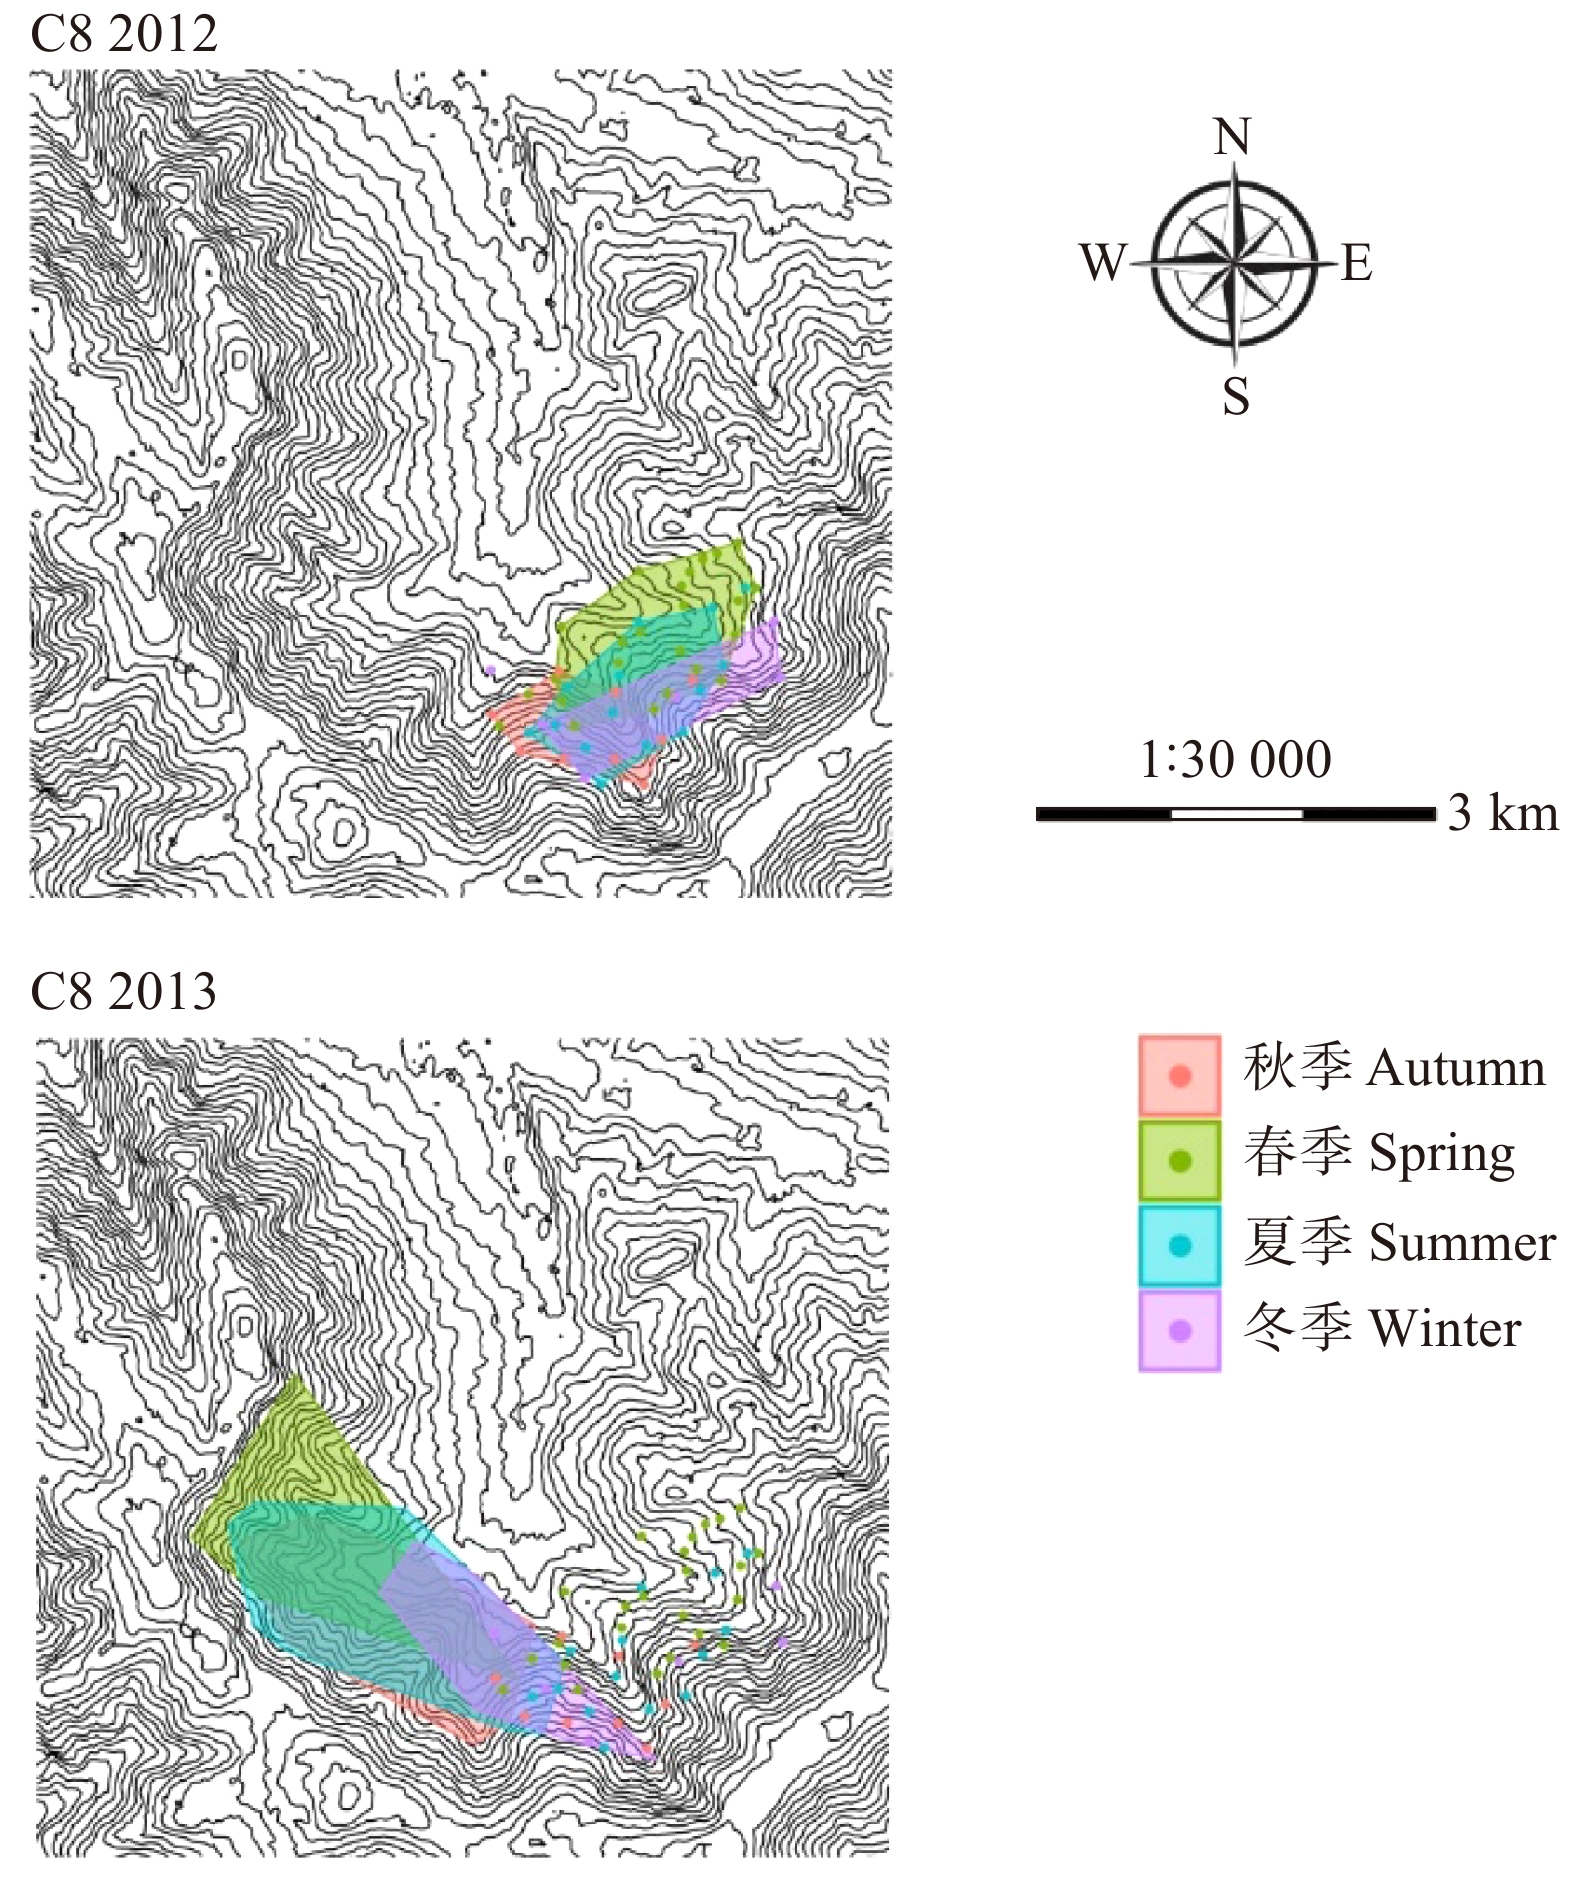
图 2 遥测跟踪狍个体2012和2013年95% 最小凸多边形法(MCP)家域
Figure 2. 95% minimum convex polygon (MCP) home range of telemetry tracking roe deer in 2012 and 2013
表 1 遥测狍的相关信息
Table 1 Related information of the roe deer under radio-tracking
编号 No. 捕捉日期 Capture date 结束日期 Ending date 性别 Gender 年龄段 Age group 备注 Remark C1 2011−10−28 2012−01−02 雌 Female 亚成体 Sub-adult 2012年1月2日被盗猎
Poached on January 2, 2012C2 2011−11−03 2011−11−05 雌 Female 成体 Adult 2011年11月5日被盗猎
Poached on November 5, 2011C3 2011−11−03 2013−04−30 雄 Male 成体 Adult 2013年4月30日被猞猁捕食
Preyed by lynx on April 30, 2013C4 2011−11−06 2013−12−28 雌 Female 亚成体 Sub-adult 2013年12月28日电池耗尽
Battery exhausted on December 28, 2013C5 2011−11−12 2012−12−21 雄 Male 亚成体 Sub-adult 2013年4月1日被猞猁捕食
Preyed by lynx on April 1, 2013C6 2011−11−24 2013−12−28 雄 Male 成体 Adult 2013年12月28日被盗猎
Poached on December 28, 2013C7 2011−12−17 2012−02−27 雄 Male 成体 Adult 2012年2月27日被猞猁捕食
Preyed by lynx on February 27, 2012C8 2012−03−09 2013−12−27 雄 Male 成体 Adult 2013年12月27日电池耗尽
Battery exhausted on December 27, 2013 下载: 导出CSV
表 2 遥测狍个体的季节性95% MCP家域
Table 2 Seasonal 95% MCP home range of roe deer under telemetry tracking
编号
No.年份
Year春季家域/hm2
Home range of spring/ha夏季家域/hm2
Home range of summer/ha秋季家域/hm2
Home range of autumn/ha冬季家域/hm2
Home range of winter/haC1 2012 103.94 C3 2012 845.23 24.33 43.18 817.92 2013 543.48 C4 2012 222.38 78.63 33.02 185.90 2013 121.56 104.91 63.90 32.54 C5 2012 230.11 35.60 108.05 244.50 C6 2012 105.84 26.62 19.36 33.46 2013 29.99 55.78 60.67 28.60 C7 2012 172.06 C8 2012 106.19 83.55 50.60 63.39 2013 75.59 95.60 76.22 45.07
下载: 导出CSV
-
[1] Burt W H. Territoriality and home range concepts as applied to mammals[J]. Journal of Mammalogy, 1943, 24(3): 346−352.
[2] Garshelis D L. Delusions in habitat evaluation: measuring use, selection, and importance [M]//Boitani L, Fuller T K. Research techniques in animal ecology: controversies and consequences. New York: Columbia University Press, 2000.
[3] Bowers M A, Gregario K, Brame C J, et al. Use of space and habitats by meadow voles at the home range, patch and landscape scales[J]. Oecologia, 1996, 105(1): 107−115. doi: 10.1007/BF00328798
[4] Powell R A. Animal home ranges and territories and home range estimators [M]//Boitani L, Fuller T K. Research techniques in animal ecology: controversies and consequences. New York: Columbia University Press, 2000.
[5] Mitchell M S, Powell R A. A mechanistic home range model for optimal use of spatially distributed resources[J]. Ecological Modelling, 2004, 177(1): 209−232. doi: 10.1016/j.ecolmodel.2004.01.015
[6] Hayne D W. Calculation of size of home range[J]. Journal of Mammalogy, 1950, 31(4): 485. doi: 10.2307/1375122
[7] Miller R. Seasonal movements and home ranges of feral horse bands in Wyoming ’s red desert[J]. Journal of Range Management, 1983, 36(2): 199−201. doi: 10.2307/3898162
[8] Kaczensky P, Ganbaatar O, von Wehrden H, et al. Resource selection by sympatric wild equids in the Mongolian gobi[J]. Journal of Applied Ecology, 2008, 45(6): 1762−1769. doi: 10.1111/j.1365-2664.2008.01565.x
[9] 张晋东, Vanessa H, 欧阳志云. 家域研究进展[J]. 生态学报, 2013, 33(11):3269−3279. doi: 10.5846/stxb201201050017 Zhang J D, Vanessa H, Ouyang Z Y. A review of home range studies[J]. Acta Ecologica Sinica, 2013, 33(11): 3269−3279. doi: 10.5846/stxb201201050017
[10] Huang Z H, Zhou Q H, Huang C M, et al. Home range and daily ranging distance of Francois’ langur (Trachypithecus francoisi) in Nonggang Nature Reserve, Guangxi, China[J]. Acta Teriologica Sinica, 2011, 31(1): 46−54.
[11] Hu J C, Schaller G B, Johnson K G. The feeding ecology of giant pandas in Tangjiahe Natural Reserve[J]. Journal of Sichuan Teach College, 1990, 11(1): 1−13.
[12] 官天培, 葛宝明, 谌利民, 等. 四川羚牛的家域与忠诚度[J]. 生态学报, 2015, 35(6):1862−1868. Guan T P, Ge B M, Chen L M, et al. Home range and fidelity of Sichuan takin[J]. Acta Ecologica Sinica, 2015, 35(6): 1862−1868.
[13] 王渊, 初红军, 韩丽丽, 等. 野放普氏野马(Equus przewalskii)家域面积及其影响因素[J]. 生态学报, 2016, 36(2):545−553. Wang Y, Chu H J, Han L L, et al. Factors affecting the home range of reintroduced Equus przewalskii in the Mt. Kalamaili Ungulate Nature Reserve[J]. Acta Ecologica Sinica, 2016, 36(2): 545−553.
[14] 段延. 秦岭羚牛的家域研究[D]. 汉中: 陕西理工大学, 2018. Duan Y. Study on the home range of takin (Budorcas bedfordi) in the Qinling Mountains[D]. Hanzhong: Shaanxi University of Technology, 2018.
[15] 杨淼. 基于分子粪便学的东北马鹿冬季家域研究[D]. 哈尔滨: 东北林业大学, 2019. Yang M. A molecular scatological study on dynamics of winter home range of the red deer (Cervus elaphus xanthopygus)[D]. Harbin: Northeast Forestry University, 2019.
[16] 周璨林. 天山马鹿种群数量, 遗传结构, 家域及系统发育关系研究[D]. 乌鲁木齐: 新疆大学, 2015. Zhou C L. The study on population size, genetic structure, home range and phylpgeny of Tianshan red deer (Cervus elaphus songaricus)[D]. Urumchi: Xinjiang University, 2015.
[17] 靳勇超. 基于粪便分子生物学对马鹿种群遗传结构以及家域的研究[D]. 哈尔滨: 东北林业大学, 2012. Jin Y C. The genetic structure and home range of wapiti based on faecal molecular biology[D]. Harbin: Northeast Forestry University, 2012.
[18] 张辉. 基于粪便分子生物学的马鹿个体识别、亲缘关系分析及家域确定[D]. 哈尔滨: 东北林业大学, 2010. Zhang H. The individual identity, parentage analysis and home range determination of wapiti based on faecal molecular biology[D]. Harbin: Northeast Forestry University, 2010.
[19] 袁梨. 马鹿和狍的冬季生境选择与捕食风险下马鹿的家域利用[D]. 北京: 北京林业大学, 2009. Yuan L. The habitat use by red deer and roe deer in winter and the home-range use by red deer under predation risk[D]. Beijing: Beijing Forestry University, 2009.
[20] 唐书培. 内蒙古赛罕乌拉国家级自然保护区中华斑羚家域、适宜生境及种群生存力研究[D]. 北京: 北京林业大学, 2019. Tang S P. Home range, habitat suitability assessment and population viability analysis of chinese goral (Naemorhedus griseus) in Saihanwula National Natual Reserve, Inner Mongolia[D]. Beijing: Beijing Forestry University, 2019.
[21] 朱国芬. 内蒙古赛罕乌拉国家级自然保护区隔离长尾斑羚群体遗传结构及个体空间分布研究[D]. 北京: 北京林业大学, 2018. Zhu G F. Genetic structure and individual spatial distribution of an isolated long-tailed goral (Naemorhedus caudatus) population at Inner Mongolia Saihanwula National Natural Reserve[D]. Beijing: Beijing Forestry University, 2018.
[22] 张娜. 鄱阳湖湿地枯水期獐(Hydropotes inermis)野放初期的家域和生境选择[D]. 南昌: 江西师范大学, 2019. Zhang N. Home range and habitat selection of Chinese water deer (Hydropotes inermis) after release in Poyang Lake during the dry season[D]. Nanchang: Jiangxi Normal University, 2019.
[23] 刘嘉辉, 王艳, 边坤, 等. 重引入林麝的家域利用与个体迁移[J]. 兽类学报, 2020, 40(2):109−119. Liu J H, Wang Y, Bian K, et al. Home range utilization and individual dispersal of re-introduced forest musk deer (Moschus berezovskii)[J]. Acta Theriologica Sinica, 2020, 40(2): 109−119.
[24] Pipple W J, Beschta R L. Wolves and the ecology of fear: can predation risk structure[J]. Ecosystems BioScience, 2004, 54(8): 755−766.
[25] Lima S L, Dill L M. Behavioral decisions made under the risk of predation: a review and prospectus[J]. Canadian Journal of Zoology, 1990, 68: 619−640. doi: 10.1139/z90-092
[26] Dill L M. Animal decision making and its ecological consequences: the future of aquatic ecology and behaviour[J]. Canadian Journal of Zoology, 1987, 65: 803−811. doi: 10.1139/z87-128
[27] Pierce B M, Bowyer R T, Bleich V C. Habitat selection by mule deer: forage benefits or risk of predation[J]. Journal of Wildlife Management, 2004, 68(3): 533−541. doi: 10.2193/0022-541X(2004)068[0533:HSBMDF]2.0.CO;2
[28] Holmes W G. Predation risk affects foraging behaviour of pikas: observational and experimental evidence[J]. Animal Behaviour, 1991, 42: 111−119. doi: 10.1016/S0003-3472(05)80611-6
[29] 崔庆虎, 蒋志刚, 连新明, 等. 根田鼠栖息地选择的影响因素[J]. 兽类学报, 2005, 25(1):45−51. doi: 10.3969/j.issn.1000-1050.2005.01.008 Cui Q H, Jiang Z G, Lian X M, et al. Factors influencing habitat selection of root voles (Microtus oeconomus)[J]. Acta Theriologica Sinica, 2005, 25(1): 45−51. doi: 10.3969/j.issn.1000-1050.2005.01.008
[30] 周绍春, 张明海, 尹远新, 等. 黑龙江完达山地区狍子冬季生境选择[J]. 北京林业大学学报, 2010, 32(3):122−127. Zhou S C, Zhang M H, Yin Y X, et al. Habitat selection of roe deer (Capreolus capreolus) in winter in the eastern Wandashan Mountains, Heilongjiang Province[J]. Journal of Beijing Forestry University, 2010, 32(3): 122−127.
[31] 盛和林, 大泰司纪之, 陆厚基. 中国野生哺乳动物[M]. 北京: 中国林业出版社, 1998. Sheng H L, Ohtaishi N, Lu H J. The mammalian of China[M]. Beijing: China Forestry Publishing House, 1998.
[32] 李长生, 宋百军, 窦凤鸣. 我国狍驯化饲养现状与发展对策[J]. 当代畜牧, 2016(27):81−84. Li C S, Song B J, Dou F M. Current situation and development countermeasures of Chinese roe deer domestication and raising[J]. Contemporary Animal Husbandry, 2016(27): 81−84.
[33] 毕俊怀. 内蒙古鹿科动物分布现状和资源研究[J]. 内蒙古师大学报(自然科学汉文版), 2001, 30(1):52−56. Bi J H. A research of resource and distribution of deer in Inner Mongolia, China[J]. Journal of Inner Mongolia Normal University (Natural Science Edition), 2001, 30(1): 52−56.
[34] 王祥生. 长白山北部山地东北梅花鹿与同域分布西伯利亚狍冬季营养对策比较研究[D]. 哈尔滨: 东北林业大学, 2019. Wang X S. Comparison of nutritional strategies between Siberian roe deer and sika deer during winter in the North of Changbai Mountains, China[D]. Harbin: Northeast Forestry University, 2019.
[35] 朱明月, 杨淼, 张玮琪, 等. 黑龙江穆棱东北红豆杉自然保护区马鹿与狍冬季食性组成的比较[J]. 东北林业大学学报, 2019, 47(5):100−104. doi: 10.3969/j.issn.1000-5382.2019.05.019 Zhu M Y, Yang M, Zhang W Q, et al. Wintering diet of red and roe deer in Heilongjiang Muling Japanese Yew National Reserve[J]. Journal of Northeast Forestry University, 2019, 47(5): 100−104. doi: 10.3969/j.issn.1000-5382.2019.05.019
[36] 盛清宇. 长白山北部区域西伯利亚狍(Capreolus pygargus)种群遗传多样性及性别偏倚扩散[D]. 哈尔滨: 东北林业大学, 2018. Sheng Q Y. Genetic diversity and sex-biased dispersal of Siberian roe deer (Capreolus pygargus) population in northern Changbaishan of China[D]. Harbin: Northeast Forestry University, 2018.
[37] 何欢, 张玮琪, 刘蕊, 等. 小兴安岭沾河林区狍冬季食物组分及其与单宁含量关系的初步分析[J]. 北京林业大学学报, 2015, 37(2):121−127. He H, Zhang W Q, Liu R, et al. Relationship between the composition and tannin content in winter food for roe deer at Zhanhe Forest Farm of Lesser Xingan Mountains[J]. Journal of Beijing Forestry University, 2015, 37(2): 121−127.
[38] 陈耕, 李艳香, 滕丽微, 等. 黑龙江凉水国家级自然保护区西伯利亚狍的冬季食性[J]. 经济动物学报, 2014, 18(2):91−95. Chen G, Li Y X, Teng L W, et al. Winter diet composition of Capreolus pygargus in Liangshui National Nature Reserve, Heilongjiang Province, China[J]. Journal of Economic Animal, 2014, 18(2): 91−95.
[39] 田万年, 钟宝, 郑雪. 圈养条件下狍种群遗传多样性分析[J]. 黑龙江畜牧兽医, 2014(15):194−196. Tian W N, Zhong B, Zheng X. Genetic diversity analysis of roe deer population under captive conditions[J]. Heilongjiang Animal Science and Veterinary Medicine, 2014(15): 194−196.
[40] 李路云, 滕丽微, 刘振生, 等. 黑龙江三江国家级自然保护区西伯利亚狍冬季食性分析[J]. 经济动物学报, 2014, 18(1):29−32, 37. Li L Y, Teng L W, Liu Z S, et al. Winter diet composition of Capreolus pygargus in Sanjiang National Nature Reserve, Heilongjiang Province, China[J]. Journal of Economic Animal, 2014, 18(1): 29−32, 37.
[41] 张玮琪. 小时间尺度下东北小兴安岭和完达山地区鹿类冬季营养生态学研究[D]. 哈尔滨: 东北林业大学, 2013. Zhang W Q. Fine time-scale winter nutritional ecology of deer populations in the Lesser Khingan Mountains and Wandashan Mountains, Northeast China[D]. Harbin: Northeast Forestry University, 2013.
[42] 张明海, 刘艳华, 贾竞波. 东北地区狍种群的遗传多样性研究[J]. 兽类学报, 2010, 30(1):58−64. Zhang M H, Liu Y H, Jia J B. Population genetic diversity of roe deer (Capreolus pygargus) in northeastern China[J]. Acta Theriologica Sinica, 2010, 30(1): 58−64.
[43] 刘艳华. 基于粪便DNA提取技术的黑龙江省地区野生狍遗传多样性研究[D]. 哈尔滨: 东北林业大学, 2006. Liu Y H. The study on genetic diversity of the roe deer (Capreolus capreolus bedfordi) in the Heilongjiang Province, China based on faecal DNA extract technique[D]. Harbin: Northeast Forestry University, 2006.
[44] 杨宝田. 东北区狍遗传多样性及性别基因鉴定研究[D]. 哈尔滨: 东北林业大学, 2005. Yang B T. Genetic diversity and sex determination of roe deer in the northeastern China[D]. Harbin: Northeast Forestry University, 2005.
[45] 李桂林. 赛罕乌拉自然保护区志[M]. 赤峰: 内蒙古科学技术出版社, 2005. Li G L. Annals of Saihanwula Nature Reserve[M]. Chifeng: Inner Mongolia Science and Technology Press, 2005.
[46] 杨婧, 陈照娟, 乌力吉, 等. 内蒙古赛罕乌拉国家级自然保护区中华斑羚行为节律初步研究[J]. 四川动物, 2019, 38(3):256−262. doi: 10.11984/j.issn.1000-7083.20180281 Yang J, Chen Z J, Wuliji, et al. Preliminary observation on behavioral rhythm of Naemorhedus griseus in Inner Mongolia Saihanwula National Nature Reserve[J]. Sichuan Journal of Zoology, 2019, 38(3): 256−262. doi: 10.11984/j.issn.1000-7083.20180281
[47] 张书理. 内蒙古赛罕乌拉自然保护区植物多样性及其保护研究[D]. 北京: 北京林业大学, 2007. Zhang S L. Study on plants diversity and conservation in Saihanwula Nature Reserve of Inner Mongolia[D]. Beijing: Beijing Forestry University, 2007.
[48] Feng H M, Li Y H, Li Y Y, et al. Identifying and evaluating the ecological network of Siberian roe deer (Capreolus pygargus) in Tieli Forestry Bureau, Northeast China[J/OL]. Global Ecology and Conservation, 2021, 4(26): e01477 [2021−05−18]. https://doi.org/10.1016/j.gecco.2021.e01477.
[49] White G C, Garrott R A. Analysis of wildlife radio-tracking data[M]. New York: Academic Press, 1990.
[50] Harris S, Cresswell W J, Forde P G, et al. Home range analysis using radio-tracking data: a review of problems and techniques particularly as applied to the study of mammals[J]. Mammal Review, 1990, 20(2): 97−123.
[51] 刘晓庆, 王小明, 王正寰, 等. 固定核空间法和最小凸多边形法估计藏狐家域的比较[J]. 兽类学报, 2010, 30(2):163−170. Liu X Q, Wang X M, Wang Z H, et al. Comparison of the Tibetan fox (Vulpes ferrilata) home range size using methods the fixed kernel estimation and the minimum convex polygon[J]. Acta Theriologica Sinica, 2010, 30(2): 163−170.
[52] Jedrzejewski W, Spaedtke H, Kamler J F, et al. Group size dynamics of red deer in Bialowieza primeval forest, Poland[J]. Journal of Wildlife Management, 2006, 70(4): 1054−1059. doi: 10.2193/0022-541X(2006)70[1054:GSDORD]2.0.CO;2
[53] 王文, 张静, 马建章, 等. 小兴安岭南坡野猪家域分析[J]. 兽类学报, 2007, 27(3):257−262. doi: 10.3969/j.issn.1000-1050.2007.03.008 Wang W, Zhang J, Ma J Z, et al. Analysis on wild boars home ranges in the south of Lesser Khingan Mountains[J]. Acta Theriologica Sinica, 2007, 27(3): 257−262. doi: 10.3969/j.issn.1000-1050.2007.03.008
[54] Villerette N, Marchal C, Pays O, et al. Do the sexes tend to segregate in roe deer in agricultural environments? An analysis of group composition[J]. Canadian Journal of Zoology, 2006, 84(6): 787−796. doi: 10.1139/z06-052
[55] Wilson K S, Pond B A, Brown G S, et al. The biogeography of home range size of woodland caribou Rangifer tarandus caribou[J]. Diversity and Distributions, 2019, 25(2): 205−216. doi: 10.1111/ddi.12849
[56] 白文科. 卧龙自然保护区大熊猫空间利用与生境选择动态变化研究[D]. 呼和浩特: 内蒙古农业大学, 2017. Bai W K. The dynamics of space utilization and habitat selection of giant pandas (Ailuropoda melanoleuca) in Wolong Nature Reserve[D]. Hohhot: Inner Mongolia Agriculture University, 2017.
[57] 张逦嘉. 内蒙古赛罕乌拉国家级自然保护区猞猁种群生态研究[D]. 北京: 北京林业大学, 2010. Zhang L J. Population ecology of Eurasian lynx (Lynx lynx) in Saihanwula Nature Reserve, Inner Mongolia[D]. Beijing: Beijing Forestry University, 2010.
[58] 张帅. 存在猞猁捕食风险下西伯利亚狍的家域与生境利用研究[D]. 北京: 北京林业大学, 2014. Zhang S. Study on the home-range and habitat use by Siberian roe deer under predation risk from Eurasian lynx[D]. Beijing: Beijing Forestry University, 2014.
[59] Horner M A, Powell R A. Internal structure of home ranges of black bears and analysis of home range overlap[J]. Journal of Mammalogy, 1990, 71(3): 402−410. doi: 10.2307/1381953
[60] McNab B K. Bioenergetics and the determination of home range size[J]. The American Naturalist, 1963, 97: 133−139. doi: 10.1086/282264
[61] Mysterud A. Bed-site selection by adult roe deer (Capreolus capreolus) in southern Norway during summer[J]. Wildlife Biology, 1996, 2(3): 101−106.
[62] Mysterud A, Larsen P K, Lms R A. Habitat selection by roe deer and sheep: does habitat ranking reflect resource availability?[J]. Canadian Journal of Zoology, 1999, 77(5): 776−783. doi: 10.1139/z99-025
[63] Jezierski W, Myicha A. Food requirments of a wild boar population[J]. Polish Ecological Studies, 1975, 1(2): 61−83.
[64] Mauget R. Behavioural and reproductive strategies in wild forms of Sus scrofa (European wild boar and feral pigs)[J]. The Welfare of Pigs, 1981, 11(1): 3−13.
[65] Glen S, Steven M. Predicting home range size from the body mass or population densities of feral pigs, Sus scrofa (Artiodactyla: Suidae)[J]. Australian Journal of Ecology, 1999, 24(5): 538−543. doi: 10.1046/j.1442-9993.1999.01001.x


计量
- 文章访问数: 1083
- HTML全文浏览量: 542
- PDF下载量: 48
