
Natural regeneration of Larix principis-rupprechtii plantations in 9−10 years after thinning
-
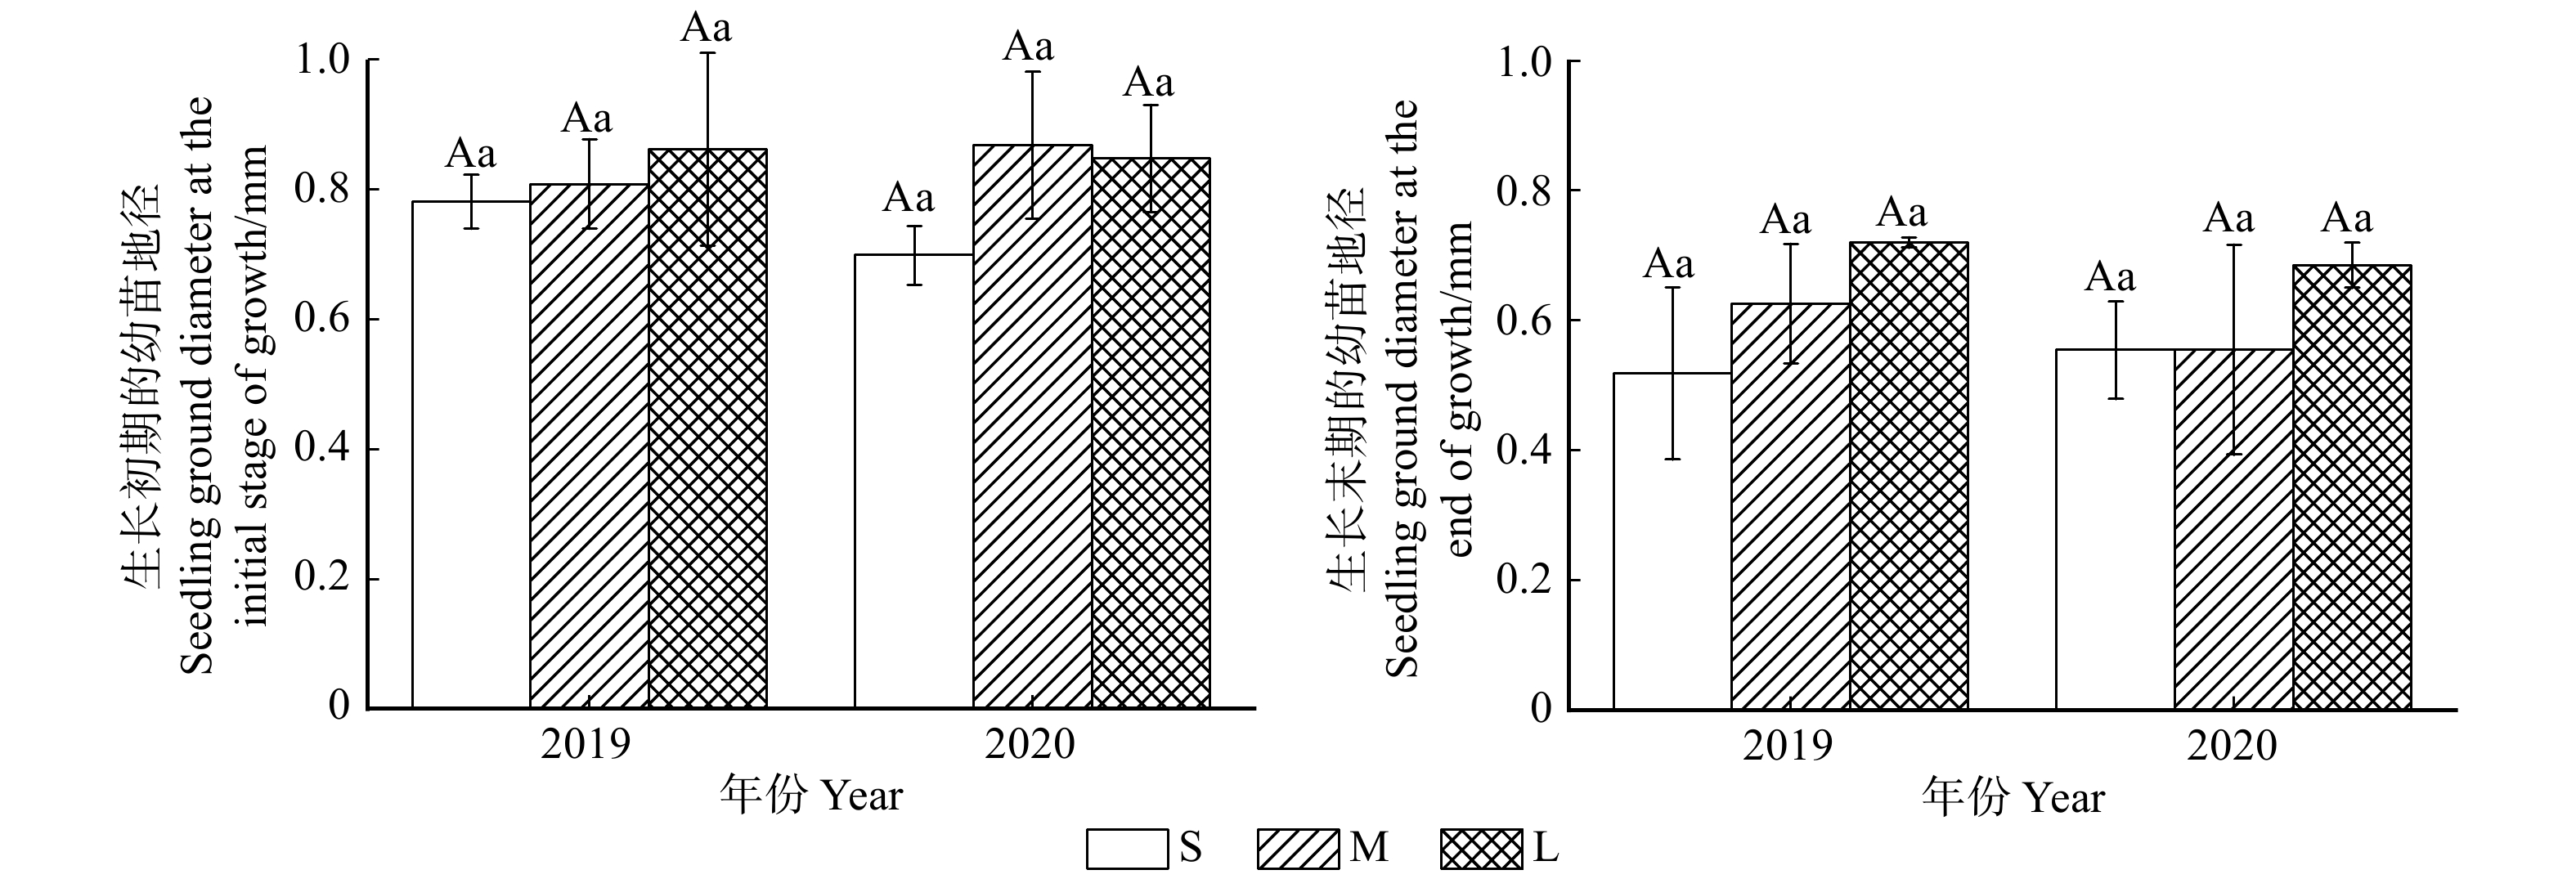
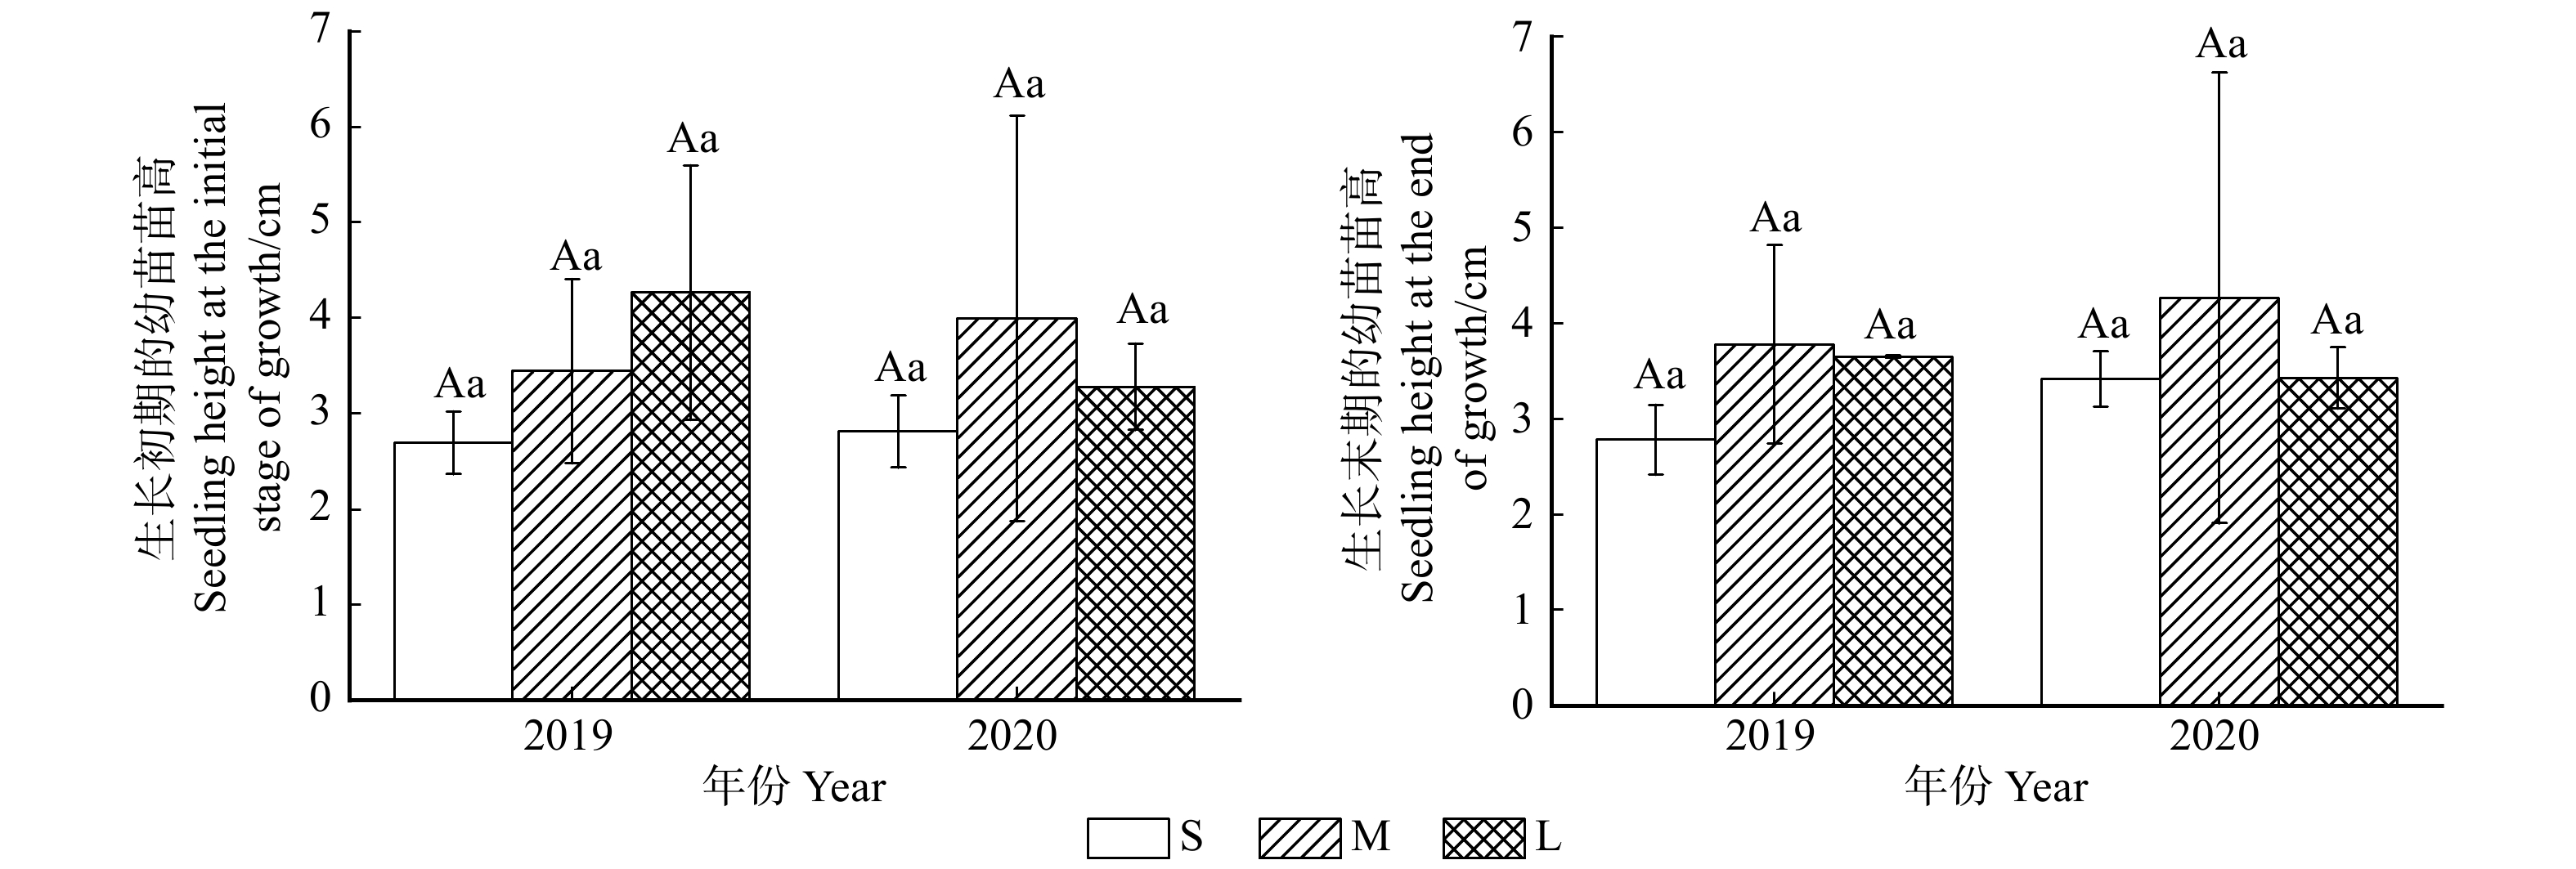
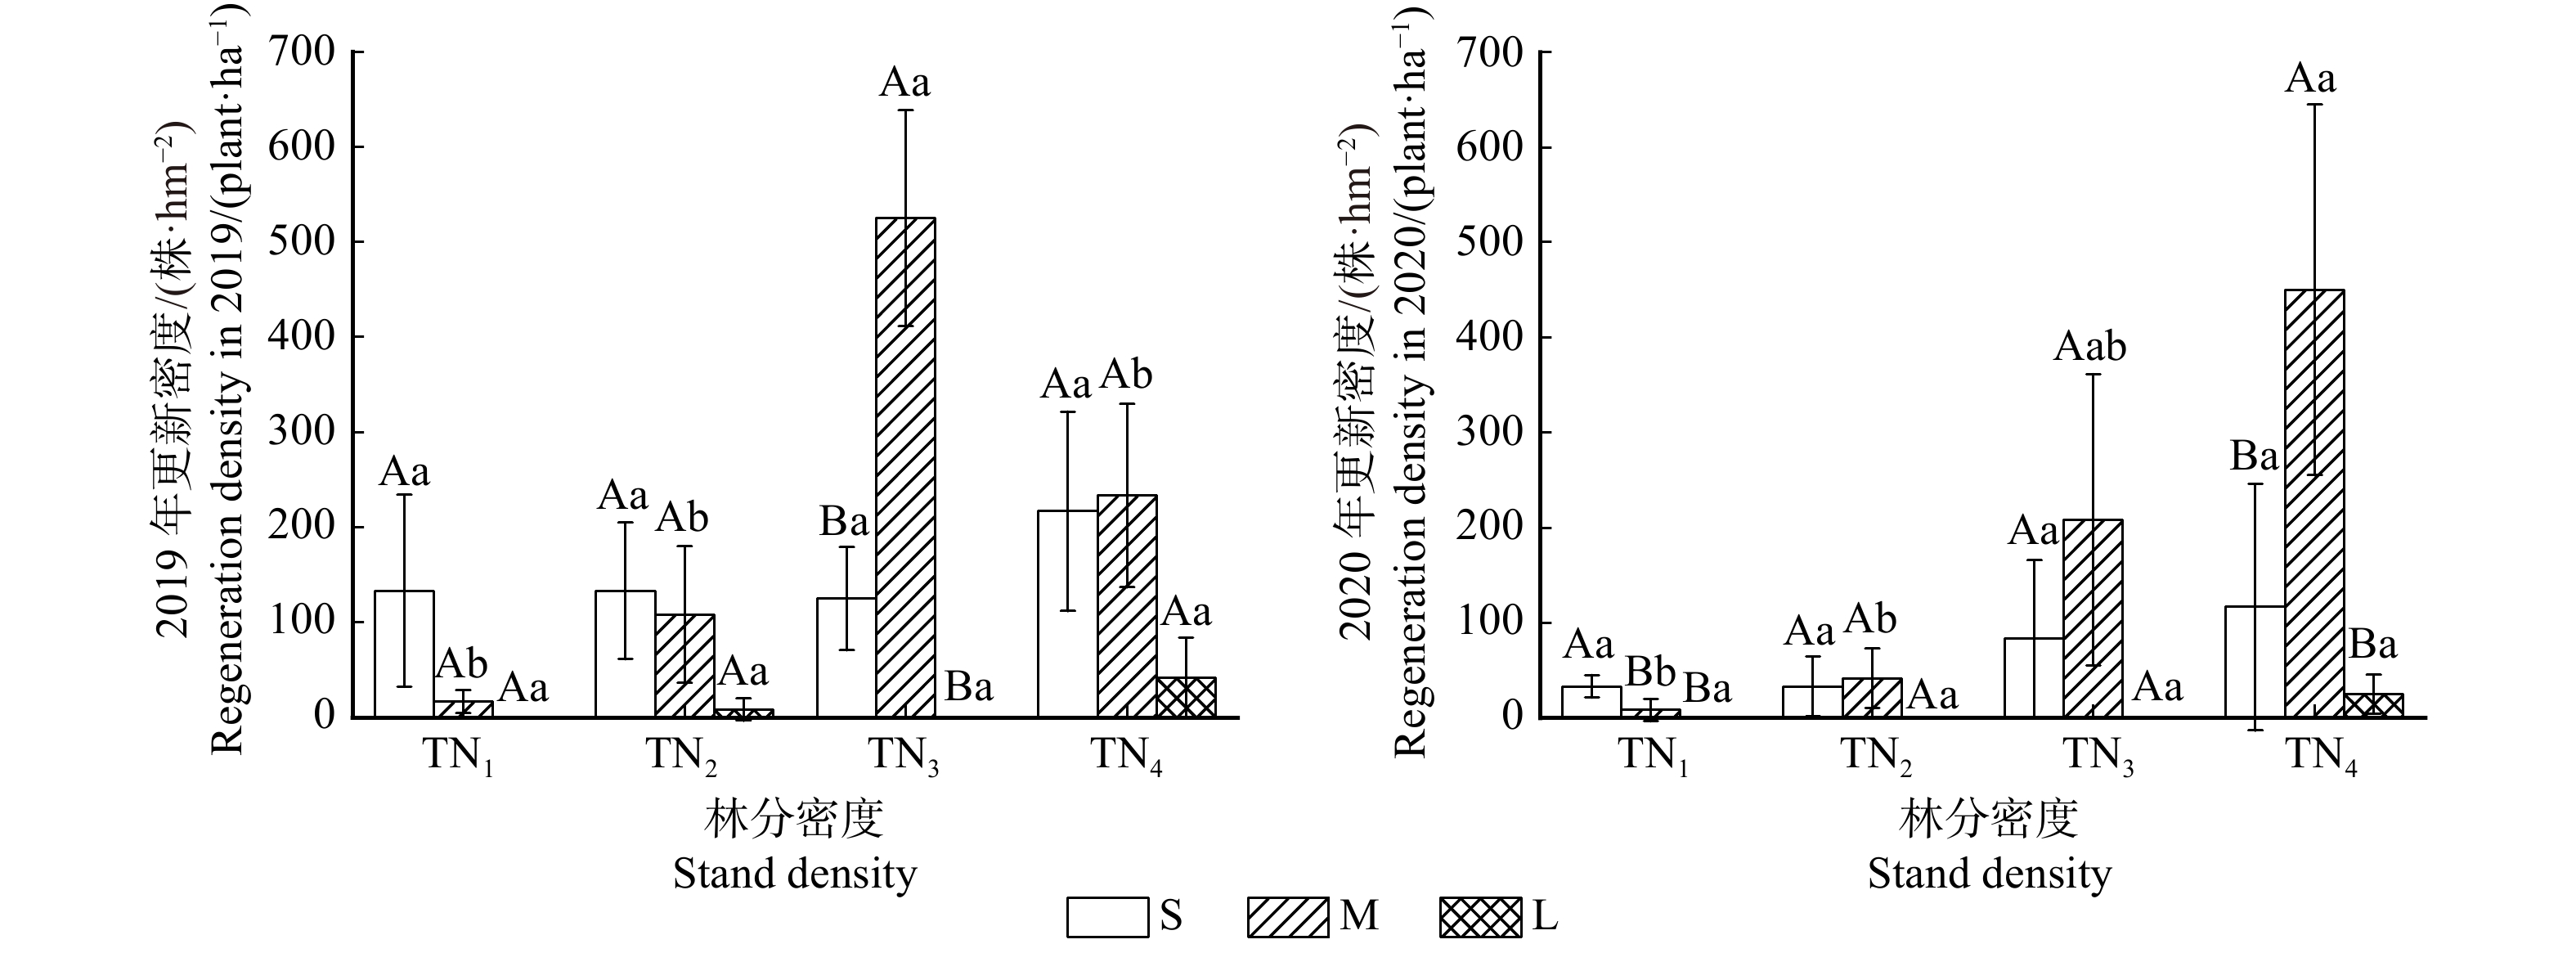
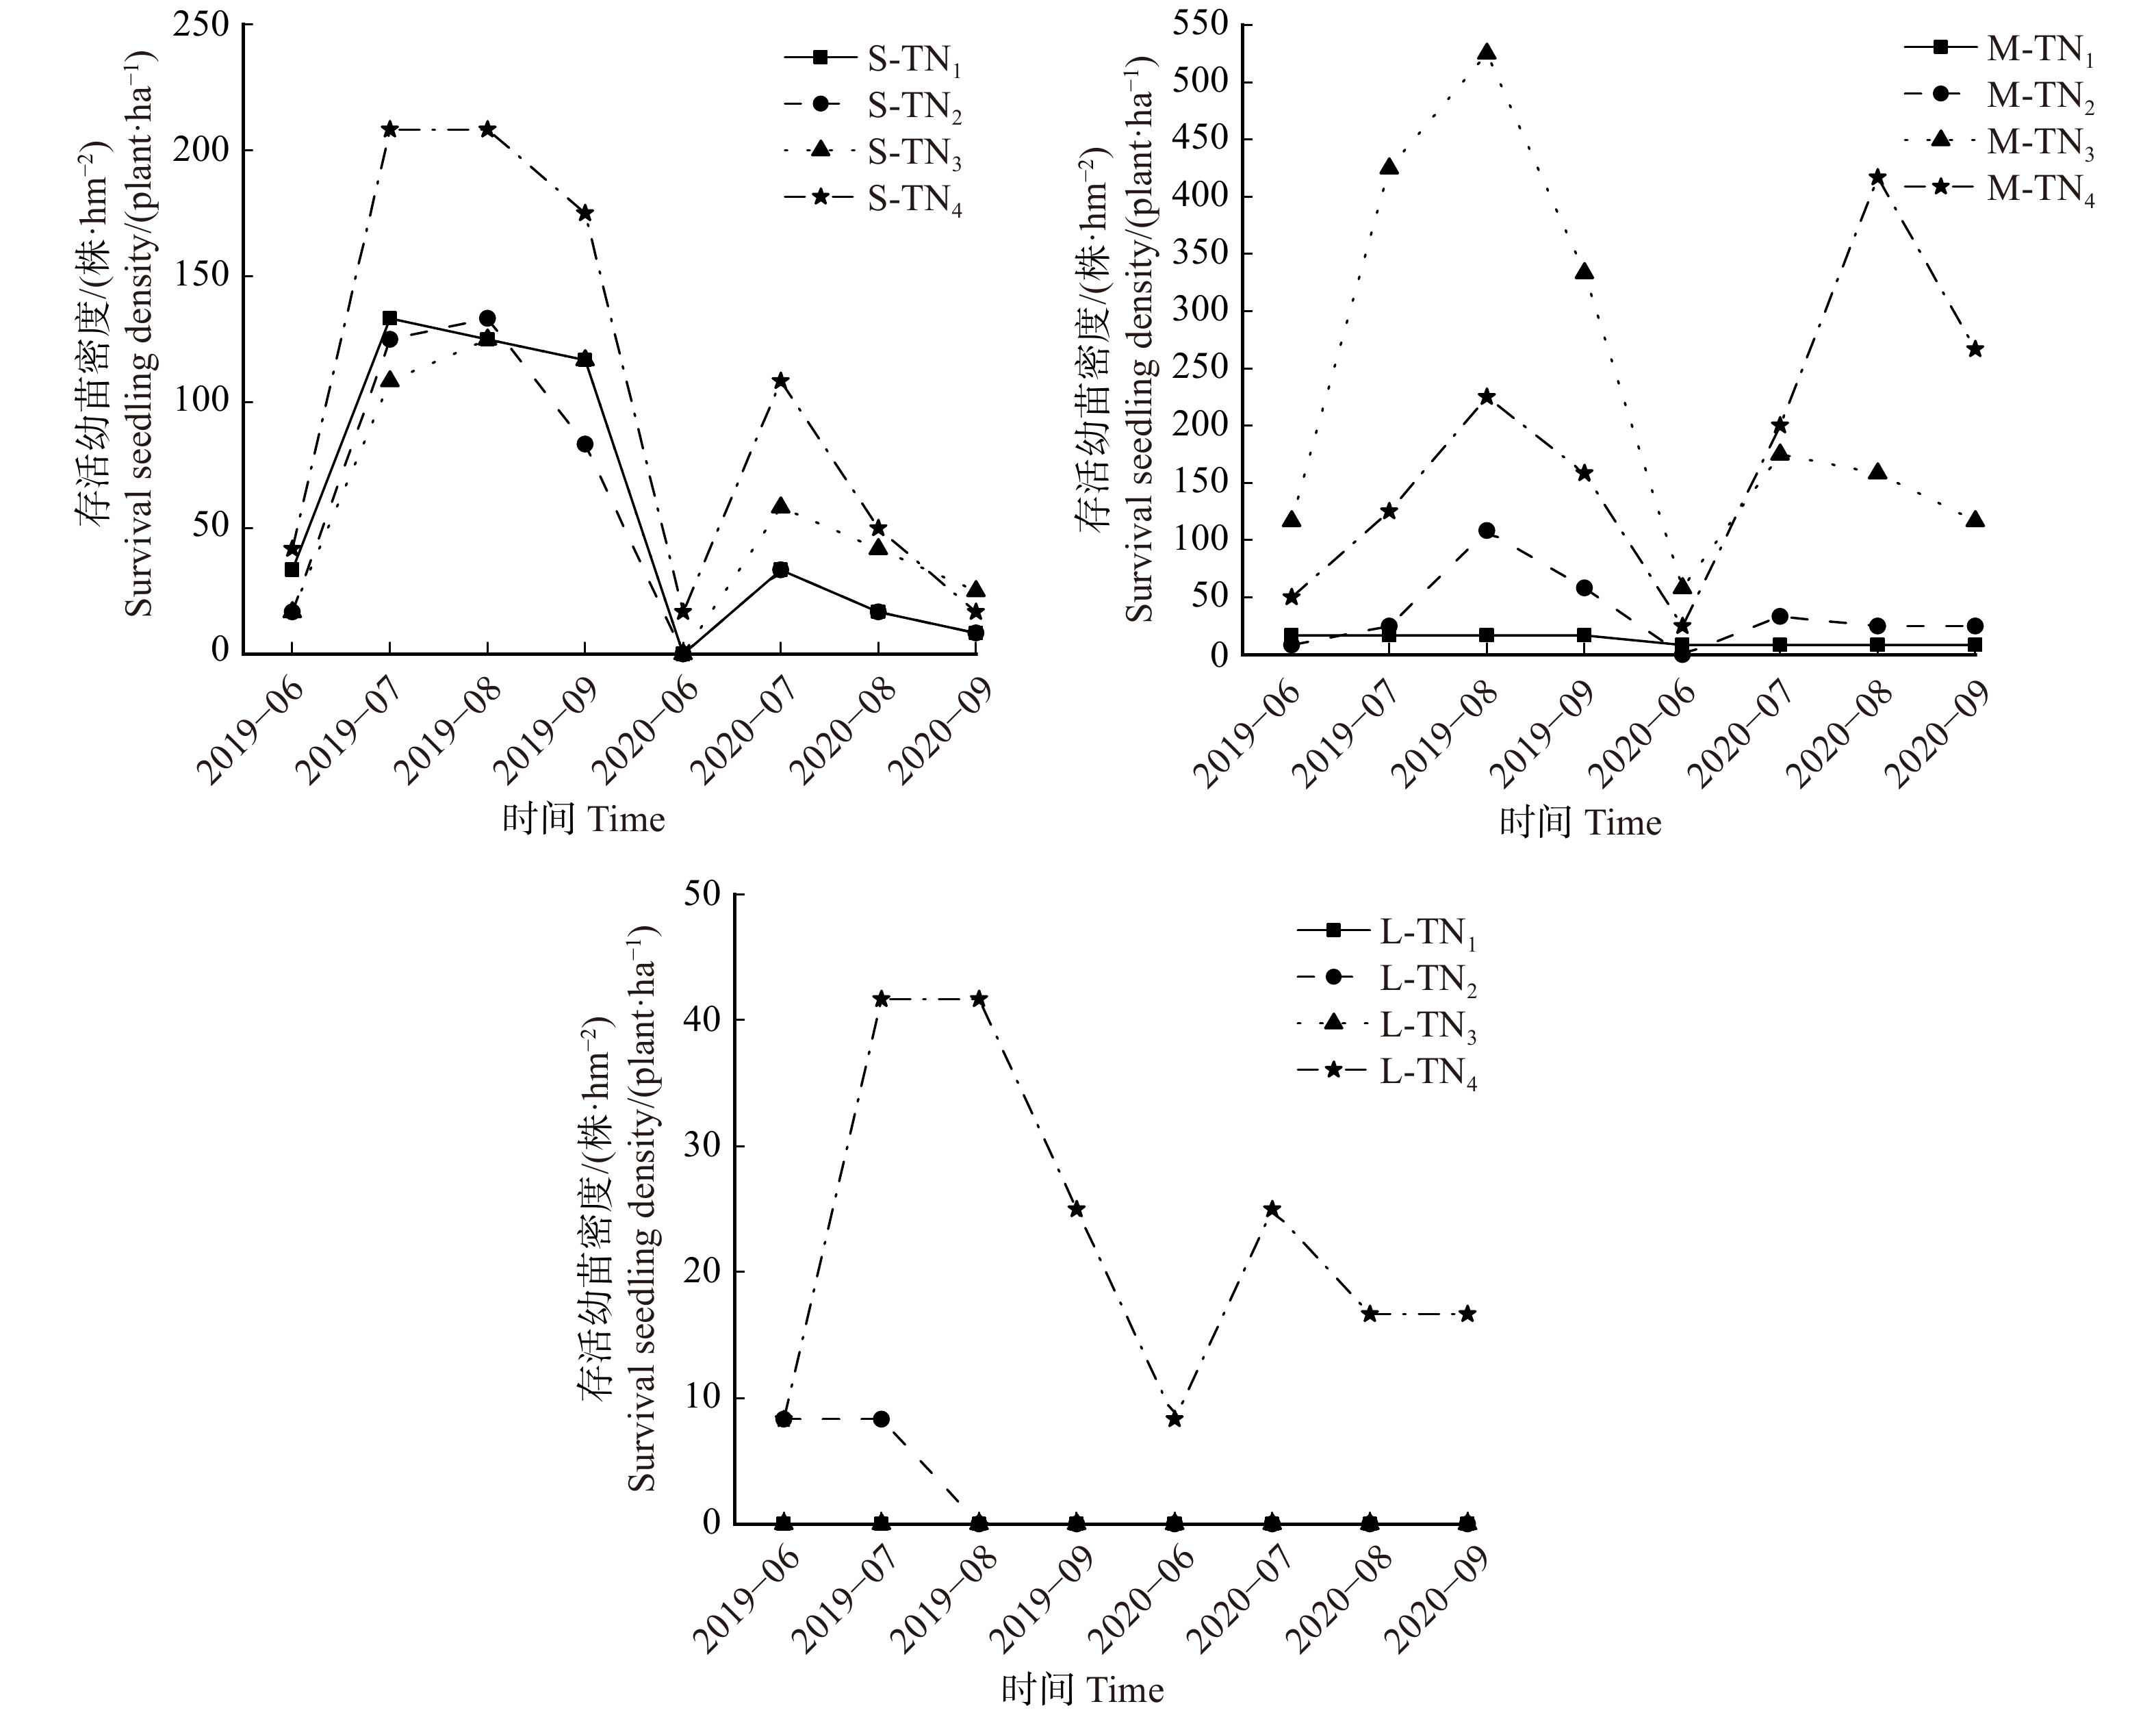
摘要:目的 为进一步完备华北落叶松天然更新障碍的研究体系,本研究从幼苗更新特征方面,揭示或反映华北落叶松林天然更新影响因素。方法 于2019—2020年,对不同强度间伐作业(于2010年6月完成)的27年、31年和47年共3个林龄的华北落叶松人工纯林林下幼苗群体展开调查研究。结果 (1) 塞罕坝地区华北落叶松林在经过35%极重度间伐、30%重度间伐、20%中度间伐和15%轻度间伐作业以及自然稀疏后的9 ~ 10年里,林下均存在着不同程度的天然更新,更新苗层次均为幼苗,无落叶松幼树存在。幼苗以1年生幼苗为主,多年生幼苗的年龄多为2年。在幼苗更新频率的表现上,更新能力与林龄间呈反比,以27年华北落叶松林的表现最好,47年人工林的最差。(2) 幼苗苗龄分布中,1年生幼苗占比高,更高苗龄的幼苗占比极少,1年生和2年生幼苗的损失较大,在向多年生幼苗的过渡过程中存在更新断层。(3) 幼苗地径和苗高在不同时期以及林分间的差异均较小(P > 0.05)。经过一个生长季,幼苗地径明显减小(P < 0.05),苗高则存在不显著增长(P > 0.05)。(4) 连续2年塞罕坝地区华北落叶松林天然更新等级的观测结果均为更新不良。林龄和林分密度对更新密度的影响较大(P < 0.05),2年内均以31年落叶松林整体更新密度最大(P < 0.05),更新密度则与林分密度间整体呈现正相关(P < 0.05)。相较于2019年,绝大部分样地内更新密度在2020年的表现均存在一定程度地下降(P > 0.05)。(5) 连续2年生长季内幼苗密度的动态变化在3个人工林中相对一致,7月底为萌发高峰期,幼苗损失主要发生在冬季。(6) 生长季成活率和越冬成活率在不同人工林间的差异较小(P > 0.05)。2019年27年落叶松林中生长季成活率要显著优于2020年的(P < 0.05);越冬成活率则在各人工林中均显著低于生长季成活率(P < 0.05)。结论 塞罕坝地区3个龄级的华北落叶松人工林,在经过4种强度间伐后的9 ~ 10年里,各人工林下存在不同程度的天然更新。林龄和林分密度主要通过影响林下幼苗的更新频率和更新密度影响到天然更新;而对于林下幼苗的年龄分布、生长状况、更新动态以及成活率等更新特征的影响则较小。即林龄和林分密度主要是通过影响幼苗数量来影响林下更新状态。相对而言,对结实能力更强的幼、中龄林,可通过间伐促进母树生长,提高林分整体的种子产量。并可能通过加大间伐强度和缩短轮伐期等方式,增加间伐对于林分的整体种苗品质、林下更新的环境因子和塞罕坝地区幼苗生长季期限等方面的正向影响。Abstract:Objective This paper aims to further improve the research system of natural regeneration obstacles of Larix principis-rupprechtii, reveal or reflect the influencing factors of natural regeneration of L. principis-rupprechtii plantations from the aspect of seedling regeneration characteristics.Method From 2019 to 2020, the natural regenerations of the 27, 31and 47 years old L. principis-rupprechtii pure plantations under different intensities of thinning operation in June, 2010 were investigated.Result (1) There were different degrees of natural regeneration under L. principis-rupprechtii plantations in Saihanba area, Hebei Province of northern China after 35% extremely severe thinning, 30% severe thinning, 20% moderate thinning and 15% light thinning and natural thinning for 9−10 years, and the regeneration seedlings were all saplings and there were no larch treelets. The 1-year-old (1a) seedlings were the dominant, and the age of perennial seedlings was mostly 2-year-old (2a). In the performance of seedling regeneration frequency, the regeneration ability was inversely proportional to the stand age. The best performance was 27 years old L. principis-rupprechtii plantations, and the worst was 47 years old plantations. (2) In the distribution of seedling age, 1a seedlings accounted for a higher proportion, higher seedling age accounted for a small proportion, the loss of 1-year-old and 2-year-old seedlings was greater, and there were renewal faults during the transition to perennial seedlings. (3) The differences between seedling ground diameter and seedling height in different stages and stands were small (P > 0.05). After a growing season, the ground diameter of seedlings decreased significantly (P < 0.05), while the height of seedlings did not increase significantly (P > 0.05). (4) The observation results of natural regeneration grade of L. principis-rupprechtii plantations in Saihanba area for two consecutive years were poor regeneration. Stand age and stand density had a great influence on regeneration density (P < 0.05), the overall regeneration density of 31 years old L. principis-rupprechtii plantations was the largest in 2 years (P < 0.05), and there was a positive correlation between regeneration density and stand density (P < 0.05). Compared with that in 2019, the regeneration density of most sample plots in 2020 decreased to a certain extent (P > 0.05). (5) During the growing season, the dynamic changes of seedling density in the three plantations were relatively consistent in two consecutive years. The germination peak was at the end of July, and the seedling loss mainly occurred in winter. (6) The difference of survival rate in growing season and overwintering was small among plantations (P > 0.05), and the survival rate in growing season in the 27 years old L. principis-rupprechtii plantations in 2019 was significantly higher than that in 2020 (P < 0.05), while the overwintering survival rate was significantly lower than that in growing season (P < 0.05).Conclusion Natural regeneration of L. principis-rupprechtii plantations of three age classes in Saihanba area occurred in different degrees in 9−10 years after thinning under four intensities. Forest age and stand density mainly affect the natural regeneration by affecting the regeneration frequency and regeneration density of seedlings under the forest, but have little effect on the regeneration characteristics such as age distribution, growth status, regeneration dynamics and survival rate of seedlings under the forest. That is to say, forest age and stand density mainly affect the regeneration state under the forest by affecting the number of seedlings. Relatively speaking, for young and middle-aged forests with stronger seed setting ability, thinning can promote the growth of mother trees, and improve the overall seed yield of the stand. It is possible to increase the thinning intensity and shorten the rotation period to enhance the positive impact of thinning, improve the overall seedling quality, improve the environmental factors under the forest and extend the growing season of seedlings in Saihanba area.
-
Keywords:
- stand density /
- natural regeneration /
- seedling /
- growing season /
- overwintering
-
生态系统服务不仅为人类的生产和建设提供了必要的物质资源,还通过水质净化、空气净化、土壤保持和生物多样性维护等环境调节功能,为人类社会提供了基础性的支撑。然而人类社会迅速发展,土地利用方式的急剧变化,导致生态系统作为发展代价,常常遭受破坏。随着我国经济转型,生态系统服务重要性受到越来越多学者和当地政府部门重视。对生态系统服务评估有助于理解生态系统与人类社会之间相互关系,为生态环境发展规划与决策提供科学依据,进而促进人与自然和谐共生[1]。
20世纪90年代,Costanza等[2]对生态系统做出了细致的分类。相关概念被欧阳志云[3]、谢高地等[4−5]引入国内,并将生态系统服务归并为食物生产、原材料生产、气体调节、水源涵养、废物处理、土壤形成与保护、生物多样性保护和娱乐文化9类。在此基础上,后人通过相应的方法量化各项生态系统服务的价值,比如肖强等[6] 利用市场价值法与生产成本法对重庆市森林生态系统服务进行定量评价。在区域尺度上,生态系统服务评估常用模型有ARIES[7]、InVEST[8]、soVES模型[9−10]等。与其他评价方法相比,InVEST模型具有更强的空间分析能力,且操作简便,适宜性广泛[11]。许多学者将InVEST模型与PLUS、FLUS模型进行耦合,对研究区的土地利用、生态系统服务变化进行预测模拟[12−14]。
云南横跨青藏高原与云贵高原,横断山脉南北贯穿而过,全省最大海拔高度差达到6 660 m,不同海拔间生态系统服务存在明显地理差异。其次,作为众多河流上游地区,云南省水资源相对匮乏,水质净化服务对水资源保障具有重要意义。再者,喀斯特地貌是云南典型地貌之一,该地貌生态脆弱,山地坡地较多,加之长期过度开发和掠夺式的生产经营,土壤侵蚀严重、土壤肥力下降,区域生态系统对水资源的调蓄能力减弱[15−16]。综合考虑云南省地理特征,系统分析云南省生态系统服务时空变化特征,可为云南省植被群落优化提供科学依据。
本研究基于InVEST模型,对云南省2010年和2020年的生态系统服务进行了综合评估。通过市场价值法、成本替代法和影子工程法量化土壤保持、碳储量、水源涵养和水质净化服务价值,得出生态系统综合服务价值。进一步运用分位数分割法确定各类生态系统服务边界点,拟合生态系统服务间的约束关系。系统分析云南省生态系统服务时空变化特征,为当地生态保护和可持续发展提供科学依据和决策支持。
1. 研究区概况与研究方法
1.1 研究区概况
云南省位于中国西南地区(21°08′ ~ 29°15′ N,97°31′ ~ 106°11′ E),包括16个下辖行政区,总面积约39.41万km2(图1)。属亚热带季风气候和热带季风气候[17],多年平均降水量1 000 mm以上,降水存在地域性差异,分配极其不均匀。海拔总体上呈北高南低的阶梯式分布特征。
云南省土地利用类型主要为林地、草地和耕地,林地占据全省面积57%以上,林地、草地和耕地共占据全省面积97%以上。2010—2020年间云南省林地小幅增长,增加比例为0.37%,耕地和草地小幅减少,耕地面积减少了1.94%,草地减少了2.67%。
1.2 数据来源
2010、2020年云南省土地利用数据和DEM来源于中国科学院资源环境科学与数据平台(https://www.resdc.cn/),空间分辨率分别为1 km和90 m;降水数据来源于中国科学院资源环境科学与数据平台、NOAA官方网站(https://www.ncei.noaa.gov/maps/daily/);植被数据和潜在蒸发数据来源于NASA数据库(https://www.earthdata.nasa.gov/)中mod16a3数据,空间分辨率均为500 m;土壤数据来源于国家青藏高原科学数据中心(https://data.tpdc.ac.cn/zh-hans/),分辨率为3.6 km。为便于分析计算,本研究将所有空间数据重新转换到1 km空间尺度。InVEST模型参数水土保持因子、碳密度、季节常数等借鉴前人研究[18],水质净化生物物理相关常数参考InVEST模型数据库生物物理表。
1.3 研究方法
1.3.1 生态系统服务功能估算
生态系统服务包括土壤保持、碳储量、水源涵养和水质净化服务。为了能更好地探究研究区各项生态系统服务时空差异性,本研究运用专家打分的方式,对生态系统服务功能划分了不同等级(表1)。
表 1 2010—2020年生态系统服务变化等级Table 1. Ranking of ecosystem service changes from 2010 to 2020指标 Index 单位
Unit变化状况 Situation of change 显著减少
Significant reduction减少
Reduce不变
No change增加
Increase显著增加
Significant increase土壤保持量
Soil conservationt/(hm2·a)
t/(ha·year)(−∞,−2 000) [−2 000,−200) [−200,200) [200,2 000) [2 000,+∞) 碳储量 Carbon storage t (−∞,−2 000) [−2 000,−200) [−200,200) [200,2 000) [2 000,+∞) 产水量 Water yield mm (−∞,−100) [−100,−50) [−50,50) [50,100) [100,+∞) 氮负荷量 Nitrogen load kg (−∞,−1.5) [−1.5,−0.5) [−0.5,0.5) [0.5,1.5) [1.5,+∞) 磷负荷量 Phosphorus load kg (−∞,−0.5) [−0.50,0.25) [−0.25,0.25) [0.25,0.50) [0.5,+∞) 综合生态系统服务价值
Integrated ecosystem
service value元
CNY(−∞,−1 000 000) [−1 000 000,−100 000) [−100 000,100 000) [100 000, 1000 000)[ 1000 000,+∞)(1)土壤保持服务:以土壤保持量表征土壤保持服务,通过土壤流失方程计算得到[19]。
RKLS=RKLS (1) USLE=RKLSCP (2) SC=RKLS(1−CP) (3) 式中:RKLS为土壤潜在侵蚀量(t/(hm2·a)),USLE为土壤实际侵蚀量(t/(hm2·a)),SC为土壤保持量(t/(hm2·a)),R为降水侵蚀因子(MJ·mm/(hm2·h·a)),K为土壤侵蚀因子(t·h/(MJ·mm)),L为坡长因子,S为坡度因子;C为植被覆盖因子;P为水土保持因子。
(2)碳储量服务:生态系统碳储量(Ctotal)包括地上生物量(Cabove)、地下生物量(Cbelow)、土壤碳储量(Csoil)与死亡有机物(Cdead)[20]。
Ctotal =Cabove +Cbelow +Csoil +Cdead (4) (3)水源涵养服务:以产水量表征水源涵养服务。根据水量平衡原理,产水量为单位面积降水量减去实际蒸散量,且不考虑地下水与地表水之间相互作用[8]。
Y=(1−AP)×P (5) 式中:Y为年产水量(mm);A为年实际蒸散量(mm);P为年降水量(mm)。
(4)水质净化服务:InVEST模型忽略其他污染源,只考虑非点源污染中的全氮(total nitrogen,TN)和全磷(total phosphorus,TP),二者负荷量越高,表明水质净化服务越低 [21]。
Ax=Hxpx (6) 式中:Ax为x(氮、磷)调整负荷量,px为x负荷系数,Hx为x水文敏感度评分。
1.3.2 综合生态系统服务价值估算
运用成本替代法量化土壤保持服务价值,根据我国主要流域泥沙运移的经验规律,选取24%作为泥沙淤积在水库、河流、湖泊等水域占总泥沙流失量的比例[22]。
Vln=(24%SCC0ρ)/10000 (7) 式中:Vln为土壤保持服务的经济成本(CNY),C0为单位库容的建设成本(CNY/m3),ρ为土壤密度(t/m3)。本文参考三峡大坝假设成本,C0取值9.46元/m3。
参考云南省周边地区碳排放交易价格[23],2021年3月23日重庆碳价24.75元/t,计算云南省碳储量价值。
运用影子工程法[24],即假设修一个和整个云南省生态系统具有一样水源涵养能力水库,估算修建该水库成本,得到云南省水源涵养服务价值(VW,CNY)。
VW=QC0 (8) 式中:Q为体积产水量(m3)。
利用生物物理属性表得到氮、磷负荷量。假设所有土地类型净化能力都为0,即截留效率为0,生成生物物理属性表,带入InVEST模型,得到土地类型净化能力为0时氮、磷负荷量,将此结果与正常氮、磷负荷量相减得到氮、磷净化量[25]。运用替代成本法,总氮净化成本为1.5元/kg,总磷净化成本为0.7元/kg。
1.3.3 生态系统服务约束关系量化
采用分位数分割法提取土壤保持、产水量、水质净化的氮负荷量与磷负荷量的空间分布特征。选取限制变量作为横坐标,按限制变量值域顺序分成100份,每份选取超过99%分位数的点作为边界点。利用Origin2022工具对边界点进行拟合,从而得到限制变量与响应变量的约束关系[26]。
2. 结果与分析
2.1 云南省生态系统服务时空演变特征
2.1.1 云南省生态系统服务空间分布
云南省主要用地类型为林地,水土保持功能较好,土壤保持服务水平整体较高。较高区域多分布在云南省西部怒江、保山、临沧和普洱等地以及东北部昭通市。东部地区如文山、红河曲靖等地土壤保持量相对较低。与土壤保持服务相似,云南省碳储量也比较丰富,但东西分布差异较大。碳储量较高区域主要分布在西北怒江、迪庆、丽江等地以及西部德宏、普洱等地。西北部高碳储量分布集中,而西部较为分散,东部地区碳储量普遍低于西部地区,东部曲靖市平均碳储量仅为西部较高区域的43% ~ 45%(图2、3)。
![]() 图 2 2010年云南省土壤保持、碳储量、水源涵养和水质净化空间分布Figure 2. Spatial distribution of soil conservation, carbon storage, water source conservation, and water purification in Yunnan Province in 2010
图 2 2010年云南省土壤保持、碳储量、水源涵养和水质净化空间分布Figure 2. Spatial distribution of soil conservation, carbon storage, water source conservation, and water purification in Yunnan Province in 2010![]() 图 3 2020年云南省土壤保持、碳储量、水源涵养和水质净化空间分布Figure 3. Spatial distribution of soil conservation, carbon storage, water source conservation, and water purification in Yunnan Province in 2020
图 3 2020年云南省土壤保持、碳储量、水源涵养和水质净化空间分布Figure 3. Spatial distribution of soil conservation, carbon storage, water source conservation, and water purification in Yunnan Province in 2020受降水分布影响,云南省产水量较高的区域集中在西部、西北部和南部。水质净化服务受氮、磷负荷和截留效率影响,林地和草地的氮磷负荷低、截留效率高,而农田和建设用地的氮磷负荷高、截留效率低。全省整体氮磷负荷量较低,氮负荷量高的区域集中在曲靖、昭通、德宏和临沧;而氮负荷量、磷负荷量较低的区域主要集中在中部和西北部山区,如迪庆、红河、怒江等地。
根据《云南省种植业区划》[27],将云南省海拔分为6个等级,海拔 ≤ 2 000 m为“低”、2 000 m < 海拔 ≤ 2 400 m为“较低”、2 400 m < 海拔 ≤ 2 800 m为“中”、2 800 m < 海拔 ≤ 3 300 m为“较高”、3 300 m < 海拔 ≤ 4 000 m为“高”、海拔 > 4 000 m为“极高”,对云南省生态系统服务功能进行分级统计(图4)。
![]() 图 4 云南省生态系统服务功能垂直梯度统计L. 海拔 ≤ 2 000 m;RL. 2 000 m < 海拔 ≤ 2 400 m;M. 2 400 m < 海拔 ≤ 2 800 m;RH. 2 800 m < 海拔 ≤ 3 300 m;H. 3 300 m < 海拔 ≤ 4 000 m;EH. 海拔 > 4 000 m。L, altitude ≤ 2 000 m; RL, 2 000 m < altitude ≤ 2 400 m; M, 2 400 m <altitude ≤ 2 800 m; RH, 2 800 m <altitude ≤ 3 300 m; H, 3 300 m < altitude ≤ 4 000 m; EH, altitude > 4 000 m。Figure 4. Vertical gradient statistics of ecosystem service functions in Yunnan Province
图 4 云南省生态系统服务功能垂直梯度统计L. 海拔 ≤ 2 000 m;RL. 2 000 m < 海拔 ≤ 2 400 m;M. 2 400 m < 海拔 ≤ 2 800 m;RH. 2 800 m < 海拔 ≤ 3 300 m;H. 3 300 m < 海拔 ≤ 4 000 m;EH. 海拔 > 4 000 m。L, altitude ≤ 2 000 m; RL, 2 000 m < altitude ≤ 2 400 m; M, 2 400 m <altitude ≤ 2 800 m; RH, 2 800 m <altitude ≤ 3 300 m; H, 3 300 m < altitude ≤ 4 000 m; EH, altitude > 4 000 m。Figure 4. Vertical gradient statistics of ecosystem service functions in Yunnan Province云南省土壤保持量和碳储量随海拔上升整体先增大后减小。海拔2 400 m以下,随着海拔升高,适宜人类开发活动土地越少,土壤保持量逐渐提升;在海拔2 400 ~ 3 300 m间,存在针阔混交林大范围覆盖,增强了土壤保持服务,土壤保持量达到最大值;海拔3 300 m以上,气温骤降、地势崎岖,土壤保持量逐渐减少(图4)。
碳储量主要集中在海拔2 800 ~ 3 300 m区域,主要因为该海拔范围内林地面积占全省45.90%;海拔2 800 m以下,人类开发导致林地面积占比低,碳储量相对较少;海拔3 300 m以上,因气候与地形限制,碳储量较少(图4)。
产水量最高的区域集中在海拔2 000 ~ 2 400 m区间,在云南西南和南部地区,受季风影响,降水充沛。海拔 > 2 400 m时,产水量随海拔的升高逐渐降低(图4)。
在海拔4 000 m范围内,氮、磷负荷量随海拔升高而减少。该区间内,随海拔升高,人为扰动减少、植被覆盖度上升,氮磷负荷量减少;4 000 m以上区域氮、磷负荷量略有增加,该区间处于河流上游,径流量相对较小,能带走的氮磷负荷有限(图4)。
2.1.2 云南省生态系统服务功能时间变化特征
图5展示了云南省生态系统服务功能空间变化。土壤保持量从2010年的1.08 × 10⁸ t增加至2020年的1.25 × 10⁸ t,增长1.62 × 10⁷ t。土壤保持质量提升区域面积为1.35 × 10⁵ km2,占全省面积的35.36%;退化面积为0.99 × 10⁵ km2,占25.87%,集中在西部、南部和东北部。
![]() 图 5 2010—2020年云南省生态系统服务功能变化空间分布Figure 5. Spatial distribution of changes in ecosystem service functions in Yunnan Province from 2010 to 2020
图 5 2010—2020年云南省生态系统服务功能变化空间分布Figure 5. Spatial distribution of changes in ecosystem service functions in Yunnan Province from 2010 to 2020碳储量从2010年的8.25 × 10⁹ t增加至2020年的8.26 × 10⁹ t,增加1.19 × 10⁷ t。碳储量显著增长的城市包括玉溪、思茅和临沧,减少城市主要为西双版纳。10年间碳储量减少的面积为8.74× 10⁴ km2,占全省面积的22.85%,增加面积为8.63× 10⁴ km2。
2010年全省平均产水量444.73 mm,2020年降至424.67 mm,产水量减少面积为1.32 × 10⁵ km2,增加面积为7.58 × 10⁴ km2。减少区域集中分布在东部昆明、曲靖、文山、红河及西南部西双版纳、普洱等城市,增加区域主要分布于普尔、红河、文山南部以及德宏等城市。
氮负荷量从2010年的2.74 × 10⁷ kg增加到2020年的6.29 × 10⁷ kg;磷负荷量从8.90 × 10⁶ kg增加到1.65 × 10⁷ kg。氮负荷量增加面积为5.06 × 10⁴ km2,减少面积为4.77 × 10⁴ km2,磷负荷量增加面积为4.41 × 10⁴ km2,减少面积为4.65 × 10⁴ km2。氮磷负荷增加区域主要分布于保山和临沧等地区,减少区域主要分布于迪庆东北部。
2010—2020年,土壤保持与碳储量服务提升可能与云南省整体林地面积增加有关。而灌木林面积与降水量的减少,可能是导致水源涵养与水质净化服务退化主要影响因素(图5)。
2.1.3 云南省生态系统服务约束关系量化
对2010、2020年云南省土壤保持、水源涵养服务与水质净化服务之间约束关系进行量化,得出各生态系统服务之间约束关系主要表现为双驼峰型、驼峰型、负凸曲线等(图6)。
![]() 图 6 2010、2020年各类生态系统服务之间的约束关系Figure 6. Constraints between various ecosystem services in 2010 and 2020
图 6 2010、2020年各类生态系统服务之间的约束关系Figure 6. Constraints between various ecosystem services in 2010 and 2020土壤保持服务与水源涵养服务之间呈驼峰型曲线。当2010、2020年产水量分别位于阈值640.78、593.41 mm时,土壤保持量达到最大值,即61 664.16、60 995.34 t/(hm2·a)。当产水量小于阈值,水源涵养服务对土壤保持服务的约束力减弱;当产水量大于阈值,水源涵养服务对土壤保持服务约束力增强。
氮负荷与产水量关系曲线呈现驼峰型。2010、2020年氮负荷的峰值(4.81、4.58 kg)对应的产水量分别为745.82、834.93 mm。当产水量小于阈值时,水源涵养服务对氮负荷的约束力减弱;当产水量大于阈值时,水源涵养服务对氮负荷的约束力增强。
磷负荷与产水量关系曲线呈现驼峰型。2010、2020年磷负荷的峰值(2.93、2.96 kg)对应的产水量分别为881.63、811.62 mm。当产水量小于阈值时,水源涵养服务对磷负荷的约束力减弱;当产水量大于阈值时,水源涵养服务对磷负荷的约束力增强。
2010年氮负荷与土壤保持量呈负凸曲线,2020年为驼峰型。2020年土壤保持量峰值为60 087.12 t/(hm2·a),对应的氮负荷为3.00 kg。当氮负荷量小于阈值时,氮负荷对土壤保持量的约束力减弱;当氮负荷量大于阈值时,氮负荷对土壤保持量的约束力增强。
磷负荷与土壤保持量呈双驼峰型,且2020年阈值较2010年整体左移。2010、2020年土壤保持量最大值对应的氮负荷分别为3.00、2.49 kg,对应的土壤保持量分别为7.06× 10⁴ 、6.65× 10⁴ t/(hm2·a)。
2.2 云南省生态系统服务价值综合评估
生态系统服务价值较高区域主要分布在西部、西南部、南部邻近行政边界区域,较低区域主要分布在中部与北部地区(图7)。2010年生态系统服务价值量为1.79 × 10¹²元;而2020年降为1.71 × 10¹²元,减少了8.00 × 10¹⁰元(表2),土壤保持和碳储量服务价值有所提升,但水源涵养和水质净化服务价值下降。
![]() 图 7 2010、2020年云南省生态系统服务价值与变化空间分布Figure 7. Spatial distribution of ecosystem service value and changes in Yunnan Province in 2010 and 2020表 2 2010、2020年生态系统服务指标与综合生态系统服务价值Table 2. Ecosystem service indicators and comprehensive ecosystem service value in 2010 and 2020
图 7 2010、2020年云南省生态系统服务价值与变化空间分布Figure 7. Spatial distribution of ecosystem service value and changes in Yunnan Province in 2010 and 2020表 2 2010、2020年生态系统服务指标与综合生态系统服务价值Table 2. Ecosystem service indicators and comprehensive ecosystem service value in 2010 and 2020指标 Index 2010 2020 总价值/元
Total value/CNY占比
Proportion/%平均价值/(元·km−2)
Average value/(CNY·km−2)总价值/元
Total value/CNY占比
Proportion/%平均价值/(元·km−2)
Average value/(CNY·km−2)土壤保持服务
Soil conservation service2.58 × 108 0.01 655.65 2.85 × 10⁸ 0.02 722.70 碳储量服务
Carbon storage service2.041 × 1011 11.42 5.18 × 10⁵ 2.044 × 10¹¹ 11.99 5.19 × 10⁵ 水源涵养服务
Water conservation service1.58 × 1012 88.56 4.02 × 10⁶ 1.50 × 10¹² 87.99 3.81 × 10⁶ 水质净化服务(氮)
Water purification
service (nitrogen)5.30 × 10⁷ 0.00 134.47 5.20 × 10⁷ 0.00 132.04 水质净化服务(磷)
Water purification
service (phosphorus)5.44 × 10⁶ 0.00 13.81 5.20 × 10⁶ 0.00 13.21 总价值
Total value1.79 × 1012 100.00 4.54 × 10⁶ 1.71 × 10¹² 100.00 4.33 × 10⁶ 与2010年相比,2020年服务价值量增加的区域主要在文山、德宏、普洱中部和迪庆东北部;减少区域主要在南部西双版纳和东部昭通、昆明、曲靖等地,其中西双版纳生态系统服务价值降幅最大。
3. 讨 论
InVEST模型通过土地利用和生物属性表评估生态系统服务,适用于大空间和长时序的研究。本研究采用高分辨率数据和本地化参数,参考邻近区域的研究[18,28−29],以确保模型的可靠性。与前人邻近区域的相关研究进行比较[29−31],模型结果可靠。
2010、2020年云南省综合生态服务价值分别为1.79 × 10¹²、1.71 × 10¹²元,有一定程度退化,这与张钰莹等[30]研究结果相近。土壤保持服务和碳储量服务很大程度上取决于土地利用与植被覆盖。云南省自2010年以来,实施“退耕还林还草”政策,林地面积和植被覆盖度增加,从而提升了土壤保持服务和碳储量服务价值。水源涵养服务主要受降水量的影响,云南省的降水主要受印度洋西南季风和南海东南季风的影响。由于云南省地形自西南向东北呈阶梯式升高,水汽难以向云南省中部和北部输送,进而导致了西南部地区水源涵养能力较强。2010、2020年云南年降水量为1 119.04、1 097.45 mm,降水量下降可能是云南省产水量减少的主要原因。云南省的产水量在退化区域呈现出点状分布,这可能与土地利用的变化有关。由于建设用地导致降水难以渗透,同时伴随着热岛效应,使得蒸散量增加。与2010年相比,2020年云南省的氮磷负荷量有所增加,这导致了水质净化服务的退化。氮磷负荷量的变化主要是由于旱地、林地和草地转变为耕地所引起的,而农业生产活动使得耕地的氮磷负荷量显著高于其他土地利用类型。
云南省生态系统服务的整体退化,导致了部分服务之间存在的驼峰型约束关系阈值向左偏移(图6)。这一现象表明,在整体生态系统服务退化的情况下,土壤保持服务和水质净化服务对限制变量可能更为敏感,进一步体现当前云南省生态系统的脆弱性。本研究仅对3类生态系统服务之间的约束关系进行了探讨,约束关系的规律性相对笼统,未能深入探讨气候、植被、地形和土壤等要素对生态系统服务的具体影响。
本文从空间分布、垂直分布和时间变化特征3个纬度,对云南省2010和2020年生态系统服务进行了分析。通过价值量评估法标准化各生态系统服务,得出综合生态系统服务价值。2010—2020年,云南省土壤保持、碳储量服务得到改善。然而,InVEST模型生物属性表的设置相对单一,参数仅凭单一土地利用类型决定,未能充分考虑同一土地利用类型,不同空间分布所存在的空间异质性[30]。且本研究涉及年份较少,对云南省土地利用和生态系统服务的未来变化缺乏预测性分析。因此,未来研究应综合考虑区位条件、气候、人类活动等因素,细化生物属性表,结合区域特点进行分区评价,选择适宜评价模型,着眼于生态系统服务时间特征及预测分析,收集实地观测数据,进一步提高结果的可靠性。
4. 结 论
(1)在空间分布上,除水质净化服务外,云南省各项生态系统服务质量整体上呈现出西高东低的格局;全区大部分为低氮磷负荷区,氮磷负荷量高值区较为分散。
(2)在垂直分布上,除水质净化服务,各项服务质量较高区域主要分布在海拔2 400 ~ 2 800 m区间范围内;高质量水质净化服务的区域主要分布于海拔3 300 ~ 4 000 m区间内。
(3)从时间变化特征看,2010—2020年云南省土壤保持服务、碳储量服务得到改善;水源涵养服务与水质净化服务退化。
(4)各生态系统服务之间约束关系主要表现为双驼峰型、驼峰型、负凸曲线。约束作用强弱变化随着阈值区间的变化而变化。与2010年相比,2020年阈值整体呈现左移趋势。
(5)2010—2020年云南省综合生态系统服务价值有所下降。2010年云南省生态系统服务总价值为1.79 × 10¹²元,平均价值量4.54 × 10⁶元/km2,2020年下降至1.71 × 1012元,平均价值量4.33 × 10⁶元/km2。
-
![]()
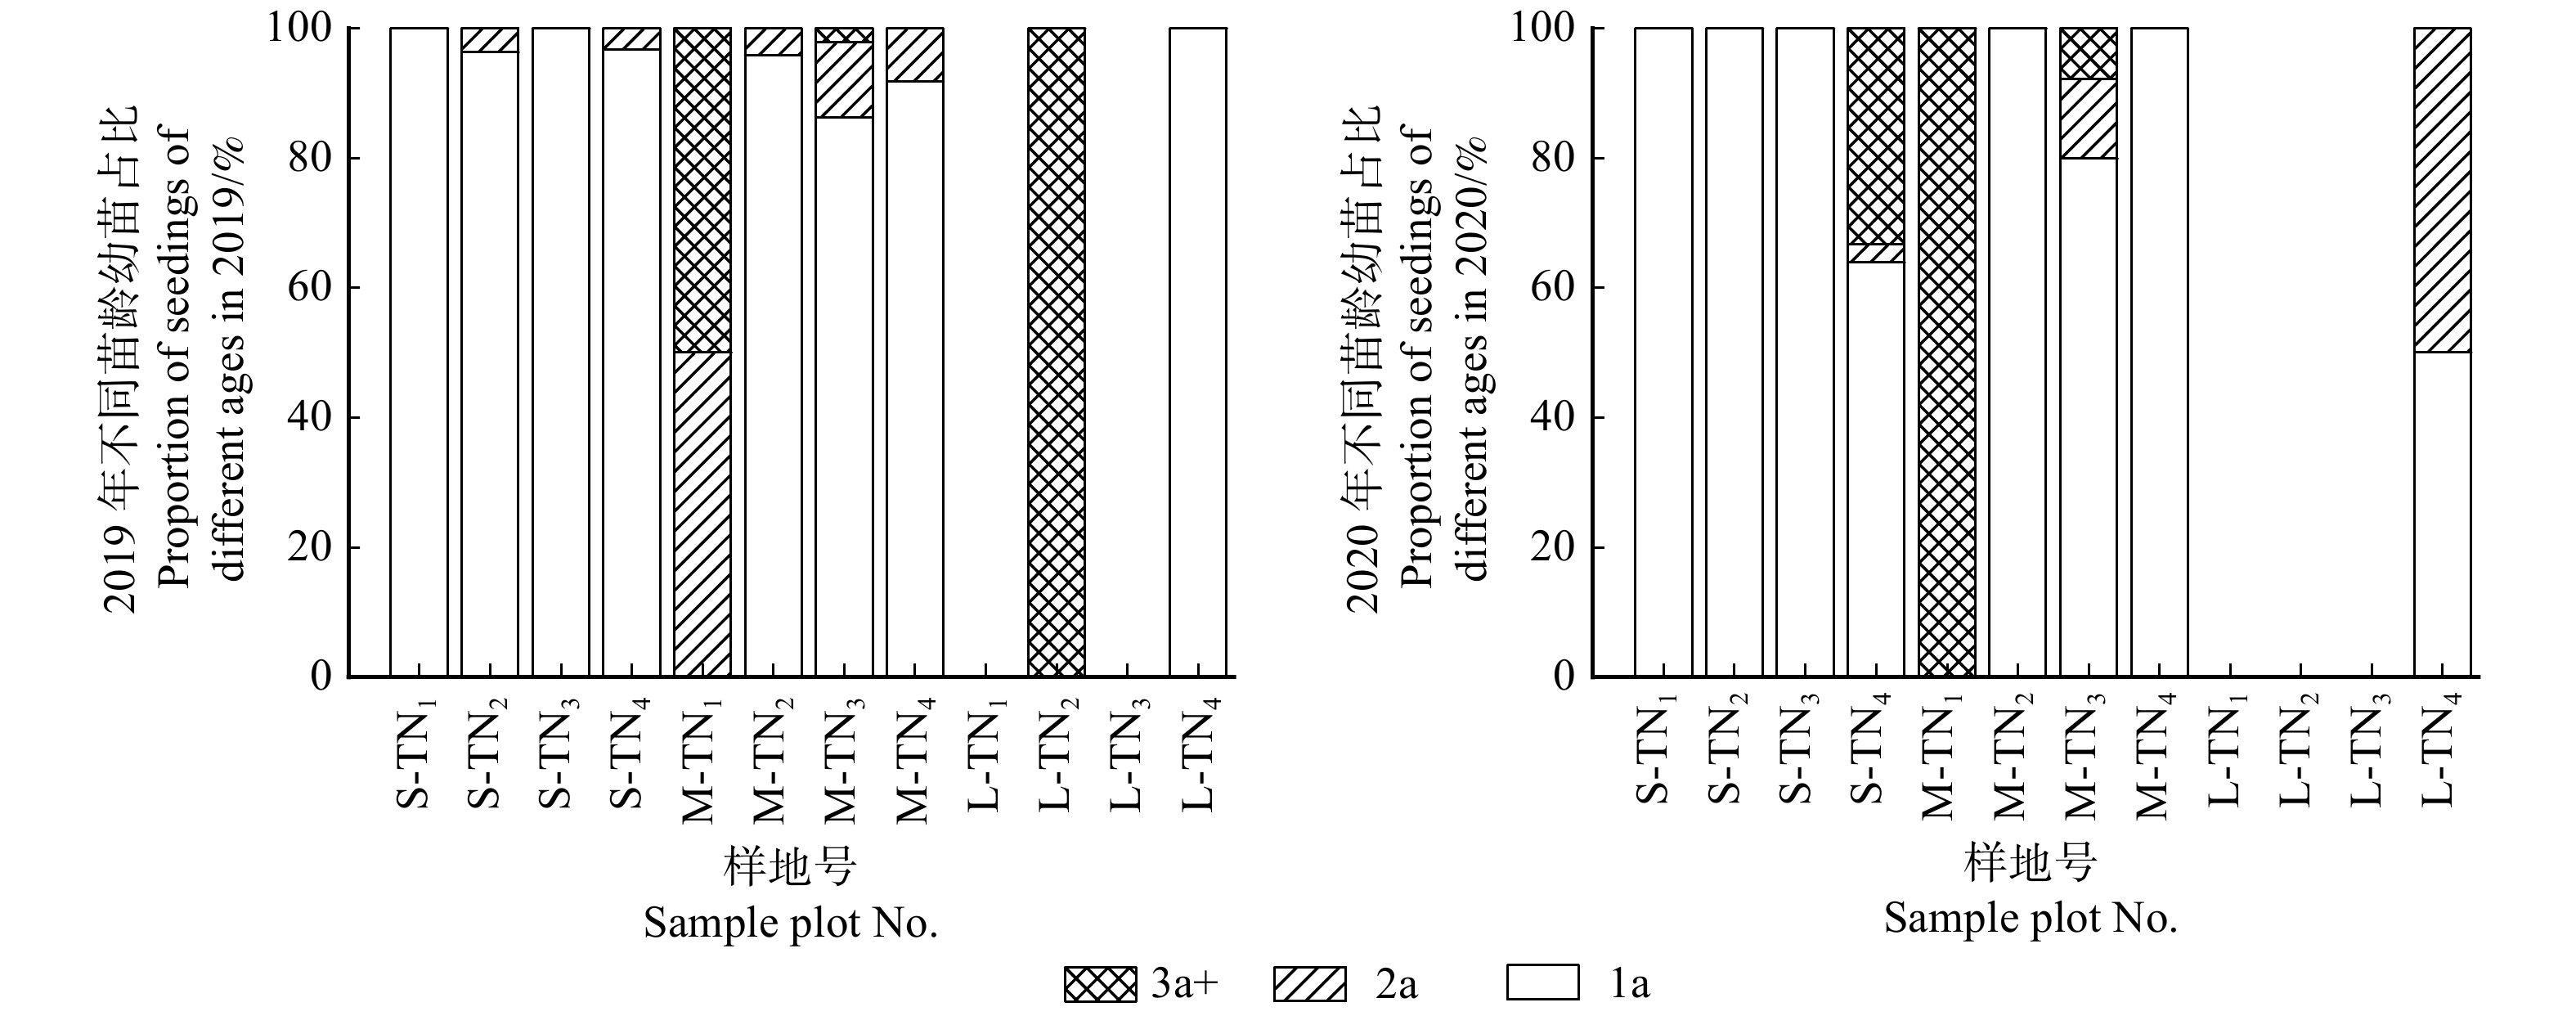
图 1 2年中各样地不同苗龄幼苗占比
Figure 1. Proportion of seedlings of different ages in varied sample plots in two years
![]()
图 2 幼苗地径在不同时期的比较
S.中龄林;M.近熟林;L.成熟林。不同大写字母表示不同人工林间的差异显著(P < 0.05),不同小写字母表示不同年份间的差异显著(P < 0.05)。下同。S, middle-aged forest; M, near mature forest; L, mature forest. Different capital letters indicate the difference between varied plantations is significant at P < 0.05 level, and different lowercase letters indicate the difference between varied years is significant at P < 0.05 level. The same below.
Figure 2. Comparison of seedling ground diameter in different periods
![]()
图 4 幼苗生长指标在生长季内的变化
不同字母表示幼苗地径和苗高生长季初、末期间的差异显著 (P < 0.05)。Different letters indicate the difference for seedling ground diameter and seedling height between the initial stage and end of the growth is significant at P < 0.05 level.
Figure 4. Changes of seedling growth indexes in growing season
![]()
图 5 2年中更新幼苗密度
TN1. 35%极重度间伐;TN2. 30%重度间伐;TN3. 20%中度间伐;TN4. 15%轻度间伐。不同大写字母表示不同人工林间的差异显著(P<0.05),不同小写字母表示不同密度间的差异显著(P<0.05)。下同。TN1, 35% extremely severe thinning; TN2, 30% severe thinning; TN3, 20% moderate thinning; TN4, 15% light thinning. Different capital letters indicate the difference between varied plantations is significant at P<0.05 level, and different lowercase letters indicate the difference between varied densities is significant at P<0.05 level. The same below.
Figure 5. Density of regeneration seedlings in two years
![]()
图 6 生长季存活幼苗密度的动态变化图
Figure 6. Dynamic variation of density of survival seedlings in growing season
表 1 样地编号及对应的处理措施
Table 1 Sample plot No. and corresponding treatment measures
样地号
Sample plot No.2019年林龄/a
Forest age in 2019/year2019年龄级
Age class in 2019间伐强度
Thinning intensity/%伐后平均林分密度/(株ˑhm−2)
Average stand density after thinning/(plantˑha−1)S-TN1 27 中龄林
Middle aged forest35 2 550 S-TN2 30 2 925 S-TN3 20 3 475 S-TN4 15 3 900 M-TN1 31 近熟林
Near mature forest35 1 050 M-TN2 30 1 550 M-TN3 20 2 000 M-TN4 15 2 625 L-TN1 47 成熟林
Mature forest35 600 L-TN2 30 700 L-TN3 20 800 L-TN4 15 900  下载: 导出CSV
表 2 固定试验样地基本林分信息
Table 2 Basic stand information of fixed test sample plot
样地号
Sample plot No.平均胸径
Average DBH/cm平均树高
Average tree height/m平均冠幅
Average crown width/m郁闭度
Canopy density海拔
Altitude/mS-TN1 12.83 12.32 2.22 0.62 1 659 S-TN2 12.50 10.37 2.25 0.66 S-TN3 12.09 11.33 1.97 0.67 S-TN4 11.00 11.91 1.77 0.67 M-TN1 16.31 14.64 3.14 0.47 1 669 M-TN2 14.38 13.71 2.35 0.50 M-TN3 13.86 14.36 2.36 0.56 M-TN4 12.60 12.83 2.11 0.59 L-TN1 24.86 23.31 4.44 0.38 1 716 L-TN2 25.45 21.50 3.77 0.46 L-TN3 24.64 22.98 3.50 0.50 L-TN4 23.87 24.00 3.38 0.51
下载: 导出CSV
表 3 华北落叶松林各级幼苗的更新频率
Table 3 Regeneration frequency of seedlings in L. principis-rupprechtii plantations
样地号
Sample
plot No.2019 2020 1a 1a更新频率
Regeneration frequency
of 1a/%2a 2a更新频率
Regeneration frequency
of 2a/%3a+ 3a+ 更新频率 Regeneration
frequency
of 3a+/%整体更新频率
Overall regeneration
frequency/%1a 1a更新频率
Regeneration frequency
of 1a/%2a 2a更新频率
Regeneration frequency
of 2a/%3a + 3a+ 更新频率 Regeneration
frequency
of 3a+/%整体更新频率
Overall regeneration
frequency/%S-TN1 √ 100 50 0 100 √ 100 25 25 100 S-TN2 √ √ √ S-TN3 √ √ S-TN4 √ √ √ √ √ M-TN1 75 √ 100 √ 50 100 75 25 √ 50 100 M-TN2 √ √ √ M-TN3 √ √ √ √ √ √ M-TN4 √ √ √ L-TN1 25 0 25 50 25 25 0 25 L-TN2 √ L-TN3 L-TN4 √ √ √ 注:1a. 1年生幼苗;2a. 2年生幼苗;3a+. 3 ~ 5年生幼苗。存在更新的样地标注符号“√”;没有更新的样地不作任何标注;各样地幼树的更新频率均为0,故在上表中省略。Notes: 1a, 1-year-old seedlings; 2a, 2-year-old seedlings; 3a+, 3−5 years old seedlings. The regenerated sample plot is marked with symbol "√"; there is no mark for the non regenerated sample plots; the regeneration frequency of young trees in all sample plots is 0, so it is omitted in the above table.
下载: 导出CSV
表 4 幼苗密度在2年间的比较
Table 4 Comparison of seedling density in two years
样地号
Sample plot No.更新密度/(株·hm−2)
Regeneration density /(plant·ha−1)2019 2020 S-TN1 133.33 ± 100.69 a 33.33 ± 11.79 a S-TN2 133.33 ± 71.69 a 33.33 ± 31.18 a S-TN3 125.00 ± 54.01 a 83.33 ± 82.50 a S-TN4 216.67 ± 104.75 a 116.67 ± 129.64 a M-TN1 16.67 ± 11.79 a 8.33 ± 11.79 a M-TN2 108.33 ± 71.69 a 41.67 ± 31.18 a M-TN3 525.00 ± 113.65 a 208.33 ± 153.21 a M-TN4 233.33 ± 96.47 a 450.00 ± 194.72 a L-TN1 0 ± 0 a 0 ± 0 a L-TN2 8.33 ± 11.79 a 0 ± 0 a L-TN3 0 ± 0 a 0 ± 0 a L-TN4 41.67 ± 42.49 a 25.00 ± 20.41 a 注:不同小写字母表示样地中的更新密度在不同年份间的差异显著 (0.05)。Note: different lowercase letters indicate the difference in regeneration density of the sample plots in different years is significant at 0.05 level.
下载: 导出CSV
表 5 2年间生长季成活率比较
Table 5 Comparison of survival rate in growing season in two years
龄级
Age class生长季成活率
Survival rate in growing season/%2019 2020 S 75.91 ± 20.32 Aa 32.99 ± 13.41 Ab M 73.99 ± 15.22 Aa 67.02 ± 20.34 Aa
下载: 导出CSV
表 6 2019年成活率比较
Table 6 Comparison of survival rates in 2019
龄级
Age class生长季成活率
Survival rate in growing
season/%越冬成活率
Overwintering survival
rate/%S 75.91 ± 20.32 Aa 1.74 ± 3.01 Ab M 73.99 ± 15.22 Aa 18.06 ± 20.55 Ab
下载: 导出CSV
-
[1] 张树梓, 李梅, 张树彬, 等. 塞罕坝华北落叶松人工林天然更新影响因子[J]. 生态学报, 2015, 35(16):5403−5411. Zhang S Z, Li M, Zhang S B, et al. Influence factors of natural regeneration of Larix principis-rupprechtii plantations in Saihanba of Hebei, China[J]. Acta Ecologica Sinica, 2015, 35(16): 5403−5411.
[2] 王雯雯, 欧景莉, 刘晓, 等. 秦岭华北落叶松林乔木种群结构与更新[J]. 生态科学, 2011, 30(6):618−623. doi: 10.3969/j.issn.1008-8873.2011.06.010 Wang W W, Ou J L, Liu X, et al. A survey on regeneration of trees in Larix principis-rupprechtii forest[J]. Ecological Science, 2011, 30(6): 618−623. doi: 10.3969/j.issn.1008-8873.2011.06.010
[3] 杨秀清. 影响关帝山华北落叶松天然更新与幼苗存活的微生境变量分析[J]. 山西农业大学学报(自然科学版), 2010, 30(6):542−547. Yang X Q. Analysis on micro-habitat variables affecting natural regeneration and survial of Larix principis-rupprechtii seedlings in Guandi Mountain[J]. Journal of Shanxi Agricultural University (Natural Science Edition), 2010, 30(6): 542−547.
[4] 连相汝, 鲁法典, 刘成杰, 等. 我国人工林天然更新研究进展[J]. 世界林业研究, 2013, 26(6):52−58. Lian X R, Lu F D, Liu C J, et al. Research progress of natural regeneration of forest in China[J]. World Forestry Research, 2013, 26(6): 52−58.
[5] 唐继新, 贾宏炎, 曾冀, 等. 南亚热带米老排人工林皆伐迹地天然更新研究[J]. 中南林业科技大学学报, 2018, 38(3):59−63. Tang J X, Jia H Y, Zeng J, et al. Natural regeneration on clear cut land of Mytilaria laosensis plantation in south subtropical area of China[J]. Journal of Central South University of Forestry and Technology, 2018, 38(3): 59−63.
[6] Birkedal M, Löf M, Olsson G E, et al. Effects of granivorous rodents on direct seeding of oak and beech in relation to site preparation and sowing date[J]. Forest Ecology & Management, 2010, 259(12): 2382−2389.
[7] 孙国龙, 李文博, 黄选瑞, 等. 华北落叶松人工林天然更新及与土壤因子的关系[J]. 安徽农业大学学报, 2017, 44(6):1047−1051. Sun G L, Li W B, Huang X R, et al. Natural regeneration of Larix principis-rupprechtii plantation and its relation to the soil factors[J]. Journal of Anhui Agricultural University, 2017, 44(6): 1047−1051.
[8] 石晓东, 高润梅, 韩有志, 等. 凋落物对2针叶树种种子萌发和幼苗生长的影响[J]. 中国水土保持科学, 2014, 12(4):112−120. doi: 10.3969/j.issn.1672-3007.2014.04.018 Shi X D, Gao R M, Han Y Z, et al. Effects of litter on seed germination and seedling growth of two coniferous tree species[J]. Science of Soil and Water Conservation, 2014, 12(4): 112−120. doi: 10.3969/j.issn.1672-3007.2014.04.018
[9] 高润梅, 石晓东, 郭跃东, 等. 文峪河上游华北落叶松林的种子雨、种子库与幼苗更新[J]. 生态学报, 2015, 35(11):3588−3597. Gao R M, Shi X D, Guo Y D, et al. Seed rain, seed bank and seedling regeneration of Larix principis-rupprechtii stands in the upper reaches of Wenyuhe[J]. Acta Ecologica Sinica, 2015, 35(11): 3588−3597.
[10] Queenborough S A, Burslem D F R P, Garwood N C, et al. Neighborhood and community interactions determine the spatial pattern of tropical tree seedling survival[J]. Ecology, 2007, 88(9): 2248−2258. doi: 10.1890/06-0737.1
[11] Guillermo J, Martínez P, Peri P L, et al. Canopy structure analysis for estimating forest regeneration dynamics and growth in Nothofagus pumilio forests[J]. Annals of Forest Science, 2011, 68(3): 587−594. doi: 10.1007/s13595-011-0059-1
[12] 罗梅, 郑小贤. 金沟岭林场落叶松人工林天然更新动态研究[J]. 中南林业科技大学学报, 2016, 36(9):7−11. Luo M, Zheng X X. Dynamic study of natural regeneration of Larix olgensis plantation in Jingouling Forest Farm[J]. Journal of Central South University of Forestry and Technology, 2016, 36(9): 7−11.
[13] 周庆营, 刘春利, 袁德水, 等. 华北落叶松种子园强度疏伐对结实效果的分析[J]. 河北林果研究, 2009, 24(1):48−50. doi: 10.3969/j.issn.1007-4961.2009.01.012 Zhou Q Y, Liu C L, Yuan D S, et al. Analysis on seed effect in heavy thinning of Larix principis-rupprechtii seed orchard[J]. Hebei Journal of Forestry and Orchard Research, 2009, 24(1): 48−50. doi: 10.3969/j.issn.1007-4961.2009.01.012
[14] 闫茹. 关帝山天然次生华北落叶松林林下更新特征研究[J]. 山西农业科学, 2012(5):505−507. doi: 10.3969/j.issn.1002-2481.2012.05.22 Yan R. Study on regeneration characteristics under canopy of natural secondary Larix principis-rupprechtii Mayr in Guandi Mountains[J]. Journal of Shanxi Agricultural Sciences, 2012(5): 505−507. doi: 10.3969/j.issn.1002-2481.2012.05.22
[15] 彭文成, 熊梦辉, 龙文兴, 等. 海南尖峰岭两类人工林中天然更新群落特征研究[J]. 林业科学研究, 2015, 29(5):739−743. doi: 10.3969/j.issn.1001-1498.2015.05.021 Peng W C, Xiong M H, Long W X, et al. Characteristics of natural regeneration communities in two types of artificial forests in Jianfengling, Hainan Province[J]. Forestry Science Research, 2015, 29(5): 739−743. doi: 10.3969/j.issn.1001-1498.2015.05.021
[16] 闫兴富, 周立彪, 张靠稳, 等. 不同密度下辽东栎幼苗子叶丢失及其对幼苗存活和生长的影响[J]. 植物生态学报, 2012, 36(8):831−840. Yan X F, Zhou L B, Zhang K W, et al. Cotyledon loss and its effects on survival and growth of Quercus wutaishanica seedlings under different densities[J]. Chinese Journal of Plant Ecology, 2012, 36(8): 831−840.
[17] 杨占彪, 李圣男, 金红喜. 六盘山林区华北落叶松天然更新影响因素研究[J]. 江苏农业科学, 2011, 39(3):206−209. doi: 10.3969/j.issn.1002-1302.2011.03.082 Yang Z B, Li S N, Jin H X. Influencing factors of natural regeneration of Larix principis-rupprechtii in Liupan Mountains Forest Region[J]. Jiangsu Agricultural Science, 2011, 39(3): 206−209. doi: 10.3969/j.issn.1002-1302.2011.03.082
[18] 石晓东, 高润梅, 陈龙涛. 模拟气候变化对2针叶树种种子萌发和幼苗生长的影响[J]. 中国水土保持科学, 2016, 14(5):66−73. Shi X D, Gao R M, Chen L T. Effects of simulated climate change on seed germination and seedling growth of two coniferous tree species[J]. Science of Soil and Water Conservation, 2016, 14(5): 66−73.
[19] 朱教君, 李凤芹, 松崎健, 等. 间伐对日本黑松海岸林更新的影响[J]. 应用生态学报, 2002, 13(11):1361−1367. Zhu J J, Li F Q, Song Q J, et al. Effects of thinning on regeneration of Pinus koraiensis coastal forest[J]. Chinese Journal of Applied Ecology, 2002, 13(11): 1361−1367.
[20] 历胤男, 刘盛, 李国伟, 等. 落叶松人工林冠下光环境对更新幼树生长的影响[J]. 东北林业大学学报, 2016, 44(10):8−11. doi: 10.3969/j.issn.1000-5382.2016.10.002 Li Y N, Liu S, Li G W, et al. Effect of light environment on updating sapling growth under artificial larch forest canopy[J]. Journal of Northeast Forestry University, 2016, 44(10): 8−11. doi: 10.3969/j.issn.1000-5382.2016.10.002
[21] Miralles J, Martínez-Sánchez J J, Franco J A, et al. Rhamnus alaternus growth under four simulated shade environments: morphological, anatomical and physiological responses[J]. Scientia Horticulturae, 2011, 127(4): 562−570. doi: 10.1016/j.scienta.2010.12.005
[22] Jonsson J A, Sigurdsson B D. Effects of early thinning and fertilization on soil temperature and soil respiration in a poplar plantation[J]. Icelandic Agricultural Sciences, 2010, 23(1): 97−109.
[23] 李进, 石晓东, 高润梅, 等. 华北落叶松天然次生林更新及影响因素[J]. 森林与环境学报, 2020, 40(6):588−596. Li J, Shi X D, Gao R M, et al. Regeneration and affecting factors of Larix principis-rupprechtii natural secondary forests[J]. Journal of Forest and Environment, 2020, 40(6): 588−596.
[24] Liang W J, Wei X. Factors promoting the natural regeneration of Larix principis-rupprechtii plantation in the Lüliang Mountains of central China[J]. Peer J, 2020(8): 9339.
[25] 马履一, 李春义, 王希群, 等. 不同强度间伐对北京山区油松生长及其林下植物多样性的影响[J]. 林业科学, 2007, 19(5):1−9. doi: 10.3321/j.issn:1001-7488.2007.05.001 Ma L Y, Li C Y, Wang X Q, et al. Effects of thinning on the growth and the diversity of undergrowth of Pinus tabulaeformis p
lantation in Beijing mountainous areas[J]. Scientia Silvae Sinicae, 2007, 19(5): 1−9. doi: 10.3321/j.issn:1001-7488.2007.05.001 [26] 康冰, 王得祥, 李刚, 等. 秦岭山地锐齿栎次生林幼苗更新特征[J]. 生态学报, 2012, 32(9):2738−2747. doi: 10.5846/stxb201103230361 Kang B, Wang D X, Li G, et al. Characteristics of seedlings regeneration in Quercus aliena var. acuteserrata secondary forests in Qinling Mountains[J]. Acta Ecologica Sinica, 2012, 32(9): 2738−2747. doi: 10.5846/stxb201103230361


计量
- 文章访问数: 856
- HTML全文浏览量: 327
- PDF下载量: 88
