
Influence of type and structure on the quality of green space next to houses in residential areas of Beijing
-
摘要:目的 居住区宅旁绿色空间是最接近居民生活并为居民所使用的绿色空间,既有生态美学价值和保健功能,又能对住宅的低层住户空间起到遮蔽作用,具有一定的安全性。本研究通过构建城市居住区宅旁绿色空间质量评价指标,分析建成年代和空间类型对宅旁绿色空间质量的影响,旨在为未来科学建设居住区宅旁绿色空间提供理论支撑。方法 以北京市不同建成年代的居住区宅旁绿色空间为研究对象,从宅旁绿化空间树种组成、空间结构、美学特性、保健功能4方面,构建居住区宅旁绿色空间质量评价指标。通过简相关分析,从15个指标中筛选出9个用于质量评价的主要指标,并通过主成分分析降维构建3个质量评价指数,并确定各指数和指标的权重,进一步通过指数综合得分与所筛选指标间的关系对不同建成年代的居住区宅旁绿色空间质量进行分析。结果 (1)居住区宅旁绿色空间质量受结构、树种组成、美学效果3个主成分影响,各成分对其空间质量的影响程度依次为30.34%、24.27%、22.26%。(2)中间型居住区的绿色空间综合得分分别高于新建型居住区和老旧型居住区1.60%和8.34%,但建设时间对居住区宅旁绿色空间质量的影响在统计学上未达显著水平。(3)绿色空间类型对宅旁绿色空间质量有极显著的影响,综合得分由高到低依次为宅间组合式、自然群落式、规则成林式、宅旁紧贴式。(4)空间尺度及植物配置方式的不同是造成绿色空间类型间质量差异的主要原因。结论 类型和结构对居住区宅旁绿色空间质量有显著影响,居住区建成年代对其质量无显著影响。宅旁绿色空间质量主要取决于绿色空间结构、空间协调度和视觉质量。植物视线遮蔽度、相对空间垂直绿量对绿色空间结构质量的贡献较大;色彩丰富度、树种多样性对宅旁绿色空间质量有正向促进作用;植被与建筑空间协调度在一定范围内对绿色空间质量有积极影响。在设计与建设居住区宅旁绿色空间时,应重点考虑宅间组合式、自然群落式、规则成林式的空间类型,少用或不用宅旁紧贴式。在住宅建筑高度一定的情况下,适当扩大宅旁绿色空间的宽度,保证空间协调度处于较好水平,并采用乔−灌−草近自然复层种植结构,合理分配乔木、灌木数量比例,在满足空间结构、功能的基础上,兼具视觉美感与景观效应。Abstract:Objective The green space next to the residence in the residential area is the green space closest to the residents’ life and used by the residents. It not only has ecological aesthetic value and health care function, but also can shield the low-rise residents’ space of the residence, and has certain safety. By constructing the quality evaluation index of green space beside urban residential area buildings, this study analyzed the influence of construction ages and green space types on the quality of green space beside residential buildings, aiming to provide theoretical support for the scientific construction of green space beside residential area buildings in the future.Method Taking green space beside residential area buildings with different construction ages in Beijing as the research object, the indicator system for quality evaluation of green space beside residential buildings was selected, and the indicator system was composed with tree species composition, spatial structure, aesthetic characteristics and plant health function. 9 of indicators were screened from 15 of primary indicators by correlation analysis. Three indices were constructed by dimensionality reduction using principal component analysis, and weights of the indices and indicators were determined by principal component analysis. Furthermore, the quality of green space beside residential area buildings in different construction ages was analyzed through the relationship between the index composite score and the selected indicators.Result (1) The quality of green space beside residential buildings was dominantly influenced by three main components, which were the three indices consisting of structure, tree species composition and aesthetics effect. And the influence degree of each index on spatial quality of the green space was 30.34%, 24.27% and 22.26%, respectively. (2) The integrated score of green space in intermediate residential areas was 1.60% and 8.34% higher than that of new residential area and old residential area, respectively, but the built ages of the residential areas had no significant effect on the quality of green space beside residential buildings. (3) The quality of green space beside buildings was significantly affected by green space type, and the integrated score from high to low was the combination between house pattern, natural community pattern, regular forest pattern and close-to-houses pattern. (4) The differences of spatial scale and plant configuration were main reasons for the quality difference among green space types.Conclusion The quality of green space beside residential area buildings is significantly affected by the type and structure, while it is not affected by the construction ages of the residential areas. The dominant factors which affect the quality of green space beside residential buildings are green space structure, spatial coordination degree and visual quality. Screened degree of view by plants and relative vertical green volume contribute greatly to the quality of green spatial structure; color richness and tree species diversity have positive effect on the quality of green space beside residential buildings; spatial coordination degree between vegetation and building has a positive impact on the green space quality within a certain range. Therefore, in the design and construction of residential green space, we should focus on the combination of buildings, natural group, regular forest of space types, less use or not close to the house. If the height of the residential building is certain, the width of the green space beside the house should be expanded appropriately, so as to ensure that the degree of space coordination is at a better level. What’s more, the proportion of the number of trees and shrubs is reasonably distributed in the near-natural composite planting structure, and on the basis of satisfying the spatial structure and function, it has both visual aesthetic feeling and landscape effect.
-
近年来海绵城市在国家的支持引导下发展迅猛,出台了一系列技术指导文件,并设立试点城市,逐步进行探索 [1]。我国海绵城市研究的热点主要集中在水体污染、城市排水、生态修复、低影响开发、水文安全、绿色城市等方向[2]。自2014年启动海绵城市国家计划以来,海绵城市试点城市的城市雨水管理规划实践需要大量的资金投入,由于海绵城市的建设是建立在技术与经济的可行性之上的,因此有必要对海绵城市建设的成本和效益开展研究[3]。
相关研究表明,相比于传统雨洪管理技术,LID的应用可降低15% ~ 80%的开发成本[4]。中国城市LID设施的成本效益存在区域差异[5],可以基于成本效益优化LID的布局方式[6]。LID措施的经济效益主要来自减少暴雨径流排放许可费的直接效益和控制雨洪、减少雨污排放管道和后续水质净化费用等间接效益[7-8],以及雨水径流通过LID措施如下沉式绿地入渗回馈地下水,也可以间接产生经济效益[9],并且LID措施可在场地清理、管道安装和防腐上节约大量成本[10]。
综观之前的研究,国内关于海绵城市经济效益方面还有欠缺,目前国内对于公园绿地径流收集灌溉利用效益成本的研究较少,通常绿地灌溉方面的研究都没有与海绵城市的建设标准相结合,有一部分海绵城市经济研究中是以雨水灌溉利用作为效益的一部分,但又缺乏雨水径流收集的测算。
半湿润地区的降雨量小于蒸发量,绿地面临缺水的问题。半湿润地区的降雨多集中于夏季,夏季又是园林植物需水量较大的季节,因此在夏季收集径流用于植物灌溉,这一策略符合半湿润地区的降雨特征和园林植物的生理需要[11]。但是,这个问题在经济上是否可行和如何做到,让收集利用设施能够达到经济效益的最大化,用定性分析无法得出准确结论,需要用定量的方法做出详细的测算和深入的研究。
1. 研究区域概况
1.1 半湿润地区海绵城市建设的特殊性
半湿润地区是指干燥度为1 ~ 1.5的地区,包括大部分东北平原、华北平原以及黄土高原南部和青藏高原东南部,气候类型主要是温带季风气候和少部分的高原高山气候[11]。
半湿润地区具有明显的降雨特征,年降水量在400 ~ 800 mm,降雨主要集中在夏季,易造成短时间内的城市洪涝灾害,而在其他时间降雨量较少,水资源紧缺。因此,径流的收集与植物灌溉利用的需要存在时间差异,海绵绿地收集利用的可能性与效率相对较低[11]。
“渗、滞、蓄、净、用、排”是海绵城市背景下绿地建设策略的多种手段,在降雨量一定的前提下不同技术手段需由设计师进行选择,收集的径流量增加,渗透的径流量就会相应地减少,因此应根据绿地的立地条件来选择绿地建设的技术手段,将问题聚焦,将目标明确,针对半湿润地区场地的问题采用“渗、滞、蓄、净、用、排”中某一主导功能作为主要技术手段,场地内LID体系的功能将更加符合绿地自身需求[12-14]。
1.2 研究区域
迁安市位于河北省唐山市东北部,属于典型的半湿润地区气候,年平均气温10.5 ℃,年平均降雨量672.4 mm,雨季集中在夏季[15]。研究区域位于迁安市中心城区,总面积为371.870 hm2,其中东侧场地及外源场地面积为155.37 hm2,西侧场地面积216.505 hm2。按照迁安市相关部门要求,设计场地选取惠民大街与惠昌大街间的带状空间,面积为26.745 hm2,汇水区域位于滨湖东路东侧,面积为155.37 hm2,灌溉区域为东西侧场地范围内的公园绿地,面积为155.410 hm2(图1)。根据地勘显示滨湖东路绿地下层的土壤表层是层厚约为0.5 m的素填土;第2层是层厚约为0.6 m的中砂;第3层是层厚约为0.7 m的稍密卵石;第4层为密实卵石。表层耕土呈现松散状态,下层土壤渗透性能较好[13]。
2. 数据与方法
2.1 数据说明
本文研究区域为迁安市滨湖东路绿地,研究数据包括迁安市2014—2021年逐日降雨量数据和逐日温度数据(来源于中国地面国际交换站气候资料日值数据集)、2022—2024年逐日降雨量数据和逐日温度数据(通过cmip6预测得出)。城市雨洪管理LID技术的各项建造设计参数和成本数据主要参考文献包括住建部印发的《海绵城市建设技术指南——低影响开发雨水系统构建(试行)》[16]、《室外排水设计标准》[17]、《迁安市海绵城市专项规划(2015—2030)(修编稿)》[18]、《迁安市城市排水(雨水)防涝综合规划说明书》[19]、《迁安市中心城区雨水工程规划图》[20]、《国家建筑标准设计图集10SS705:雨水综合利用》[21]和《国家建筑标准设计图集05S804:矩形钢筋混凝土蓄水池》[22]。
2.2 研究方法
本文运用的主要研究方法包括控制变量法、容积法、对比分析法、统计分析法和文献查阅法。首先利用气象资料及相关文献资料分析研究区域的降雨类型及特征,然后依据城市雨洪管理LID技术相关规范及指南文件,确定设计情景下的不同雨水调蓄池数量1 ~ 27个共27种方案(根据研究区域径流调蓄容积和单个雨水调蓄池容积确定方案);结合逐日降雨数据与逐日温度,计算园林植物灌溉净需水量、研究区域内园林植物总灌溉需水量;结合逐日降雨数据和径流系数,计算研究区域内雨水径流量,再根据设置的不同方案(不同数量的雨水调蓄池)得出雨水调蓄池收集量;最后计算研究区域内自来水灌溉成本和利用收集的雨水径流与自来水共同灌溉成本,得出后者相对于前者的节约成本。统计2014—2024年的计算结果,确定最佳方案。
2.2.1 调蓄容积计算
滨湖东路绿地设计以满足绿地基本功能为前提,以消纳内、外部雨水径流为目的,场地内部设置的“蓄用系统”是以利用为主要功能的低影响开发雨水系统[13,23-24]。
雨水径流控制量是雨洪管理视角下的滨水绿地空间布局的重要依据,根据国家和地方的海绵城市建设相关文件确定其径流控制率、设计降雨量,以此确定绿地的径流调蓄容积,为低影响开发体系预留相应的“海绵空间”[16]。低影响开发设施计算采用容积法[16]:
V=10HφF 式中:V为设计调蓄容积(m3),H为设计降雨量(mm),φ为综合雨量径流系数,F为汇水面积(hm2)。
设计中采用的综合径流计算公式[24]:
φ=(∑Sψ)/S 式中:S为面积,ψ为雨量径流系数。
根据《海绵城市建设技术指南》中提供的各汇水面雨量径流系数φ的取值范围,绿地取值为0.15、非铺砌的土路面取值为0.30、混凝土或沥青路面及广场取值为0.80[16]。
根据《迁安市海绵城市专项规划(2015—2030)(修编稿)》[18]滨湖东路绿地年径流总量控制率,场地外部为85%(设计降雨量为42.6 mm)、场地内部为76%(设计降雨量为29.6 mm)。根据《迁安市城市排水(雨水)防涝综合规划说明书》[19]和迁安市中心城区雨水工程规划图[20],东侧内、外部汇水面积共计155.37 hm2,计算得到东侧场地低影响开发雨水系统调蓄容积为40 361.71 m3(表1)。其中:内部径流量为1 185.48 m3,外部径流量为39 176.23 m3。外部径流均由管网流入场地内,且外部径流高程较低、流速较快。如果由绿地承接外部径流容易导致绿地遭受冲刷,也不利于地表景观的营造,因此由雨水收集设施直接收纳径流。
表 1 滨湖东路东侧绿地雨水径流控制量Table 1. Amount of rainwater runoff control on the east side of Binhu East Road设计降雨量
Design rainfall/mm汇水区域名称
Name of catchment area汇水面积/hm2
Catchment area/ha综合雨量径流系数Comprehensive rainfall
runoff coefficient设计调蓄容积
Design storage capacity/m3总计
Total/m342.6 外部汇水面(汇流入东侧场地)External catchment surface (flow into the east site) 地块1 Plot 1 15.30 0.15 ~ 0.80 4 330.93 40 361.71 地块2 Plot 2 60.42 0.15 ~ 0.80 18 118.41 地块3 Plot 3 35.10 0.15 ~ 0.80 10 660.65 滨湖东路
Binhu East Road10.00 0.80 3 408.00 阜安大街
Fu’an Street3.40 0.80 1 158.72 惠兴大街
Huixing Street4.40 0.80 1499.52 29.6 内部汇水面
Internal catchment surface滨湖东路绿地(东侧)
Binhu East Road greenland (east side)26.75 0.15 1 185.48 2.2.2 植物灌溉需水量计算
园林植物灌溉需水量是指为了满足植物净需水量和为抵消水量分布不均匀而施加于园林植物的水量。园林植物需水量通常通过园林系数法进行计算,公式 [25]为:
PWR=ET0×KL 式中:PWR为园林植物需水量(mm/d),ET0为参考作物腾发量(mm/d),KL为园林系数。
参考作物腾发量(ET0)通常通过区域常规观测气象数据作为依据(月降雨量/日数),在气象数据资料缺失的情况下也可利用平均气温对参考作物腾发量进行预测。
ET0=0.187t+2.6757 式中:t为月平均温度(℃)。
园林系数(KL)计算公式为:
KL=KsKdKmc 式中:Ks为园林植物种类因子;Kd为园林植物密度因子;Kmc为园林小气候因子。
将不同类型植物的各因子值(表2)带入园林系数计算公式中,可以得到各园林植物的园林系数(表3)。
表 2 各类园林植物系数相关指标Table 2. Indexes related to the coefficients of various garden plants植被类型
Vegetation type种类因子
Type factor(Ks)密度因子
Density factor(Kd)小气候因子Microclimate factor(Kmc) 长势好
Good growth长势一般
Average growth长势差
Bad growth长势好
Good growth长势一般
Average growth长势差
Bad growth长势好
Good growth长势一般
Average growth长势差
Bad growth乔木 Tree 0.90 0.50 0.20 1.30 1.00 0.50 1.40 1.00 0.50 灌木 Shrub 0.70 0.50 0.20 1.10 1.00 0.50 1.30 1.00 0.50 地被植物
Ground-cover plant0.90 0.50 0.20 1.10 1.00 0.50 1.20 1.00 0.50 乔−灌−草
Tree-shrub-grass0.90 0.50 0.20 1.30 1.00 0.60 1.40 1.00 0.50 冷季型草
Cool season grass0.80 1.00 1.00 0.60 1.20 1.00 0.80 注:表2来源于参考文献[25]。Note: Tab. 2 is cited from reference [25]. 园林植物的需水量在自然条件下主要包括有效降雨量和人工灌溉补水量,因此单位面积园林植物灌溉需水量,即单位面积园林植物净需水量。其计算公式[26]如下:
PWRnet=Ki(PWR日−Re日) 式中:PWRnet为植物净需水量(m3);Ki为浇灌补偿系数,取Ki = 2.7[26];PWR日为植物日需水量(m3);Re日为日有效降雨量(mm/d)。
有效降雨量指的是植物在灌溉季节内实际上能够利用的降雨量。日有效降雨量计算表达式:
Re日=Rh日×RF日 式中:Rh日为历史降雨量(mm/d);RF日为有效雨量系数(%),通常为0.50 ~ 1.00。
由于基于长时段平均历史数据预测未来降雨的不确定性,通常在规划园林植物的用水需求时,可以认为不超过50%的历史降雨量是有效降雨,故研究范围内应取0.50作为有效降雨量系数[25]。
将滨湖东路绿地东、西侧的内、外场地范围内的公园绿地作为本次研究的灌溉区域,共155.41 hm2,根据单位面积植物灌溉净需水量计算公式可以确定灌溉区域植物灌溉总需水量。迁安市相对湿度为62%,夏季最热月(7月份)气温为25.2 ℃;参考作物腾发量(ET0)最大范围为5.08 ~ 6.35 mm/d。由于缺少气象数据,通过月平均气温可以预测参考作物腾发量(ET0),同时根据不同园林植物类型确定园林系数(KL)(表3),由此可确定灌溉区域2014—2024年间每周的园林植物灌溉需水量。
表 3 各园林植物的园林系数Table 3. Landscape coefficients of each garden plant植被类型
Vegetation type种类因子
Type factor (Ks)密度因子
Density factor(Kd)小气候因子Microclimate factor(Kmc) 园林系数
Garden coefficient(KL)乔木 Tree 0.90 1.30 1.40 1.64 灌木 Shrub 0.70 1.10 1.30 1.00 地被植物
Ground-cover plant0.90 1.10 1.20 1.19 乔−灌−草
Tree-shrub-grass0.90 1.30 1.40 1.64 冷季型草
Cool season grass0.80 1.00 1.20 0.96 注:表3来源于参考文献[25]。Note: Tab. 3 is cited from reference [25]. 根据每周园林植物灌溉需水量计算可得2014年园林植物灌溉需水量为865 115.94 m3;2015年园林植物灌溉需水量为851 546.84 m3;2016年园林植物灌溉需水量为798 995.80 m3;2017年园林植物灌溉需水量为996 174.02 m3;2018年园林植物灌溉需水量为889 347.78 m3;2019年园林植物灌溉需水量为630 720.81 m3;2020年园林植物灌溉需水量为784 066.80 m3;2021年园林植物灌溉需水量为646 583.98 m3;2022年园林植物灌溉需水量为623 288.49 m3;2023年园林植物灌溉需水量为741 634.92 m3;2024年园林植物灌溉需水量为589 183.65 m3。
2.2.3 雨水调蓄池径流利用量计算
雨水调蓄池是一种雨水收集设施,收集的径流可用于园林植物灌溉。蓄水池设计参考国家建筑标准设计图集10SS705《雨水综合利用》 [21]和国家建筑标准设计图集05S804《矩形钢筋混凝土蓄水池》[22],采用钢筋混凝土结构,为了将园区分为等量的灌溉面积,雨水调蓄池采用统一容积和规格,容积为1500 m3,规格为25 000 mm(长) × 15 000 mm(宽) × 4 000 mm(高)。雨水调蓄池直接与雨水管网相连,超量径流可以溢流到下一个蓄水池中。因为无法确定雨水调蓄池个数变化对节约成本的影响,需设置多个方案进行比选。根据场地调蓄容积40 361.71 m3和单个雨水调蓄池容积1500 m3得出需要27个调蓄池,因此设计27个方案;依次增加调蓄池个数,最后对其结果进行统计分析,得出最优方案。
雨水调蓄池收集量与汇水区域雨水径流量相关。当汇水区域雨水径流量小于雨水调蓄池总容积时,雨水调蓄池收集量 = 汇水区域雨水径流量;当汇水区域雨水径流量大于雨水调蓄池总容积时,雨水调蓄池收集量 = 雨水调蓄池总容积。雨水径流量计算采用容积法:
V′=10H′φ′F′ 式中:V′为雨水径流量(m3);H′为降雨量(mm);F′为汇水面积(hm2);φ′为公园绿地径流系数,根据《室外排水设计标准》[17],φ′取值0.1 ~ 0.2。
雨水调蓄池径流利用量由雨水调蓄池收集量和植物灌溉需水量共同决定,当雨水调蓄池收集量大于植物灌溉需水量时,雨水调蓄池利用量 = 植物灌溉需水量;当雨水调蓄池收集量小于植物灌溉需水量时,雨水调蓄池利用量 = 雨水调蓄池收集量。
2.2.4 成本计算
收集每次降雨的径流,径流回收后经过简单的过滤,利用收集的径流进行植物灌溉,从而减少自来水灌溉,节约市政供水,减少经济支出[27]。
计算研究区域自来水灌溉成本和利用收集的雨水径流与自来水共同灌溉成本。
自来水灌溉成本的计算公式为:
T1=W1×w 式中:T1为所有都用自来水灌溉所需的成本(元);W1为园林植物灌溉量(m3);w为迁安市水费,迁安市当前水费为5.05元/m3 。
计算利用收集的雨水径流与自来水共同灌溉成本的公式为:
T2=T3+T4 式中:T2为利用收集的雨水径流与自来水共同灌溉成本(元);T3为利用收集的雨水径流灌溉成本(元);T4为总需水量−利用径流灌溉的量,即剩余部分的自来水灌溉成本(元),当收集的雨水径流小于植物灌溉需水量时,剩余部分采用自来水灌溉。
T3=(W3/Q)×N×p 式中:W3为调蓄池径流利用量(m3);Q为4G50KDFZ-B自控自吸泵流量,取10 m3/h;N为4G50KDFZ-B自控自吸泵功率,取7.5 kW;p为迁安市电费(元/(kW·h)),迁安市当前电费为0.52元/(kW·h)。
T4=W4×w 式中:T4为当收集的雨水径流小于植物灌溉需水量时剩余部分采用自来水灌溉的成本;W4为园林植物灌溉量(m3),除去收集的雨水径流灌溉部分。
根据下面公式计算节约成本:
T=T1−T2 式中:T为节约成本(元)。
2.2.5 建设及维护成本
LID设施的建设需要资金投入作为支撑,因此成本是LID建设的重要考量因素[3]。LID设施的造价参考本项目的预算清单,每个调蓄池配备4G50KDFZ-B自控自吸泵,该型号水泵参数如下:Q(流量) = 10 m3/h,N(功率) = 7.5 kW。建设成本根据迁安市滨湖东路集雨型绿地的预算清单,雨水调蓄池建设单价为388 690.7元,自吸自控泵建设单价6 750.0元。
LID设施的维护方式和次数参考《海绵城市建设技术指南》[16],雨水调蓄池内易有沉积,每年需两次清淤、检修,每次清淤约有50 mm淤泥堆积,自吸自控泵需对潜水轴检修。维护成本根据河北省预算定额中维护价格取费,每立方米清淤单价需442.0元,自吸自控泵每次检修需635.0元。研究区域内LID设施造价维护情况见表4。
表 4 LID设施及其配件造价维护表Table 4. Cost maintenance table of lid facilities and their accessories名称
Name建设单价/元
Construction unit price/CNY维护单价/(元·a−1)
Maintenance unit price/(CNY·year−1)雨水调蓄池 Rainwater storage tank 388 690.70 16 575.00 自控自吸泵 Self-control self-priming pump 6 750.00 1 270.00 3. 结论与讨论
3.1 结 论
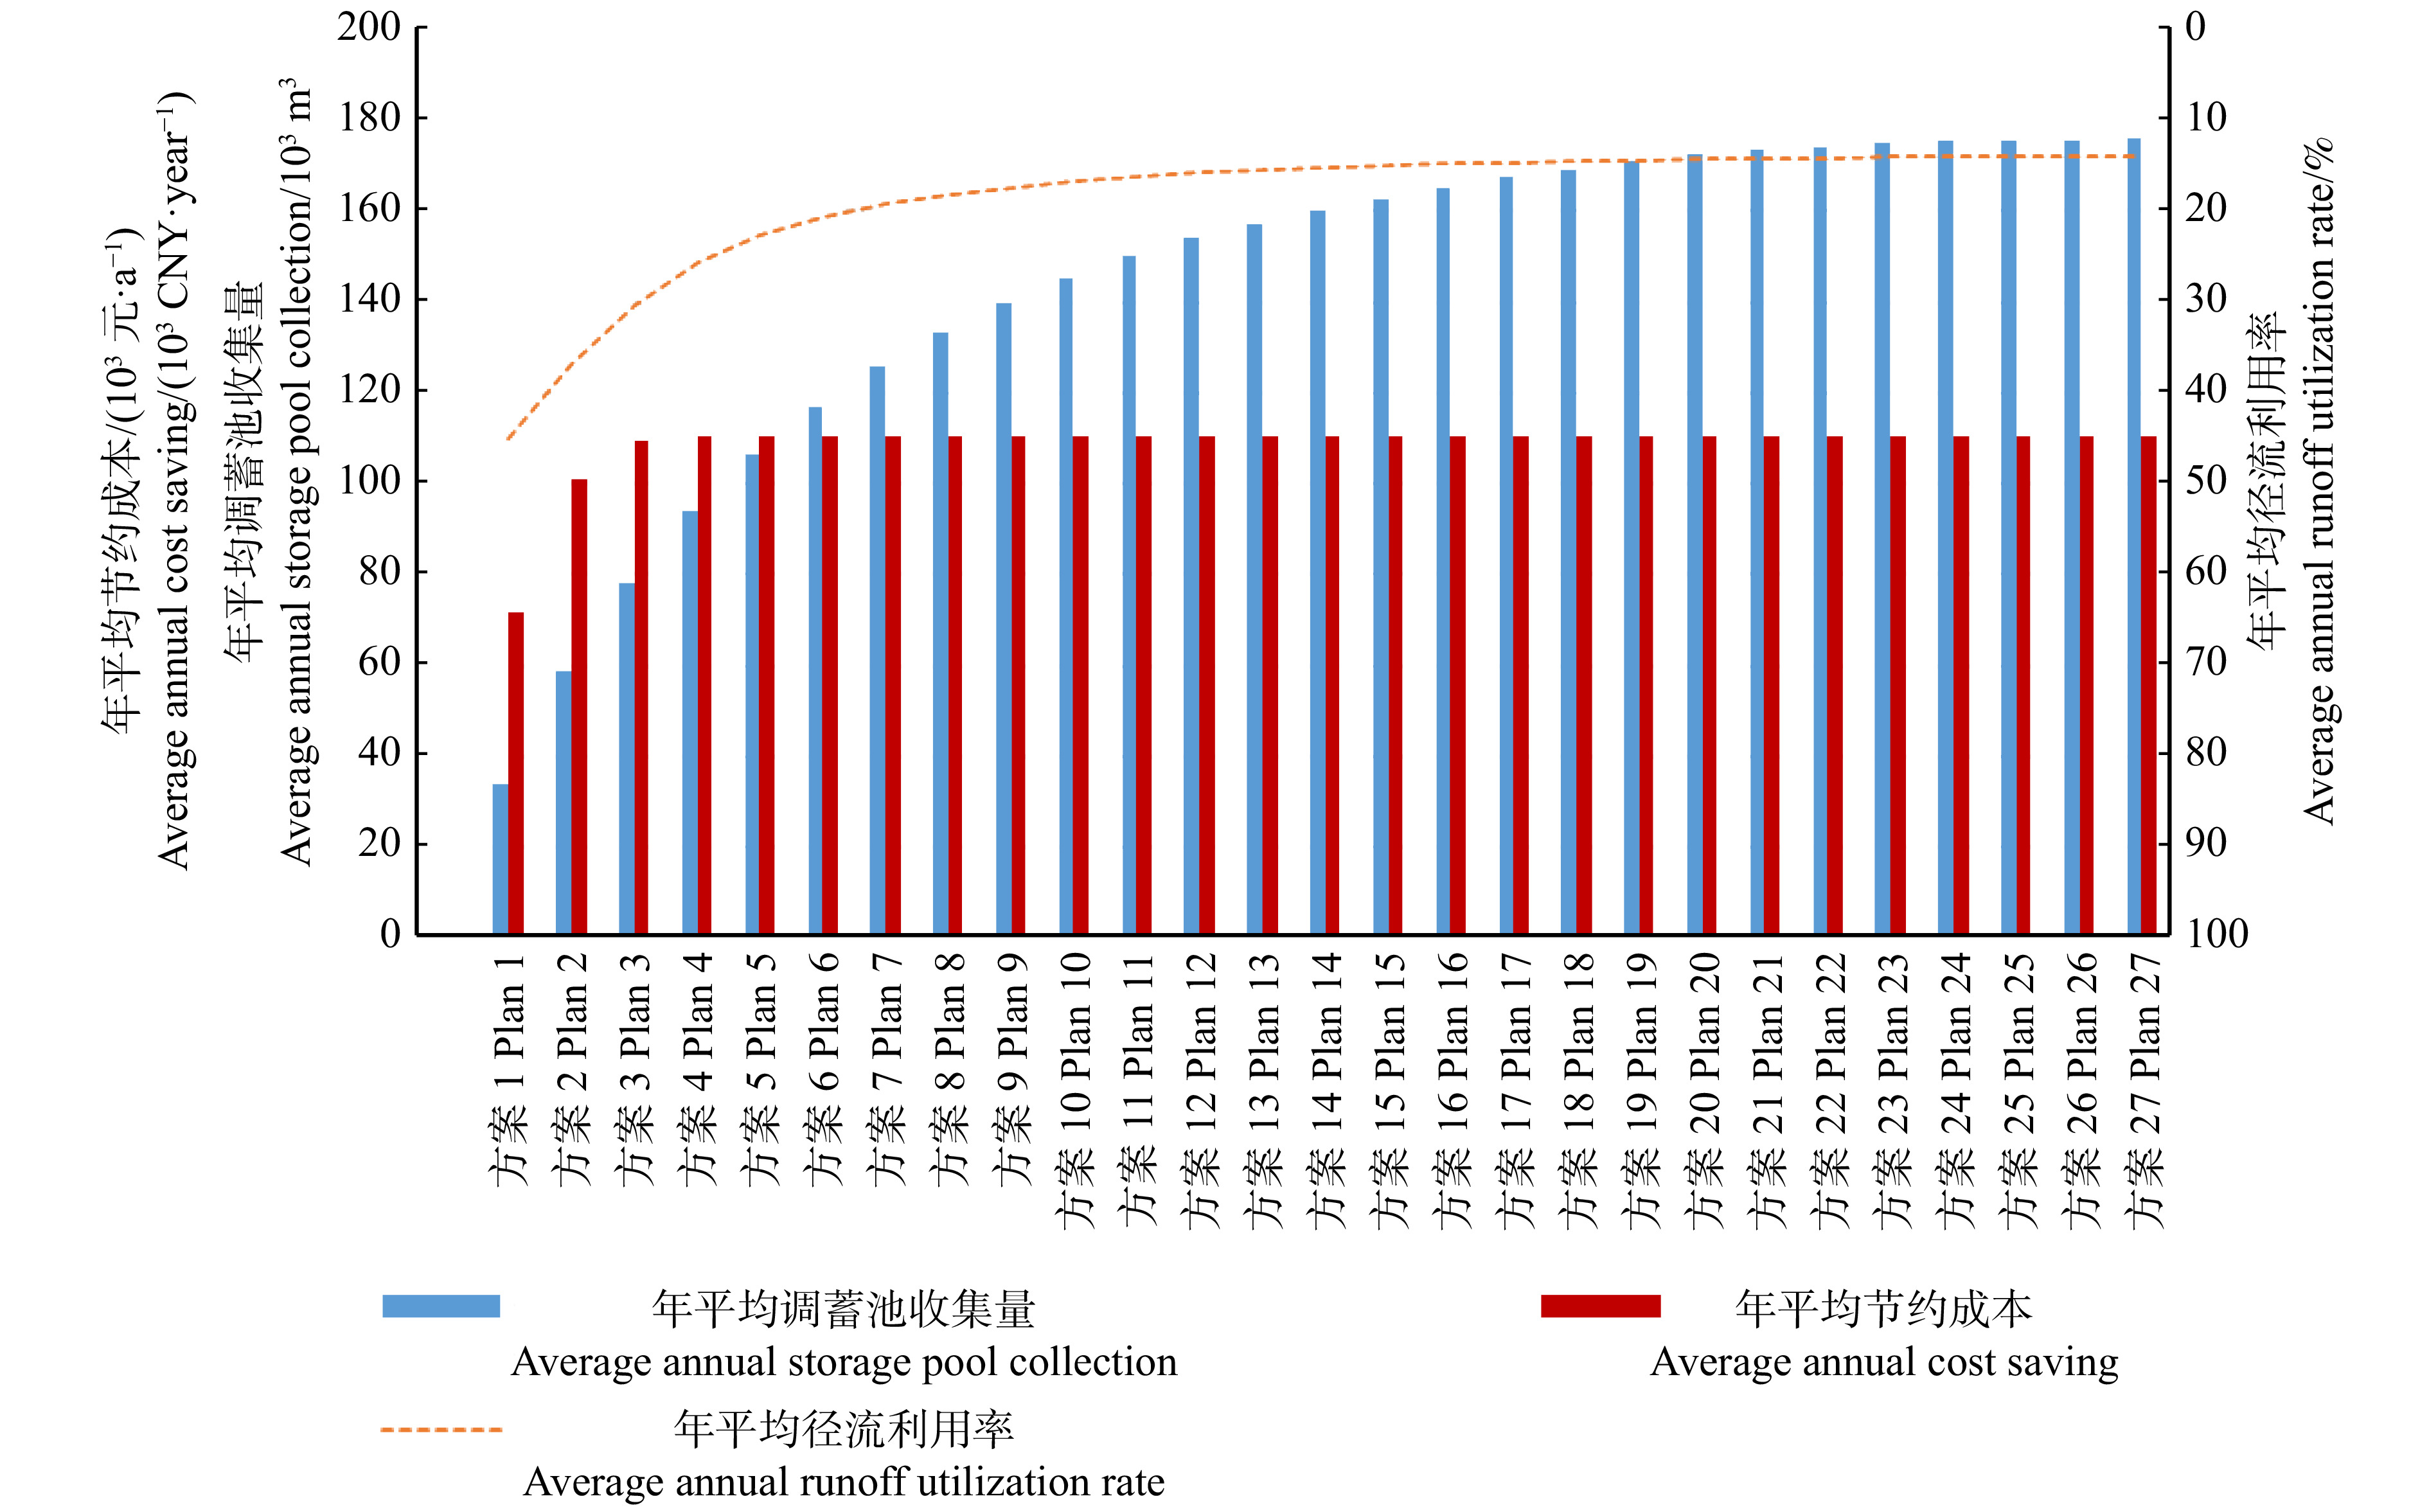
通过控制变量——雨水调蓄池的个数,从1个雨水调蓄池开始依次增加1个,直到27个雨水调蓄池;搭建模型计算2014—2024年共11年的结果,最终得出27个方案的年平均调蓄池收集量、年平均径流利用率和年平均节约成本(表5、图2)。
表 5 2014—2024年年平均调蓄池收集量与节约成本Table 5. Annual average collection volume of regulation and storage tank and cost savings from 2014 to 2024方案
Plan年平均调蓄池收集量Average annual storage pool collection/m3 年平均径流利用率
Average annual runoff utilization rate/%年平均节约成本/(元·a−1)
Average annual cost saving/(CNY·year−1)方案1 Plan 1 34 123.38 44.95 71 908.34 方案2 Plan 2 58 951.48 36.84 101 114.15 方案3 Plan 3 78 271.25 30.35 109 667.28 方案4 Plan 4 93 944.53 25.63 110 661.16 方案5 Plan 5 106 598.61 22.66 110 661.16 方案6 Plan 6 116 944.00 20.69 110 661.16 方案7 Plan 7 125 803.95 19.24 110 661.16 方案8 Plan 8 133 404.79 18.14 110 661.16 方案9 Plan 9 139 876.88 17.31 110 661.16 方案10 Plan 10 145 352.78 16.66 110 661.16 方案11 Plan 11 150 115.53 16.14 110 661.16 方案12 Plan 12 154 119.79 15.72 110 661.16 方案13 Plan 13 157 221.16 15.42 110 661.16 方案14 Plan 14 160 084.80 15.18 110 661.16 方案15 Plan 15 162 763.84 14.96 110 661.16 方案16 Plan 16 165 218.39 14.76 110 661.16 方案17 Plan 17 167 532.34 14.58 110 661.16 方案18 Plan 18 169 215.16 14.47 110 661.16 方案19 Plan 19 170 851.52 14.35 110 661.16 方案20 Plan 20 172 450.50 14.25 110 661.16 方案21 Plan 21 173 464.57 14.17 110 661.16 方案22 Plan 22 174 277.92 14.12 110 661.16 方案23 Plan 23 174 893.48 14.07 110 661.16 方案24 Plan 24 175 358.54 14.04 110 661.16 方案25 Plan 25 175 629.89 14.02 110 661.16 方案26 Plan 26 175 766.26 14.01 110 661.16 方案27 Plan 27 175 902.62 14.00 110 661.16 ![]() 图 2 2014—2024年年平均调蓄池收集量与节约成本Figure 2. Annual average collection volume of regulation and storage tank and cost savings from 2014 to 2024
图 2 2014—2024年年平均调蓄池收集量与节约成本Figure 2. Annual average collection volume of regulation and storage tank and cost savings from 2014 to 2024年平均调蓄池收集量随调蓄池个数的增加而增大,最大年平均调蓄池收集量为方案27(175 902.62 m2)。年平均径流利用率随调蓄池个数的增加而降低,最大年平均径流利用率为方案1(44.95%),见图2。方案1(设计1个雨水调蓄池)的年平均径流灌溉节约成本为71 908.34元;方案2(设计2个雨水调蓄池)的年平均节约成本为101 114.15元;方案3(设计3个雨水调蓄池)的年平均节约成本为109 667.28元;方案4(设计4个雨水调蓄池)的年平均节约成本为110 661.16元;方案5(设计5个雨水调蓄池)至方案27(设计27个雨水调蓄池)的年平均节约成本不再增加,皆为110 661.16元。
由计算结果可知,从方案4开始,随着雨水调蓄池的增加年平均节约成本不再变化,取方案1到方案4计算建设成本、维护成本和节约成本之间的关系。
假设第N年,建设成本(C1) + 维护成本(C2) = 节约成本(C3),根据公式C1 + C2 × N = C3 × N,计算得出结果。方案1:约第7.4年时,建设成本(C1) + 维护成本(C2) = 节约成本(C3),从第8年开始效益为54 063.34元/年。方案2:约第12.1年时,建设成本(C1) + 维护成本(C2) = 节约成本(C3),从第13年开始效益为65 424.15元/年。方案3:约第21.2年时,建设成本(C1) + 维护成本(C2) = 节约成本(C3),从第22年开始效益为56 132.28元/年。方案4:约第40.3年时,建设成本(C1) + 维护成本(C2) = 节约成本(C3),从第41年开始效益为39 281.16元/年。从最快获得效益出发,建议选择方案1。从长期效益出发,建议选择年效益更多的方案2。
3.2 讨 论
半湿润地区的降雨具有极强的季节性,其径流收集与植物灌溉需水无法做到完全匹配。如果将绿地定位为收集径流并利用径流进行植物灌溉,本文建议按照植物的单周最大灌溉需水量作为雨水收集池的总容量,在满足灌溉需求的条件下减少建设资金的投入,提高雨水收集设施的利用率。
由于研究条件所限,本文未能获取到现场径流的实测数据,数据的精确度未经过比对核算;径流储存设施的成本会根据材料选择的不同产生很大差异,本文仅根据施工预算清单中的造价进行成本测算,未能针对不同材料的造价进行比对。本次研究效益计算中未考虑通货膨胀等经济因素的影响,实际节约灌溉费用与雨水收集利用建设费用持平的时间可能比研究结果更长。海绵城市的建设要求为城市绿地增添了新的功能,也带来了一些问题与困惑,关于在半湿润地区回收雨水径流用于植物灌溉的可能性,从经济方面的考量可以提供一个新的思路,帮助设计师和决策者更加理性地面对雨水径流的处理问题,从有益于绿地的角度推动海绵城市建设健康发展。
-
![]()
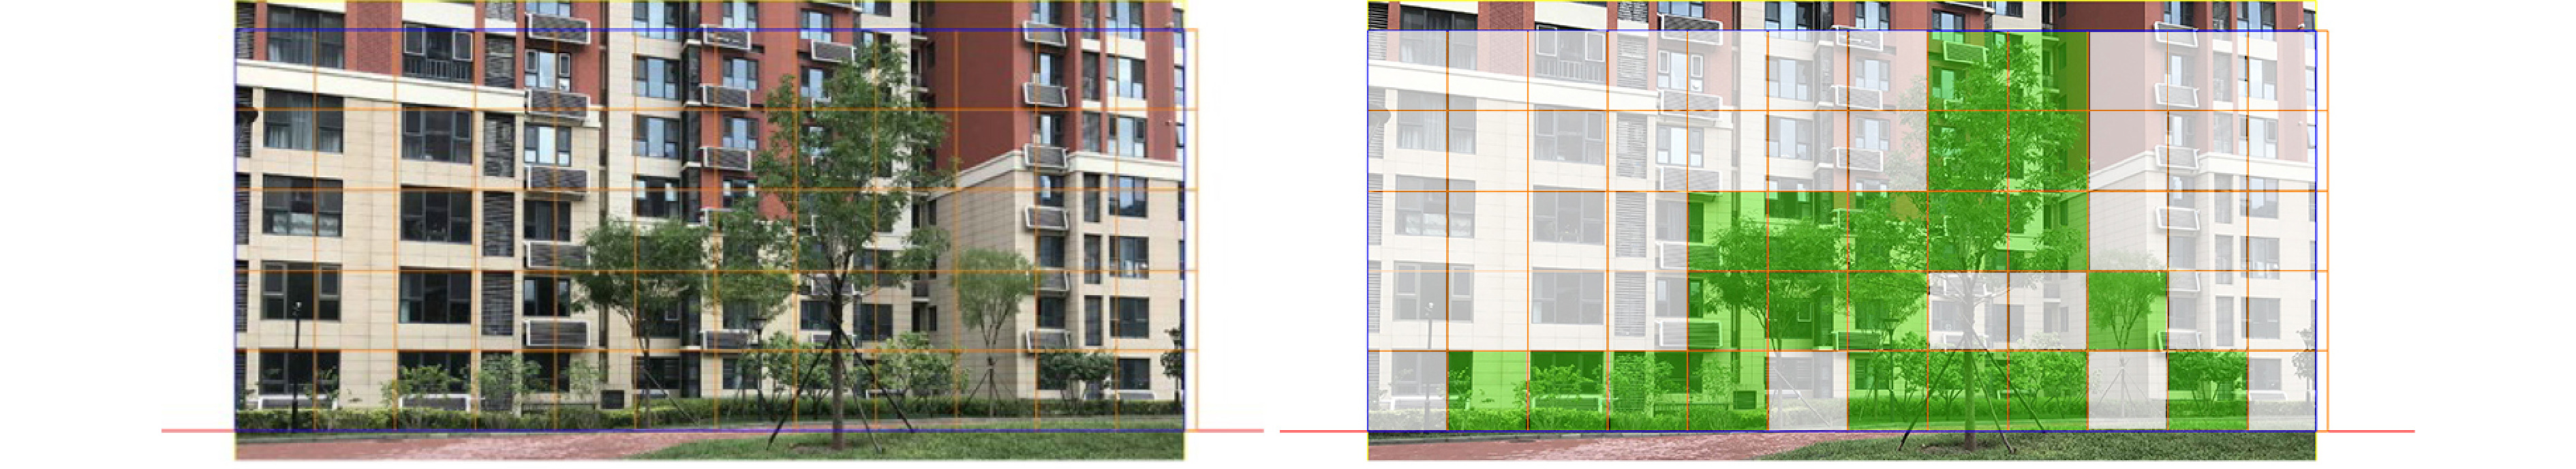
图 1 建筑正前方遮蔽度计算示意图
Figure 1. Schematic illustration of shelter degree calculation in front of building
![]()
图 2 景观视觉效果分析示意图
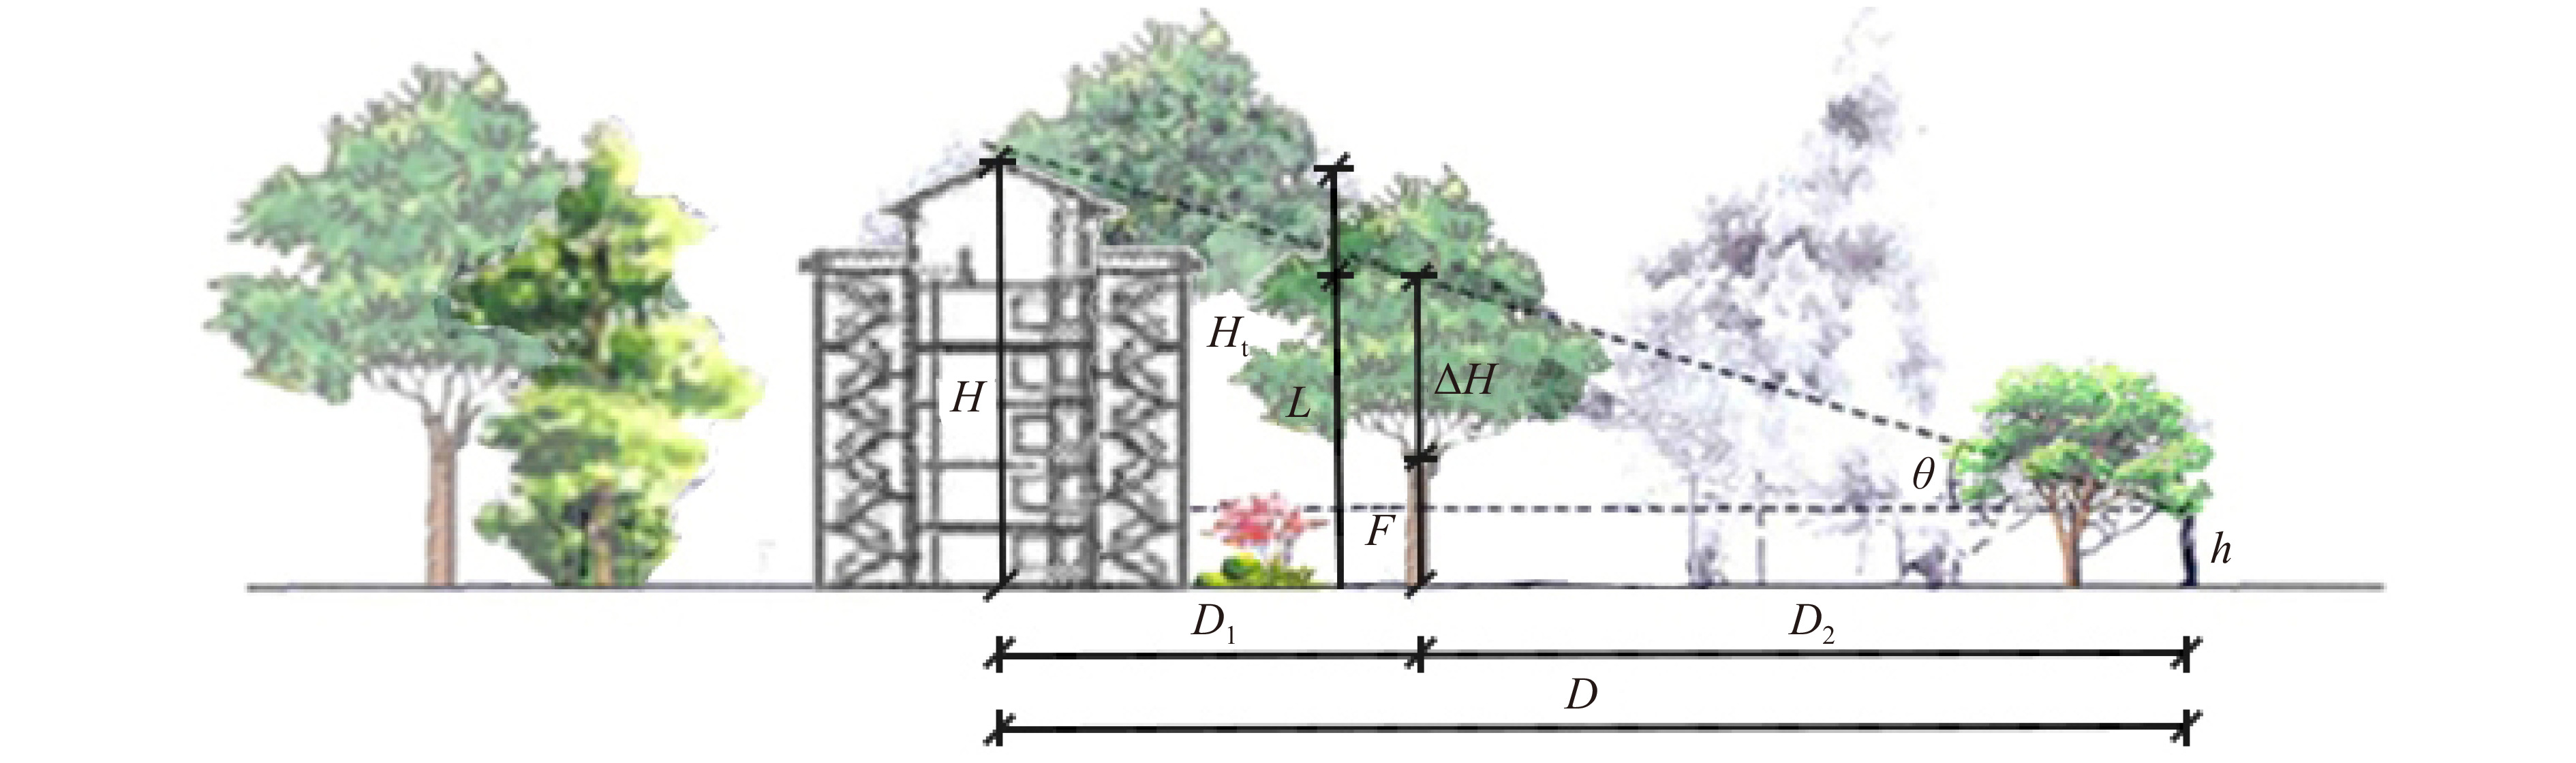
h. 人视点高度;θ. 垂直仰角;ΔH. 视域范围内乔木对建筑起到遮挡作用的树冠高度;F. 某种乔木分支点高度;L. 视域内看到树的高度范围;Ht. 该树树高;D2. 植物与观赏点之间的距离,即视距(D)和建筑与植物的测量间距值(D1)的差值;H. 住宅建筑的高度。此示意图改自张子维[36]。h, human point of view height; θ, vertical elevation angle; ΔH, the canopy height where the tree blocks the building; F, some sort of tree branch point height; L, the height range of the tree within the view; Ht, the height of the tree; D2, the distance between the plant and the ornamental point, namely the visual distance (D) and the difference between the measured distance between the building and the plant (D1); H, the height of the residential building. This diagram was modified from Zhang Ziwei[36].
Figure 2. Analysis diagram of landscape visual effects
![]()
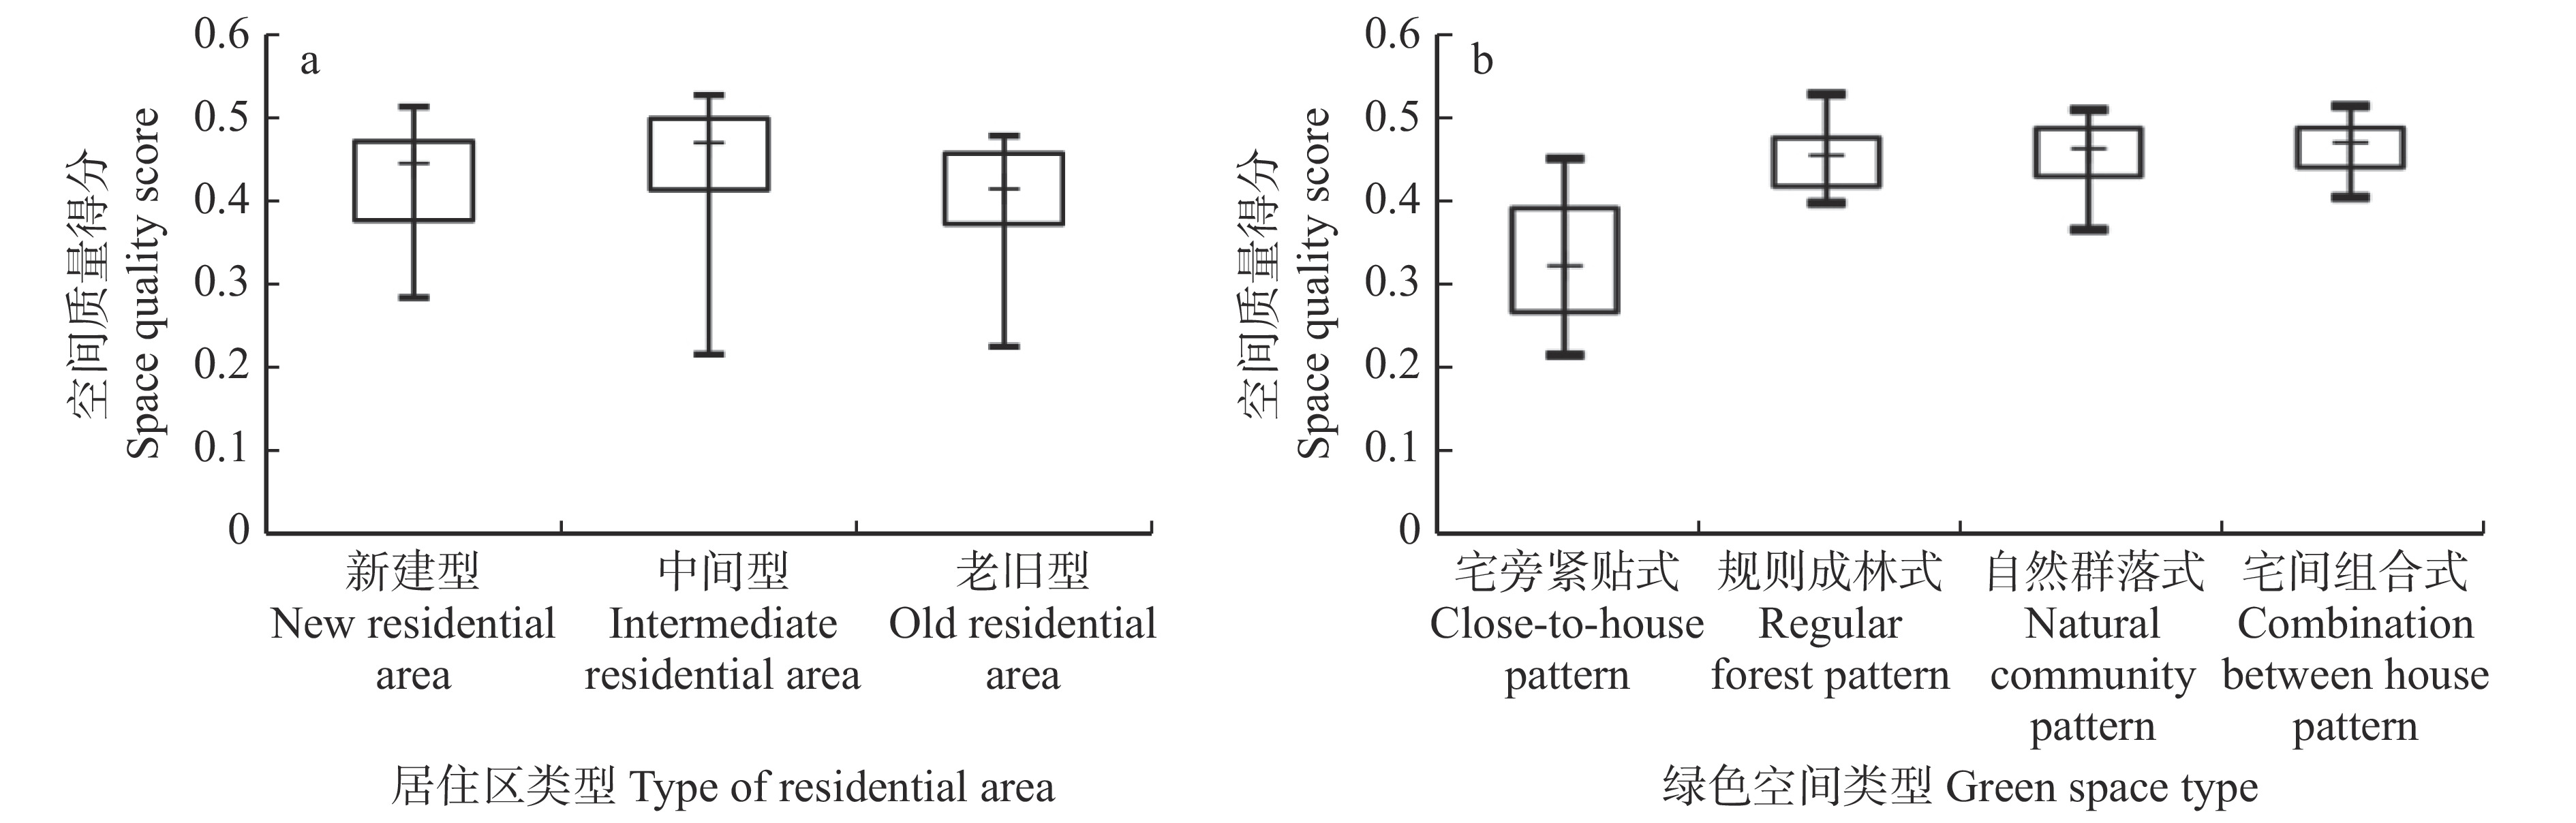
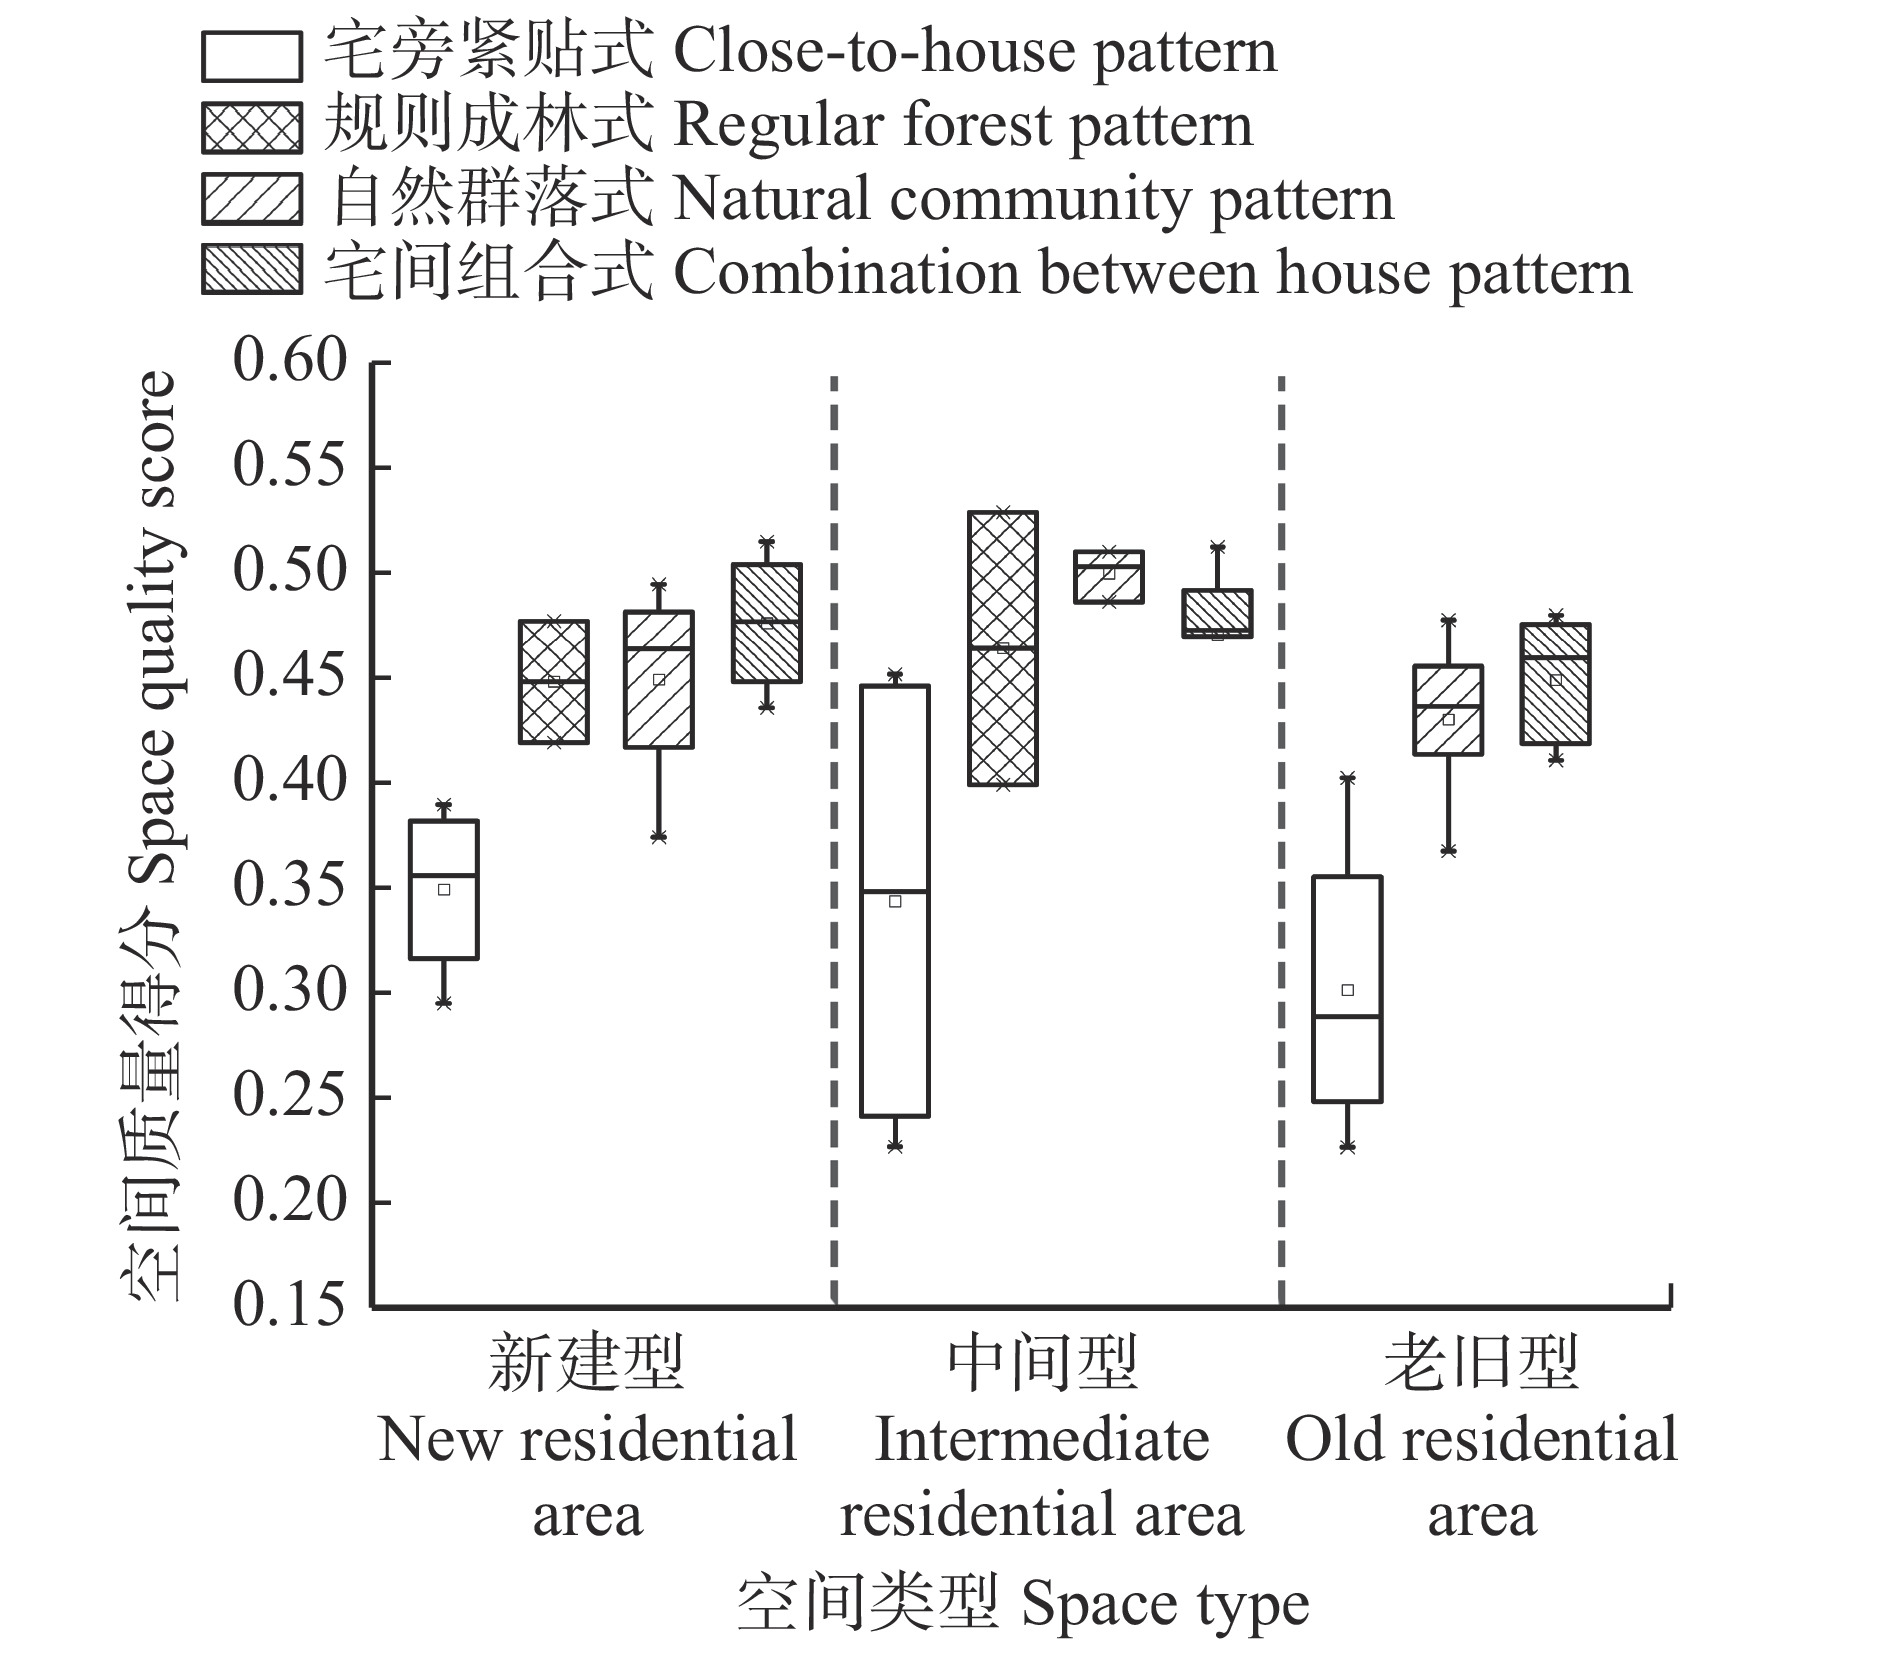
图 3 居住区类型、绿色空间类型间的质量得分比较
Figure 3. Comparison of quality scores among different types of residential area and different types of green space
![]()
图 4 3类居住区不同绿色空间类型质量比较
Figure 4. Quality comparison of different green space types in three types of residential areas
![]()
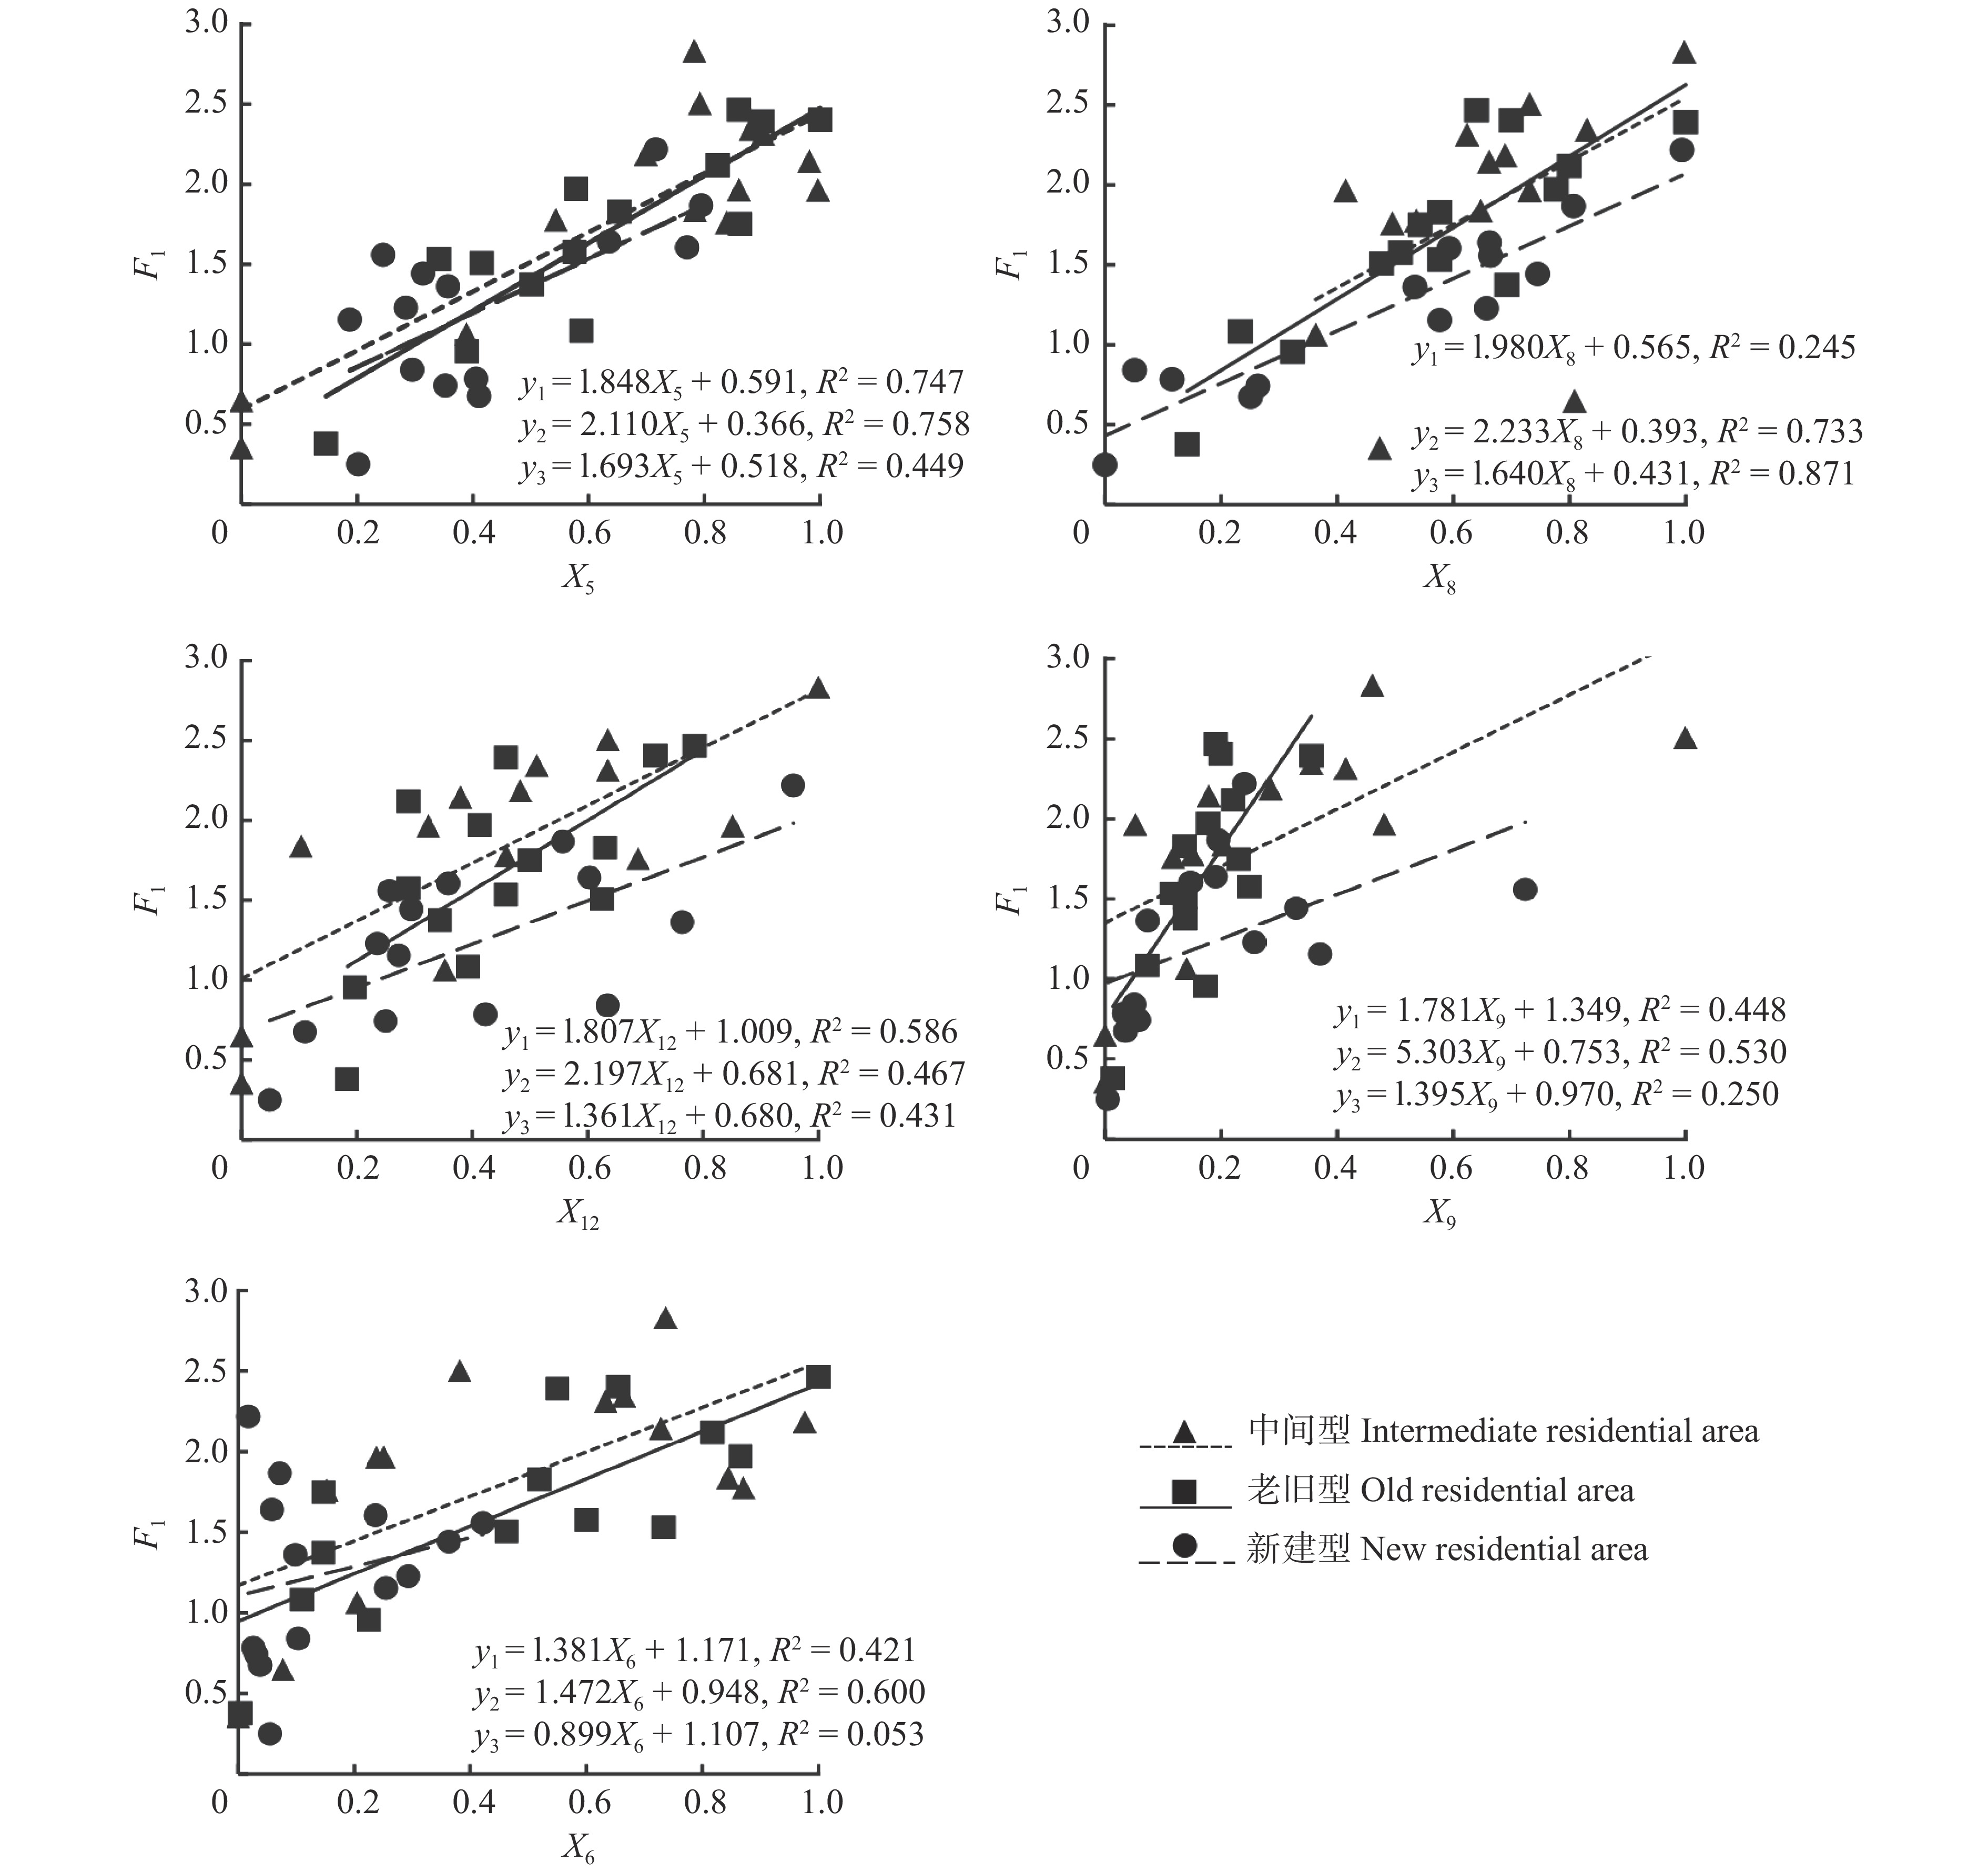
图 5 不同建成年代居住区F1值随结构指标的变化趋势
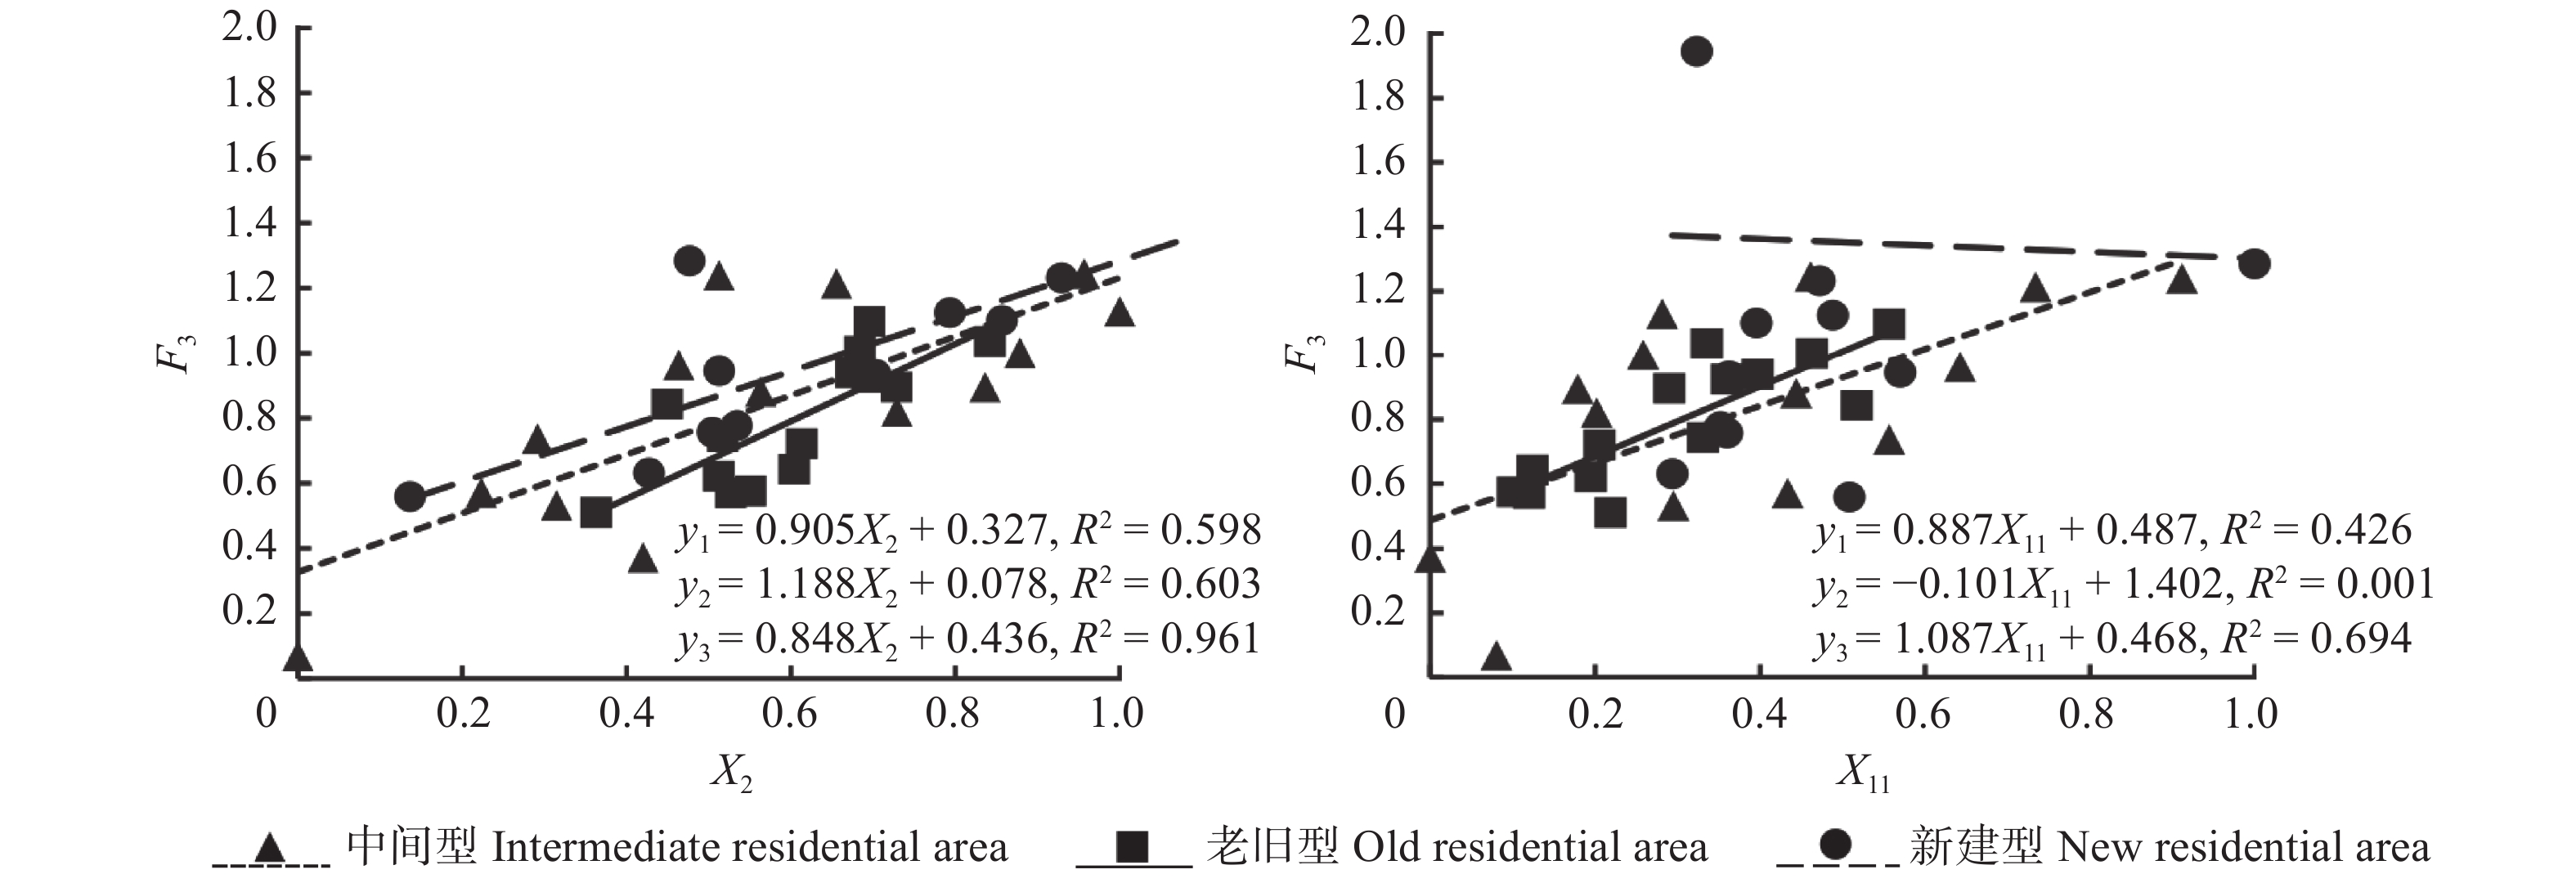
y1为中间型居住区拟合方程,y2为老旧型居住区拟合方程,y3为新建型居住区拟合方程,F1为绿色空间结构指数。下同。y1 is fitting equation of intermediate-type residential area, y2 is fitting equation of old-type residential area, y3 is fitting equation of new-type residential area. F1 is green spatial structure index. The same below.
Figure 5. Changing trend of F1 value of residential areas in different construction times along with structural indexes
![]()
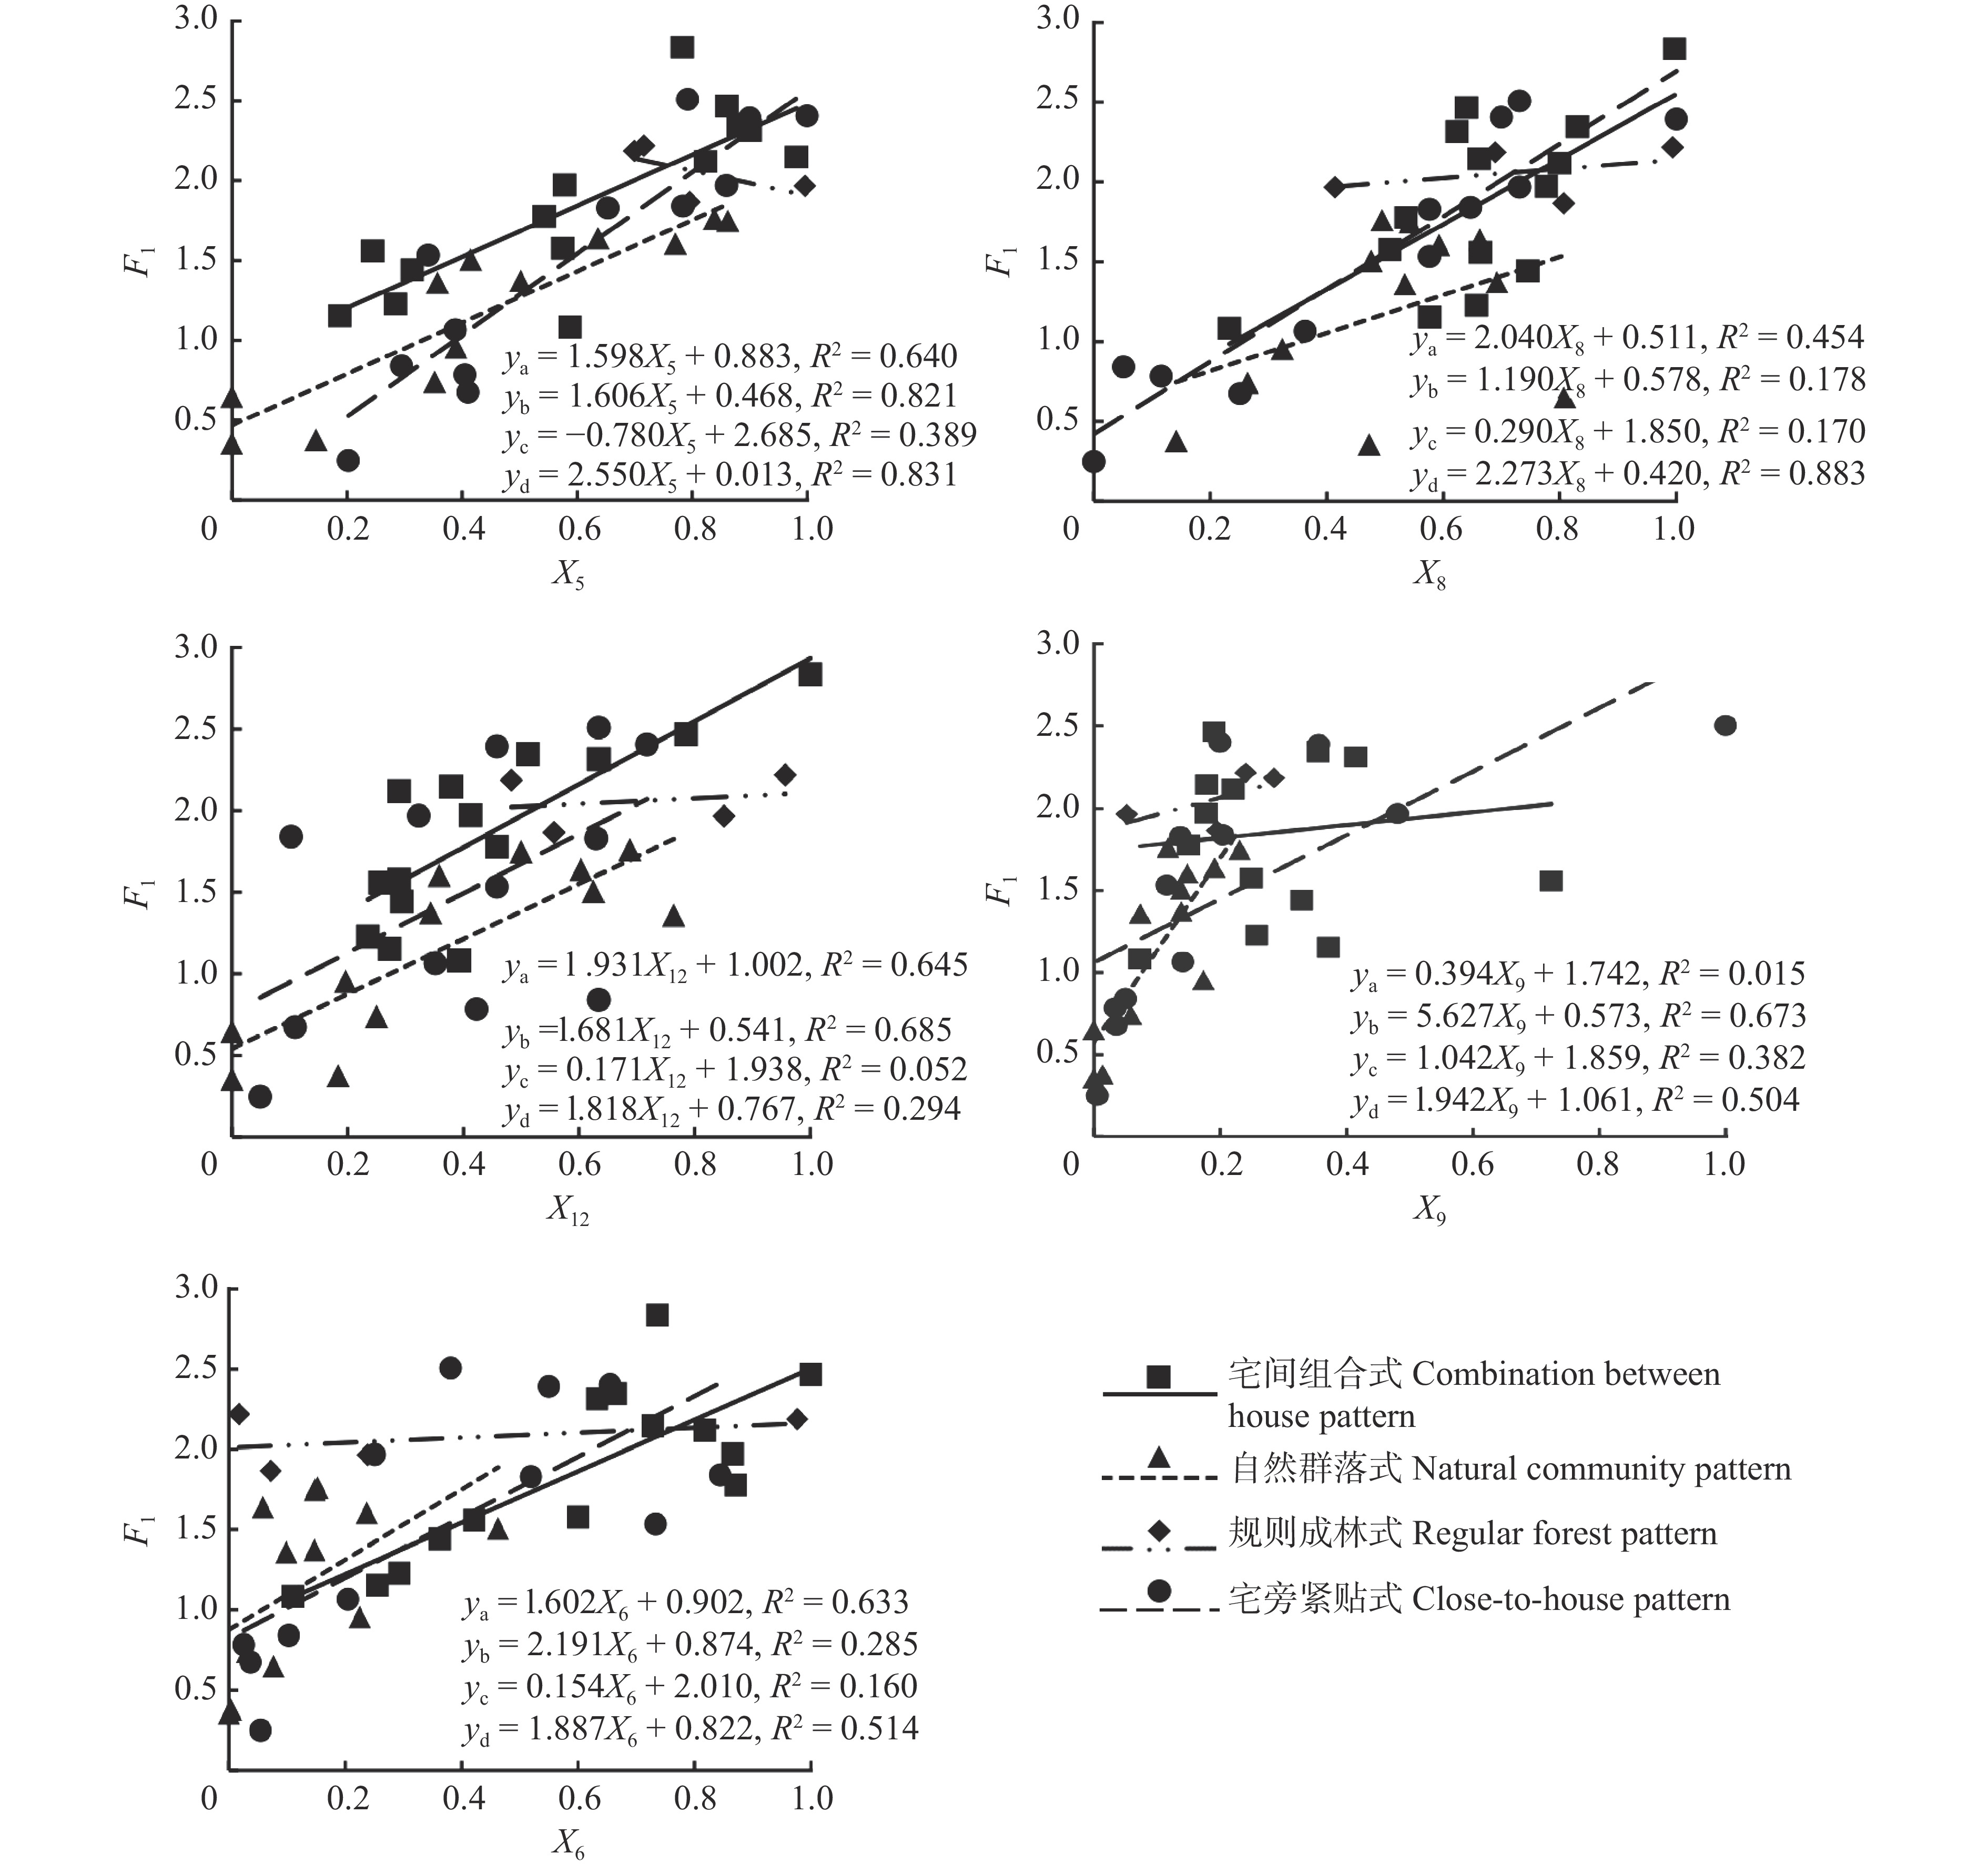
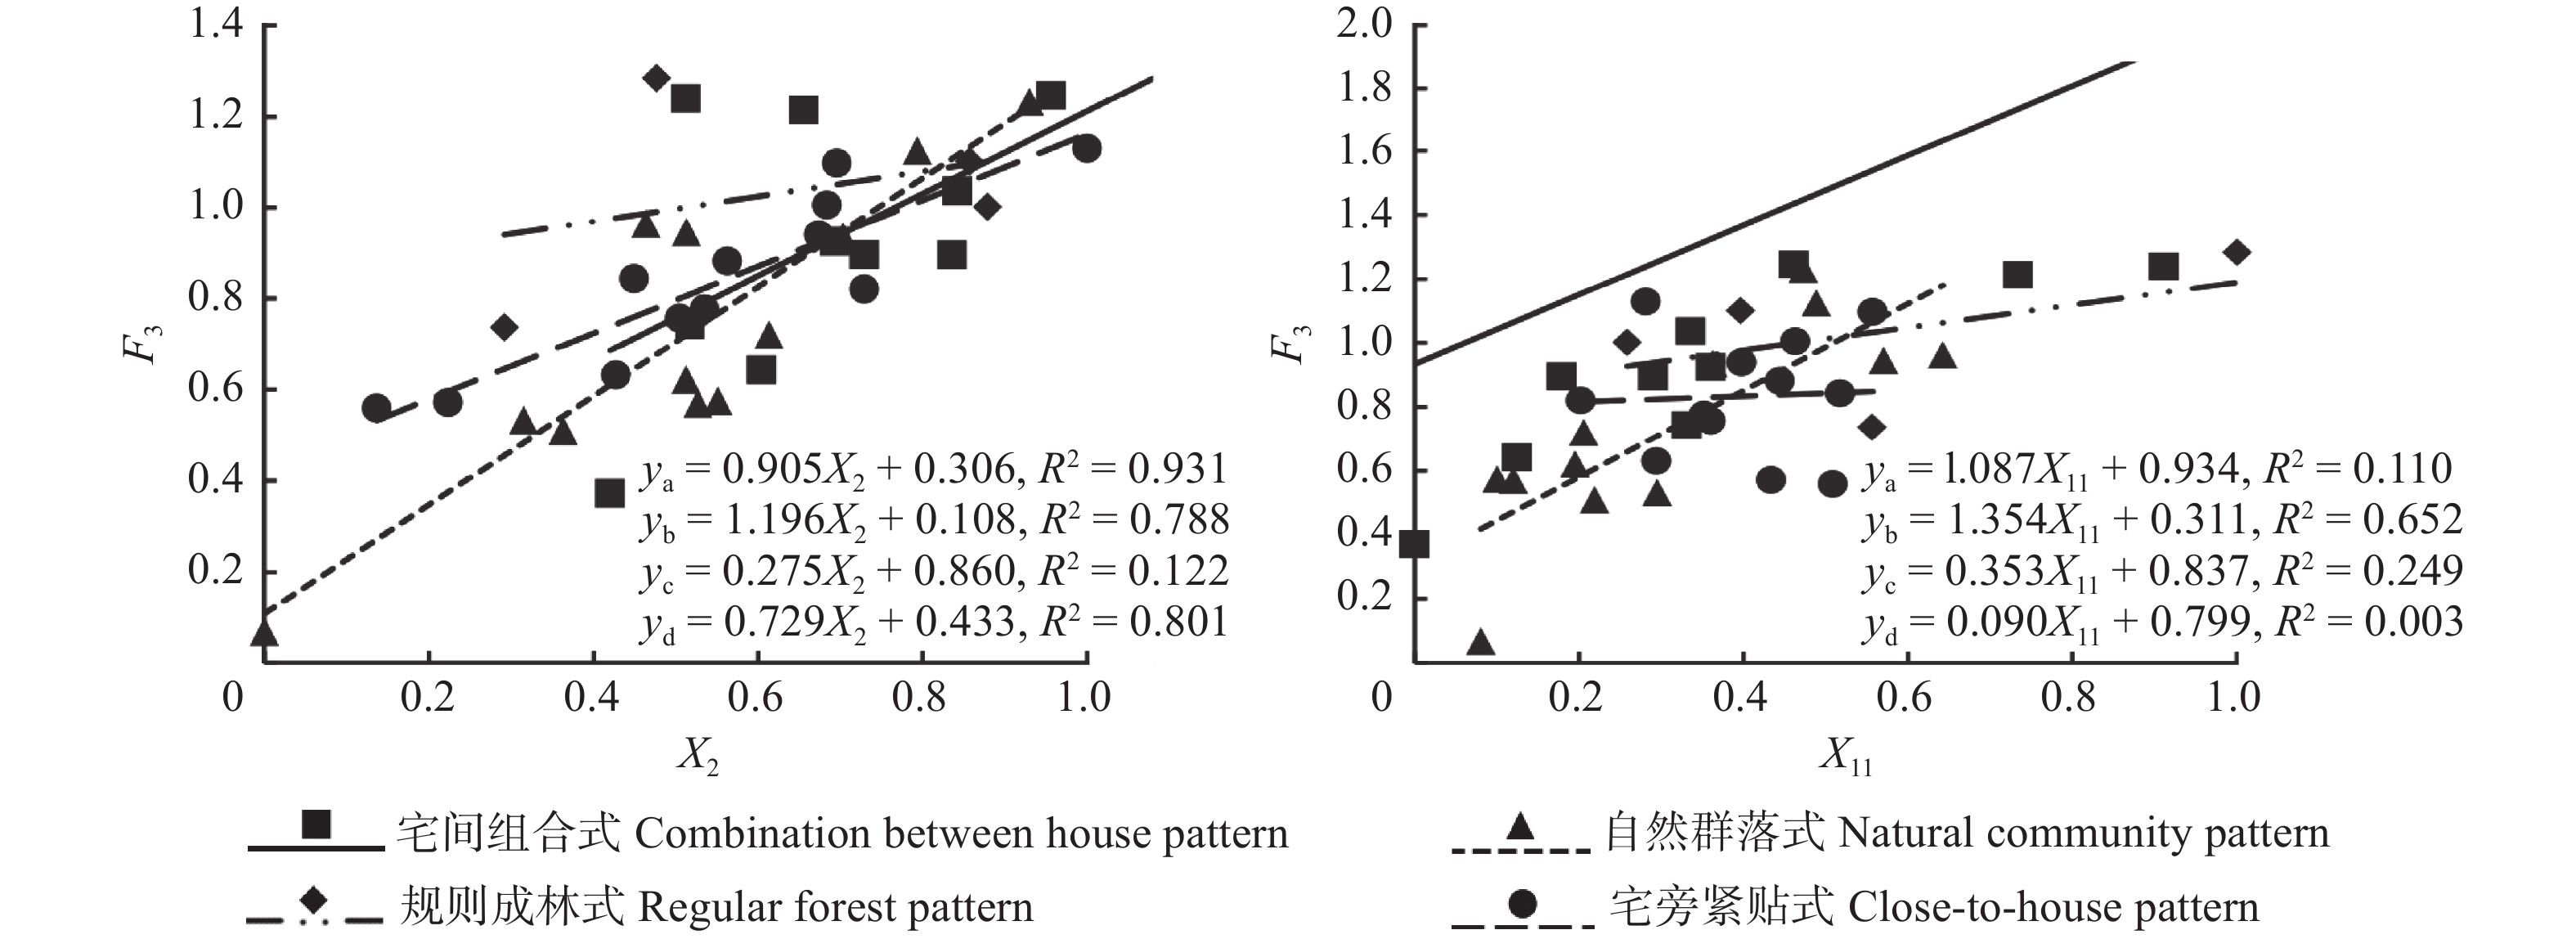
图 6 不同绿色空间类型的F1值随结构指标值的变化趋势
ya为宅间组合式拟合方程,yb为自然群落式拟合方程,yc为规则成林式拟合方程,yd为宅旁紧贴式拟合方程。下同。ya is fitting equation between-house combinatorial pattern, yb is fitting equation of natural community-pattern, yc is fitting equation of regular-forming forest-pattern, yd is fitting equation of close-to-house pattern. The same below.
Figure 6. Changing trends of F1 values for different green space types with structural index values
![]()
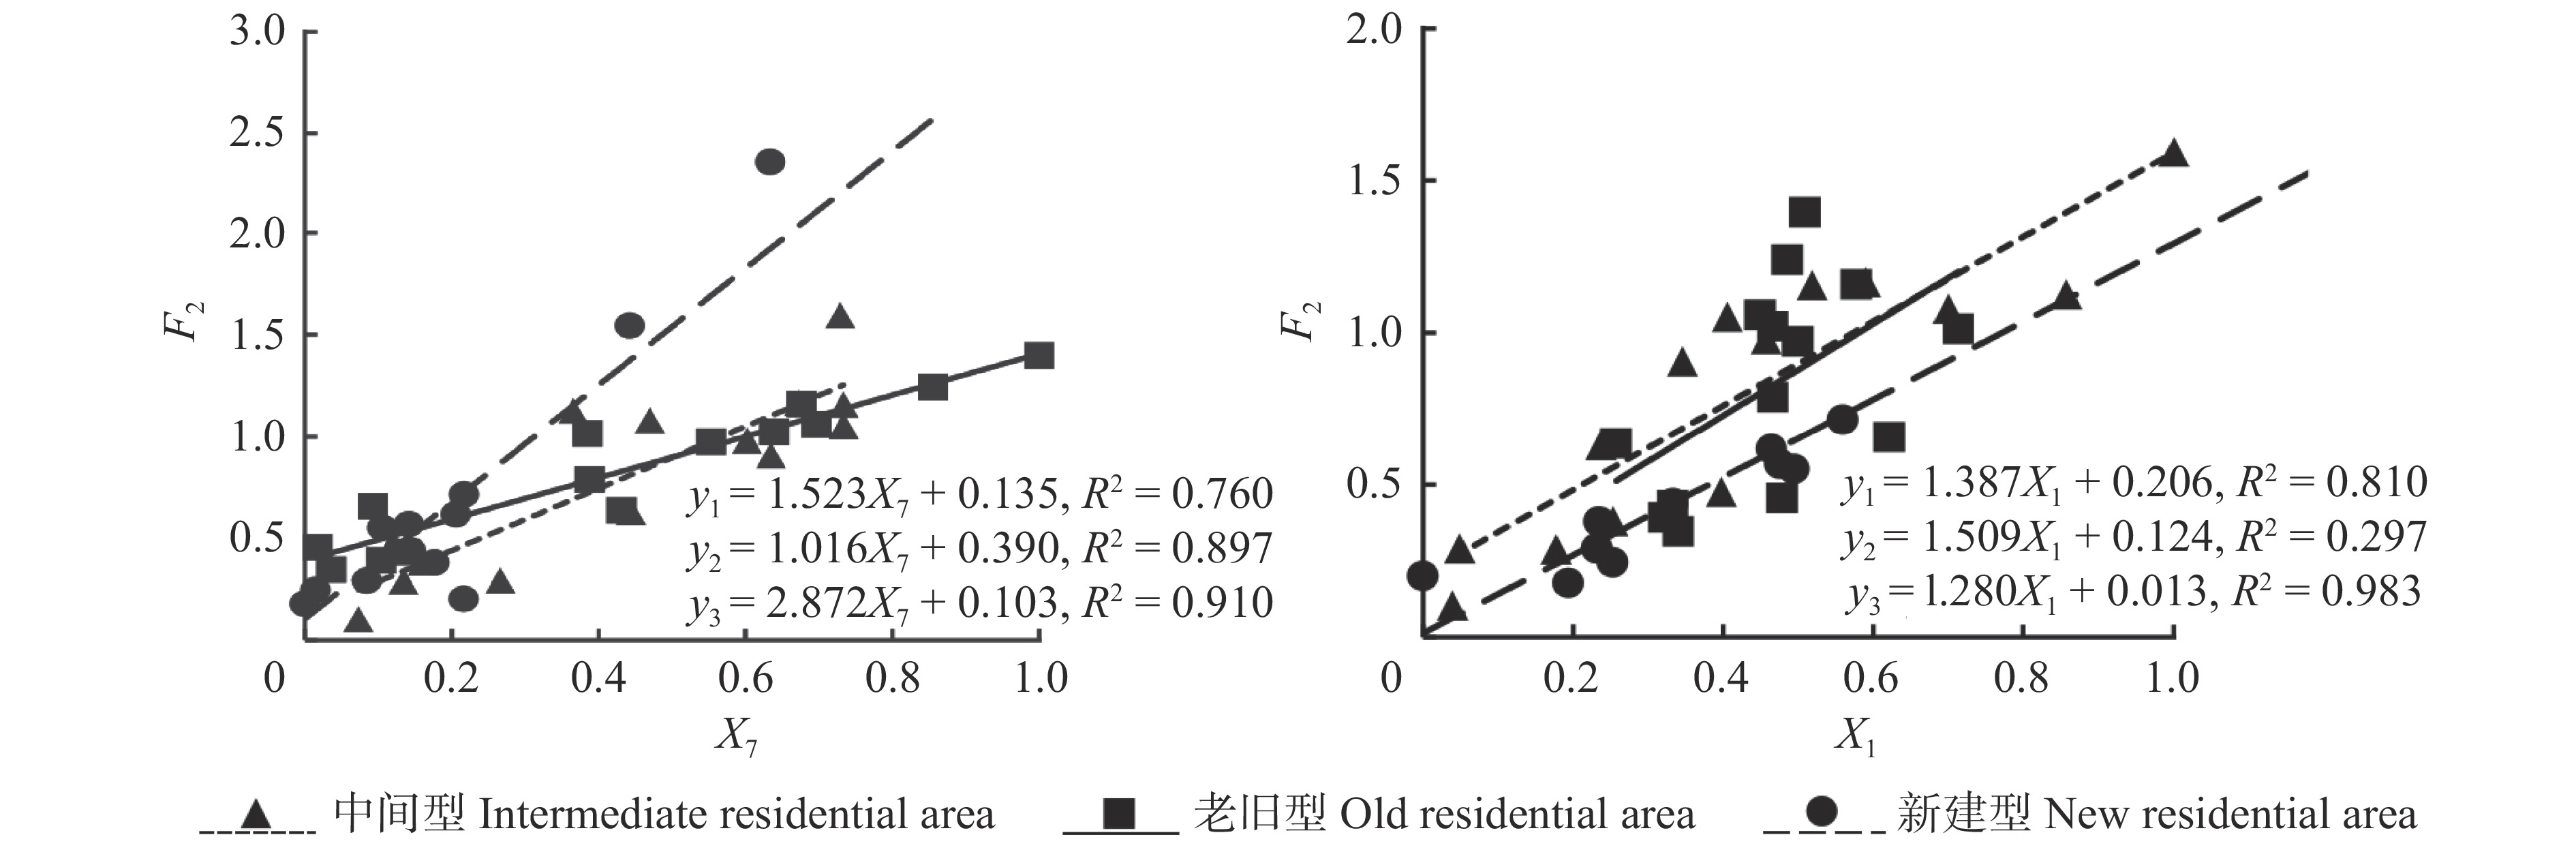
图 7 不同类型居住区的F2值随空间协调度指标的变化趋势
F2为绿色空间协调度指数。下同。F2 is green spatial coordination degree index. The same below.
Figure 7. Changing trends of F2 values in different types of residental areas along with the spatial coordination index
![]()
图 8 不同绿色空间类型的F2值随空间协调度指标的变化趋势
Figure 8. Changing trends of F2 values for different green space types with spatial coordination indexes
![]()
图 9 不同建成年代居住区的F3值随视觉质量指标的变化趋势
F3为绿色空间视觉质量指数。下同。F3 is green spatial visual quality index. The same below.
Figure 9. Changing trends of F3 values in different built residential areas with visual quality indexes
![]()
图 10 不同绿色空间类型的F3值随视觉质量指标的变化趋势
Figure 10. Changing trends of F3 values for different types of green space with visual quality indexes
![]()
图 11 不同年代居住区宅旁绿色空间的植被与建筑空间协调度与相对空间垂直绿量
Figure 11. Coordination degree of vegetation and architectural space and relative vertical green quantity of residential green space in different years
![]()
图 12 不同绿色空间类型宅旁绿色空间的植被视线遮蔽度
Figure 12. Vegetation line of sight obscuration in green space beside houses of different types of green space
表 1 抽样居住区基本信息
Table 1 Basic information of sampled residential areas
居住区类型
Type of residential area建筑年限
Construction year建筑层数
Number of building floor小区名称
Community name平均绿化率
Average green coverage/%新建型居住区
New residential area近5年
In recent five years12 ~ 27 双清苑,八家嘉园,星河湾朗园Shuangqingyuan Community, Bajiajiayuan Community, Xinghewanlangyuan Community 39.87
(34.9 ~ 45.0)中间型居住区
Intermediate residential area5 ~ 20年
Between 5 and 20 years6 ~ 22 清枫华景园,逸成东苑,美丽星苑,国奥村Qingfenghuajingyuan Community, Yichengdongyuan Community, Meilixingyuan Community,Guoaocun Community 34.03
(30.1 ~ 40.3)老旧型居住区
Old residential area20年以上
Over 20 years6 ~ 29 望京西园四区,华严北里小区,南沙滩小区,科学园南里四区,五建小区Wangjingxiyuan Community Ⅳ, Huayanbeili Community, Nanshatan Community, Kexueyuannanli Community Ⅳ, Wujian Community 29.24
(26.3 ~ 31.2) 下载: 导出CSV
表 2 基于外部空间构成方式的居住区绿色空间类型划分
Table 2 Classification of green space types of residential areas based on the consist of external space
序号
Serial No.绿色空间类型
Green space type空间示意图
Spatial schematic diagram空间特点
Spatial characteristics1 宅旁紧贴式
Close-to-house pattern
紧邻住宅建筑,面积基本在400 m2以下,空间宽度较小、长度较大,多由乔−灌−草或灌−草形成复层空间Adjacent to residential buildings, the area is below 400 m2, the width of the space is small and the length is large, and most of the green space is formed by arbor-shrub-grass or shrub-grass 2 规则成林式
Regular forest pattern
空间占地较大,面积在400 ~ 1 500 m2不等,紧邻住宅,植物多采用行列式种植,排列较为整齐,林下空间可进入,生态效益较高The space covers a large area, ranging from 400 −1 500 m2, and is close to the residential buildings. Plants are neatly planted in rows and arranged. The space below canopy is accessible, and the ecological benefits are high 3 自然群落式
Natural community pattern
空间占地较大,面积多集中在800 ~ 1 500 m2,植物多采用乔−灌−草近自然复层结构,空间层次丰富。是居住区较常见的构成方式The area of green space is large with area from 800 −1 500 m2, and with naturally complex structure configurated with arbor-shrub-grass. The spatial structure is rich. It’s a common model of residential green space 4 宅间组合式
Combination between house pattern
以植物为主,面积在1 000 ~ 4 000 m2不等,常出现在建筑间,不与树池、座椅等设施及其他组景要素结合,植物层次较为丰富。与住宅建筑由小路连接,可供人通行The space with an area from 1 000 − 4 000 m2 is dominated by vegetation, which often appears between buildings and does not combine with facilities such as tree pool seats and other landscape elements. The vegetation structure is relatively rich and the space is connected with residential buildings by a path, which can be used by people
下载: 导出CSV
表 3 居住区绿色空间质量评价指标
Table 3 Indexes for quality assessment of green space in residential area
评价指标 Evaluation index 功能属性 Functional attribute 指标来源 Source of index 树种丰富度(X1)* Tree species richness(X1)* 树种组成
Tree composition李辉等[33]Li Hui, et al[33] 树种多样性(X2)* Tree species diversity(X2)* 黄绍辉等[34]Huang Shaohui, et al[34] 乡土树种比例(X3) Proportion of native tree species(X3) 空间绿化覆盖度(X4) Greening coverage(X4) 空间结构
Spatial structure乔木覆盖度(X5)* Tree coverage(X5)* 相对空间垂直绿量(X6)* Relative vertical green volume(X6)* 植被与建筑空间协调度(X7)*Spatial coordination between vegetation and building(X7)* 建筑正前方遮蔽度(X8)* Shelter degree in front of building (X8)* 赵亚琳[35] Zhao Yalin[35] 植物视线遮蔽度(X9)* Screened degree of view by plants(X9)* 张子维[36] Zhang Ziwei[36] 观赏季节丰富度(X10) Ornamental season richness(X10) 美学特性
Asthetics characteristic色彩丰富度(X11)* Color richness(X11)* 高大树木存在率(X12)* Existence rate of tall trees(X12)* 文化寓意植物占比(X13)Proportion of cultural implication plants(X13) 芳香植物占比(X14) Proportion of aromatic plants(X14) 植物保健功能
Plant health function植源致敏树种占比(X15)Proportion of allergenic tree species(X15) 王成等[37] Wang Cheng, et al[37] 注:标注*的指标为筛选后保留的指标。Note: indicators marked with * are those retained after filtering.
下载: 导出CSV
表 4 绿色空间质量评价指标主成分分析结果
Table 4 Principal component analysis results of quality evaluation indexes of green space
项目
Item旋转后载荷矩阵
Load matrix after rotation各指数和指标权重
Each index and index weight主成分轴 F1Principal component axis F1 主成分轴 F2Principal component axis F2 主成分轴 F3Principal component axis F3 F1权重
Weight F1F2权重
Weight F2F3权重
Weight F3特征值 Eigenvalue 2.730 2.184 2.003 0.395 0.315 0.290 贡献率 Contribution rate/% 30.338 24.265 22.256 X5 0.892 0.213 −0.072 0.256 X8 0.752 0.111 0.238 0.215 X12 0.712 0.432 −0.040 0.203 X9 0.591 0.328 0.387 0.169 X6 0.546 0.352 0.507 0.157 X7 0.239 0.928 0.048 0.502 X1 0.290 0.919 −0.043 0.498 X2 −0.095 −0.029 0.887 0.506 X10 0.257 −0.035 0.862 0.494
下载: 导出CSV
-
[1] 王其钧. 城市设计[M]. 北京: 机械工业出版社, 2008. Wang Q J. Urban design [M]. Beijing: China Machine Press, 2008.
[2] de Keijzer C, Bauwelinck M, Dadvand P. Long-term exposure to residential greenspace and healthy ageing: a systematic review[J]. Current Environmental Health Reports, 2020, 7: 65−88. doi: 10.1007/s40572-020-00264-7
[3] Wang R, Yang B, Yao Y, et al. Residential greenness, air pollution and psychological well-being among urban residents in Guangzhou, China[J/OL]. Science of the Total Environment, 2020, 711: 134843[2020−11−01]. https://doi.org/10.1016/j.scitotenv.2019.134843.
[4] 秦云. 基于人性化理念的西安新兴骏景园小区景观改造设计研究[D]. 西安: 西安建筑科技大学, 2019. Qin Y. The study of renovation design of landscape in Xi’an Xinxing Junjingyuan’s district based on humanized concept [D]. Xi’an: Xi’an University of Architecture and Technology, 2019.
[5] 吴正旺, 单海楠, 王岩慧. 结合“绿视率”的高密度城市居住区视觉生态设计: 以北京为例[J]. 华中建筑, 2016, 34(4): 57−60. doi: 10.3969/j.issn.1003-739X.2016.04.012 Wu Z W, Shan H N, Wang Y H. Visual ecological design of high-density urban residential area based on green seeing rate: taking Beijing as an example[J]. Huazhong Architecture, 2016, 34(4): 57−60. doi: 10.3969/j.issn.1003-739X.2016.04.012
[6] 李靖莹. 环境美学视域下居住区景观设计研究[D]. 长春: 长春工业大学, 2020. Li J Y. Research on landscape design of residential space from the perspective of environmental aesthetics [D]. Changchun: Changchun University of Technology, 2020.
[7] 任丽丽. 基于模糊层次分析法对苏州古城老街坊居住环境综合分析与评价[D]. 苏州: 苏州大学, 2015. Ren L L. Fuzzy AHP to comprehensive analysis and evaluation on residential environment based on the ancient city of Suzhou old street [D]. Suzhou: Soochow University, 2015.
[8] 李秋枝, 张亚辉. 基于层次模糊分析法的居住区绿地景观评价研究[J]. 山西建筑, 2017, 43(14): 209−211. doi: 10.3969/j.issn.1009-6825.2017.14.115 Li Q Z, Zhang Y H. Green landscape evaluation in residential districts based on FAHP[J]. Shanxi Architecture, 2017, 43(14): 209−211. doi: 10.3969/j.issn.1009-6825.2017.14.115
[9] 陈翠玉, 吴立素, 杨善云. 基于SBE法的植物景观美学评价: 以柳州市居住区为例[J]. 广西农学报, 2020, 35(2): 37−42. doi: 10.3969/j.issn.1003-4374.2020.02.009 Chen C Y, Wu L S, Yang S Y. Evaluation of plant landscape aesthetics based on scenic beauty evaluation(SBE) method: a case study of residential areas in Liuzhou City[J]. Journal of Guangxi Agriculture, 2020, 35(2): 37−42. doi: 10.3969/j.issn.1003-4374.2020.02.009
[10] 赵丽艳, 王有宁, 汪殿蓓, 等. 基于SBE法的孝感市居住区园林植物配置研究[J]. 南方农业, 2012, 6(12): 32−36. Zhao L Y, Wang Y N, Wang D P, et al. SBE-based quantitative evaluation on plant landscape of residential districts in Xiaogan[J]. South China Agriculture, 2012, 6(12): 32−36.
[11] Xunfan S U. Evaluation of plant landscape in residential areas based on AHP and TOPSIS[J]. Asian Agricultural Research, 2017, 9(10): 77−81.
[12] 杨析墨. 基于BIB-LCJ法与SD法的重庆市区居住小区主入口景观评价与设计[D]. 重庆: 西南大学, 2020. Yang X M. Landscape evaluation and analysis of the main entrance of Chongqing residential area based on BIB-LCJ method and SD method [D]. Chongqing: Southwest University, 2020.
[13] Saito H. A study of green planning in public spaces of residential areas and residents’ participation to green management: residents’ evaluation of green areas with natural-forests at residential areas Part 1[J]. Journal of Architecture and Planning (Transactions of AIJ), 1999, 64(525): 225−232. doi: 10.3130/aija.64.225_2
[14] 王思瑶. 城市居住区宜居性评价体系构建及实证分析[D]. 太谷: 山西农业大学, 2018. Wang S Y. Construction and empirical analysis of livability evaluation system in urban residential areas [D]. Taigu: Shanxi Agricultural University, 2018.
[15] 孟海珍. 基于宜居理论的城市居住区植物景观评价及优化研究[D]. 太谷: 山西农业大学, 2018. Meng H Z. Evaluation and optimization of plant landscape in urban residential areas based on livable theory [D]. Taigu: Shanxi Agricultural University, 2018.
[16] Daniel T C. Whither scenic beauty? Visual landscape quality assessment in the 21st century[J]. Landscape and Urban Planning, 2000, 54: 267−281.
[17] Susaki J, Kubota S. Automatic assessment of green space ratio in urban areas from mobile scanning data[J]. Remote Sensing, 2017, 9(3): 215. doi: 10.3390/rs9030215
[18] 彼特·麦霍伊. 小庭院规划指南[M] 姬文桂, 译. 北京: 北京科学技术出版社, 2004. McHoy P. Small yard planning guide[M]. Ji W G, tran. Beijing: Beijing Science and Technology Press, 2004.
[19] Berman G. Principles of community justice: a guide for community court planners[M]. New York: Center for Court Innovation, 2010.
[20] 刘琳. 重庆地区宅旁绿地植物设计策略刍议[J]. 重庆建筑, 2016, 15(8): 33−34. doi: 10.3969/j.issn.1671-9107.2016.08.033 Liu L. Analysis on a plant design strategy for residential green space in Chongqing[J]. Chongqing Architecture, 2016, 15(8): 33−34. doi: 10.3969/j.issn.1671-9107.2016.08.033
[21] 孙银, 贾艳玲. 居住区绿化研究[J]. 园艺与种苗, 2012(2): 50−52, 55. doi: 10.3969/j.issn.2095-0896.2012.02.018 Sun Y, Jia Y L. Study on the greening of residential areas[J]. Horticulture & Seed, 2012(2): 50−52, 55. doi: 10.3969/j.issn.2095-0896.2012.02.018
[22] 谭燕香. 以人为本 高质量建设宅旁绿地[J]. 湖南林业, 2006(5): 9. Tan Y X. People-oriented and high-quality construction of green space beside houses[J]. Forestry and Ecology, 2006(5): 9.
[23] 胡云波. 浅谈居住区宅旁绿地景观规划设计[J]. 科技信息, 2013(8): 384. doi: 10.3969/j.issn.1001-9960.2013.08.330 Hu Y B. Discussion on landscape planning and design of green space beside residential quarters[J]. Science & Technology Information, 2013(8): 384. doi: 10.3969/j.issn.1001-9960.2013.08.330
[24] 赵明秀, 张晓敏, 史梅容, 等. 桂林市宅旁绿地植物配置模式探讨[J]. 现代园艺, 2014(17): 107−109. Zhao M X, Zhang X M, Shi M R, et al. Discussion on plant configuration pattern of green space near houses in Guilin[J]. Xiandai Horticulture, 2014(17): 107−109.
[25] 何文惠. 成都市高层住宅区宅旁绿地植物配置研究[D]. 成都: 西南交通大学, 2014. He W H. A study of plant design in landscape design next to the house in hign-rise residential area in Chengdu City[D]. Chengdu: Southwest Jiaotong University, 2014.
[26] 卢雯韬. 重庆主城区新型农村社区植物景观综合评价及其优化[D]. 重庆: 西南大学, 2020. Lu W T. Comprehensive evaluation and optimization of new rural community plant landscape in the main urban area of Chongqing [D]. Chongqing: Southwest University, 2020.
[27] 黄玥, 陈玉, 何宇娟, 等. 社会经济因素对上海市居住区植物多样性的影响[J]. 应用生态学报, 2019, 30(10): 3403−3410. Huang Y, Chen Y, He Y J, et al. Effects of socioeconomic factors on urban plant diversity of residential areas in Shanghai, China[J]. Chinese Journal of Applied Ecology, 2019, 30(10): 3403−3410.
[28] 王蓉, 王献婧, 张熙茜, 等. 太原市不同建成时期居住区植物多样性研究[J]. 山西农业科学, 2018, 46(5): 801−804, 822. doi: 10.3969/j.issn.1002-2481.2018.05.30 Wang R, Wang X J, Zhang X Q, et al. Study on plant diversity in Taiyuan residential areas in different construction periods[J]. Journal of Shanxi Agricultural Sciences, 2018, 46(5): 801−804, 822. doi: 10.3969/j.issn.1002-2481.2018.05.30
[29] 宋晨晨. 深圳市建成区城市植物功能多样性及其受三类景观要素的影响[D]. 重庆: 西南大学, 2020. Song C C. The functional diversity of urban plants in the built-up area of Shenzhen and the effects of three landscape elements [D]. Chongqing: Southwest University, 2020.
[30] Feng X, Astell-Bur T. Residential green space quantity and quality and child well-being: a longitudinal study[J]. American Journal of Preventive Medicine, 2017, 53(5): 616−624. doi: 10.1016/j.amepre.2017.06.035
[31] Chang H T, Wu C D, Wang J D, et al. Residential green space structures are associated with a lower risk of bipolar disorder: a nationwide population-based study in Taiwan[J/OL]. Environmental Pollution, 2021, 283: 115864 [2020−11−06]. https://doi.org/10.1016/j.envpol.2020.115864.
[32] 骆中钊, 方朝晖, 杨锦河, 等. 新型城镇住宅小区规划[M]. 北京: 化学工业出版社, 2017. Luo Z Z, Fang C H, Yang J H, et al. Planning of new urban residential quarters [M]. Beijing: Chemical Industry Press, 2017.
[33] 李辉, 谢会成, 赵春仙, 等. 济南市城市森林结构特征分析[J]. 西北林学院学报, 2013, 28(2): 213−217. doi: 10.3969/j.issn.1001-7461.2013.02.42 Li H, Xie H C, Zhao C X, et al. Analysis on urban forest structure in Jinan[J]. Journal of Northwest Forestry University, 2013, 28(2): 213−217. doi: 10.3969/j.issn.1001-7461.2013.02.42
[34] 黄绍辉, 刘雪妍, 刘艳. 城市干道绿化植物的调查与分析: 以徐州市富春路为例[J]. 徐州工程学院学报(自然科学版), 2019, 34(4): 88−92. Huang S H, Liu X Y, Liu Y. Investigation and analysis of greening plants on urban main road: a case study of Fuchun Road in Xuzhou City[J]. Journal of Xuzhou Institute of Technology (Natural Sciences Edition), 2019, 34(4): 88−92.
[35] 赵亚琳, 包志毅. 居住区绿地空间的植物尺度与种植密度研究[J]. 现代园艺, 2019(9): 153−155. doi: 10.3969/j.issn.1006-4958.2019.09.083 Zhao Y L, Bao Z Y. Study on plant scale and planting density of green space in residential area[J]. Xiandai Horticulture, 2019(9): 153−155. doi: 10.3969/j.issn.1006-4958.2019.09.083
[36] 张子维. 基于尺度的传统景园建筑与植物量化研究[D]. 南京: 东南大学, 2017. Zhang Z W. Quantitative research on traditional landscape architecture and plant based on scale [D]. Nanjing: Southeast University, 2017.
[37] 王成, 张昶, 孙睿霖, 等. 京津冀地区城乡森林建设中的问题及应对策略[J]. 中国城市林业, 2018, 16(5): 1−6. doi: 10.3969/j.issn.1672-4925.2018.05.001 Wang C, Zhang C, Sun R L, et al. Problems and countermeasures of urban and peri-urban forestry construction in Beijing-Tianjin-Hebei Region[J]. Journal of Chinese Urban Forestry, 2018, 16(5): 1−6. doi: 10.3969/j.issn.1672-4925.2018.05.001
[38] 何晓群. 多元统计分析[M]. 北京: 中国人民大学出版社, 2015. He X Q. Multivariate statistical analysis [M]. Beijing: China Renmin University Press, 2015.
[39] 马冰倩, 徐程扬, 刘江, 等. 城镇森林视觉景观异质性对美学质量的影响[J]. 浙江农林大学学报, 2019, 36(2): 366−374. Ma B Q, Xu C Y, Liu J, et al. Visual heterogeneity and visual landscape quality of urban forests as an architectural backdrop[J]. Journal of Zhejiang A&F University, 2019, 36(2): 366−374.
[40] 达良俊, 杨永川, 陈鸣. 生态型绿化法在上海“近自然”群落建设中的应用[J]. 中国园林, 2004(3): 41−43. Da L J, Yang Y C, Chen M. The method of ecological greening and its application in the construction of the approaching nature plant community in Shanghai[J]. Chinese Landscape Architecture, 2004(3): 41−43.
[41] 杨阳, 王晶懋. 西北半干旱城市绿地近自然人工植物群落构建研究[J]. 西北林学院学报, 2018, 33(1): 274−280. Yang Y, Wang J M. Construction of near nature artificial plant community in semi-arid green space of northwestern China[J]. Journal of Northwest Forestry University, 2018, 33(1): 274−280.
[42] 陈波. 杭州西湖园林植物配置研究[D]. 杭州: 浙江大学, 2006. Chen B. Study on planting design in the parks and gardens of Hangzhou West Lake [D]. Hangzhou: Zhejiang University, 2006.
[43] 牛君丽. 北京风景游憩林质量评价的指标体系研究[D]. 北京: 北京林业大学, 2008. Niu J L. Study on attribute system of quality assessment for scenic and recreational forest in Beijing [D]. Beijing: Beijing Forestry University, 2008.
[44] 郄光发, 任启文, 李伟, 等. 北京不同类型居住区树种组成结构及其三维空间配置[J]. 生态学杂志, 2011, 30(9): 1886−1893. Xi G F, Ren Q W, Li W, et al. Tree species composition and three-dimensional configure in different types of residential areas in Beijing[J]. Chinese Journal of Ecology, 2011, 30(9): 1886−1893.
[45] 闫蓬勃. 中国城市树种多样性评价及树种规划研究[D]. 北京: 北京林业大学, 2019. Yan P B. A study on urban tree species diversity assessment and species planning in China [D]. Beijing: Beijing Forestry University, 2019.
[46] 张亚菲, 杜南, 李亚兰, 等. 乌鲁木齐市春季植物景观调查研究[J]. 广东农业科学, 2013, 40(6): 57−60. Zhang Y F, Du N, Li Y L, et al. Investigation of plant landscape in spring of Urumqi City[J]. Guangdong Agricultural Sciences, 2013, 40(6): 57−60.
[47] 冯博, 徐光花, 冯保新, 等. 长春市典型城市森林景观秋季美学特征分析与评价[J]. 吉林林业科技, 2019, 48(5): 13−17. Feng B, Xu G H, Feng B X, et al. Analysis and evaluation of the aesthetic characteristics of typical urban forest landscape in autumn in Changchun[J]. Journal of Jilin Forestry Science and Technology, 2019, 48(5): 13−17.
[48] 徐进. 居住区景观设计[M]. 武汉: 武汉理工大学出版社, 2013. Xu J. Residential landscape design [M]. Wuhan: Wuhan University of Technology Press, 2013.
[49] 李芳. 乌鲁木齐市居住小区不同绿地类型植物群落特征及景观评价研究[D]. 乌鲁木齐: 新疆农业大学, 2011. Li F. Study on the plant community characteristics and landscape evaluation on the different green types of residential areas in Urumqi [D]. Urumqi: Xinjiang Agricultural University, 2011.
[50] Gong L, Zhang Z D, Xu C Y. Developing a quality assessment index system of scenic forests: a case study in Beijing Xishan Mountain[J]. Forests, 2015, 6(1): 225−243.
[51] 孙姝亭, 陈美谕, 李苹, 等. 北京市居民小区景观林林内景观质量评价研究[J]. 西北林学院学报, 2016, 31(5): 297−305. doi: 10.3969/j.issn.1001-7461.2016.05.49 Sun S T, Chen M Y, Li P, et al. Assessment on in-forest quality of landscape forest in residential area in Beijing[J]. Journal of Northwest Forestry University, 2016, 31(5): 297−305. doi: 10.3969/j.issn.1001-7461.2016.05.49
-
期刊类型引用(8)
1. 张元梅,孙桂丽,鲁艳,李利,张志浩,张栋栋. 昆仑山北坡两种优势荒漠灌木的生物量预测模型. 干旱区研究. 2024(02): 284-292 .  百度学术
百度学术
2. 赵秀英,庞志,于凤强,张建华,杨建军,郝彦卿,白小琴,杨蓉,黄鹏,谢丕青,王佳濛,杨海峰. 柠条锦鸡儿种子产量预测模型研究. 山东农业大学学报(自然科学版). 2024(04): 557-565 . 百度学术
3. 郭玉东,张秋良,陈晓燕,张榕,宝朝鲁门,阿日宾巴雅尔,斯庆毕力格,王颖. 库布齐沙漠地区人工灌木林生物量模型构建. 西北农林科技大学学报(自然科学版). 2022(04): 74-82 . 百度学术
4. 段菁,云海英,李鑫,滕飞,纳青. 基于CASA模型的内蒙古地区草地生产力估测. 林业调查规划. 2022(03): 133-138+155 . 百度学术
5. 朱雅丽,张景路,张绘芳,地力夏提·包尔汉,廉佳佳. 天山中部锦鸡儿生物量分析及模型构建. 林业资源管理. 2022(05): 129-135 . 百度学术
6. 刘江,袁勤,张立欣,代香荣,刘向阳,丁茹,叶丽娜. 库布齐沙漠北缘不同人工灌木林地土壤肥力质量状况. 西北林学院学报. 2021(02): 46-53 . 百度学术
7. 黄小娟,侯扶江. 高寒典型草原主要物种的株高和盖度预测种群和群落地上生物量. 生态学报. 2021(12): 4942-4952 . 百度学术
8. 张殿岱,王雪梅. 塔里木盆地北缘绿洲-荒漠过渡带典型植物地上生物量估测. 生态学杂志. 2019(10): 3211-3220 . 百度学术
其他类型引用(7)


计量
- 文章访问数: 724
- HTML全文浏览量: 268
- PDF下载量: 81
- 被引次数: 15
