
Effects of thinning on stand diameter structural heterogeneity and growth dominance in spruce-fir forests of Changbai Mountains, northeastern China
-
摘要:目的 择伐的促进效果常用伐后林分保留木的生长动态来评估。本文对择伐后的云冷杉林林分直径结构异质性及不同树种和径阶的生长动态进行研究,为帮助经营者调整择伐策略提供科学指导。方法 基于吉林省金沟岭林场4块云冷杉林固定样地,其中对照样地1块、3块择伐样地,择伐强度分别为21%(轻度)、27%(中度)、36%(强度),采用普雷斯勒生长率以及基尼系数分析了林分伐后直径结构异质性和生长的动态,并采用了生长优势的概念分析了林分内不同耐荫程度的树种和径阶对择伐的生长响应。结果 伐后5年,不同择伐强度(轻度、中度、强度)样地耐荫树种生长率分别为2.92%、2.73%、3.04%。择伐强度的增大对耐荫树种的促进作用不显著,但能显著促进林下不耐荫树种的生长(2.18%、2.91%、3.65%);中低择伐强度能显著促进林分内中小径阶林木的生长,但对优势木的促进作用不明显。强度择伐对林分各径阶的生长均有较强的促进作用;不耐荫树种非优势木对择伐的响应更积极,伐后相比耐荫树种展现出更强的负生长优势;对中径阶林木的择伐能立即提高林分直径结构异质性。伐后样地的基尼系数呈现降低趋势,择伐能够通过降低林分不对称竞争,促进中小径阶林分生长,进而降低林分直径结构异质性水平。结论 高强度择伐以及定期伐除生长贡献较低的耐荫树种优势木能够最大化林分生产力,轻度择伐能较好地促进云冷杉林林分的可持续发展,加速朝东北地区初级植被的正向演替。生长优势能够有效反映伐后各径阶林木的生长状态,为合理采伐林木提供参考。Abstract:Objective The effective of thinning is commonly evaluated by the growth dynamics of reserved trees. The stand diameter structure heterogeneity and growth dynamics of different tree species and diameter classes of spruce-fir mixed forest after thinning were studied in order to provide scientific guidance for operators to adjust thinning strategies.Method Based on four permanent sample plots of natural spruce-fir mixed forest in Jingouling Forest Farm of Jilin Province, northeastern China, which included one control sample plot and three thinning sample plots with different treatments (remove 21% (light), 27% (medium), 36% (heavy) of the basal area), we applied the concept of growth dominance (GD) with the Pressler growth rate and the Gini coefficient to analyze the dynamics of diameter structural heterogeneity and the growth feedback of different species and diameter classes after thinning.Result 5 years after thinning, the growth rates of shade-tolerant tree species (light, medium and heavy) were 2.92%, 2.73% and 3.04%, respectively. The increase of thinning intensity had no significant promoting effect on shade-tolerant species but it can promote the growth of shade-intolerant tree species significantly (2.18%, 2.91%, 3.65%). The medium and light thinning intensity could improve the growth rates of small and medium diameter trees greatly but this impact is not obvious on the dominant trees, while heavy thinning had a strong positive effect on the growth of whole stand. The non-dominant trees of shade-intolerant species responded more positively to thinning, which had stronger negative growth dominance than shade-tolerant species. Thinning of medium-diameter trees can immediately improve the heterogeneity of stand structure. The Gini coefficient decreased after thinning showed that thinning can reduce the level of stand diameter structural heterogeneity by reducing the asymmetric competition and promoting the growth of small trees.Conclusion Heavy intensity thinning and regularly removing shade-tolerant dominant trees of weak contributors to stand growth can maximize stand productivity, while light thinning can promote the sustainable forest development, and accelerate the positive succession to the primary vegetation in northeastern China. The growth dominance can effectively reflect the growth status of trees in different diameter classes after thinning, and provide rational reference for thinning of trees.
-
树木的资源获取量及资源利用率是树木生长速率的决定因素[1-2]。资源获取量取决于树木在林分中的竞争地位[3],如优势木能通过高大的树冠对中小径阶个体施加不对称竞争,占据更大比例的资源[4]。资源利用效率则与树种特性及年龄有关[5-6]。采伐是一项常见的营林措施,能够通过移除部分树木改善林分的竞争环境、调节林木间的资源分配[7-8],不同树种及径阶的保留木对这种资源和竞争环境的改善会有不同的响应[9-10]。当前的研究多从林分整体水平上分析采伐对生长的影响[11-12],而对林分内树木的生长状况关注较少[13]。
为了更好地了解林分内的生长动态,Binkley将树木大小与对林分生长的相对贡献率联系起来,提出生长优势的概念[14]。当林分内优势木对林分生长的相对贡献高于小径阶时,林分表现为“正”生长优势,反之则为“负”生长优势。生长优势已被证明是混交林复杂生长动态的重要特征之一[15],Pother等[16-17]基于生长优势比较了不同树种组成的混交林内优势木与非优势木之间的生长差异。Lemire等[18]和Moreau等[19]利用生长优势分析了不同强度采伐后林分和林木的生长情况。本研究对象为长白山天然云冷杉(Picea spp. & Abies spp.)混交林,在东北这类林分多为“过伐林”,是当地重要的用材林与风景林[20]。林分内不同树种和大小的林木共享有限的林分资源,产生了复杂的林分动态,择伐对这类天然林的研究较少[21-22]。本研究分析了择伐后云冷杉混交林林直径结构异质性和生长优势的动态变化,为合理确定移除树木,帮助经营者调整择伐策略提供参考。
1. 研究区概况与研究方法
1.1 研究区概况
研究区位于吉林省汪清县境内东北部的金沟岭林场(130°05′ ~ 130°20′E,43°17′ ~ 43°25′N),为汪清河三大支流发源地,属吉林省长白山系老爷岭山脉雪岭支脉。年降水600 ~ 700 mm,多集中于7月份,年平均气温3.9 ℃。林区地形属低山区丘陵盆地,海拔300 ~ 1 200 m,坡度5° ~ 25°,土壤均为暗棕壤,腐殖质丰富,土质较好,土层厚度约为40 cm。针叶树种以红皮云杉(Picea koraiensis)、鱼鳞云杉(Picea jezoensis)、臭冷杉(Abies nephrolepis)、红松(Pinus koraiensis)为主,约占林分蓄积的60%,阔叶树主要有色木槭(Acer mono)、椴树(Tilia amurensis)、榆树(Ulmus pumila)、枫桦(Betula costata)、白桦(Betula platyphylla),草本以苔草(Carex tristachya)和禾本科(Gramineae)草类为主。
1.2 数据来源
本研究实验样地为金沟岭林场4块自1986年设置的云冷杉林固定样地,样地立地条件基本一致,面积为0.2 hm2,坡度12°,坡向均为西坡。样地主要耐荫树种为冷杉、云杉,不耐荫树种为红松和落叶松。自设立起,每2 ~ 3年进行一次复测,对胸径 ≥ 5 cm的树木进行每木检尺,记录林木的编号、树种、胸径、进界木和枯死木的信息。3块择伐样地于1997年分别以轻度择伐(21%),中度择伐(27%),强度择伐(36%)进行第二次择伐,择伐以去劣留优为原则,主要择伐对象为中径级林木。本次研究取样地1994—2014年的数据。样地的基本概括见表1。
表 1 云冷杉林固定样地情况及采伐强度(1997年)Table 1. Statistic of spruce-fir fixed sample plots and thinning intensity (1997)样地号 Sample
plot No.择伐强度 Thinning
intensity/%伐后蓄积 Volume after
thinning/m3伐后郁闭度/(m3·hm−2) Canopy density after thinning/(m3·ha−1) 平均胸径
Mean DBH/cm林分密度/(株·hm−2)
Stand density /(tree·ha−1)伐后树种组成 Species composition
after thinning伐前 Before thinning 伐后 After thinning 伐前 Before thinning 伐后 After thinning 1 0 335 0.9 19.8 19.8 1105 1105 5AN3PJ2P 2 21 246 0.7 23.9 23.2 1055 810 7AN2P1PJ 3 27 218 0.7 21.2 20.4 835 645 5AN3P2PJ 4 36 184 0.6 23.2 22.5 760 540 6AN2P1PJ1C 注:AN表中代表冷杉,PJ代表云杉,P代表红松,C 代表阔叶树。Notes: AN stands for Abies nephrolepis; PJ stands for Picea jezoensis; P stands for Pinus koraiensis; C stands for broadleaved trees. 1.3 研究方法
1.3.1 林木生长优势
生长优势(growth dominance)可以用来量化单木或径阶对整体林分生长的相对贡献,通常用单木水平的生长优势曲线和林分水平的生长优势系数来表示。生长优势曲线基于洛伦茨曲线,描述了按林木大小升序排列后的林分累积生物量与累积生长量的关系[14] (本文采用树木胸高断面积和断面积生长量)。图1中1∶1线代表林分平均状态下各林木大小与生长的关系,当生长优势曲线与1∶1线重合时,说明各树木对林分总生长量的相对贡献相等,此时林分生长无径阶主导(无生长优势)。当曲线位于1∶1线下方时,说明树木的相对生长率随径阶增大逐渐提高,林分上表现为大径阶林木主导林分生长(正生长优势),而当曲线位于1∶1线上方时林分由中小径阶主导生长(负生长优势)。
林分生长优势曲线表示的信息可以用生长优势系数概括,表示为曲线与1∶1线所围面积与实线对角线下方面积之比,生长优势系数取值为[−1,1],计算公式为[23]:
GDC=1 − ∑ni=1(BAi−BAi−1)(Δi+Δi−1) (1) 式中:GDC为生长优势系数;i为树木按断面积从小到大排序后的顺序;BAi-1、BA i为至第i−1、i棵树的累积断面积;
Δi−1 、Δi 为至第i−1、i棵树的累积断面积生长量。1.3.2 林木直径结构异质性
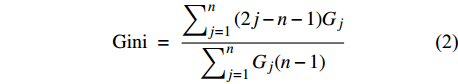
林分的直径结构异质性指林分内树木大小的差异程度,是林分直径结构的重要特征之一,与林分的竞争密切相关[3]。基尼系数常用来表示林分结构的异质性[24],有学者认为,基尼系数在区分林分内树木大小分布差异上比香浓指数、林分变异系数更有效[25]。基尼系数取值为[0,1],林分基尼系数越大,直径结构异质性越强。基尼系数计算公式为:
Gini = ∑nj=1(2j−n−1)Gj∑nj=1Gj(n−1) (2) 式中:n为林分内树木总数;j为树木按从小到大排列后的顺序;Gj 为第j棵树的胸高断面积。
1.3.3 林分生长率
对林分断面积生长率的计算采用普雷斯勒生长率公式[26]:
Pn=(ya−ya−n)/(ya+ya−n)×(200/n) (3) 式中:ya和ya-n分别为a年、a−n年的林分断面积或蓄积。
1.3.4 数据处理和分析
采用Excel 2019对样地数据进行预处理,使用R x64 4.0.0计算林分不同时期的基尼系数与生长优势系数,并用agricolae程序包对林分生长率进行单因素方差分析和多重比较(α = 0.05)及生长优势系数与0的差异显著性比较,使用R和Origin 2018出图。
2. 结果与分析
2.1 择伐对林分生长率的影响
对照样地生长率在研究期内基本维持稳定(表2)。伐后5年择伐样地的全林分断面积生长率分别为2.62%、2.85%、3.39%,伐后10年提高至2.91%、3.00%、3.42%,伐后13年生长率逐渐衰退,此时轻度择伐样地与对照样地之间已无显著差异,而中强度择伐样地各生长率仍显著大于对照样地,这表明择伐能够在一定时间尺度上促进林分生长,且促进效果与持续时间和择伐强度正相关。不同树种组对于择伐的反应不一致,轻度择伐便能对耐荫树种有较好的促进作用,使其伐后生长速率显著大于对照样地,不同择伐强度对其的促进作用并无显著差异。在对照和轻度择伐样地内,不耐荫树种的生长速率在研究期内均小于耐荫树种。伐后5年各择伐强度下不耐荫树种生长率分别为2.18%、2.91%、3.65%(轻度、中度、强度),随着择伐强度提高,不耐荫树种生长率迅速提高,中度择伐样地内不耐荫树种在伐后5年的生长率略大于耐荫树种,强度择伐样地内不耐荫树种生长率在研究期内始终高于耐荫树种。
表 2 伐后5 ~ 13年林分生长率Table 2. Stand periodical annual increment during 5−13 years after thinning% 择伐强度
Thinning intensity全林分 Whole stand 耐荫树种 Shade-tolerant tree species 不耐荫树种 Shade-intolerant tree species 伐后5年5 years
after thinning伐后10年10 years
after thinning伐后13年13 years
after thinning伐后5年5 yearsafter thinning 伐后10年10 years
after thinning伐后13年13 years
after thinning伐后5年5 years
after thinning伐后10年10 years
after thinning伐后13年13 years
after thinning对照 Control 2.18 ± 0.17a 2.05 ± 0.14a 2.00 ± 0.15a 2.30 ± 0.09a 2.14 ± 0.13a 2.27 ± 0.19a 1.79 ± 0.14a 1.88 ± 0.20a 1.67 ± 0.20a 轻度 Light 2.62 ± 1.9ab 2.91 ± 0.15b 2.23 ± 0.20ab 2.92 ± 0.16b 3.03 ± 0.23b 2.32 ± 0.21a 2.18 ± 0.14a 2.23 ± 0.09b 2.02 ± 0.18ab 中度 Medium 2.85 ± 0.18b 3.00 ± 0.23bc 2.72 ± 0.17b 2.73 ± 0.18ab 3.28 ± 0.19b 2.78 ± 0.29a 2.91 ± 0.30bc 3.25 ± 0.19c 2.70 ± 0.16b 强度 Heavy 3.39 ± 0.34c 3.42 ± 0.26c 2.68 ± 0.21b 3.24 ± 0.25b 3.07 ± 0.21b 2.58 ± 0.32a 3.65 ± 0.27c 3.62 ± 0.21c 2.91 ± 0.14b 注:表中数值为平均值 ± 标准差。不同字母之间差异显著(P < 0.05)。Notes: the values in this table are mean ± standard deviation. Different letters mean significant difference (P < 0.05). 2.2 择伐对生长优势的影响
2.2.1 择伐对全林分生长优势的影响
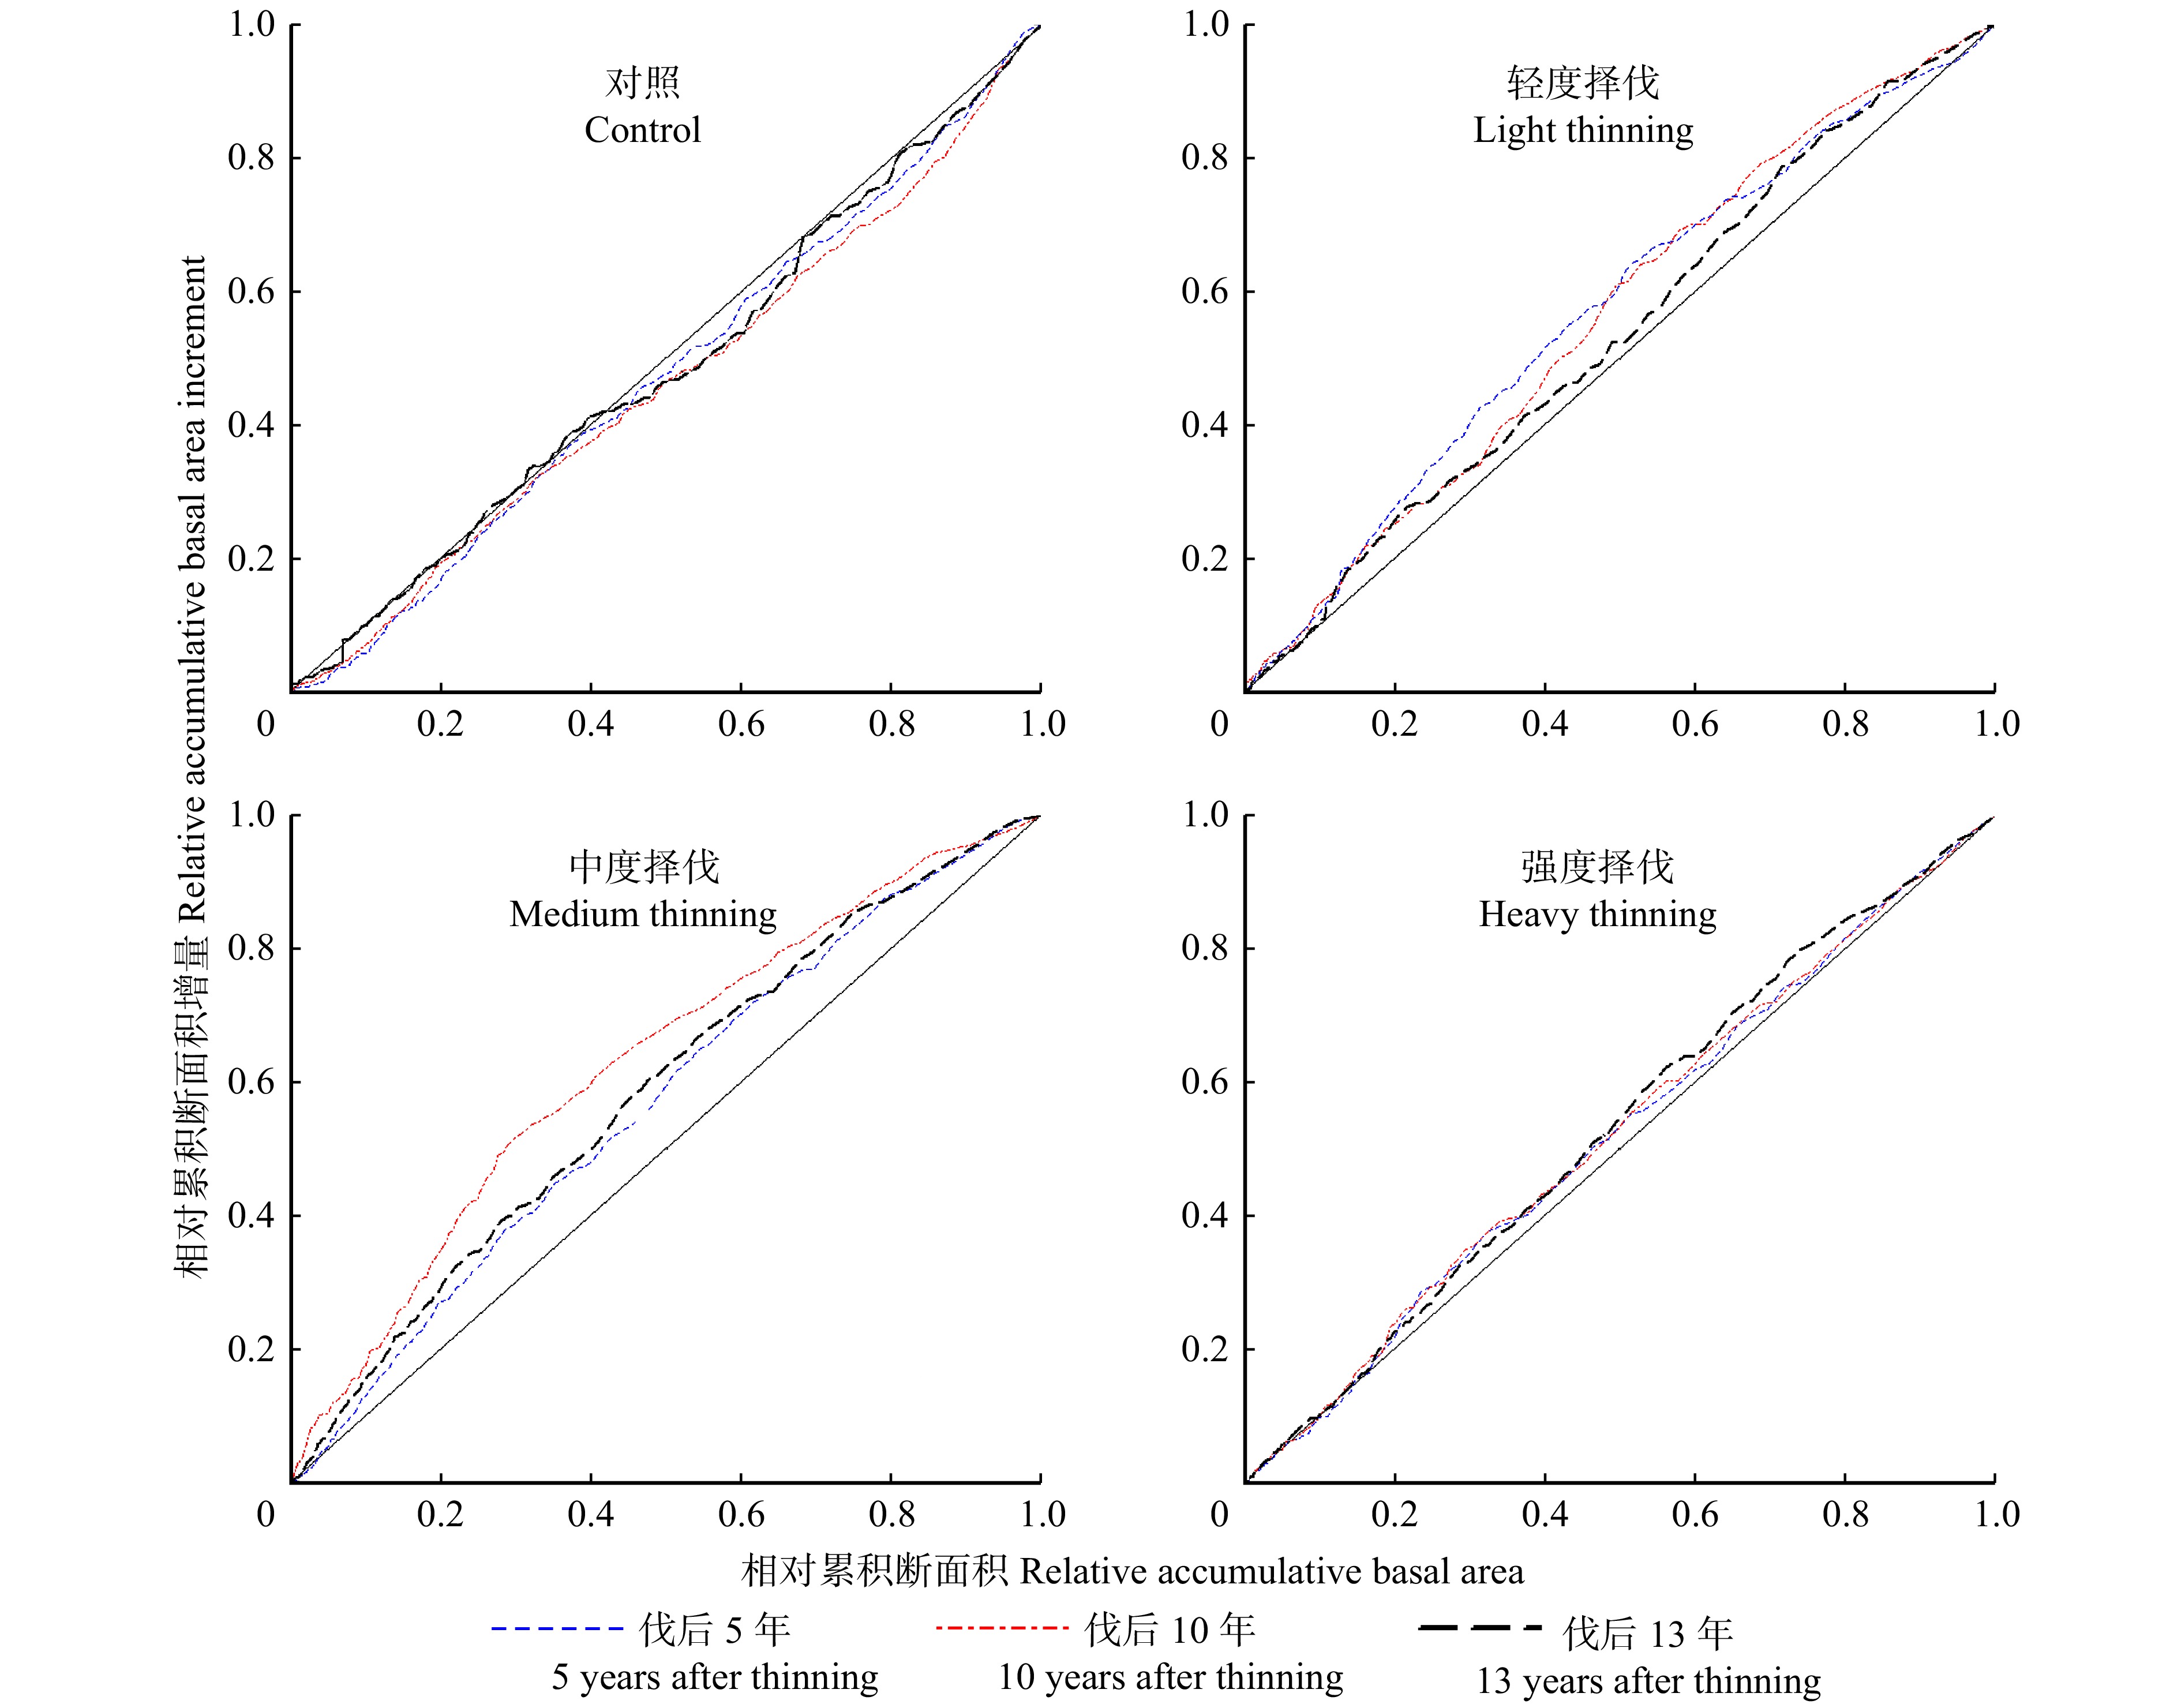
表3显示对照样地全林分不同时期的GDC分别为0.059、0.073、0.031。从图2的曲线上看,小径阶处(累积断面积 < 0.4)的累积生长量随时间变化不大。伐后13年,中径阶林木的生长出现较大分化,累积断面积在0.4 ~ 0.6处的林木累积生长量较少,而累积断面积0.6 ~ 0.8处的树木对林分生长的贡献高于平均水平。各择伐样地伐后5年的GDC分别为:−0.135、−0.132、−0.037,轻度和中度择伐样地表现出较强的负生长优势,强度择伐样地无明显生长优势。随着伐后时间的推移,轻度择伐样地负生长优势逐渐减弱,且伐后10 ~ 13年衰减较为明显。中度择伐样地在伐后10年表现出极强的负生长优势(GDC = −0.257),小径阶林木对林分生长有极高的贡献率,随后在伐后13年开始衰退(GDC = −0.166),但林分仍表现出较强的负生长优势。图2显示强度择伐样地伐后10年的生长优势曲线接近1∶1线,说明各径阶生长状况接近。与对照样地相比,择伐后生长优势系数普遍降低为负值,说明择伐能够极大的促进林分非优势木的生长。
表 3 伐后5 ~ 13年全林分及不同树种组生长优势系数Table 3. Growth dominance coefficient of whole stand and different tree species groups during 5−13 years after thinning择伐强度
Thinning intensity全林分 Whole stand 耐荫树种 Shade-tolerant tree species 不耐荫树种 Shade-intolerant tree species 伐后5年5 years
after thinning伐后10年10 years
after thinning伐后13年13 years
after thinning伐后5年5 years after thinning 伐后10年10 years
after thinning伐后13年13 years
after thinning伐后5年5 years
after thinning伐后10年10 years
after thinning伐后13年13 years
after thinning对照 Control 0.059* 0.073* 0.031 0.066* 0.072* 0.047 0.029 −0.005 −0.026 轻度 Light −0.135* −0.122* −0.070* −0.120* −0.068* −0.045 −0.182* −0.210* −0.092* 中度 Medium −0.132* −0.257* −0.166* −0.136* −0.130* −0.081* −0.182* −0.308* −0.224* 强度 Heavy −0.037 −0.044 −0.057* −0.008 −0.011 −0.012 −0.082* −0.094* −0.110* 注:* 代表不同样地生长优势系数与0差异显著(P < 0.05)。Note:* means that the growth dominance coefficient is significantly different from 0 (P < 0.05). ![]() 图 2 伐后全林分生长优势曲线变化Figure 2. Change of growth dominance curves of whole stand after thinning
图 2 伐后全林分生长优势曲线变化Figure 2. Change of growth dominance curves of whole stand after thinning2.2.2 择伐对林分耐荫树种生长优势的影响
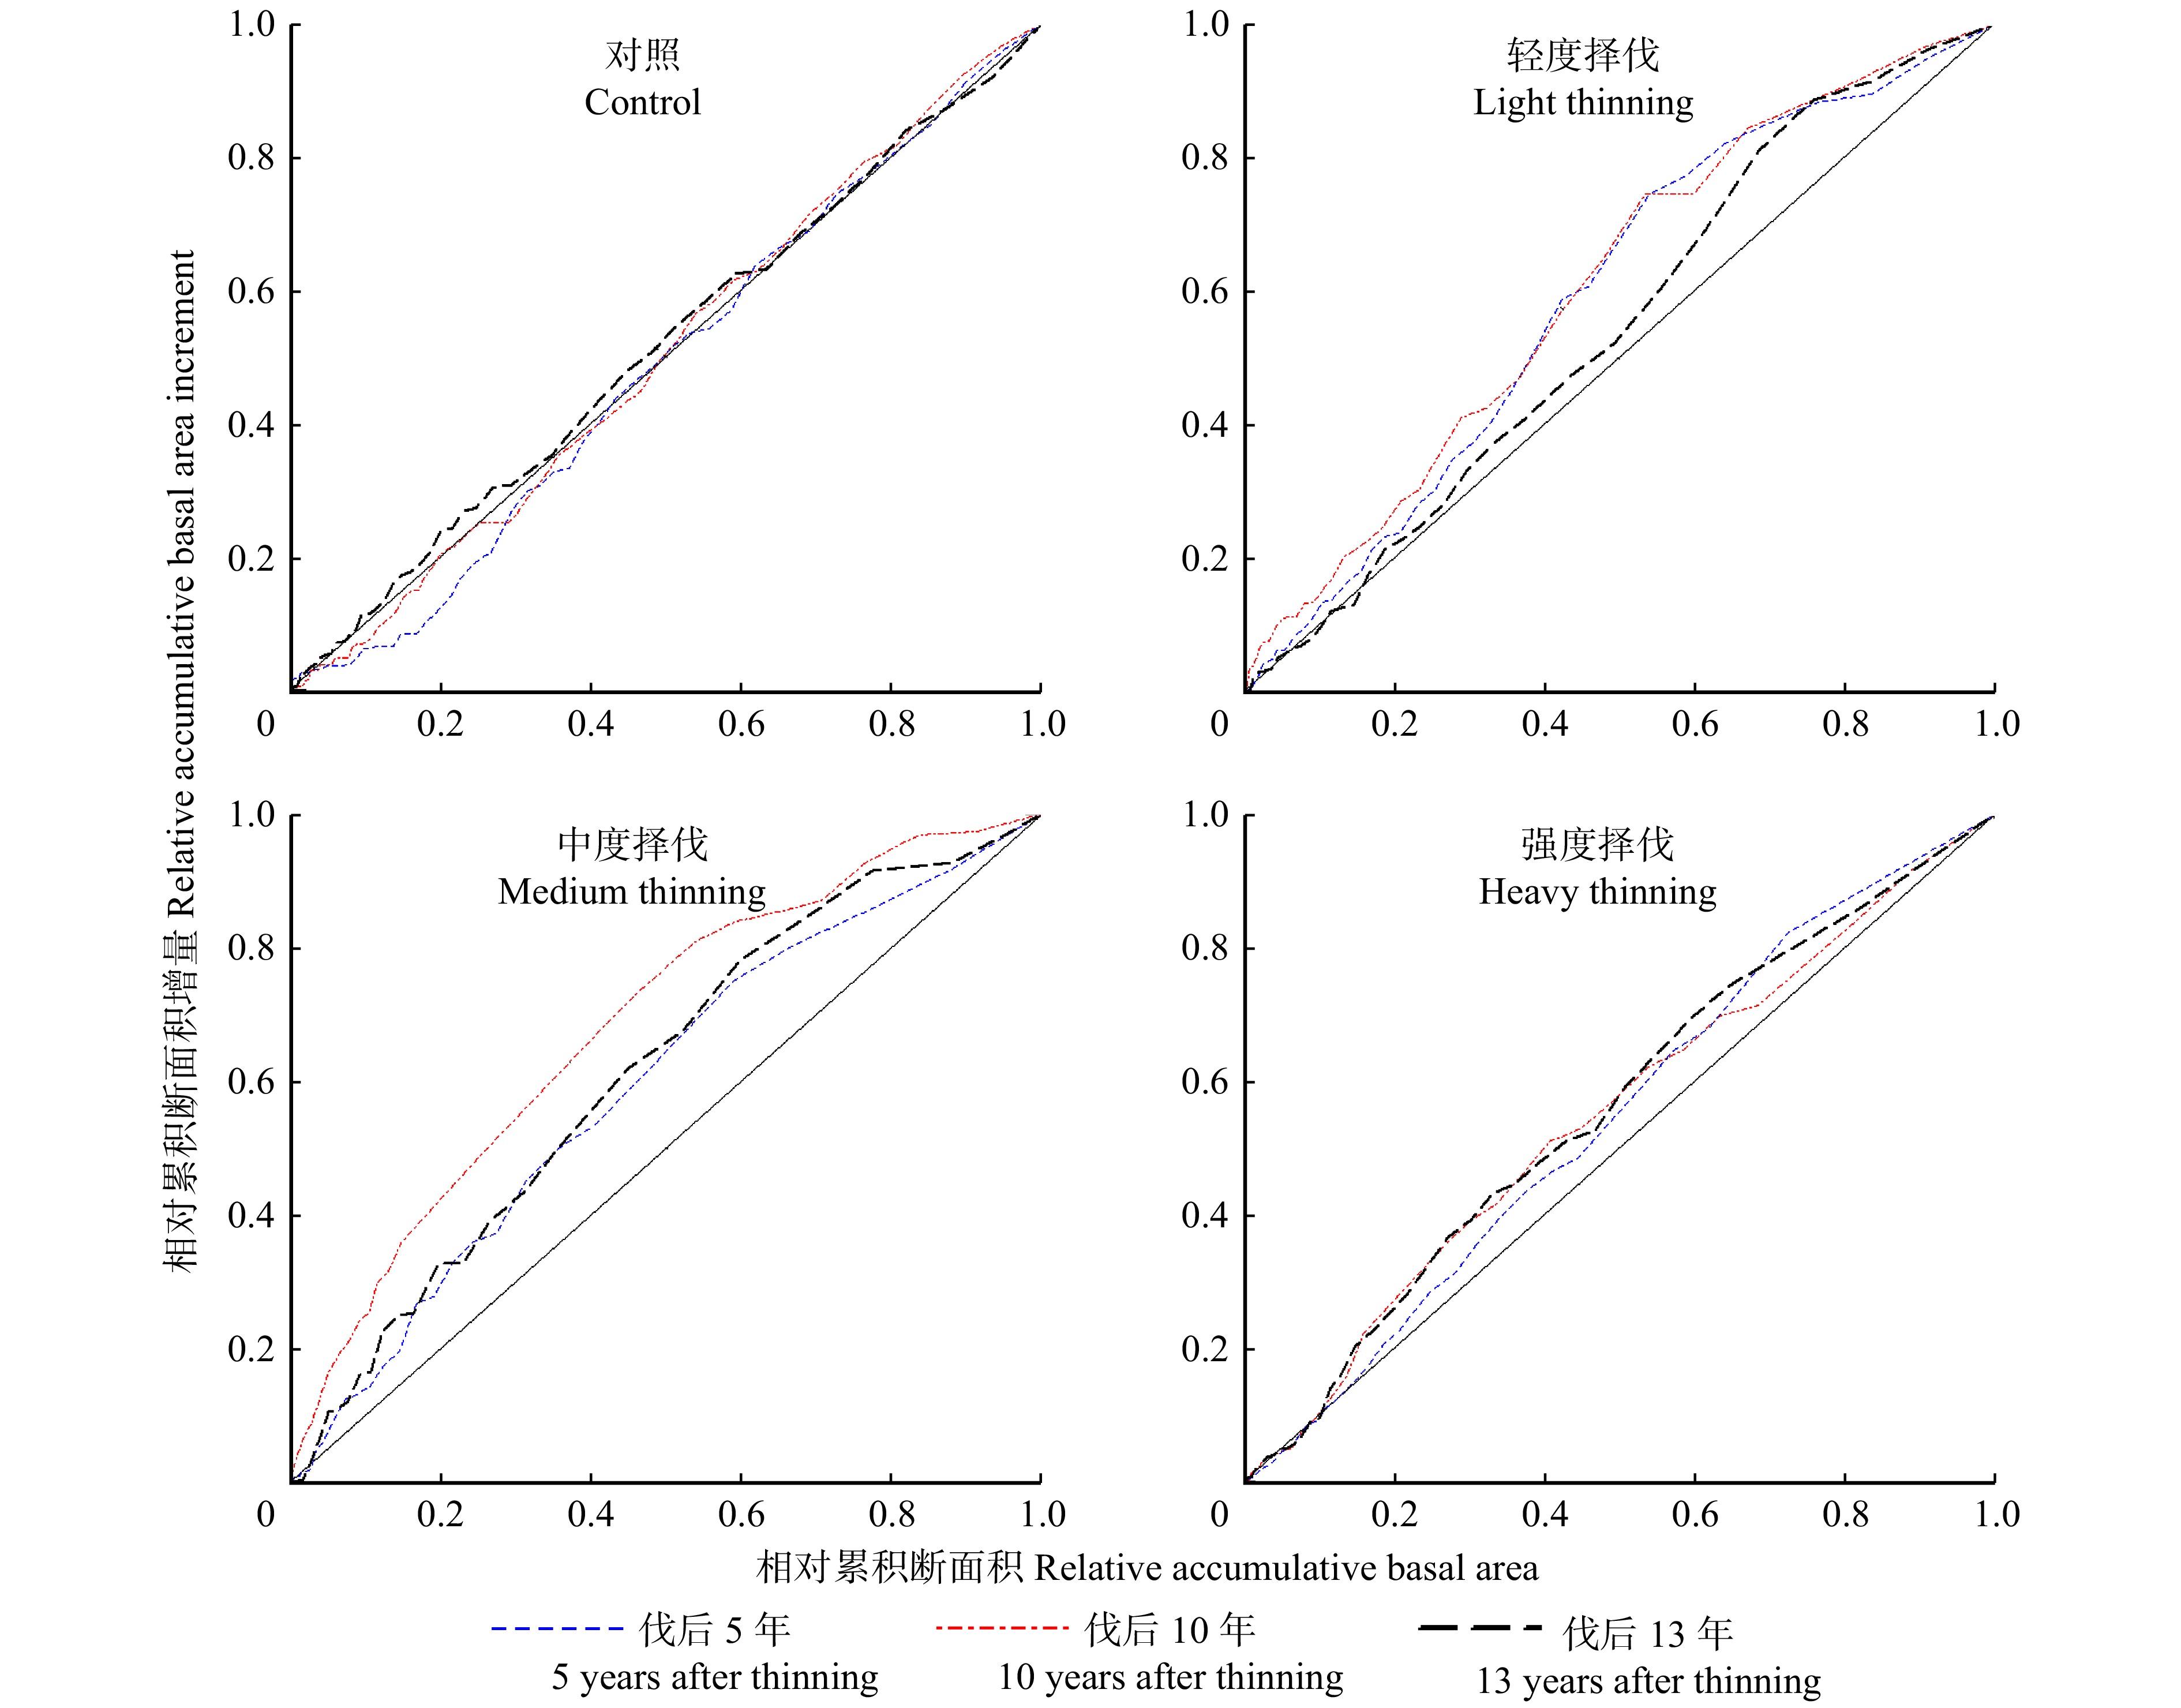
耐荫树种生长优势曲线的变化见图3,在对照样地林分内,耐荫树种生长优势曲线的变化趋势基本与全林分相同。轻度择伐样地内耐荫树种的生长优势系数分别为−0.12、−0.068、−0.045,生长优势曲线显示虽然非优势木(累积断面积 < 0.8)的累积生长量占比无显著变化,但小径阶处的生长量相对贡献逐渐降低,使得负生长优势有一定程度的减弱。中度择伐样地曲线不同时期的拐点横坐标都位于0.3附近,小径阶林木对林分总生长量有稳定较高的贡献率。强度择伐样地3个时期的生长优势系数分别为−0.008、−0.011、−0.012,生长优势系数与0无显著差异,曲线基本与1∶1线重合,说明各径阶林木的生长状况无明显差异。从整体来看,耐荫树种中小径阶对于中低强度择伐的响应要优于优势木,其伐后表现出更高的相对生长速率,而强度择伐对耐荫树种各径阶树木的促进作用相近。
![]() 图 3 伐后耐荫树种生长优势曲线变化Figure 3. Change of growth dominance curves of shade tolerant tree species after thinning
图 3 伐后耐荫树种生长优势曲线变化Figure 3. Change of growth dominance curves of shade tolerant tree species after thinning2.2.3 择伐对林分不耐荫树种生长优势的影响
对照样地不耐荫树种3个时期的GDC分别为0.029、−0.005、−0.026,生长优势系数虽然逐渐由正值变为负值,但在研究期内始终与0无显著差异。图4生长优势曲线上可以看出优势木的生长贡献率在研究区内维持稳定,小径阶林木总生长量提高是样地生长优势降低的主要原因。轻度择伐样地伐后5年表现出较强的负生长优势(GDC = −0.182),且在伐后10年进一步提高(GDC = −0.210),伐后13年曲线最大凹点上移,虽然非优势木整体累积生长率没有变化,但中小径阶处斜率明显降低,使负生长优势出现一定程度的衰减。中度择伐样地研究期内负生长优势强度同样表现出先提高,后减弱的趋势(GDC值分别为−0.182、−0.308、−0.224)。强度择伐样地下不耐荫树种GDC值分别为−0.082、−0.094、−0.110,呈下降趋势。通过生长优势系数以及曲线表明,相比于全林分和耐荫树种,不耐荫树种对择伐的响应更积极,伐后展现出更强的负生长优势。
![]() 图 4 伐后不耐荫树种生长优势曲线变化Figure 4. Change of growth dominance curves of shade-intolerant tree species after thinning
图 4 伐后不耐荫树种生长优势曲线变化Figure 4. Change of growth dominance curves of shade-intolerant tree species after thinning2.3 择伐对林分直径结构异质性的影响
计算样地不同时期的基尼系数结果见表4。对照样地的基尼系数显示林分的直径结构异质性在研究期内逐渐降低。择伐样地的基尼系数在伐后立即增大,且提高幅度与择伐强度呈正相关。这是由于移除中径阶树木的择伐方式加剧了混交林分直径结构的异质性。各择伐样地林分的基尼系数在伐后5年内均有不同程度下降,分别由0.446、0.474、0.481(轻度、中度、强度)降低为0.436、0.463、0.477,其中轻度和中度择伐样地降低幅度较为明显。轻度择伐样地基尼系数在伐后5 ~ 13年开始提高,表明林分的直径结构异质性逐渐增强。中度择伐样地伐后5 ~ 10年内林分的直径结构异质性水平继续降低,伐后13年基尼系数显示林分直径结构异质性水平逐渐趋于稳定。强度择伐样地伐后始终保持下降趋势。从时间尺度来看,林分直径结构异质性降低的持续时间随择伐强度提高而延长。
表 4 伐前3年至伐后13年林分基尼系数Table 4. Stand Gini coefficients from 3 years before thinning to 13 years after thinning择伐强度
Thinning intensity伐前3年
3 years before thinning伐后当年
That year after thinning伐后5年
5 years after thinning伐后10年
10 years after thinning伐后13年
13 years after thinning对照 Control 0.436 0.429 0.425 0.419 0.417 轻度 Light 0.439 0.446 0.436 0.438 0.443 中度 Medium 0.453 0.474 0.463 0.452 0.451 强度 Heavy 0.455 0.481 0.477 0.469 0.464 3. 讨 论
3.1 择伐对林分生长率的影响
对照样地的林分生长率在研究期内基本维持稳定,择伐样地林分生长率在伐后10年内逐渐提高,均显著大于对照样地,说明择伐能促进林分的生长,择伐强度越强,对林分生长的促进效果越显著。伐后13年数据显示择伐样地林分生长率均出现一定程度衰退,这符合林分的生长规律[22]。择伐能够显著促进林分的生长,但对各树种的影响不同,择伐强度的提高对于林分内耐荫树种的促进作用没有显著差异,但能显著促进林分内不耐荫树种的生长。
3.2 择伐对林分生长优势的影响
对照样地的生长优势系数显示在研究期内林分生长正由大径阶林木主导,择伐样地伐后呈现负生长优势,说明中小径阶树木的伐后生长更迅速,这与Soares等[3]的研究结果一致。由于择伐能够改善非优势木的生长条件[25,27],但通常不会影响优势木的资源获取,因此中小径阶对择伐的反应会比优势木更积极[18]。不同择伐强度对林分生长优势的影响不同,中度择伐样地伐后显示出比轻度择伐更强、更持久的负生长优势,即中度择伐能在更长时间内促进林分小径阶林木的生长。强度择伐样地林分生长率最高,却并未表现出明显的负生长优势。这与Moreau等[19]得出的林分负生长优势随择伐强度增强而提高的结论不同,其原因可能是采伐方式的不同。Moreau等[19]的样地采伐对象为小径级林木,本研究以中径级林木的择伐为主。在该择伐策略下,强度择伐使得林分内大径阶保留木的生长空间及资源条件有了极大的改善,这可能进一步释放了大径阶林木的生长潜力。择伐对于不同树种的促进作用也不尽相同,林分内不耐荫树种伐后表现出比耐荫树种更强的负生长优势,这可能是由于择伐改善了林分内部光环境[28],而林分内不耐荫树种中小径阶林木对林分光照条件的改善更为敏感[19,29],因此对择伐的响应更积极。
3.3 择伐对林分直径结构异质性和竞争的影响
林分的竞争模式,即林分的对称竞争或不对称竞争[30],常用来解释林分的结构异质性和生长优势动态[31-32]。大树能通过高大的树冠及庞大的根系抑制周围小树的资源获取,因此林分的竞争通常是不对称的[30]。各择伐样地伐后的直径结构异质性与生长优势变化一致,伐后林分处于负生长优势状态,基尼系数呈现降低趋势,且持续时间与择伐强度成正比。这说明择伐能够降低林分的不对称竞争,促进中小径阶林木的生长,进而降低林分的直径结构异质性水平[33]。对照样地的直径结构异质性与生长优势的变化并不一致,直径结构异质性水平在研究期内随着林分自疏逐渐降低,样地却始终处于大径阶林木主导生长的正生长优势状态。这说明虽然林分的自然稀疏减少了小径阶林木的数量,一定程度上缓解了林木间的竞争[34],但随着优势个体的竞争能力逐渐增强[4],竞争的不对称程度并没有降低,因此林分内小径阶林木的生长状况没有得到真正改善。
3.4 对营林的意义
林分的资源总量和分配方式能够通过择伐等方式进行人为调整[2],林分的生长优势模式可作为评估择伐有效程度的工具,帮助经营者适当调整采伐策略[16,35]。林分表现出正生长优势时,择伐部分小径阶林木能够降低林分直径结构异质性水平,并使资源集中利用在优势木上,增加林分资源利用率[35]。林分没有表现出生长优势时,任何径阶都可以作为择伐目标而不会降低林分的生长效率,负生长优势下则可以采伐部分优势木,充分发挥林分中小径级的生长潜力[16]。由于不同混交林内树木间复杂的相互作用,不同林分生长优势的发展具有较大的差异[5,35],因此仍需要研究更多类型混交林分伐后生长优势的动态,以加强基于该方法择伐的稳固性。
4. 结 论
本研究采用生长优势与基尼系数分析了不同择伐强度下林分的直径结构异质性和林分生长的动态。研究发现,择伐能够显著促进林分生长,且促进作用与择伐强度呈正相关。轻度和中度择伐对林分中小径阶林木的生长促进作用优于大径阶林木。不耐荫树种中小径阶对择伐的反应更敏感,伐后普遍展现出比耐荫树种更强的负生长优势。中小径阶主导的林分生长能够逐渐降低林分直径结构异质性。生长优势能够有效分析各林木对林分生长的贡献情况,帮助经营者适当调整采伐策略。当经营目的为收获木材时,高强度择伐以及伐除林分内生长贡献较低的耐荫树种优势木能够最大化林分生产力,而当经营策略为天然林的恢复时,轻度择伐以及对林内中大径阶落叶松的择伐能够较好促进云冷杉幼树的生长,加速伐后林分朝东北初级植被的正向演替。
-
![]()
图 2 伐后全林分生长优势曲线变化
Figure 2. Change of growth dominance curves of whole stand after thinning
![]()
图 3 伐后耐荫树种生长优势曲线变化
Figure 3. Change of growth dominance curves of shade tolerant tree species after thinning
![]()
图 4 伐后不耐荫树种生长优势曲线变化
Figure 4. Change of growth dominance curves of shade-intolerant tree species after thinning
表 1 云冷杉林固定样地情况及采伐强度(1997年)
Table 1 Statistic of spruce-fir fixed sample plots and thinning intensity (1997)
样地号 Sample
plot No.择伐强度 Thinning
intensity/%伐后蓄积 Volume after
thinning/m3伐后郁闭度/(m3·hm−2) Canopy density after thinning/(m3·ha−1) 平均胸径
Mean DBH/cm林分密度/(株·hm−2)
Stand density /(tree·ha−1)伐后树种组成 Species composition
after thinning伐前 Before thinning 伐后 After thinning 伐前 Before thinning 伐后 After thinning 1 0 335 0.9 19.8 19.8 1105 1105 5AN3PJ2P 2 21 246 0.7 23.9 23.2 1055 810 7AN2P1PJ 3 27 218 0.7 21.2 20.4 835 645 5AN3P2PJ 4 36 184 0.6 23.2 22.5 760 540 6AN2P1PJ1C 注:AN表中代表冷杉,PJ代表云杉,P代表红松,C 代表阔叶树。Notes: AN stands for Abies nephrolepis; PJ stands for Picea jezoensis; P stands for Pinus koraiensis; C stands for broadleaved trees.  下载: 导出CSV
表 2 伐后5 ~ 13年林分生长率
Table 2 Stand periodical annual increment during 5−13 years after thinning
% 择伐强度
Thinning intensity全林分 Whole stand 耐荫树种 Shade-tolerant tree species 不耐荫树种 Shade-intolerant tree species 伐后5年5 years
after thinning伐后10年10 years
after thinning伐后13年13 years
after thinning伐后5年5 yearsafter thinning 伐后10年10 years
after thinning伐后13年13 years
after thinning伐后5年5 years
after thinning伐后10年10 years
after thinning伐后13年13 years
after thinning对照 Control 2.18 ± 0.17a 2.05 ± 0.14a 2.00 ± 0.15a 2.30 ± 0.09a 2.14 ± 0.13a 2.27 ± 0.19a 1.79 ± 0.14a 1.88 ± 0.20a 1.67 ± 0.20a 轻度 Light 2.62 ± 1.9ab 2.91 ± 0.15b 2.23 ± 0.20ab 2.92 ± 0.16b 3.03 ± 0.23b 2.32 ± 0.21a 2.18 ± 0.14a 2.23 ± 0.09b 2.02 ± 0.18ab 中度 Medium 2.85 ± 0.18b 3.00 ± 0.23bc 2.72 ± 0.17b 2.73 ± 0.18ab 3.28 ± 0.19b 2.78 ± 0.29a 2.91 ± 0.30bc 3.25 ± 0.19c 2.70 ± 0.16b 强度 Heavy 3.39 ± 0.34c 3.42 ± 0.26c 2.68 ± 0.21b 3.24 ± 0.25b 3.07 ± 0.21b 2.58 ± 0.32a 3.65 ± 0.27c 3.62 ± 0.21c 2.91 ± 0.14b 注:表中数值为平均值 ± 标准差。不同字母之间差异显著(P < 0.05)。Notes: the values in this table are mean ± standard deviation. Different letters mean significant difference (P < 0.05).
下载: 导出CSV
表 3 伐后5 ~ 13年全林分及不同树种组生长优势系数
Table 3 Growth dominance coefficient of whole stand and different tree species groups during 5−13 years after thinning
择伐强度
Thinning intensity全林分 Whole stand 耐荫树种 Shade-tolerant tree species 不耐荫树种 Shade-intolerant tree species 伐后5年5 years
after thinning伐后10年10 years
after thinning伐后13年13 years
after thinning伐后5年5 years after thinning 伐后10年10 years
after thinning伐后13年13 years
after thinning伐后5年5 years
after thinning伐后10年10 years
after thinning伐后13年13 years
after thinning对照 Control 0.059* 0.073* 0.031 0.066* 0.072* 0.047 0.029 −0.005 −0.026 轻度 Light −0.135* −0.122* −0.070* −0.120* −0.068* −0.045 −0.182* −0.210* −0.092* 中度 Medium −0.132* −0.257* −0.166* −0.136* −0.130* −0.081* −0.182* −0.308* −0.224* 强度 Heavy −0.037 −0.044 −0.057* −0.008 −0.011 −0.012 −0.082* −0.094* −0.110* 注:* 代表不同样地生长优势系数与0差异显著(P < 0.05)。Note:* means that the growth dominance coefficient is significantly different from 0 (P < 0.05).
下载: 导出CSV
表 4 伐前3年至伐后13年林分基尼系数
Table 4 Stand Gini coefficients from 3 years before thinning to 13 years after thinning
择伐强度
Thinning intensity伐前3年
3 years before thinning伐后当年
That year after thinning伐后5年
5 years after thinning伐后10年
10 years after thinning伐后13年
13 years after thinning对照 Control 0.436 0.429 0.425 0.419 0.417 轻度 Light 0.439 0.446 0.436 0.438 0.443 中度 Medium 0.453 0.474 0.463 0.452 0.451 强度 Heavy 0.455 0.481 0.477 0.469 0.464
下载: 导出CSV
-
[1] Binkley D. A hypothesis about the interaction of tree dominance and stand production through stand development[J]. Forest Ecology and Management, 2004, 190(2−3): 265−271. doi: 10.1016/j.foreco.2003.10.018
[2] Bradford J B, Amato A W D, Palik B J, et al. A new method for evaluating forest thinning: growth dominance in managed Pinus resinosa stands[J]. Canadian Journal of Forest Research, 2010, 40(5): 843−849. doi: 10.1139/X10-039
[3] Soares A A V, Leite H G, Cruz J P, et al. Development of stand structural heterogeneity and growth dominance in thinned Eucalyptus stands in Brazil[J]. Forest Ecology and Management, 2017, 384: 339−346. doi: 10.1016/j.foreco.2016.11.010
[4] 杨桂娟, 胡海帆, 孙洪刚, 等. 林分年龄、造林密度和林分自然稀疏对杉木人工林个体大小分化和生产力关系的影响[J]. 林业科学, 2019, 55(11): 126−136. doi: 10.11707/j.1001-7488.20191114 Yang G J, Hu H F, Sun H G, et al. The influence of stand age, planting density and self-thinning on relationship between size inequality and periodic annual increment in Chinese fir (Cunninghamia lanceolata) plantations[J]. Scientia Silvae Sinicae, 2019, 55(11): 126−136. doi: 10.11707/j.1001-7488.20191114
[5] Fernández M E, Tschieder E F, Letourneau F, et al. Why do Pinus species have different growth dominance patterns than Eucalyptus species? A hypothesis based on differential physiological plasticity[J]. Forest Ecology and Management, 2011, 261(6): 1061−1068. doi: 10.1016/j.foreco.2010.12.028
[6] Binkley D, Kashian D M. Tree-level patterns of lodgepole pine growth and leaf area in Yellowstone National Park: explaining anomalous patterns of growth dominance within stands[J]. Ecosystems, 2015, 18(2): 251−259. doi: 10.1007/s10021-014-9823-z
[7] 刘泰瑞, 董威, 覃志杰, 等. 不同间伐强度对华北落叶松人工林竞争关系的影响[J]. 森林与环境学报, 2019, 39(2): 153−158. Liu T R, Dong W, Qin Z J, et al. Analysis of characteristics of north China larch plantations’ competitive relationship and its driving factors[J]. Journal of Forest and Environment, 2019, 39(2): 153−158.
[8] 马履一, 李春义, 王希群, 等. 不同强度间伐对北京山区油松生长及其林下植物多样性的影响[J]. 林业科学, 2007, 43(5): 1−9. doi: 10.3321/j.issn:1001-7488.2007.05.001 Ma L Y, Li C Y, Wang X Q, et al. Effects of thinning on the growth and the diversity of undergrowth of Pinus tabulaeformis plantation in Beijing Mountainous Areas[J]. Scientia Silvae Sinicae, 2007, 43(5): 1−9. doi: 10.3321/j.issn:1001-7488.2007.05.001
[9] Forrester D I, Elms S R, Baker T G. Tree growth-competition relationships in thinned Eucalyptus plantations vary with stand structure and site quality[J]. European Journal of Forest Research, 2013, 132(2): 241−252. doi: 10.1007/s10342-012-0671-0
[10] Forrester D I. Linking forest growth with stand structure: tree size inequality, tree growth or resource partitioning and the asymmetry of competition[J]. Forest Ecology and Management, 2019, 447: 139−157. doi: 10.1016/j.foreco.2019.05.053
[11] 吴建强, 王懿祥, 杨一, 等. 干扰树间伐对杉木人工林林分生长和林分结构的影响[J]. 应用生态学报, 2015, 26(2): 340−348. Wu J Q, Wang Y X, Yang Y, et al. Effects of crop tree release on stand growth and stand structure of Cunninghamia lanceolate plantation[J]. Chinese Journal of Applied Ecology, 2015, 26(2): 340−348.
[12] 贾忠奎, 公宁宁, 姚凯, 等. 间伐强度对塞罕坝华北落叶松人工林生长进程和生物量的影响[J]. 东北林业大学学报, 2012, 40(3): 5−7. doi: 10.3969/j.issn.1000-5382.2012.03.002 Jia Z K, Gong N N, Yao K, et al. Effects of thinning intensity on the growth and biomass of Larix principis-rupprechtii plantation in Saihanba[J]. Journal of Northeast Forestry University, 2012, 40(3): 5−7. doi: 10.3969/j.issn.1000-5382.2012.03.002
[13] Pretzsch H, Dieler J. The dependency of the size-growth relationship of Norway spruce (Picea abies [L.] Karst.) and European beech (Fagus sylvatica [L.]) in forest stands on long-term site conditions, drought events, and ozone stress[J]. Trees, 2011, 25(3): 355−369. doi: 10.1007/s00468-010-0510-1
[14] Binkley D, Kashian D M, Boyden S, et al. Patterns of growth dominance in forests of the Rocky Mountains, USA[J]. Forest Ecology and Management, 2006, 236(2−3): 193−201. doi: 10.1016/j.foreco.2006.09.001
[15] Pommerening A, Brzeziecki B, Binkley D. Are long-term changes in plant species composition related to asymmetric growth dominance in the pristine Białowieża forest?[J]. Basic and Applied Ecology, 2016, 17(5): 408−417. doi: 10.1016/j.baae.2016.02.002
[16] Pothier D. Relationships between patterns of stand growth dominance and tree competition mode for species of various shade tolerances[J]. Forest Ecology and Management, 2017, 406: 155−162. doi: 10.1016/j.foreco.2017.09.066
[17] Pothier D. Analysing the growth dynamics of mixed stands composed of balsam fir and broadleaved species of various shade tolerances[J]. Forest Ecology and Management, 2019, 444: 21−29. doi: 10.1016/j.foreco.2019.04.035
[18] Lemire C, Bédard S, Guillemette F, et al. Changes in growth dominance after partial cuts in even- and uneven-aged northern hardwood stands[J/OL]. Forest Ecology and Management, 2020, 466: 118115[2020−12−18]. https://doi.org/10.1016/j.foreco.2020.118115.
[19] Moreau G, Auty D, Pothier D, et al. Long-term tree and stand growth dynamics after thinning of various intensities in a temperate mixed forest[J/OL]. Forest Ecology and Management, 2020, 473: 118311[2020−12−18]. https://doi.org/10.1016/j.foreco.2020.118311.
[20] 杜志, 亢新刚, 包昱君, 等. 长白山云冷杉林不同演替阶段的树种空间分布格局及其关联性[J]. 北京林业大学学报, 2012, 34(2): 14−19. Du Z, Kang X G, Bao Y J, et al. Spatial distribution patterns and associations of tree species during different succession stages in spruce-fir forests of Changbai Mountains, northeastern China[J]. Journal of Beijing Forestry University, 2012, 34(2): 14−19.
[21] Lei X, Lu Y, Peng C, et al. Growth and structure development of semi-natural larch-spruce-fir (Larix olgensis-Picea jezoensis-Abies nephrolepis) forests in northeast China: 12-year results after thinning[J]. Forest Ecology and Management, 2007, 240(1−3): 165−177. doi: 10.1016/j.foreco.2006.12.019
[22] 朱子卉, 杨华, 张恒, 等. 择伐后落叶松云冷杉林直径结构及生长的动态变化[J]. 北京林业大学学报, 2018, 40(5): 55−62. Zhu Z H, Yang H, Zhang H, et al. Dynamic change of larch-spruce-fir mixed stand growth and structure after selective thinning[J]. Journal of Beijing Forestry University, 2018, 40(5): 55−62.
[23] West P W. Calculation of a growth dominance statistic for forest stands[J]. Forest Science, 2014, 60(6): 1021−1023. doi: 10.5849/forsci.13-186
[24] Soares A A V, Scolforo H F, Forrester D I, et al. Exploring the relationship between stand growth, structure and growth dominance in Eucalyptus monoclonal plantations across a continent-wide environmental gradient in Brazil[J/OL]. Forest Ecology and Management, 2020, 474: 118340[2020−12−17]. https://doi.org/10.1016/j.foreco.2020.118340.
[25] Bourdier T, Cordonnier T, Kunstler G, et al. Tree size inequality reduces forest productivity: an analysis combining inventory data for ten European species and alight competition model[J/OL]. PLoS One, 2016, 11(3): e151852[2020−12−18]. https://doi.org/10.1371/journal.pone.0151852.
[26] 孟宪宇. 测树学[M]. 北京: 中国林业出版社, 2006: 73−87, 192. Meng X Y. Forest measurement [M]. Beijing: China Forestry Publishing House, 2006: 73−87, 192.
[27] Prévost M, Dumais D. Shelterwood cutting in a boreal mixedwood stand: 10-year effects of the establishment cut on growth and mortality of merchantable residual trees[J]. Forest Ecology and Management, 2014, 330: 94−104. doi: 10.1016/j.foreco.2014.07.005
[28] 管惠文, 董希斌. 间伐强度对落叶松次生林冠层结构和林内光环境的影响[J]. 北京林业大学学报, 2018, 40(10): 13−23. Guan H W, Dong X B. Influence of thinning intensity on canopy structure and light environment insideLarix gmelinii secondary forest[J]. Journal of Beijing Forestry University, 2018, 40(10): 13−23.
[29] Sakai S. Evolutionarily stable growth of a sapling which waits for future gap formation under closed canopy[J]. Evolutionary Ecology, 1995, 9(4): 444−452. doi: 10.1007/BF01237766
[30] Schwinning S, Weiner J. Mechanisms determining the degree of size asymmetry in competition among plants[J]. Oecologia, 1998, 113(4): 447−455. doi: 10.1007/s004420050397
[31] Fernández-Tschieder E, Binkley D. Linking competition with growth dominance and production ecology[J]. Forest Ecology and Management, 2018, 414: 99−107. doi: 10.1016/j.foreco.2018.01.052
[32] Cordonnier T, Kunstler G. The Gini index brings asymmetric competition to light[J]. Perspectives in Plant Ecology, Evolution and Systematics, 2015, 17(2): 107−115. doi: 10.1016/j.ppees.2015.01.001
[33] Castagneri D, Nola P, Cherubini P, et al. Temporal variability of size-growth relationships in a Norway spruce forest: the influences of stand structure, logging, and climate[J]. Canadian Journal of Forest Research, 2012, 42(3): 550−560. doi: 10.1139/x2012-007
[34] Sun H, Diao S, Liu R, et al. Relationship between size inequality and stand productivity is modified by self-thinning, age, site and planting density in Sassafras tzumu plantations in central China[J]. Forest Ecology and Management, 2018, 422: 199−206. doi: 10.1016/j.foreco.2018.02.003
[35] Doi B T, Binkley D, Stape J L. Does reverse growth dominance develop in old plantations of Eucalyptus saligna?[J]. Forest Ecology and Management, 2010, 259(9): 1815−1818. doi: 10.1016/j.foreco.2009.05.031
-
期刊类型引用(6)
1. 郜昌建,王海龙,徐森,张小伟. 3种天然阔叶混交林林木物种和大小分化多样性与地形的耦合关系. 东北林业大学学报. 2025(02): 16-24 .  百度学术
百度学术
2. 兰倩,陈绍志,李婷婷. 采伐对森林发展的影响. 林业科技通讯. 2024(01): 11-16 . 百度学术
3. 栾宜通,李念森,乔璐靖,琚存勇,蔡体久,孙佩丽. 云冷杉红松林优势树种生态位、种间联结及群落稳定性. 植物研究. 2024(05): 753-762 . 百度学术
4. 刘丽,郭韦韦,柳晓东,王平,白洁,赵恩全,温晖,周大猷,胡晓生,张志刚,李明. 基于择伐的云冷杉天然林结构动态研究. 西北农林科技大学学报(自然科学版). 2024(12): 39-50 . 百度学术
5. 黄春晖,白天道,李远发,黄厚宸,郑党斌,蒋维昕. 细叶云南松林大径木择伐后的遗传多样性动态及小尺度空间遗传结构. 中南林业科技大学学报. 2023(10): 60-69 . 百度学术
6. 陆乾. 不同间伐强度对杉木人工林林分生长质量的影响. 乡村科技. 2023(21): 99-101 . 百度学术
其他类型引用(6)


计量
- 文章访问数: 765
- HTML全文浏览量: 257
- PDF下载量: 166
- 被引次数: 12
