
Fine root spatial distribution and morphology of triploid Populus tomentosa-wheat agroforestry system under wide- and narrow-row spacing planting schemes
-
摘要:目的 探讨宽窄行栽植模式下毛白杨−小麦复合系统中的细根根长密度(FRLD)分布及形态特征,为优化该系统的集约栽培措施提供了理论依据。方法 在宽窄行栽植模式下的4年生三倍体毛白杨−小麦复合系统中,于小麦收获后,采取根钻法在3株平均标准木周围进行根系取样,取样位点为窄行距树75 cm、树行距树75 cm、宽行距树100、200、300、400 cm,取样深度为80 cm,共取得根样288个。对所有样品进行形态扫描和烘干称质量,得到不同深度、位点处的毛白杨和小麦细根的分布及形态数据。结果 垂直方向上,毛白杨和小麦的细根均主要聚集在0 ~ 20 cm的浅土层,其中FRLD分别占总根长密度的68%和45%。毛白杨(R2 = 0.679 3,P < 0.05)和小麦(R2 = 0.922 9,P < 0.05)细根均随土层指数递减;两个物种的FRLD在浅土层没有显著差异(P > 0.05),在深土层中则表现出小麦的FRLD显著高于毛白杨的特征(P < 0.05)。水平方向上,毛白杨细根主要聚集在窄行的浅土层中,而小麦细根则在宽行中大量分布。二维根系分布结果显示,毛白杨和小麦有各自的细根密集分布区域且总体上互不干涉。毛白杨的平均细根直径显著高于小麦(P < 0.05),其比根长则显著低于小麦(P < 0.05)。结论 在宽窄行栽植模式下的三倍体毛白杨−小麦复合系统中,毛白杨和小麦的细根分布产生了空间分离,密集分布区域重叠较少;此外,为了更有效地吸收土壤资源以占据竞争优势,小麦会生产更多吸收效率更高的细根。以上结果可为优化该栽植模式下农林复合系统的集约经营技术提供理论支撑。Abstract:Objective To provide a theoretical basis for optimizing the intensive management technology in Populus tomentosa-wheat agroforestry system under wide- and narrow-row spacing planting schemes, the distribution and morphological characteristics of fine root length density (FRLD) in this system were studied.Method In a four-year-old triploid P. tomentosa-wheat agroforestry system under wide- and narrow-row spacing planting schemes, a soil coring method was adopted for root sampling around three average standard trees after wheat harvest. The sampling locations were 75 cm away from tree lines for narrow row and 75 cm away from trees for tree row, while 100, 200, 300, and 400 cm away from tree lines for the wide row, sampling depth was 80 cm. A total of 288 root samples were obtained. All fine root samples were scanned, dried and weighed to obtain the distribution and morphological data in different depths and horizontal distances.Result Vertically, the fine roots of P. tomentosa and wheat were mainly concentrated in the shallow soil layer. The FRLD in 0–20 cm soil layer accounted for 68% and 45% of the total FRLD, respectively. The FRLD decreased exponentially with depth for both P. tomentosa (R2 = 0.679 3, P < 0.05) and wheat (R2 = 0.922 9, P < 0.05). There was no significant difference in FRLD between the two species in the shallow soil layer (P > 0.05). However, in the deep soil layer, the FRLD of wheat was significantly higher than that of P. tomentosa (P < 0.05). Horizontally, fine roots of P. tomentosa were mainly concentrated in narrow row and tree row, while fine roots of wheat were widely distributed in wide row. On a two-dimensional scale, two species had their own dense distribution zones of fine roots and did not interfere with each other. The fine root diameter of P. tomentosa was significantly higher than that of wheat, while its specific root length was significantly lower than that of wheat (P < 0.05).Conclusion In P. tomentosa-wheat agroforestry system under wide- and narrow-row spacing planting schemes, the spatial distribution of the fine roots of P. tomentosa and wheat was separated, and the dense distribution area overlapped less. Also, in order to absorb soil resources more effectively and occupy a competitive advantage, wheat would produce more fine roots with higher absorption efficiency. The results can provide a theoretical basis for optimizing the intensive management technology in agroforestry system under this planting schemes.
-
Keywords:
- Populus tomentosa /
- fine root /
- root spatial distribution /
- root competition
-
在实际生产生活中,遥感图像被应用于城市规划、森林状态评估、生态环境监测等诸多领域,并扮演着至关重要的作用[1]。这些应用的主要目的是通过对采集到的遥感图像特征进行提取和分析,准确判断出图像中所包含的主要目标类别,如建筑、森林或湿地等[2]。目前,实现遥感图像分类的有效手段主要是利用计算机技术模拟生物对视觉的感知能力,对遥感图像中每个像素根据特征的异同,如光谱亮度、空间结构特征等,按照某种流程或规则对属性进行自动判别和分类,以实现提取图像中包含地物信息的目标[3]。
在对遥感图像分类早期的研究当中,研究者主要选择手工提取图像特征的方法分类遥感图像,代表性的手工提取方法有HOG(histogram of oriented gradient)、ORB(oriented fast and rotated brief)、SIFT(scale invariant feature transform)[4]等。但是随着图像采集技术的不断发展,遥感图像的获取速度加快、采集图像数量猛增,人工提取出的图像特征本身具有信息量小、有效性低等缺陷,难以满足遥感图像的应用需求[5]。因此,为解决传统的图像分类方法在特征提取分析中存在的速度慢和精度低的问题,机器学习方法被应用到图像特征提取和分析方法中[6]。
近年来,以深度学习为代表的机器学习方法被广泛应用在计算机视觉领域的分类任务中[7]。其中,深度卷积神经网络(convolutional neural network,CNN)使得图像分类效率和准确度具有显著的提高[8]。不同于传统的分类方法,CNN具有局部感知和权值共享的特点。局部感知即CNN每层中的每个神经元只需要从当前层输入图像中提取局部的像素特征,在网络的深层中将这些局部信息合并,从而得到图像的所有特征[9]。2014年,由牛津大学提出的VGGNet[10]在ILSVRC大赛中,取得了当年的最优效果。在此后的ILSVRC大赛中,GoogleNet[11]、ResNet[12]等基于CNN的图像分类框架被提出,不断刷新图像分类的最好效果。近年来,林业科研工作者也将CNN算法用于林业遥感图像的分类任务场景中,如地物分类、森林烟火识别等[13-14]。
虽然基于CNN的算法框架在遥感图像分类任务中效果显著,但由于CNN自身具有局部感知特点,导致每个神经元每次计算都只能感知距离中心位置相当近的像素,无法捕捉长距离全局信息,因此对图像分类的准确率无法进一步提高。2014年,Bahdanau等提出注意力(attention)机制[15],该模型旨在解决在机器翻译任务中,传统网络训练时间过长,难以较好实现并行计算的问题。该模型不仅解决了机器翻译中信息瓶颈的问题,同时缓解了循环神经网络(recurrent neural network, RNN)在长距离依赖中梯度消失的问题。受到了注意力机制在自然语言处理领域应用的启发,Dosovitskiy等[16]在2020年的ICLR会议上提出了vision Transformer(ViT)模型,将注意力机制应用于图像分类识别任务中,该模型能有效提取自然图像自身的长距离依赖(图像结构)信息,并能够有效克服CNN中所存在的传导偏差问题。该模型在多个图像识别基准数据集上达到或超越了其他方法,如在ImageNet[17]上达到88.55%的精度。
相较于自然图像,遥感图像具有整体结构复杂,局部纹理性特征丰富等特性。基于CNN的算法虽然能够捕捉局部纹理,但不具备刻画遥感图像全局结构的能力,因此分类准确度会遇到瓶颈。为了同时有效捕捉图像的整体结构和局部纹理信息,本文提出了一种基于自注意力机制和卷积神经网络的融合模型,即,将自注意力模块嵌入到卷积网络模型中,充分发挥两者的优势,在提取遥感图像局部像素特征的同时关注全局结构信息。此外,引入多头变换机制进一步挖掘图像中丰富且差异化的特征纹理信息。本文的方法能够充分考虑到遥感图像的各类特性,对自然图像的识别技术进行了针对性的优化和改进,从而有效地提升了遥感图像分类的精度和效率。具体来说,本算法框架首先将输入图像分成尺寸相同的像素块(patch)输入模型,然后利用深度卷积网络ResNet50作为主干网络提取深度特征,同时将像素块的位置编码信息与深度特征结合,最后将结合的结果通过多头自注意力模块输出到分类器得到分类结果。为了验证本文算法的有效性,使用RSSCN7、Euro SAT和PatternNet等遥感图像地物识别标准数据集进行试验。以期在提高和保证识别精度的情况下,利用更少的模型参数,实现更快的处理速度,便于实际的应用部署。
1. 基于多头自注意力的遥感图像分类算法框架
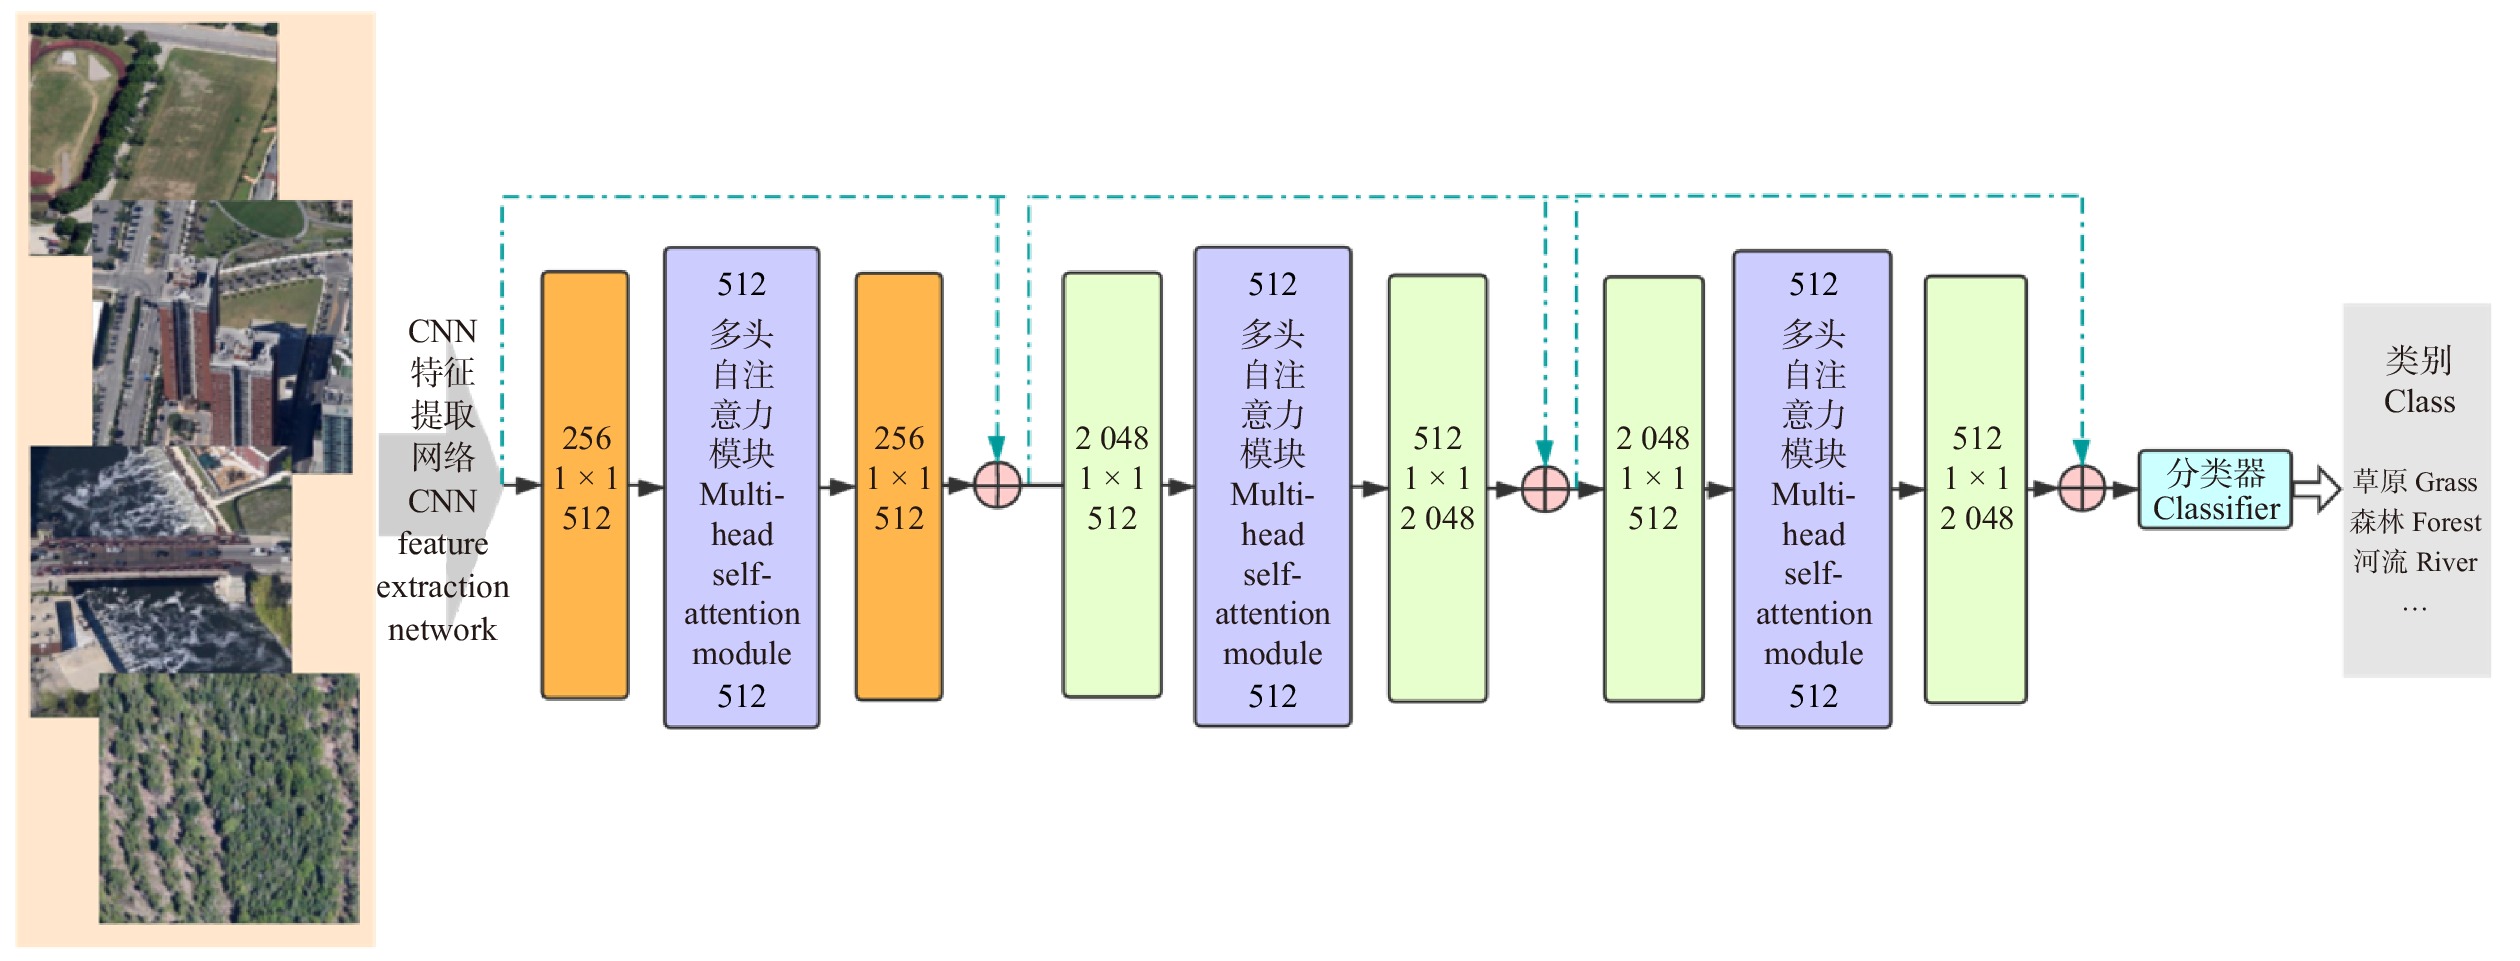
由于基于CNN的算法框架在图像纹理特征提取上具有优越性能,故本算法采用具有残差模块的CNN模型框架ResNet作为主干网络,将前3个卷积网络模块作为特征提取器,在第4个模块中的3个瓶颈层嵌入多头自注意力模块以聚焦全局结构信息。受助于CNN特征提取网络和多头自注意力模块,本框架可以准确感知图像中局部和全局信息,进一步提高遥感图像分类的准确度。本文算法整体结构如图1所示。
1.1 多头自注意力模块
多头自注意力模块由Vaswani等在2017年的NIPS会议上提出,且基于该模块搭建的多头自注意力网络在机器翻译任务上取得了先进的结果并达到了更快的训练速度[18]。故本算法将多头自注意力网络模块应用于遥感图像分类任务,旨在捕捉遥感图像复杂的全局信息。多头自注意力模块主要包括5个关键子模块,分别是位置编码、缩放点积注意力、连接操作、全连接层、归一化连接结构(图2)。
(1)位置编码
位置编码为编码器根据图像特征中的相对与绝对位置信息,通过编码获得的图像特征位置信息。
位置编码有正余弦位置编码、学习位置向量和相对位置表达等方式,本研究提出的网络框架采用的是正余弦位置编码方式。在该方式中,编码时使用频率不同的正弦函数与余弦函数,运算过程如公式(1)、(2)所示:
PE(pos,2i)=sin(pos/10002i/dmodel) (1) PE(pos,2i+1)=cos(pos/10002i/dmodel) (2) 式中:pos为特征区域在图像所在位置信息,i为图像特征矩阵的维度,
dmodel 为位置编码器的输出维度。(2)缩放点积注意力
多头自注意力的输入包含查询向量或矩阵Q(query)、键矩阵K(key)、值矩阵V(value)。在计算机视觉领域中,Q、K、V通常是由图像向量构成的矩阵。Q、K、V首先进入缩放点积注意力模块进行运算,如公式(3)所示。
{\rm{Attention}}\left(\boldsymbol{Q},\boldsymbol{K},\boldsymbol{V}\right)={\rm{Softmax}}\left(\frac{\boldsymbol{Q} \cdot {\boldsymbol{K}}^{{\rm{T}}}}{\sqrt{{d}_{k}}}\right) \cdot \boldsymbol{V} (3) 式中:Attention函数为缩放点积注意力操作。而Softmax函数本质上根据Q计算K中每个键的权重,dk是K中每个键的向量维度,分母中的
\sqrt{{d}_{k}} 主要对权重进行缩放,防止向量维度太高时计算出的点积结果过大。计算得到键的权重向量或矩阵后,与值矩阵相乘得到每个键的最终得分。(3)连接操作
为了增强网络模型捕捉不同结构特征信息的能力,通常会设置多个缩放点积注意力模块,称为多头(multi-head),用m表示,本试验将其值设置为4。其中,每个缩放点积注意力模块计算所得结果称为一个头(head),用h表示。因此,在多头注意力模块需要加入连接操作,整合每个缩放点积注意力模块运算结果。连接操作如公式(4)和(5)所示:
{m}\left(\boldsymbol{Q},\boldsymbol{K},\boldsymbol{V}\right) = {\rm{Concat}}\left({\boldsymbol{h}}_{1},{\boldsymbol{h}}_{2}, \cdots ,{\boldsymbol{h}}_{3}\right) (4) {\boldsymbol{h}}_{1}={\rm{Attention}}\left(\boldsymbol{Q} \cdot {\boldsymbol{W}}_{t}^{Q},\boldsymbol{K} \cdot {\boldsymbol{W}}_{t}^{K},\boldsymbol{V} \cdot {\boldsymbol{W}}_{t}^{V}\right) (5) 式中:t为多头的索引,
{\boldsymbol{W}}_{t}^{\boldsymbol{Q}}{\text{、}}{\boldsymbol{W}}_{t}^{\boldsymbol{K}}{\text{、}}{\boldsymbol{W}}_{t}^{\boldsymbol{V}} 分别为Q、K、V在线性映射运算时对应的参数矩阵,Concat函数表示连接操作。(4)全连接层
将连接操作后得到的结果输入一个全连接层,进行线性映射操作。计算方式如公式(6)所示。
L\left({{x}}'\right)=\boldsymbol{W}{x}'+b (6) 式中:
{{x}}' 为全连接层的输入,W为权重矩阵参数,b为偏差参数。(5)归一化及残差连接
将整个多头注意力模块计算后得到的结果,进行归一化运算,并增加残差模块,以解决深度神经网络的退化问题。
1.2 基于多头注意力的深度残差网络框架
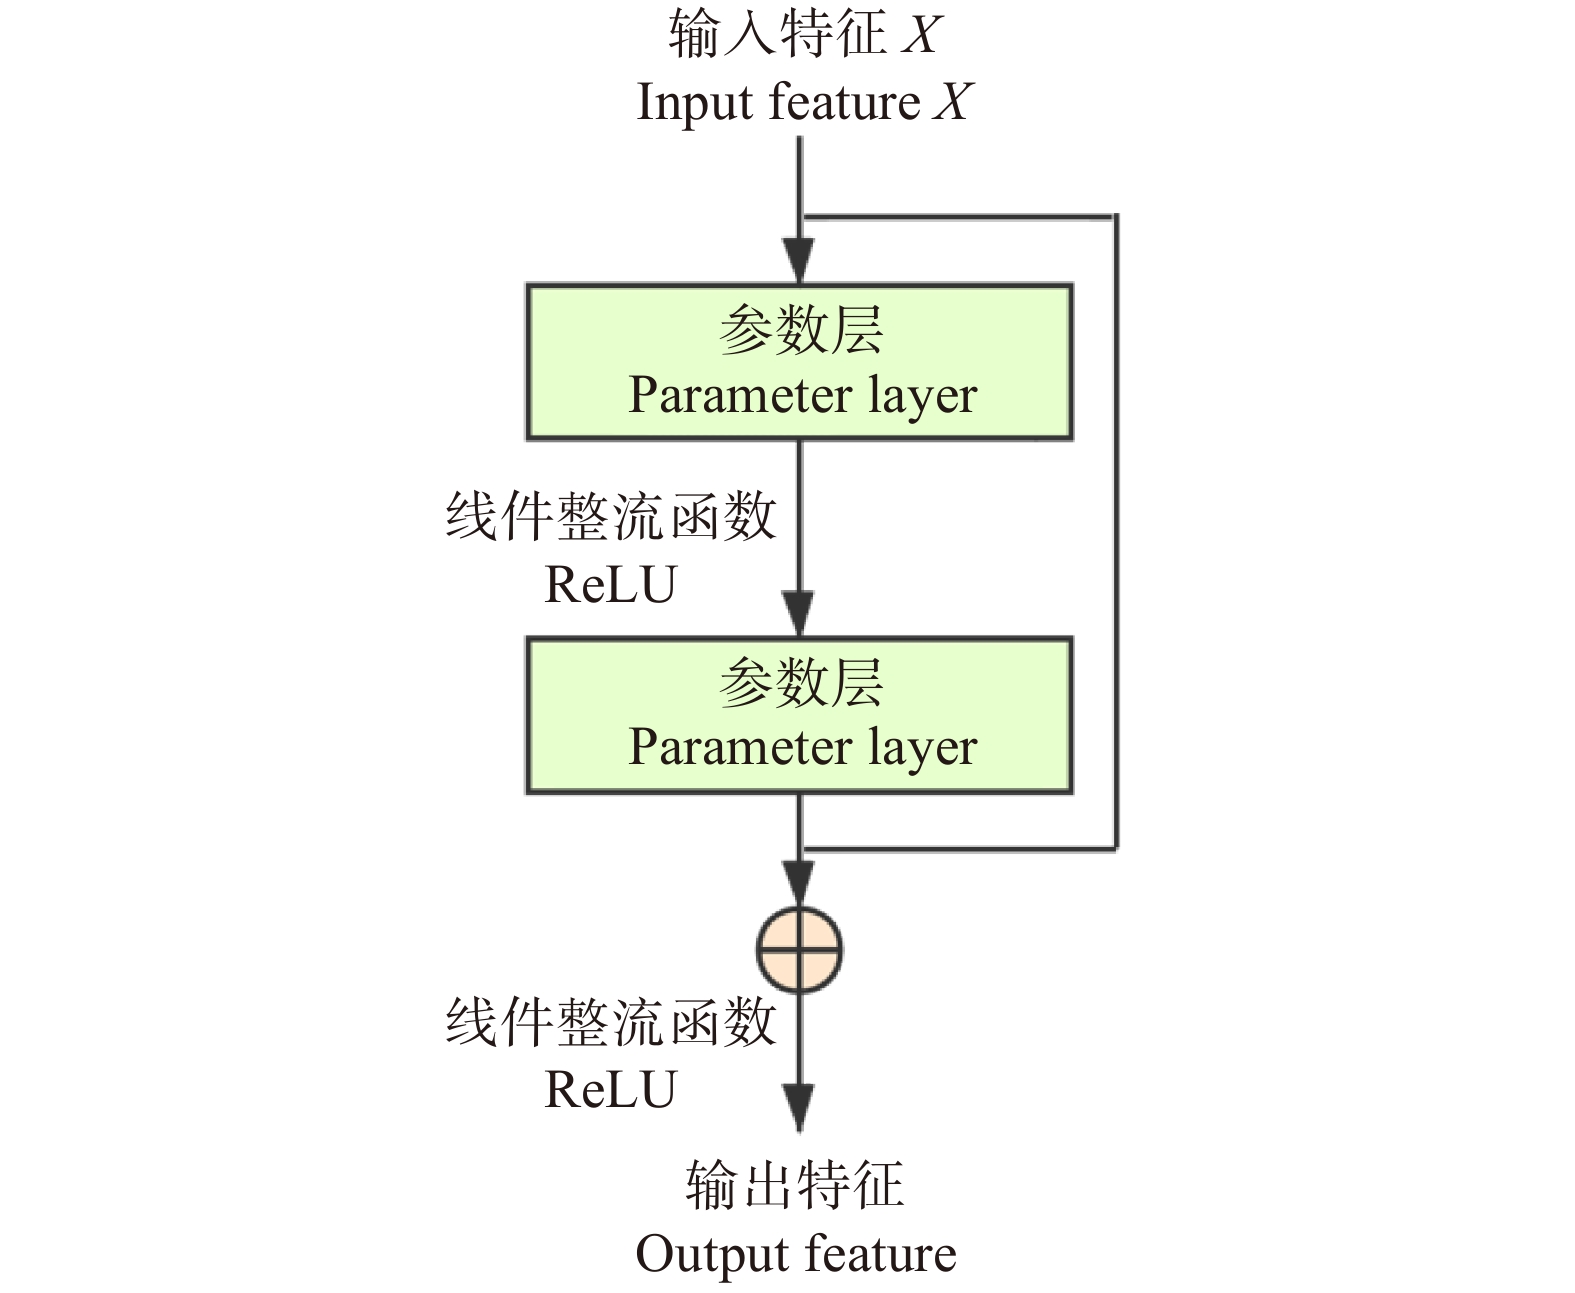
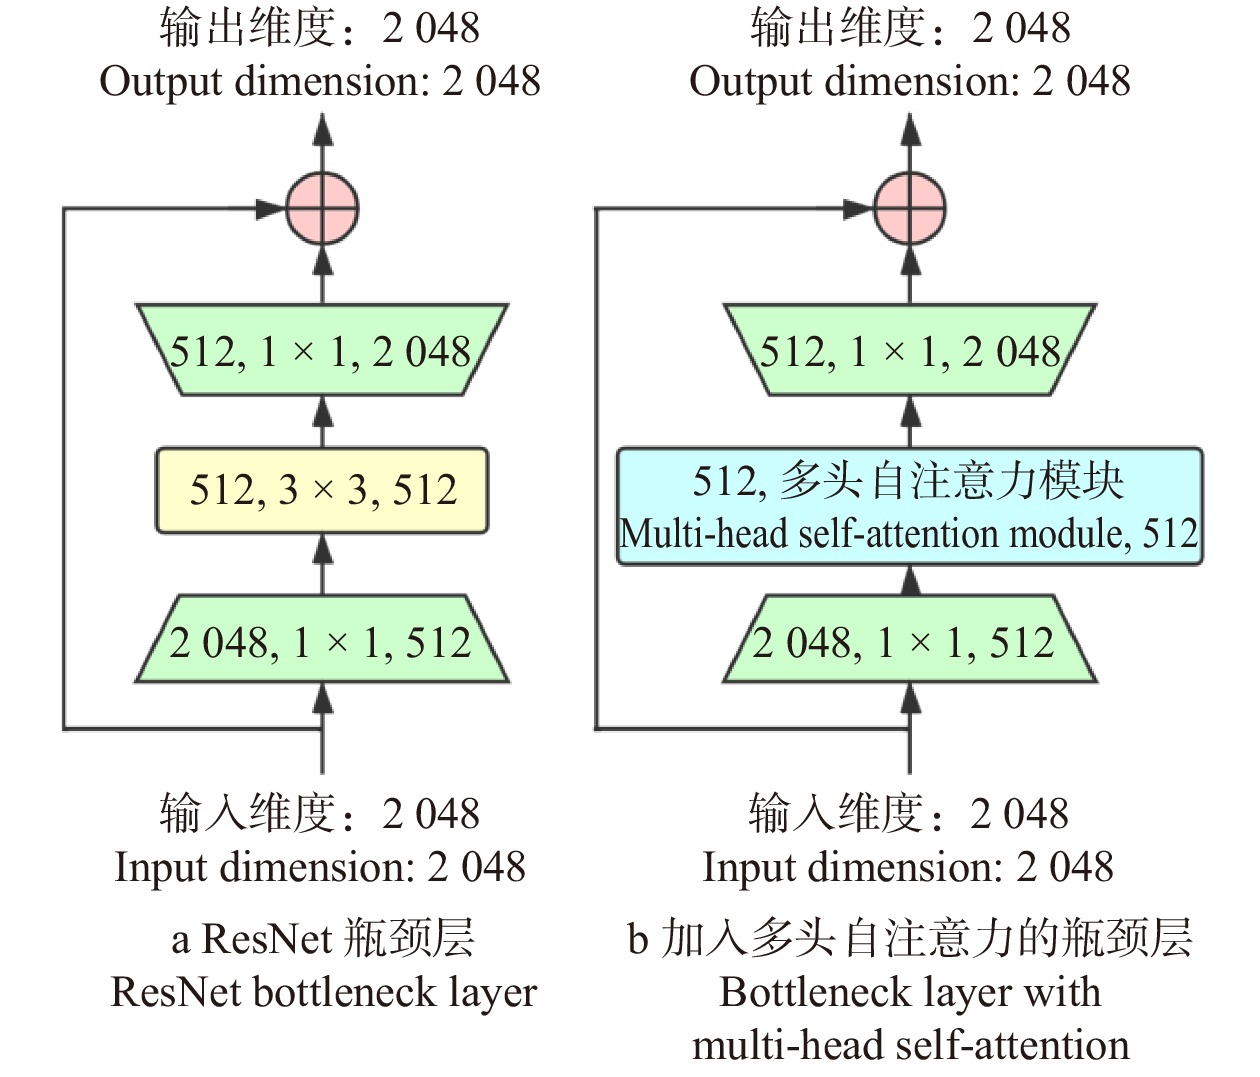
本算法将多头自注意力模块嵌入残差CNN的瓶颈层。框架结构配置见表1,前3个模块与Resnet相同,由残差模块堆叠而成(残差模块示意见图3),区别在于第4模块中所有瓶颈层的中间层由多头自注意力模块替代(见图4)。在试验中,参数初始化采用正态随机生成的方式,旨在使算法对训练所使用的数据集更加敏感,提高算法的分类精度。最后全连接层输出张量大小会根据试验采用的数据集场景类别数量的变化而改变(RSSCN7为7,EuroSAT为10,PatternNet为38)。
表 1 基于多头自注意力模块遥感图像分类框架的结构配置Table 1. Parameter configuration of the proposed framework on multi-head self-attention block模块
Block名称
Name核大小与数量
Kernel size & quantiy步长
Stride重复次数
Repeat time1 卷积
Convolutional7 × 7 × 64 2 1 2 最大池化
Max. pooling3 × 3 2 1 卷积
Convolutional1 × 1 × 64 1 1 3 卷积
Convolutional3 × 3 × 64 2 3 卷积
Convolutional1 × 1 × 256 1 3 4 卷积
Convolutional1 × 1 × 512 1 3 多头自注意力模块
Multi-head self-attention block3 卷积 Convolutional 1 × 1 × 2 048 1 3 平均池化、全连接层、softmax
Average pooling, fully connected layer, softmax注:多头自注意力模块的信息参考图2。Note: The information of multi-head self-attention block refer to Fig. 2. 在训练网络过程中,本研究采用的是交叉熵损失函数(cross entropy loss function)计算该网络在输入的数据集上的损失值(loss),用l表示,其定义式为:
l(x,k)=-\ln\left(\frac{\mathrm{e}\mathrm{x}\mathrm{p}\left(x[k]\right)}{{\Sigma }_{j}\mathrm{exp}\left(x\left[j\right]\right)}\right) (7) 式中:变量x为分类框架中根据输入数据输出的类别预测概率,x是张量,x[j]指的是x的第j维,即输入图像预测为第j类的概率;变量k为输入图像的实际类别。
2. 试验分析
2.1 试验数据
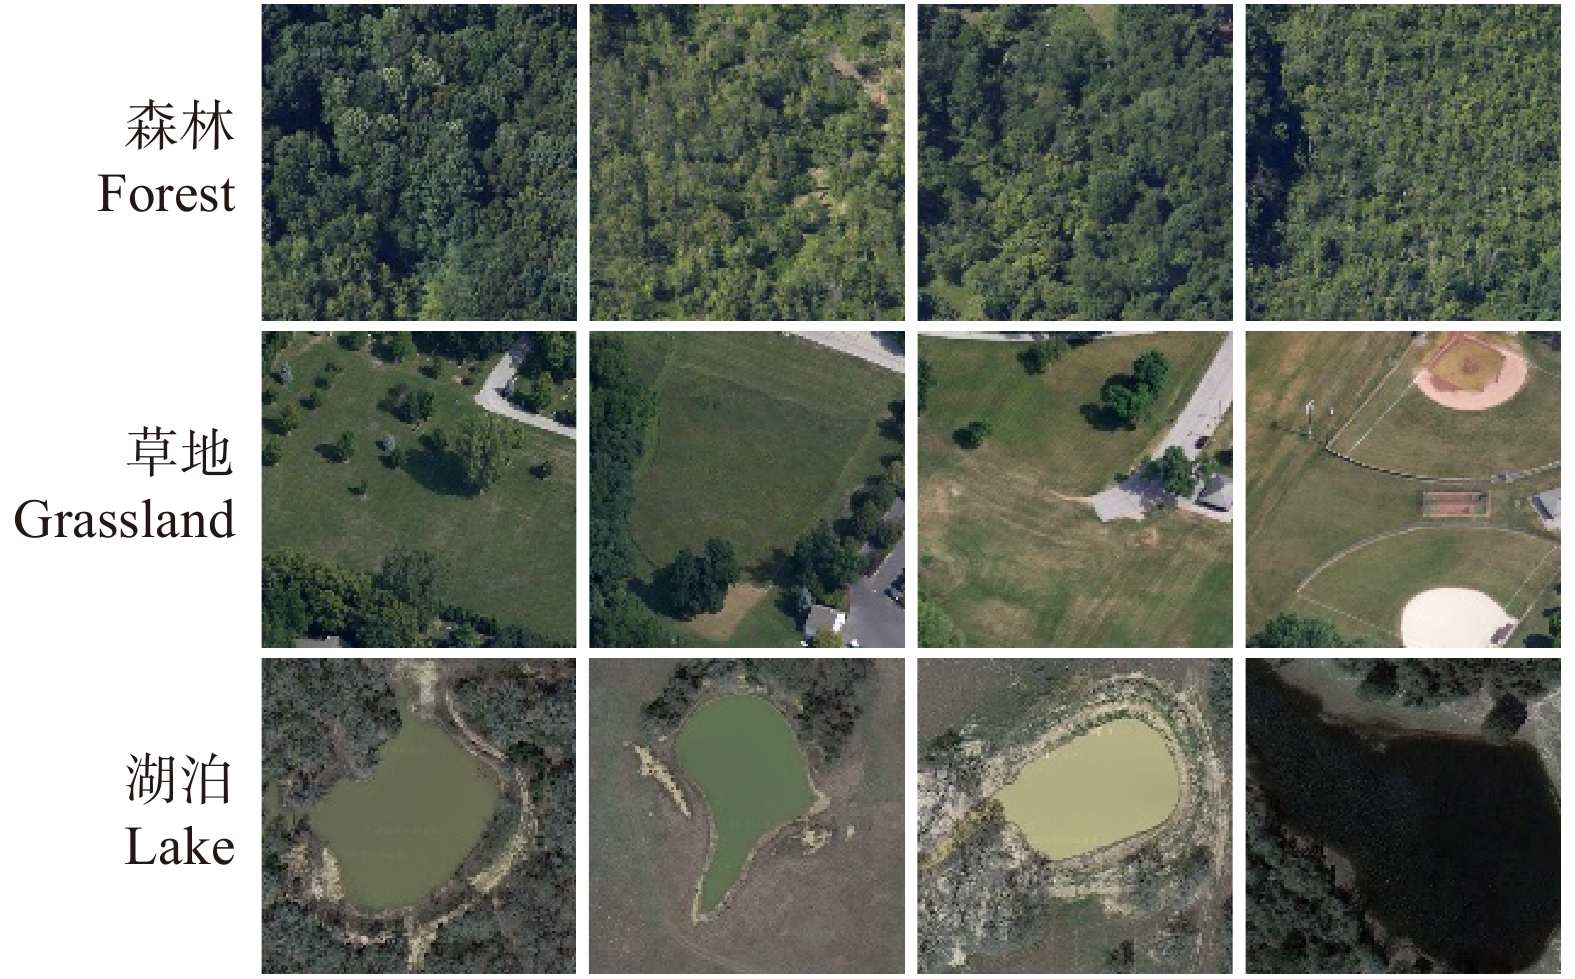
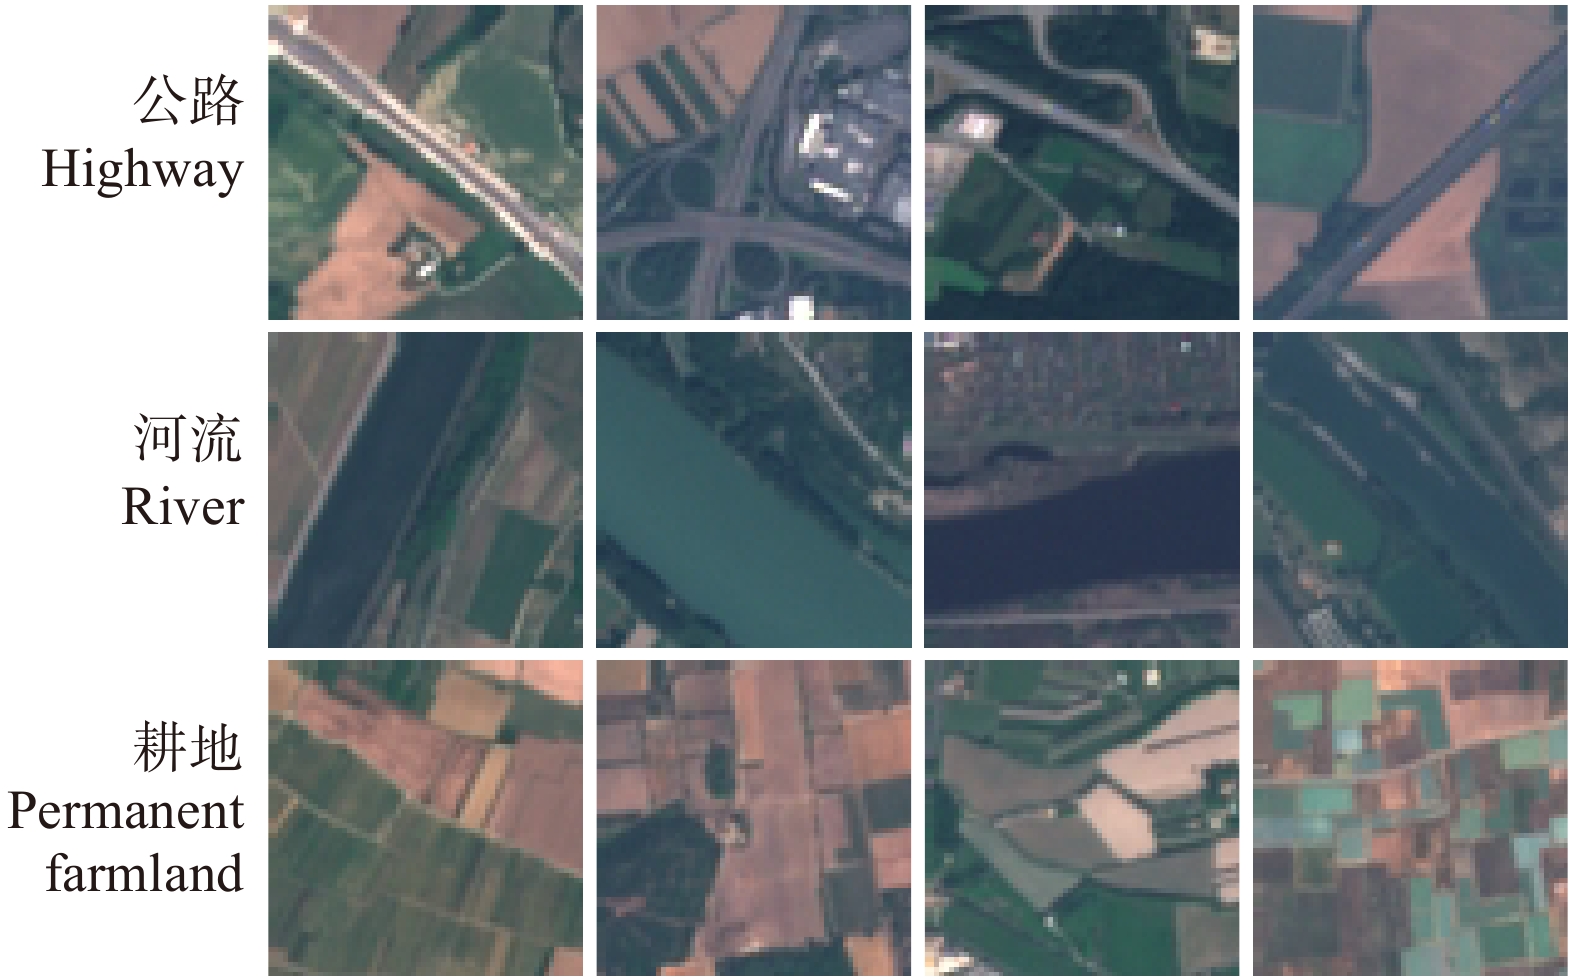
本研究中,将3种目前在遥感图像研究领域广泛使用的数据集作为试验数据,分别为RSSCN7、EuroSAT和PatternNet,已有众多研究工作证明了这些数据集的可用性和有效性[18]。其中,RSSCN7数据集中收集了2 800张遥感图像,包括了遥感图像中的7种场景类别,每一种场景类别共有400张遥感图像,每张图像尺寸大小为400 × 400。这些场景包括草原、森林、工厂、停车场、河流湖泊等。RSSCN7数据集包含的部分遥感图像数据见图5。EuroSAT数据集收集了30 000张遥感图像,包括了遥感图像中10种场景类别,每一种场景类别共有3000张遥感图像,每张图像尺寸大小为64 × 64。EuroSAT数据集包含的部分遥感图像数据见图6。PatternNet包含38个不同类别,每类800张,每张图像的分辨率为256 × 256,共计30 400张。Pattern-Net数据集包含的部分遥感图像数据见图7。
鉴于3个数据集中图像场景类别数目不相等(RSSCN7为7种,EuroSAT为10种,PatternNet为38种),因此,在网络参数训练和精度测试阶段,3个数据集分别单独用于网络的参数训练和精度测试。对于每个数据集,随机抽取70%的数据用于训练,30%的数据用于验证网络分类精度。
在对比试验中,本研究选取了AlexNet[17]、VGGNet、ResNet、ViT等卷积神经网络框架,且有众多研究表明这些卷积神经网络的可行性和有效性。由于部分神经网络对输入图像尺寸具有一定的限制,同时,为了加速试验训练与测试速度,本研究采用图片采样的方式进行数据预处理。通过图像预处理后,RSSCN7和PatternNet数据集图像分辨率为200 × 200,EuroSAT数据集图像分辨率为64 × 64。
本研究所提出的框架在试验过程中主要可分为3个步骤:(1)加载训练好的参数,使用试验采用的数据集的验证数据测试分类效果;(2)修改批次数量大小,对比不同大小对分类效果的影响;(3)测试分类框架的分类速度和参数数量。
2.2 试验环境与参数设置
本研究的所有试验基于PyTorch深度学习框架。程序在Google Colab平台上搭建,使用NVIDIA Tesla P100图形处理器对图像处理流程进行加速。试验中模型优化使用随机梯度下降优化器,其中动量设置为0.9,采用自适应学习速率优化方法,学习率初始值为0.01。最终试验结果选取迭代次数(epoch)为200的模型进行测试。
2.3 试验分析
分类准确度评估。本算法使用RSSCN7、EuroSAT、PatternNet 3个数据集,分别将3个数据集预处理后按照7∶3的比例划分出训练集与验证集。先使用训练集对算法进行参数训练,再使用验证集测试算法的分类效果。为了进一步验证本研究所提出框架的分类有效性与优越性,故增加与现有经典卷积网络以及仅使用多头注意力机制的算法的对比试验。其中,使用的主流卷积网络框架包括AlexNet、VGGNet、ResNet,仅使用多头自注意力模块的网络为ViT。
分类准确度结果见表2,由表可知,本文算法相比目前已有的几种分类框架,在RSSCN7和EuroSAT数据集上得到了最高的分类精度(91.310%,97.877%)。且本研究提出的算法相较于基于ResNet50主干网络的算法,分类准确度也有了明显的提高。在PatternNet数据集上,本文算法分类精度与ResNet50分类准确度接近,但对比ViT分类模型,该框架分类准确度较低。由表2可知,本文算法通过结合卷积神经网络和自注意力机制,能够有效捕捉遥感图像的局部纹理特征和全局结构信息,实现更好的分类精度。本文算法在PatternNet上分类精度不如ViT的原因,可能是PatternNet的样本多含有规则形状的目标,采用分块思想的ViT更能刻画这类信息。
表 2 不同数据集在不同分类算法精度的比较结果Table 2. Comparison of accuracy of different datasets in varied classification frameworks分类框架
Classification framewor分类精度 Classification accuracy/% RSSCN7 EuroSAT PatternNet AlexNet 82.230 91.062 93.697 VGGNet 80.833 90.728 94.118 ResNet50 89.048 94.148 97.697 ViT 89.643 96.111 98.180 使用单头自注意力
Using single-head
self-attention88.143 95.148 97.336 本研究方法
Method used in this study91.310 97.877 97.371 使用消融试验(ablation study)来验证在卷积网络模型中,分别使用自注意力模块和多头自注意力模块替换瓶颈模块是否有助于提升分类准确度。该工作具体做法为用单头自注意力模块和多头自注意力模块分别替换残差卷积网络的瓶颈模块,直接测试对比不同数据集分类准确度。分类准确度见表2。由图可知,相比于未使用自注意力模块的Resnet纯卷积网络消融试验(89.048%、94.148%和97.697%)和采用单头自注意力模块的消融试验(88.143%、95.148%和97.336%),使用多头自注意力模块的本文算法能够得到更高的分类准确度(91.310%、97.877%和97.371%)。
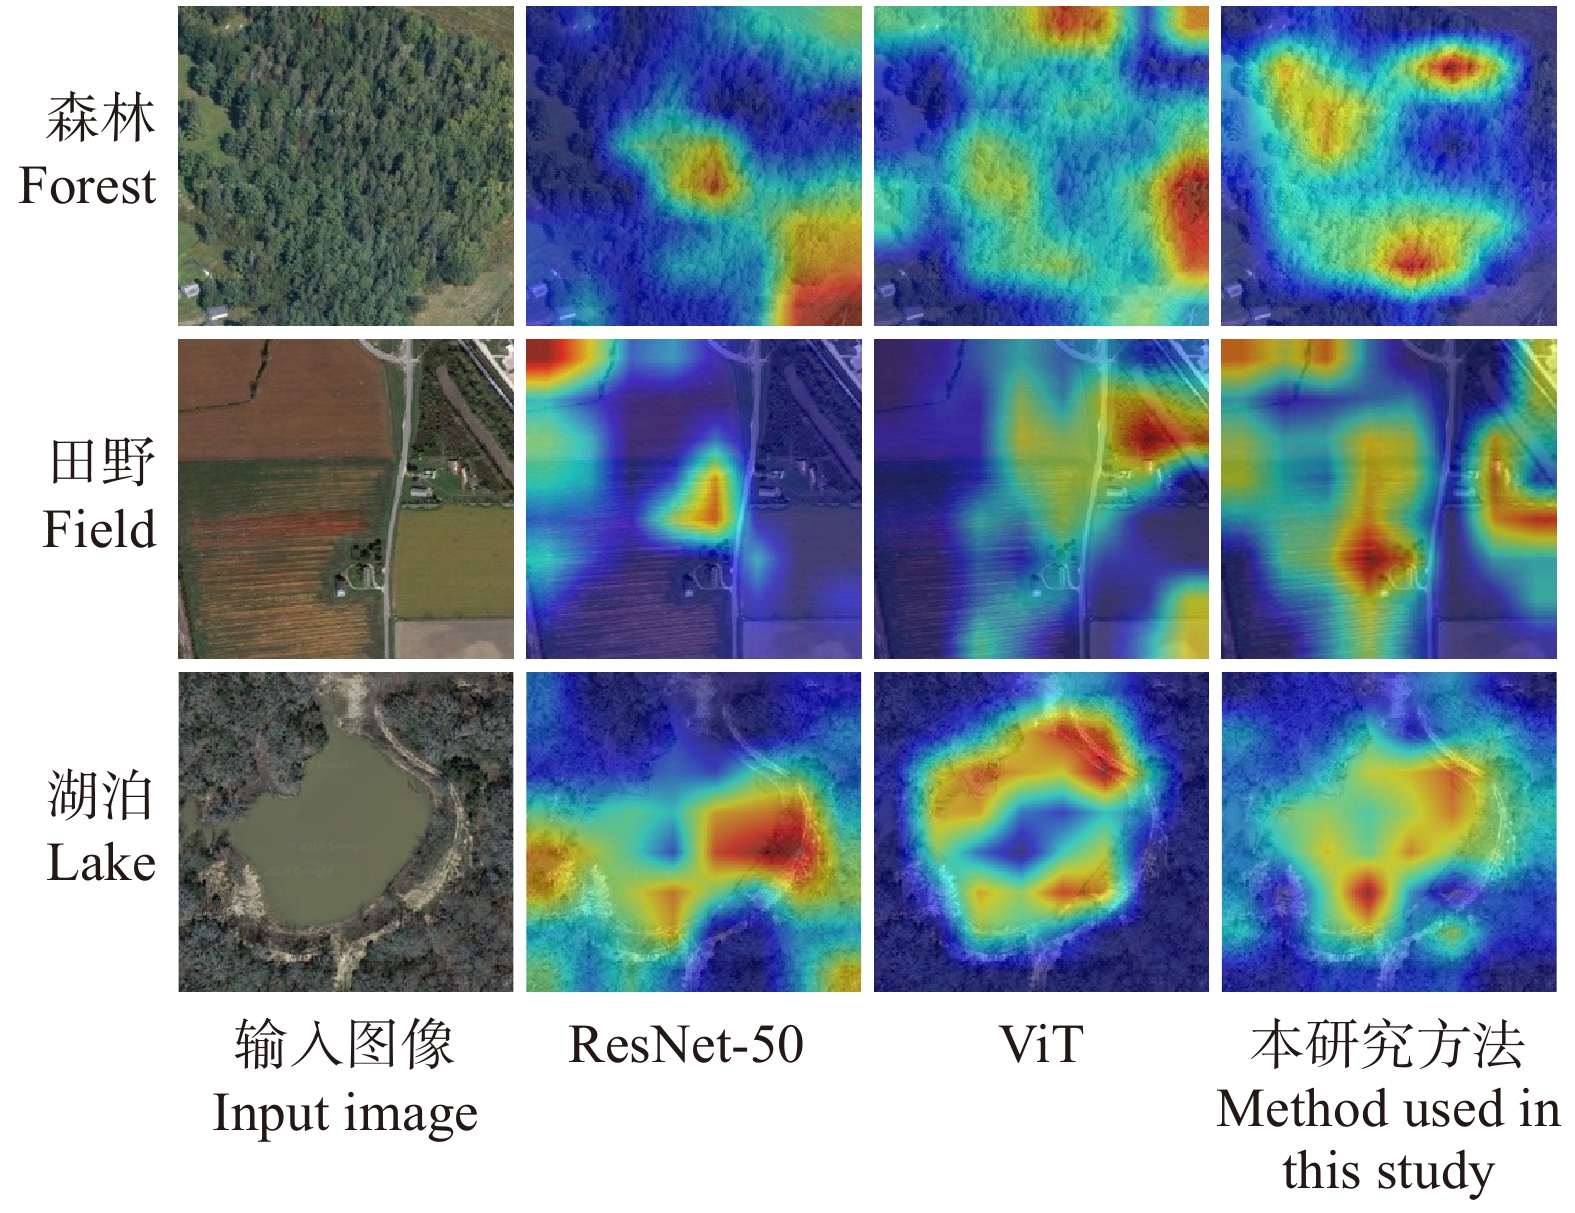
同时,在测试网络效果后,为清晰地对比本文算法框架的效果,对部分分类框架最后1个阶段之后的图像特征对应的加权梯度类激活映射(Grad-CAM)[19]进行可视化。如图8所示,图像中区域的明亮程度代表该区域在分类中所占权重的大小。因此,图8显示出,本文算法能够更加准确地感知到在图像中最具有辨别力的区域,使得分类精度更加准确。
![]() 图 8 不同分类框架对应特征图的Grad-CAMFigure 8. Grad-CAM of feature maps corresponding to different classification frameworks
图 8 不同分类框架对应特征图的Grad-CAMFigure 8. Grad-CAM of feature maps corresponding to different classification frameworks不同训练批次大小测试。在上述精度测试中,每批次输入样本数量(batch size)均为32。为了验证该数值是否可以在训练网络框架时取得最优效果,增加了每批次输入样本数量对提出算法分类效果影响的试验。其中,选取的批次数量大小分别为8、16、32和64,数据集与分类精度测试试验中数据集相同。本文算法在使用不同批次大小分类效果见表3。其中,训练集精度为分类算法用于训练数据集上的正确率,验证集精度则是在算法用于测试数据集上的正确率。
表 3 本研究算法在不同训练批次大小的分类效果Table 3. Classification performance of the proposed framework in different training batch sizes分类框架
Classification
framework样本数量
Batch size分类精度 Classification accuracy/% 训练集 Training set 验证集 Validation set EuroSAT 8 95.162 95.453 16 96.521 96.851 32 97.603 97.877 64 96.143 96.001 RSSCN7 8 90.926 90.532 16 91.237 91.011 32 91.538 91.310 64 91.859 91.137 PatternNet 8 95.947 95.859 16 96.740 96.572 32 98.392 97.371 64 98.593 97.286 由表3中结果可知,当批次数量大小为32时,在各个数据集上分类效果均最优。在训练过程中,当批次数量大小过小时,训练所用时间会变长,且存在严重的梯度震荡,不利于参数的收敛。而参数过大时,参数的梯度方向几乎不会变化,容易陷入局部最优的结果。
算法速度和参数量测试。试验中,算法速度测试分为训练速度测试与分类速度测试两部分。训练速度即使用训练数据集训练模型时参数拟合的速度,本文算法在训练过程中,正确率与损失值随迭代次数变化曲线见图9。由图9可知本算法在PatternNet数据集上收敛速度较快,在EuroSAT数据集上收敛速度较慢。
最后进行本算法运行速度测试,在基于GPU加速的试验环境中,测试了30 400张图像,一共用时345.45 s,平均每秒钟分类88张图像。达到了对遥感图像进行实时分类的标准(高于60帧/s),满足了实际应用中的速度需求。
对算法网络框架各层参数量计算并相加可以求得网络框架中总的参数量。各个分类框架包含的参数数量见表4。其中,本研究提出的分类框架包含了2.08 × 10⁷个参数,ResNet50框架中包含了2.55 × 10⁷个参数。在以ResNet50为主干网络,使用多头自注意力模块替换其中部分结构后,参数量有了明显的降低,减少了显存的开销和运行时的计算量。
表 4 不同分类算法框架包含的参数数量Table 4. Number of parameters contained in different classification frameworks分类框架 Classification framework 参数量 Parameter number AlexNet 6.00 × 10⁷ VGG16 1.33 × 10⁸ ResNet50 2.55 × 10⁷ ViT 2.60 × 10⁷ 本研究方法 Method used in this study 2.08 × 10⁷ 3. 结 论
本研究提出了一种基于改进自注意力模块的遥感图像分类算法。该算法首先使用ResNet50搭建主干网络进行特征提取,然后将ResNet50瓶颈层的中间层替换为多头自注意力模块。试验中采用RSSCN7、EuroSAT、PatternNet等3个公开数据集进行试验,根据试验结果得出以下结论:
(1)本研究算法在3个数据集上平均识别准确率分别达到了91.310%、97.877%和97.371%,优于目前已有的分类框架,体现了本算法的有效性与优越性。
(2)本研究算法的参数量为2.08 × 10⁷,在分类速度上达到了平均每秒分类88张图像,体现了本算法的高效性。
-
![]()
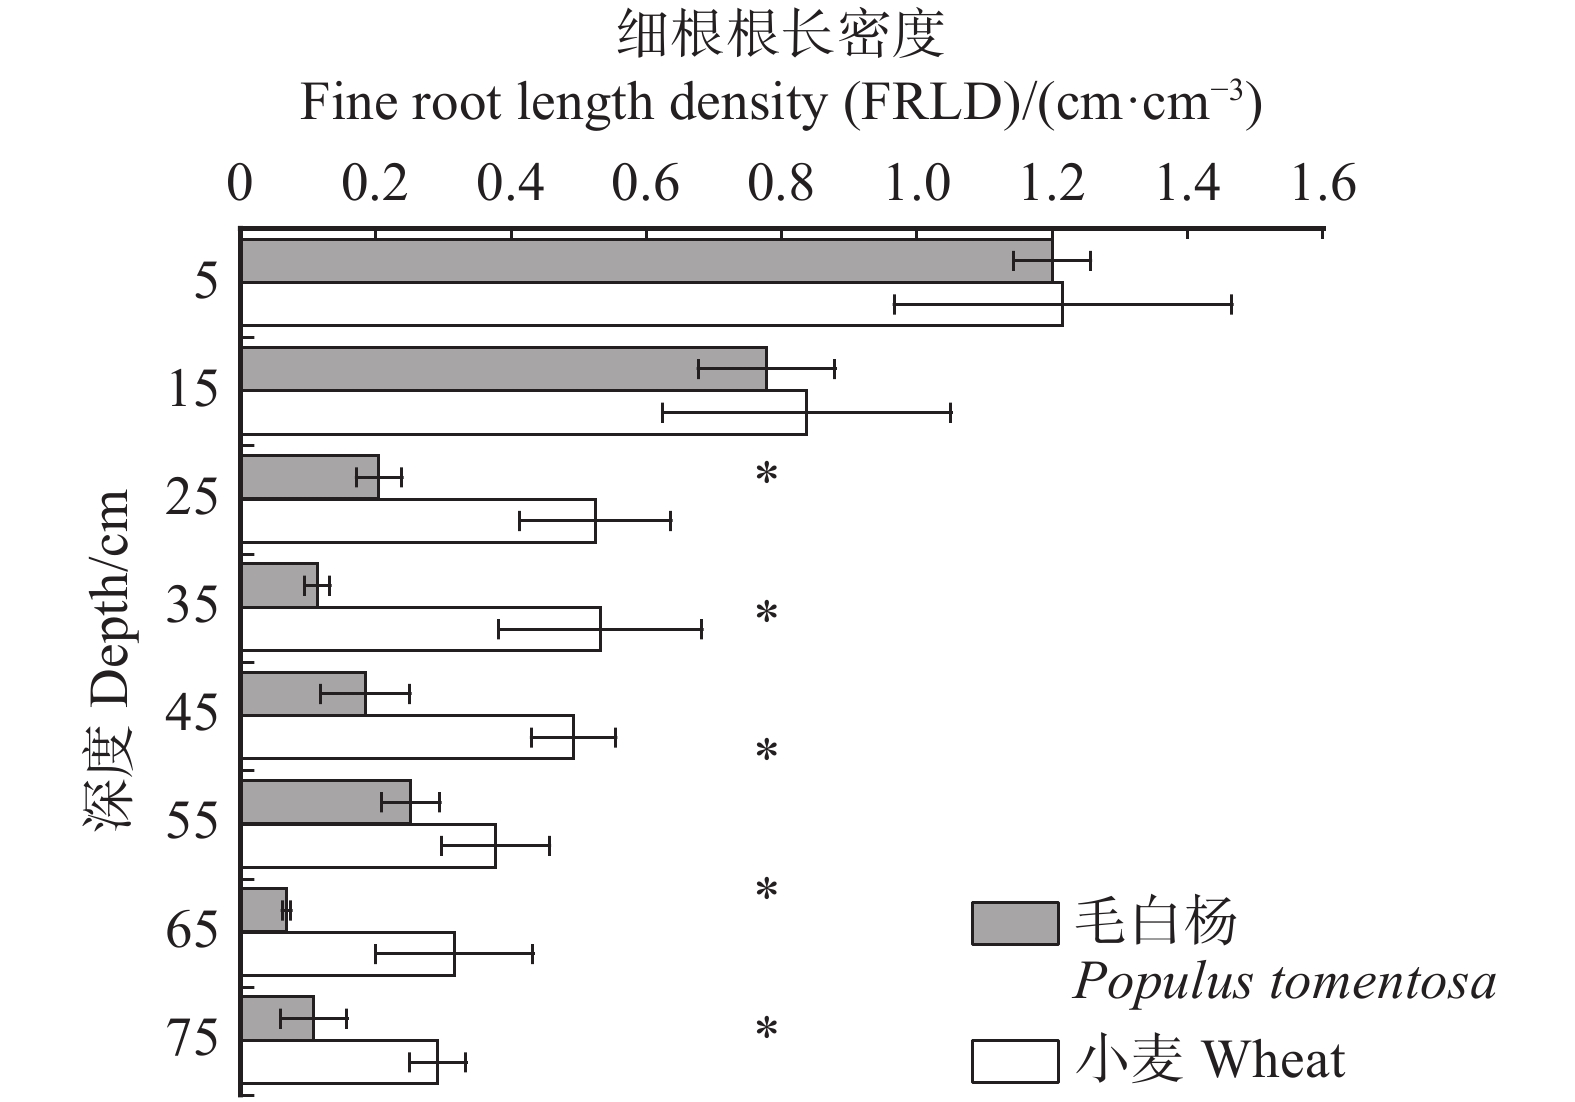
图 2 整个根区范围内毛白杨–小麦复合系统细根根长密度的垂直分布
*表示同一土层内物种间差异显著(P < 0.05),检验方法为T检验。* indicates significant difference between species (P < 0.05), according to the T test.
Figure 2. Vertical distribution of FRLD of P. tomentosa-wheat agroforestry system in the whole root zone
![]()
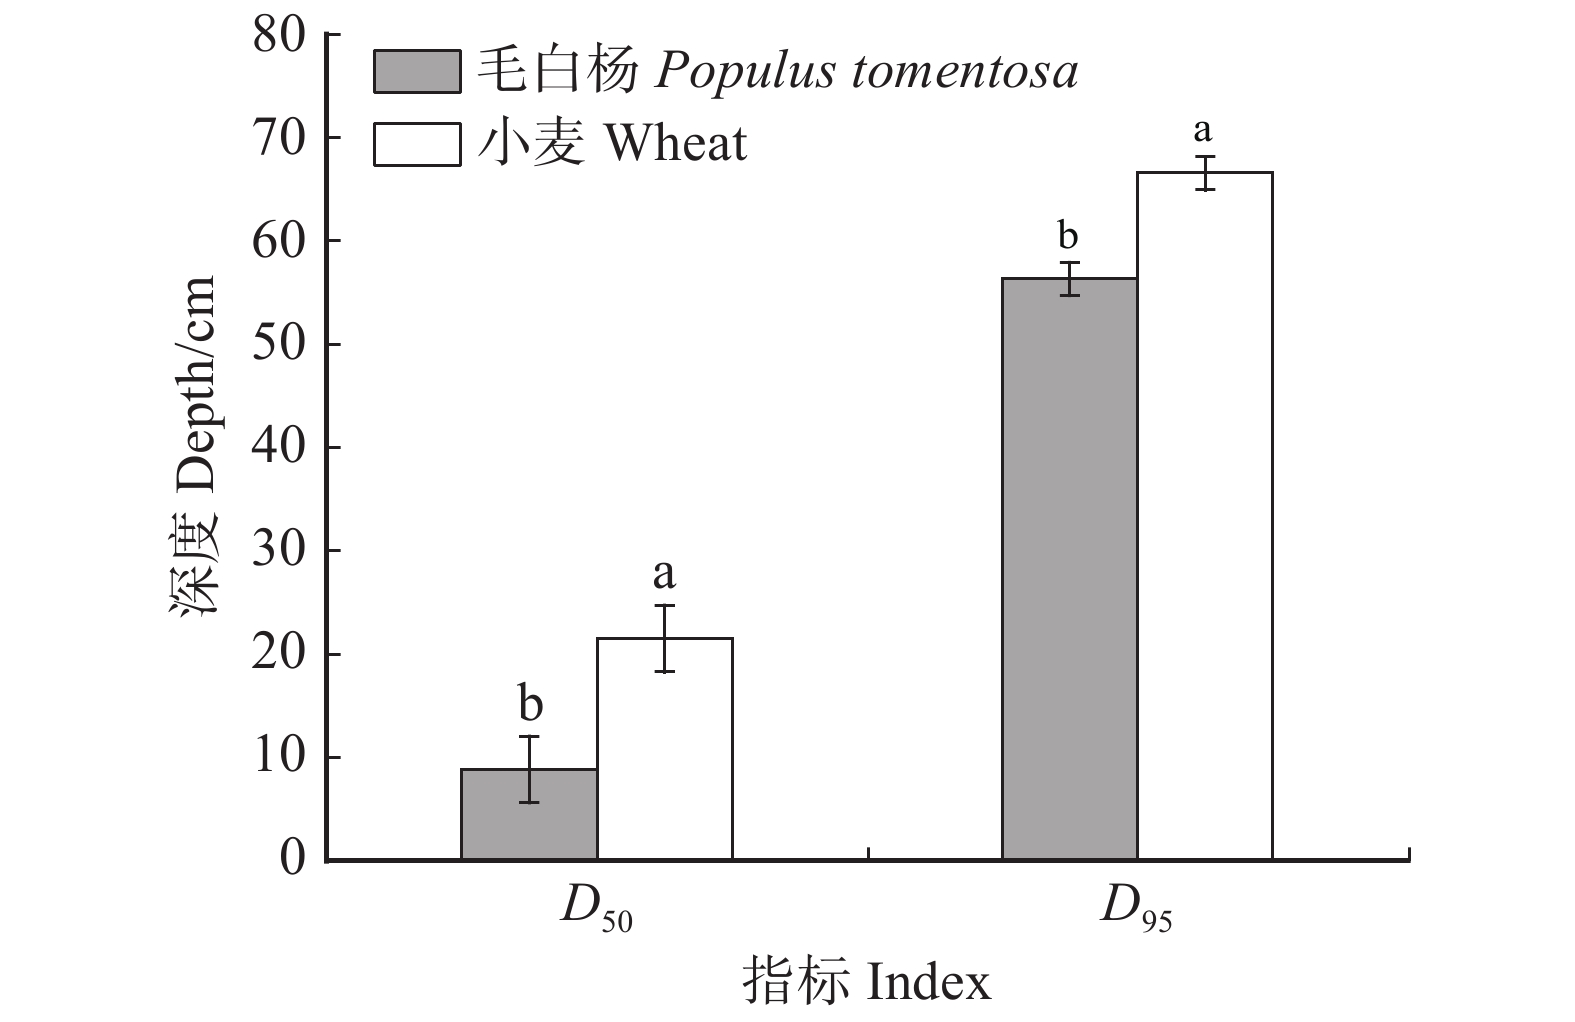
图 3 整个根区范围内毛白杨–小麦复合系统的D50和D95
不同的小写字母表示物种间差异显著(P < 0.05),检验方法为T检验。Different lowercase letters indicate significant difference between species (P < 0.05), according to the T test.
Figure 3. D50 and D95 of P. tomentosa-wheat agroforestry system in the whole root zone
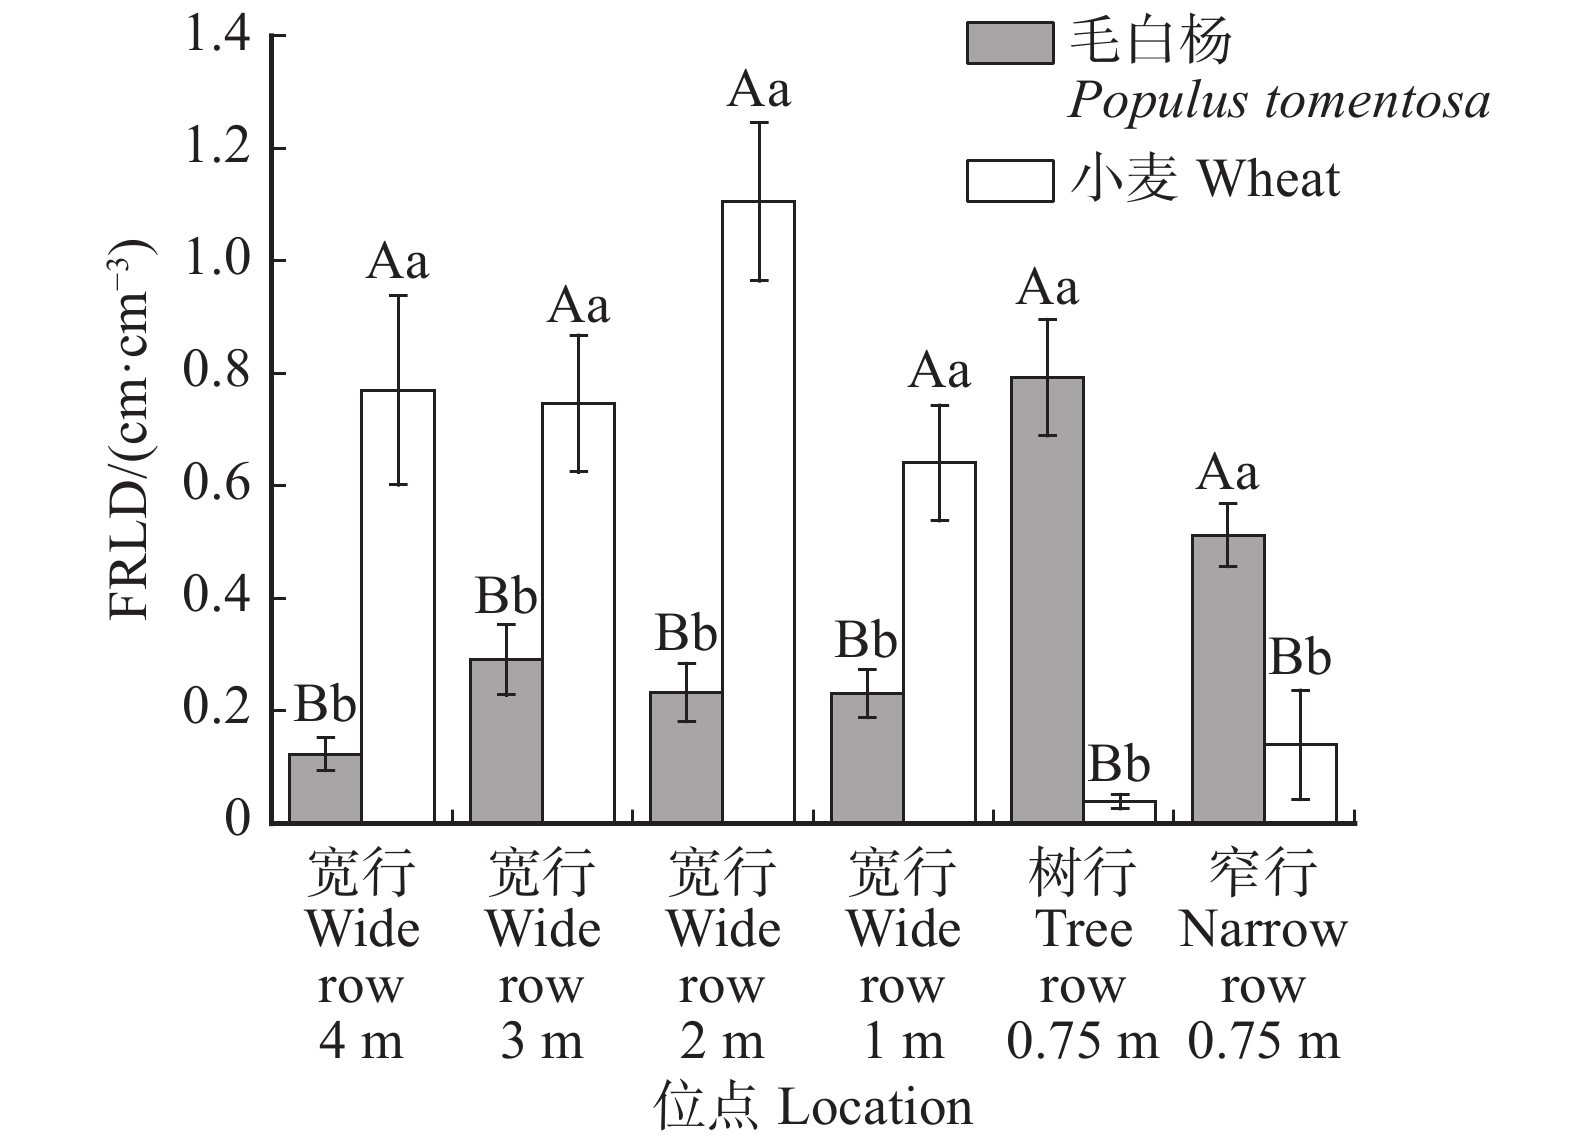
![]()
图 4 毛白杨–小麦复合系统细根根长密度的水平分布
不同位点上的不同小写字母表示位点间差异显著(P < 0.05),同一位点的不同大写字母表示物种间差异显著(P < 0.05),检验方法为分别Tukey检验和T检验。Different lowercase letters in varied locations indicate significant difference between locations (P < 0.05), different capital letters in the same location indicate significant difference between species (P < 0.05), according to the Tukey test and T test, respectively.
Figure 4. Horizontal distribution of FRLD of P. tomentosa-wheat agroforestry system
![]()
图 5 毛白杨细根根长密度二维分布(a)和小麦细根根长密度二维分布(b)
虚线为宽窄行分界,即树体位置。Dotted lines indicate the boundary of wide- and narrow-row, i. e. the tree position.
Figure 5. Two-dimensional distribution of FRLD ofP. tomentosa (a) and wheat (b)
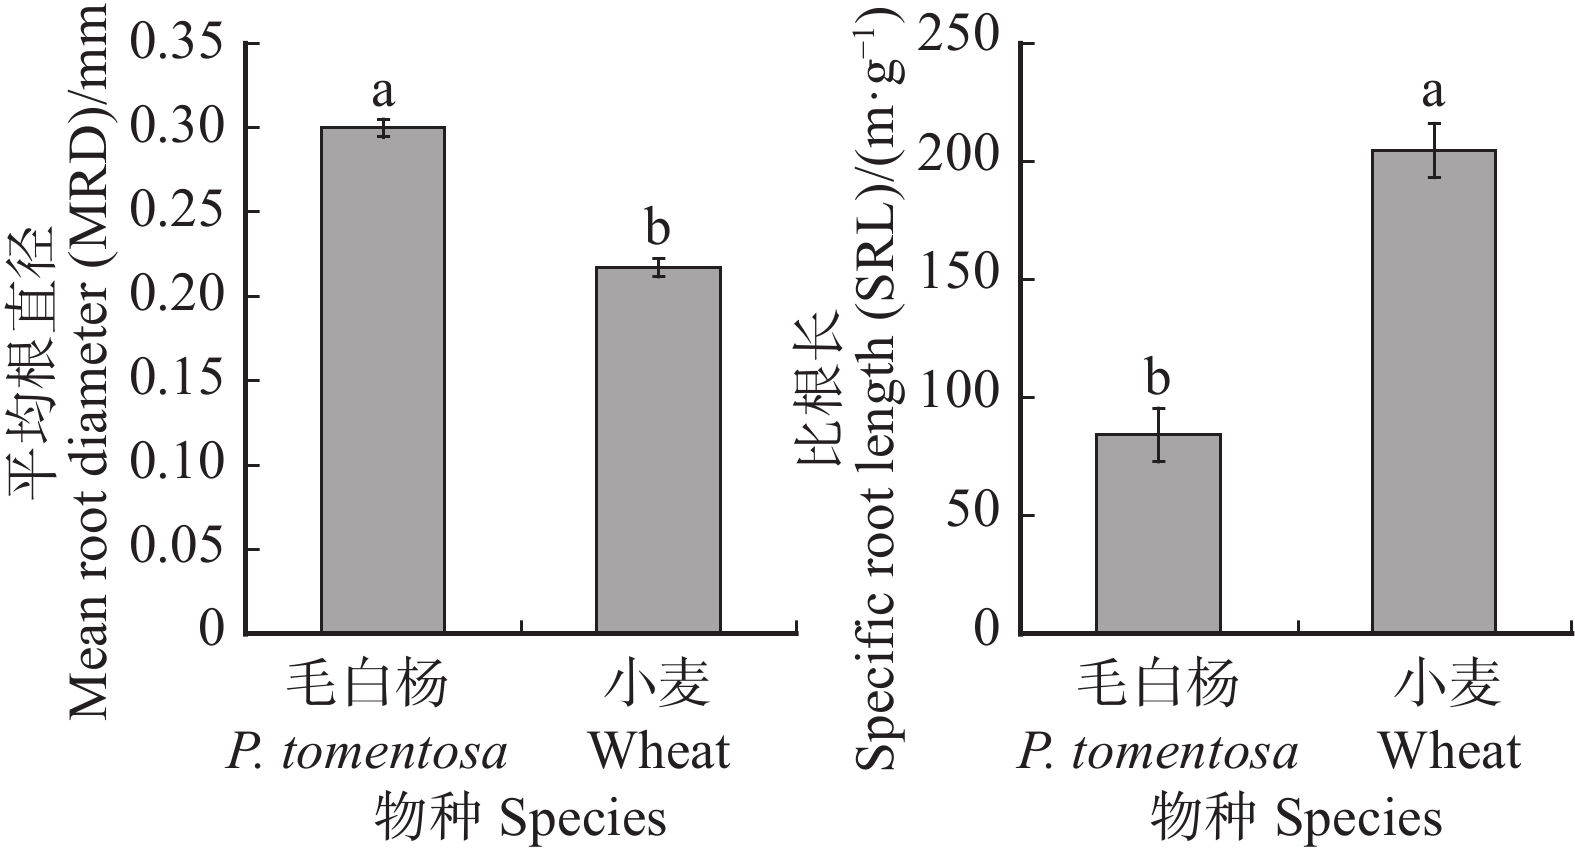
![]()
图 6 毛白杨和小麦细根的直径和比根长
不同小写字母表示物种间差异显著(P < 0.05),检验方法为T检验。Different lowercase letters indicate significant difference between species (P < 0.05), according to the T test.
Figure 6. MRD and SRL of P. tomentosa and wheat
-
[1] Izac A M N, Sanchez P A. Towards a natural resource management paradigm for international agriculture: the example of agroforestry research[J]. Agricultural Systems, 2001, 69(1): 5−25.
[2] Pandey D N. Carbon sequestration in agroforestry systems[J]. Climate Policy, 2002, 2(4): 367−377. doi: 10.3763/cpol.2002.0240
[3] 邹鑫, 朱习爱, 陈春峰, 等. 农林复合系统的水土保持效益[J]. 云南大学学报, 2020, 42(2):382−392. Zou X, Zhu X A, Chen C F, et al. Soil and water conservation benefits of agroforestry systems[J]. Journal of Yunnan University, 2020, 42(2): 382−392.
[4] 云雷, 毕华兴, 马雯静, 等. 晋西黄土区林草复合界面雨后土壤水分空间变异规律研究[J]. 东北林业大学学报, 2010, 38(7):938−944. doi: 10.3969/j.issn.1000-5382.2010.07.022 Yun L, Bi H X, Ma W J, et al. Spatial distribution characteristics of root system of walnut trees in the walnut peanut intercropping system in the loess region of western Shanxi[J]. Journal of Northeast Forestry University, 2010, 38(7): 938−944. doi: 10.3969/j.issn.1000-5382.2010.07.022
[5] Jackson R B, Mooney H A, Schulze E D. A global budget for fine root biomass, surface area, and nutrient contents[J]. Ecology, 1997, 94(14): 7362−7366.
[6] Gordon W S, Jackson R B. Nutrient concentrations in fine roots[J]. Ecology, 2000, 81(1): 275−280. doi: 10.1890/0012-9658(2000)081[0275:NCIFR]2.0.CO;2
[7] Guo D L, Xia M X, Wei X, et al. Anatomical traits associated with absorption and mycorrhizal colonization are linked to root branch order in twenty-three Chinese temperate tree species[J]. New Phytologist, 2008, 180(3): 673−683. doi: 10.1111/j.1469-8137.2008.02573.x
[8] McCormack M L, Dickie L A, Eissenstat D M, et al. Redefining fine roots improves understanding of below-ground contributions to terrestrial biosphere processes[J]. New Phytologist, 2015, 207(3): 505−518. doi: 10.1111/nph.13363
[9] 云雷, 毕华兴, 任怡, 等. 黄土区果农复合系统种间水分关系研究[J]. 水土保持通报, 2008, 28(6):110−114. Yun L, Bi H X, Ren Y, et al. Research on soil moisture relations among types of agroforestry system in the loess region[J]. Bulletin of Soil and Water Conservation, 2008, 28(6): 110−114.
[10] Fitter A H. Characteristics and functions of root systems[M]//Eshel A, Beeckman T. Plant roots. Boca Raton: CRC Press, 2002: 49–78.
[11] Liu L P, Gan Y T, Bueckerta R, et al. Rooting systems of oilseed and pulse crops (II.): vertical distribution patterns across the soil profile[J]. Field Crops Research, 2011, 122(3): 248−255. doi: 10.1016/j.fcr.2011.04.003
[12] 马理辉, 吴普特, 汪有科. 黄土丘陵半干旱区密植枣林随树龄变化的根系空间分布特征[J]. 植物生态学报, 2012, 36(4):292−301. Ma L H, Wu P T, Wang Y K. Spatial pattern of root systems of dense jujube plantation with jujube age in the semiarid loess hilly region of China[J]. Chinese Journal of Plant Ecology, 2012, 36(4): 292−301.
[13] Huxley P A, Pinney A, Akunda E, et al. A tree/crop interface orientation experiment with a Grevillea robusta hedgerow and maize[J]. Agroforestry Systems, 1994, 26(1): 23−45. doi: 10.1007/BF00705150
[14] Schroth G, Lehmann J. Contrasting effects of roots and mulch from three agroforestry tree species on yields of alley cropped maize[J]. Agriculture Ecosystems & Environment, 1995, 54(1–2): 89−101.
[15] Burgess P J, Stephens W, Anderson G, et al. Water use by a poplar-wheat agroforestry system[J]. Aspects of Applied Biology, 1996, 44: 129−136.
[16] Swamy S L, Mishra A, Puri S. Comparison of growth, biomass and nutrient distribution in five promising clones of Populus deltoides under an agrisilviculture system[J]. Bioresource Technology, 2006, 97(1): 57−68. doi: 10.1016/j.biortech.2005.02.032
[17] 马秀玲, 陆光明, 徐祝龄, 等. 农林复合系统中林带和作物的根系分布特征[J]. 中国农业大学学报, 1997, 2(1):109−116. Ma X L, Lu G M, Xu Z L, et al. Distribution characteristic of the root system of forest belt and crop within the composite system of agriculture and forestry[J]. Journal of China Agriculture University, 1997, 2(1): 109−116.
[18] 王长伟, 刘勇, 李国雷, 等. 不同林农复合模式对造林1年后毛白杨幼林根系的影响[J]. 北京林业大学学报, 2019, 41(1):32−41. Wang C W, Liu Y, Li G L, et al. Effects of different agro-forestry models on seedling root system of Populus tomentosa after one year of afforestation[J]. Journal of Beijing Forestry University, 2019, 41(1): 32−41.
[19] Mulia R, Dupraz C. Unusual fine root distributions of two deciduous tree species in southern france: what consequences for modelling of tree root dynamics?[J]. Plant & Soil, 2006, 281(1–2): 71−85.
[20] Upson M A, Burgess P J. Soil organic carbon and root distribution in a temperate arable agroforestry system[J]. Plant & Soil, 2013, 373(1): 43−58.
[21] 邸楠, 席本野, 王烨, 等. 宽窄行栽植下三倍体毛白杨根系生物量分布及其对土壤养分因子的响应[J]. 植物生态学报, 2013, 37(10):961−971. Di N, Xi B Y, Wang Y, et al. Root biomass distribution of triploid Populus tomentosa under wide- and narrow-row spacing planting schemes and its responses to soil nutrients[J]. Chinese Journal of Plant Ecology, 2013, 37(10): 961−971.
[22] Xi B Y, Wang Y, Jia L M, et al. Characteristics of fine root system and water uptake in a triploid Populus tomentosa plantation in the North China Plain: implications for irrigation water management[J]. Agricultural Water Management, 2013, 117: 83−92. doi: 10.1016/j.agwat.2012.11.006
[23] Silva J S, Rego F C. Root distribution of a Mediterranean shrub land in Portugal[J]. Plant and Soil, 2003, 255(2): 529−540. doi: 10.1023/A:1026029031005
[24] Coleman M. Spatial and temporal patterns of root distribution in developing stands of four woody crop species grown with drip irrigation and fertilization[J]. Plant and Soil, 2007, 299(1–2): 195−213.
[25] Ma L H, Liu X L, Wang Y K, et al. Effects of drip irrigation on deep root distribution, rooting depth, and soil water profile of jujube in a semiarid region[J]. Plant and Soil, 2013, 373(1): 995−1006.
[26] 邹松言, 李豆豆, 汪金松, 等. 毛白杨幼林根系对梯度土壤水分的响应[J]. 林业科学, 2019, 55(10):125−138. Zou S Y, Li D D, Wang J S, et al. Response of fine root to soil moisture of different gradients in young Populus tomentosa plantation[J]. Scientia Silvae Sinicae, 2019, 55(10): 125−138.
[27] 席本野. 杨树根系形态、分布、动态特征及其吸水特性[J]. 北京林业大学学报, 2019, 41(12):37−49. doi: 10.12171/j.1000-1522.20190400 Xi B Y. Morphology, distribution, dynamic characteristics of poplar roots and its water uptake habits[J]. Journal of Beijing Forestry University, 2019, 41(12): 37−49. doi: 10.12171/j.1000-1522.20190400
[28] 白永飞. 降水量季节分配对克氏针茅草原群落初级生产力的影响[J]. 植物生态学报, 1999, 23(2):155−160. doi: 10.3321/j.issn:1005-264X.1999.02.007 Bai Y F. Influence of seasonal distribution of precipitation on primary productivity of Stipa krylovii community[J]. Chinese Journal of Plant Ecology, 1999, 23(2): 155−160. doi: 10.3321/j.issn:1005-264X.1999.02.007
[29] Adriano E, Laclau J P, Rodrigues J D. Deep rooting of rainfed and irrigated orange trees in Brazil[J]. Trees, 2017, 31(1): 285−297. doi: 10.1007/s00468-016-1483-5
[30] Bakker M R, Augusto L, Achat D L. Fine root distribution of trees and understory in mature stands of maritime pine (Pinus pinaster) on dry and humid sites[J]. Plant & Soil, 2006, 286(1–2): 37−51.
[31] 李盼盼. 杨树人工林细根的空间分布特征及其季节动态[D]. 泰安: 山东农业大学, 2012. Li P P. Fine root distribution patterns and seasonal dynamics of poplar plantation[D]. Taian: Shandong Agricultural University, 2012.
[32] Steele S J, Gower S T, Vogel J G, et al. Root mass, net primary production and turnover in aspen, jack pine and black spruce forests in Saskatchewan and Manitoba, Canada[J]. Tree Physiology, 1997, 17(8–9): 577−587.
[33] Barber K R, Leeds-Harrison P B, Lawson C S, et al. Soil aeration status in a lowland wet grassland[J]. Hydrological Processes, 2004, 18(2): 329−341. doi: 10.1002/hyp.1378
[34] Schenk H J. The shallowest possible water extraction profile: a null model for global root distributions[J]. Vadose Zone Journal, 2008, 7(3): 1119−1124. doi: 10.2136/vzj2007.0119
[35] 席本野, 邸楠, 刘金强, 等. 树木吸收利用深层土壤水的特征与机制: 对人工林培育的启示[J]. 植物生态学报, 2018, 42(9):885−905. doi: 10.17521/cjpe.2018.0083 Xi B Y, Di N, Liu J Q, et al. Characteristics and underlying mechanisms of plant deep soil water uptake and utilization: Implication for the cultivation of plantation trees[J]. Chinese Journal of Plant Ecology, 2018, 42(9): 885−905. doi: 10.17521/cjpe.2018.0083
[36] Jackson R B, Canadell J, Ehleringer J R, et al. A global analysis of root distributions for terrestrial biomes[J]. Oecologia, 1996, 108(3): 389−411. doi: 10.1007/BF00333714
[37] Douglas G B, McIvor I R, Potter J F, et al. Root distribution of poplar at varying densities on pastoral hill country[J]. Plant and Soil, 2010, 333(1–2): 147−161.
[38] 马长明, 翟明普, 刘春鹏. 单作与间作条件下核桃根系分布特征研究[J]. 北京林业大学学报, 2009, 31(6):181−186. Ma C M, Zhai M P, Liu C P. Root distribution characteristics of Juglans regia in monoculture and intercropping[J]. Journal of Beijing Forestry University, 2009, 31(6): 181−186.
[39] Lubo G, Huasen X, Huaxing B, et al. Intercropping competition between apple trees and crops in agroforestry systems on the Loess Plateau of China[J/OL]. PLoS One, 2013, 8(7): e70739[2020−11−12]. https://journals.plos.org/plosone/article?id=10.1371/journal.pone.0070739.
[40] 王来, 高鹏翔, 仲崇高, 等. 核桃–小麦复合系统中细根生长动态及竞争策略[J]. 生态学报, 2018, 38(21):7762−7771. Wang L, Gao P X, Zhong C G, et al. Growth dynamics and competitive strategies of fine roots in a walnut-wheat agroforestry system[J]. Acta Ecologica Sinica, 2018, 38(21): 7762−7771.
[41] Hendrick R L, Pregitzer K S. The relationship between fine root demography and the soil environment in northern hardwood forests[J]. Ecoscience, 1997, 4(1): 99−105. doi: 10.1080/11956860.1997.11682383
[42] 耿玉清, 单宏臣, 谭笑, 等. 人工针叶林林冠空隙土壤的研究[J]. 北京林业大学学报, 2002, 24(4):16−19. doi: 10.3321/j.issn:1000-1522.2002.04.004 Geng Y Q, Shan H C, Tan X, et al. Soils in forest gaps in artificial coniferous forests[J]. Journal of Beijing Forestry University, 2002, 24(4): 16−19. doi: 10.3321/j.issn:1000-1522.2002.04.004
[43] 杨秀云, 韩有志, 张芸香. 距树干不同距离处华北落叶松人工林细根生物量分布特征及季节变化[J]. 植物生态学报, 2008, 32(6):1277−1284. doi: 10.3773/j.issn.1005-264x.2008.06.008 Yang X Y, Han Y Z, Zhang Y X. Effects of horizontal distance on fine root biomass and seasonal dynamic in Larix principis-rupprechitii plantation[J]. Chinese Journal of Plant Ecology, 2008, 32(6): 1277−1284. doi: 10.3773/j.issn.1005-264x.2008.06.008
[44] Fransen B, Berendse K F. Root morphological plasticity and nutrient acquisition of perennial grass species from habitats of different nutrient availability[J]. Oecologia, 1998, 115(3): 351−358. doi: 10.1007/s004420050527
[45] Dhiman I, Bilheux H, de Carlo K, et al. Quantifying root water extraction after drought recovery using sub-mm in situ empirical data[J]. Plant and Soil, 2017, 424(1–2): 73−89.
[46] Grégoire T, Fresche C. Sampling roots to capture plant and soil functions[J]. Functional Ecology, 2017, 31(8): 1506−1518. doi: 10.1111/1365-2435.12883
[47] Reich P B. The world-wide ‘fast–slow’ plant economics spectrum: a traits manifesto[J]. Journal of Ecology, 2014, 102(2): 275−301. doi: 10.1111/1365-2745.12211
[48] Ma Z Q, Guo D L, Xu X L, et al. Evolutionary history resolves global organization of root functional roots[J]. Nature, 2018, 555: 94−97.
-
期刊类型引用(16)
1. 罗豪,李先锋. 基于多尺度特征提取的遥感图像分类. 计算机与现代化. 2025(03): 86-92 .  百度学术
百度学术
2. 张若愚,聂婕,宋宁,郑程予,魏志强. 基于布局化-语义联合表征遥感图文检索方法. 北京航空航天大学学报. 2024(02): 671-683 . 百度学术
3. 张名华,张洪军,石建,赵春丽,郑伟安,李天鹤. 基于道路轨迹预测模型的遥感影像分类方法研究. 山东国土资源. 2024(08): 37-41 . 百度学术
4. 姚蕊,刘小芳,张杰,郭旭萍. 基于深度学习的FY-4A图像地表太阳辐照度预测. 四川轻化工大学学报(自然科学版). 2024(04): 58-67 . 百度学术
5. 刘宝宝,杨菁菁,陶露,王贺应. 基于注意力的DSMSC的遥感图像场景分类. 计算机与现代化. 2024(12): 72-77 . 百度学术
6. 陈小勇,郭元术,梁雅博. 基于3D Octave卷积和胶囊网络的高光谱图像分类. 现代电子技术. 2023(05): 29-34 . 百度学术
7. 岳泓光,韩龙玫,王正勇,卿粼波. 基于多通道自注意力网络的遥感图像场景分类. 四川大学学报(自然科学版). 2023(02): 97-105 . 百度学术
8. 王李祺,高翔,程蓉,谭秀辉,白艳萍. 基于注意卷积模块的遥感图像场景分类应用. 陕西科技大学学报. 2023(02): 199-206 . 百度学术
9. 贾浩男,徐华东,王立海,张金生,褚晓辉,唐旭. 基于改进YOLOv5木板材表面缺陷的定量识别. 北京林业大学学报. 2023(04): 147-155 . 本站查看
10. 王李祺,张成,侯宇超,谭秀辉,程蓉,高翔,白艳萍. 基于深度学习特征融合的遥感图像场景分类应用. 南京信息工程大学学报(自然科学版). 2023(03): 346-356 . 百度学术
11. 何晓军,刘璇,魏宪. 融合字典学习与视觉转换器的高分遥感影像场景分类方法. 激光与光电子学进展. 2023(14): 189-198 . 百度学术
12. 李子茂,于舒,郑禄,帖军,秦锦添. 基于融合注意力机制的小样本遥感场景分类方法. 国外电子测量技术. 2023(07): 59-67 . 百度学术
13. 李大湘,南艺璇,刘颖. 面向遥感图像场景分类的双知识蒸馏模型. 电子与信息学报. 2023(10): 3558-3567 . 百度学术
14. 吴文彦. 基于卷积通道注意力及改进ResNet的遥感场景分类. 兰州工业学院学报. 2023(06): 26-30 . 百度学术
15. 丁竹娴,周立军,樊江川,安锋,陈帮乾,王铭慧,蒋玲,薛联凤,云挺. 基于深度学习与激光点云的橡胶林枝干重建及参数反演. 农业工程学报. 2022(08): 187-199 . 百度学术
16. 闾海庆,王静,杨静. 半监督高分辨率遥感图像分类方法. 北京测绘. 2022(06): 827-830 . 百度学术
其他类型引用(14)
 下载:
下载:


计量
- 文章访问数: 1270
- HTML全文浏览量: 364
- PDF下载量: 66
- 被引次数: 30
