
Effects of tending and thinning on non-structural carbon and stoichiometric characteristics of Pinus yunnanensis
-
摘要:目的 探究抚育间伐对云南松各个器官非结构性碳(NSC),以及碳(C)、氮(N)、磷(P)化学计量学特征的影响机制。方法 以云南省永仁县国有林场白马河林区云南松中龄林为研究对象,设置间伐(间伐强度为35.4%)与对照样地,分析抚育间伐对云南松非结构性碳和化学计量特征的影响。结果 (1)抚育间伐显著影响云南松针叶和枝的NSC含量(P < 0.01),对根NSC含量则无显著影响。抚育后枝NSC含量增长9.30%,而针叶NSC含量减少3.57%。(2)抚育间伐对云南松枝C含量、针叶和干P含量有显著影响(P < 0.05),对针叶N含量有极显著影响(P < 0.01),但对根的C、N、P含量没有显著影响。抚育后云南松枝中C含量增加12.93%;针叶中N含量增长18.04%;叶和干中P含量分别降低了27.78%、55.56%。(3)云南松NSC、CNP化学计量学特征在各个器官之间表现出显著差异(P < 0.05)。相关性分析表明:针叶和根P含量与可溶性糖含量呈显著正相关(P < 0.05),而叶中C含量则和可溶性糖含量显著负相关(P < 0.05)。结论 抚育间伐能促进云南松干、枝和根NSC含量以及各器官C含量的积累,降低叶NSC和各器官P含量,改变C、N、P在各器官中的分布格局;该地区云南松人工林生长在一定程度上受N限制,适当配施N肥将促进林分质量的提高。Abstract:Objective Our objective was to explore the mechanism of the effects of thinning on non-structural carbon (NSC), carbon (C), nitrogen (N) and phosphorus (P) stoichiometry of Pinus yunnanensis.Method The middle-aged P. yunnanensis forests were chosen in the Baima River forest area of Yongren County, Yunnan Province of southwestern China, and two experimental sample plots of thinning (thinning intensity of 35.4%) and control were set up to analyze the effects of thinning on NSC and CNP stoichiometric characteristics of P. yunnanensis forests.Result (1) Tending thinning significantly affected the NSC content of needles and branches of P. yunnanensis (P < 0.01), whereas no significant difference on roots was observed. In addition, the NSC content of branch increased by 9.30%, while the NSC content in needles decreased by 3.57%. (2) Thinning had a significant effect on C content of P. yunnanensis branch, P content in needles and stems (P < 0.05), and a highly significant effect on N content in needles (P < 0.01), however, no significant effect was observed on C, N and P content in roots. After thinning, the C content of P. yunnanensis branch increased by 12.93%; the N content in needles increased by 18.04%, and the P content in needles and stems decreased by 27.78% and 55.56%, respectively. (3) The NSC, CNP stoichiometric characteristics showed significant differences among P. yunnanensis organs (P < 0.05). Correlation analysis showed that the P content in needles and roots was significantly positively correlated with soluble sugar content (P < 0.05), while C content in needles was significantly negatively correlated with soluble sugar content (P < 0.05).Conclusion Thinning promots the accumulation of NSC content in stem, branch and root and C content in each organ, whereas needle NSC and P content decreased in each organ, furthermore, distribution pattern of C, N and P in each organ was affected; the growth of P. yunnanensis plantation in this area was limited by N to some extent, and appropriate application of N fertilizer will promote the improvement of stand quality.
-
黄土高原在水力侵蚀的作用下,土壤结构破坏严重,水土流失量大,成为我国土壤侵蚀的重灾区。自国家实施三北防护林和退耕还林等项目以来,大面积刺槐(Robinia pseudoacacia)、油松(Pinus tabuliformis)等人工林的种植,使得植被覆盖率逐年增加,如黄土高原植被覆盖率由1999年的31.6%提高到2013年的56.9%,黄河输沙量减少到2亿 t[1]。但由于植被耗水量大,黄土高原大部分地处干旱半干旱地区,降水量从西北到东南在150 ~ 800 mm之间,远低于年平均蒸发量1 400 ~ 2 000 mm[2-3],水成为黄土高原森林植被生长的主要限制因子。
土壤水分入渗是补给水的必然通道以及重要补给方式,是影响水文循环、地表径流和土壤侵蚀等的重要因素[4]。其中,降雨和灌溉等地表水进入土壤或产生径流是由渗透所决定[5]。它在提高土壤剖面水和溶质的运移效率上以及在减少水分损失等方面发挥着关键作用[4]。然而,影响土壤入渗的因素有很多,吕振豫等[6]和Huang等[7]将其概括为两方面,一方面是由土壤自身理化性质决定,如土壤结构、质地、容重和有机质等,另一方面由外部因素如降雨强度、植被覆盖和人为干扰等因素影响。李平等[8]在对黄土高寒区不同植被类型的土壤入渗性能研究中发现,影响土壤入渗的主要因素有孔隙度、水稳性团聚体和有机质;而阿茹·苏里坦等[9]对天山林区不同植被类型的土壤入渗性能的研究发现,土壤含水率、土壤毛管孔隙度、土壤容重和有机质对土壤入渗起决定作用。由此可知,因研究对象和研究区的不同,影响土壤入渗的主要因素也不尽相同。土壤入渗性能的研究大都集中在不同土地利用类型、不同植被类型、不同人为干扰等方面[7, 10-11],缺乏对同一植被类型不同林龄和密度的林分研究。
晋西黄土残塬沟壑区位于黄土高原半湿润向半干旱区的过渡带上,生态环境脆弱,水土流失严重,该区降水不足、分布不均,土壤贫瘠、肥力低[12]。为了改善生态环境和防治水土流失,分别于1993年和2003年左右在该区建立了大面积的刺槐人工林。但随着森林植被的恢复,不合理种植、林分功能低下和土壤干化等问题也日益突出,迫切需要将低效林分结构进行合理调整,精准提升林分功能[2, 13]。结构决定功能,功能反映结构的好坏。林分林龄、林分密度通过改变林下光照、温度和蒸发等,对枯落物的数量、分解以及林下植被多样性产生影响,造成土壤肥力和理化性质的差异[14-15],进而影响土壤入渗。而林分密度又作为林分营造与调控的可控因子,故从土壤入渗性能角度出发,以晋西黄土残塬沟壑区刺槐林为研究对象,对其不同林龄不同密度林分土壤入渗性能特征、影响因素进行研究,并对入渗过程进行模拟。更好的了解刺槐林的入渗特征以及随林龄和密度的变化,为后续植被结构合理调整提供科学依据。
1. 研究区概况与研究方法
1.1 研究区概况
本试验选择以山西吉县森林生态系统国家野外科学观测研究站(36º14′27″ ~ 36º18′23″N,110º39′45″ ~ 110º47′45″E)为试验依托站点。该站点位于黄河中游黄土高原东南部山西省吉县,在该观测研究站建立了长期稳定的定位监测和调查点,具备较完善的野外和室内试验条件。该研究区水土流失严重、生态环境脆弱以及水资源短缺,是典型的黄土残塬沟壑区,其海拔范围900 ~ 1 513 m,年平均降雨量为579.5 mm,年平均气温为10 ℃,年蒸发量为1 500 ~ 2 000 mm,约为降水量的3 ~ 4倍[16]。土壤类型为褐土,黄土母质,土壤质地为粉质壤土 [17-19]。该研究区人工林多以刺槐、油松和侧柏(Platycladus orientalis)为主,其中刺槐林林下灌木主要有黄刺玫(Rosa xanthina)、杠柳(Periploca sepium)、丁香(Syringa oblata)和悬钩子(Rubus corchorifolius)等,草本层植物主要有细叶苔草(Carex rigescens)、铁杆蒿(Artemisia sacrorum)、茜草(Rubia cordifolia)等。
1.2 研究方法
1.2.1 样地布设
研究区位于山西省吉县蔡家川小流域,流域面积为40.1 km2[20]。选取流域内植被恢复15年、25年和35年的刺槐林为研究对象,通过对不同林龄的林分进行大量调查,并对每个恢复年限的刺槐林各筛选出4个主要的林分密度,在选取的刺槐林内各设置20 m × 20 m的标准样地,对立地、植被进行调查,并进行土壤入渗测定和土壤理化性质取样等相关工作,样地分布以及概况见图1、表1。
![]() 图 1 黄土高原蔡家川小流域刺槐林样地布设Figure 1. Sample plot layout of Robinia pseudoacacia plantation at Caijiachuan Watershed of the Loess Plateau表 1 样地基本概况Table 1. Basic situation of sample plots
图 1 黄土高原蔡家川小流域刺槐林样地布设Figure 1. Sample plot layout of Robinia pseudoacacia plantation at Caijiachuan Watershed of the Loess Plateau表 1 样地基本概况Table 1. Basic situation of sample plots林龄/a
Stand age/year密度/(株·hm−2)
Density/(plant·ha−1)海拔
Altitude/m坡度
Slope degree/(°)坡向
Slope aspect平均树高
Average tree height/m平均胸径
Mean DBH/cm郁闭度
Canopy density15 1 200 1 075 23 阴坡 Shady slope 7.90 9.15 0.50 1 600 950 18 阳坡 Sunny slope 9.90 11.21 0.68 1 800 980 13 阳坡 Sunny slope 10.54 12.98 0.62 2 200 1 090 28 半阳坡 Semi-sunny slope 8.04 9.22 0.70 25 800 1 210 24 半阴坡 Semi-shady slope 7.81 10.13 0.41 1 200 1 160 13 半阳坡 Semi-sunny slope 9.80 13.32 0.48 1 600 1 150 25 半阴坡 Semi-shady slope 7.64 9.98 0.52 2 200 1 170 20 半阴坡 Semi-shady slope 6.65 8.08 0.58 35 1 200 1 220 28 半阴坡 Semi-shady slope 8.14 11.51 0.58 1 600 1 230 24 阳坡 Sunny slope 6.55 8.94 0.58 1 800 1 229 37 半阳坡 Semi-sunny slope 7.87 10.18 0.60 2 200 1 230 25 半阴坡 Semi-shady slope 7.25 9.63 0.52 1.2.2 土壤入渗及理化性质的测定
在选取的刺槐林内设置20 m × 20 m的标准样地,在每个样地内选取较平整的地段3处进行双环入渗试验,在样地内设置重复试验,排除渗透的局部变异性。双环入渗试验选取内外直径分别为15 cm 和30 cm,环高30 cm、厚2 mm。测定时在外环与内环之间加入一定量的水(保持外环中的水深)后,在内环中加水2 cm(从小钢尺的刻度判断加水量),当内环中水深下降1 cm时重新加水至2 cm,并记录下渗1 cm 水所用的时间(min)。当连续3次及以上下渗1 cm 水所用的时间t(min)相同则认为土壤已经达到了稳渗,此时的渗透速率就是稳渗速率。土壤渗透速率ft = 10/t,单位mm/min。
每个样地沿任一对角线且在双环入渗试验点附近挖取3个30 cm深的剖面,用环刀在垂直方向上每隔10 cm为一层采集原状土样,且用铝盒取样测定土壤含水量,每层3个重复,各共27个样品,并用自封袋取得500 g原状土9袋用于化学性质和团聚体的测定。所有样地共取得铝盒、环刀各324个,500 g自封袋土样108袋。
将取回的环刀用浸水法测定土壤密度、总孔隙度、毛管孔隙度和非毛管孔隙度;将铝盒用烘干法测定土壤含水量;将土样用重铬酸钾外加热氧化法测定土壤有机质含量;利用XY-100型土壤团聚体分析仪采用干筛、湿筛方法测定水稳性团聚体含量。测定结果如表2。
表 2 土壤理化性质Table 2. Physical and chemical properties of soil林龄/a
Stand
age/year密度/
(株·hm−2)
Density/
(plant·ha−1)土壤初始
含水量
Initial moisture
content of soil/%土壤密度
Soil bulk
density/
(g·cm−3)土壤总
孔隙度
Total porosity
of soil/%毛管
孔隙度
Capillary
porosity/%非毛管
孔隙度
Non-capillary
porosity/%有机质含量
Organic
matter
content/%水稳性团聚体
Water-stable aggregate/mm> 5 2 ~ 5 1 ~ 2 0.5 ~ 1 0.25 ~ 0.5 15 1200 10.76ab 1.26ab 0.48ab 0.45ab 0.03de 1.01b 0.36c 2.63c 3.92c 5.68b 11.13a 1600 7.30b 1.15ab 0.52a 0.50a 0.02d 1.06b 0.77c 4.22c 6.64bc 6.72b 9.24a 1800 10.57ab 1.13b 0.53a 0.51a 0.02d 1.12b 4.29a 6.77b 7.62b 7.25b 10.28a 2200 9.27b 1.09bc 0.54b 0.50ab 0.04e 1.18b 2.55bc 5.89bc 8.51ab 9.99ab 12.38a 25 800 8.76b 1.28a 0.45b 0.42b 0.03c 1.08b 1.60bc 3.96c 4.06c 6.42b 11.96a 1200 13.14a 1.18ab 0.51ab 0.46ab 0.05c 1.12b 1.88bc 5.30c 7.60b 10.15ab 10.62a 1600 8.46b 1.16ab 0.52ab 0.49ab 0.03d 1.22b 2.39bc 5.49c 6.09bc 5.94b 8.85a 2200 6.70b 1.05bc 0.54a 0.48ab 0.06b 1.26b 5.55da 9.89a 10.15ab 9.39b 10.86a 35 1200 6.76b 1.14b 0.49ab 0.42b 0.07a 1.14b 1.38bc 5.39c 8.77ab 12.13ab 11.91a 1600 6.24b 1.11b 0.53ab 0.49ab 0.04c 1.16b 3.02b 5.86bc 9.74ab 13.78a 10.60a 1800 9.98ab 1.11bc 0.53a 0.50ab 0.03d 1.24b 3.28b 4.32c 10.98a 13.68a 10.73a 2200 7.15b 0.97c 0.54ab 0.51ab 0.03d 2.04a 2.51bc 5.38c 9.56ab 11.3ab 12.78a 注:小写字母表示在P < 0.05水平上的差异显著性。Note: lowercase letters mean significant differences at P < 0.05 level. 1.2.3 土壤入渗模型
选取的4种渗透模型分别是Horton模型、Koistakov模型、Philip模型和通用经验模型[4, 21]。这些模型对初始条件和边界条件的假设以及根据可观测数据估计的拟合参数的数目有所不同。采用不同的统计模型评价准则,对模型拟合观测数据的性能进行评价。
Horton模型
ft=fs+(fo−fs)⋅e−βt (1) Koistakov模型
ft=a⋅t−b (2) Philip模型
ft=0.5⋅S⋅t−0.5+fs (3) 通用经验模型
ft=fs+a⋅t−b (4) 式中:f0和fs分别表示初始和稳定入渗速率(mm/min),ft表示给定时间(t)的入渗速率(mm/min)。a、b和β为模型参数,S为吸渗率。
1.2.4 数据分析
选取4种常用的模型即Horton模型、Koistakov模型、Philip模型和通用经验模型,在 SPSS 20.0中对不同林龄不同密度刺槐人工林的土壤入渗过程进行拟合。并在SPSS 20.0中进行ANOVA方差分析、LSD多重比较、Pearson相关分析和主成分分析,并利用多元逐步回归提取主要因子,在Origin中作图。
2. 结果与分析
2.1 刺槐林土壤入渗特征
由图1可知,刺槐林在林分密度为1 200、1 600和2 200株/hm2的条件下,土壤的初始入渗速率表现出随林龄的增加而变大的趋势,在同一林龄即15年、25年和35年条件下,刺槐林的土壤初始入渗速率随林分密度的增加其变化规律不明显。通过单因素方差分析可知,在林分密度为1 200和1 600株/hm2的条件下,林龄为15年和25年的土壤初始入渗速率与35年的土壤初始入渗速率均表现出差异显著(P1200−15a = 0.015,P1200−25a = 0.015,P1600−15a = 0.001,P1600−25a = 0.003);在林分密度为2 200株/hm2条件下,仅15年的刺槐林土壤初始入渗速率与35年的初始入渗速率表现出差异显著(P2200−15a = 0.020)。而对同一林龄不同密度条件下,35年的刺槐林在林分密度为1 200、1600和2200 株/hm2条件下,初始入渗速率与1800 株/hm2的初始入渗速率表现出差异显著(P35a−1200 = 0.003,P35a−1600 = 0.001,P35a−2200 = 0.007)。
刺槐林的稳渗速率在同一林龄条件下,稳渗速率随着密度的增加而增大;在同一密度的条件下,稳渗速率随着林龄的增加而增大。其中,本研究中刺槐林的稳渗速率范围为1.23 ~ 2.45 mm/min,平均值为1.73 mm/min。通过单因素方差分析可知,在林龄为15年的条件下,林分密度为2 200株/hm2的刺槐林稳渗速率与林分密度为1 200和1 600株/hm2的稳渗速率均表现出差异显著;在林分密度为1 200 株/hm2的条件下,林龄为15年的刺槐林稳渗速率与35年的表现出差异显著;而在其他各条件下均表现出差异不显著(图2)。
![]() 图 2 同一林龄不同密度和同一密度不同林龄的刺槐林土壤入渗特征不同小写字母表示初始入渗速率、平均入渗速率和稳定入渗速率分别在同一林龄不同密度或同一密度不同林龄的条件下的差异显著性(P < 0.05)。Different lowercase letters indicate the significant differences of initial infiltration rate, average infiltration rate, stable infiltration rate, respectively under the same forest age with varied densities or same density with varied forest ages (P < 0.05).Figure 2. Soil infiltration characteristics of Robinia pseudoacacia plantation at same forest age withdifferent densities and same density with varied forest ages
图 2 同一林龄不同密度和同一密度不同林龄的刺槐林土壤入渗特征不同小写字母表示初始入渗速率、平均入渗速率和稳定入渗速率分别在同一林龄不同密度或同一密度不同林龄的条件下的差异显著性(P < 0.05)。Different lowercase letters indicate the significant differences of initial infiltration rate, average infiltration rate, stable infiltration rate, respectively under the same forest age with varied densities or same density with varied forest ages (P < 0.05).Figure 2. Soil infiltration characteristics of Robinia pseudoacacia plantation at same forest age withdifferent densities and same density with varied forest ages该研究中刺槐林的平均入渗速率的范围为4.09 ~ 8.75 mm/min,平均值为5.98 mm/min。在林分密度为1 200株/hm2条件下,15年的刺槐林平均入渗速率与35年的差异显著;在林分密度为1 600株/hm2条件下,25年的刺槐林平均入渗速率与35年的差异显著;在林龄为35年的条件下,林分密度为1 800株/hm2的刺槐林平均入渗速率与1 200株/hm2和1 600株/hm2的平均入渗速率均差异显著。
2.2 刺槐林土壤入渗过程模拟
土壤水分入渗过程通常会经历土壤入渗速率的急速下降、平缓下降和稳定3个阶段[22]。刺槐林在不同林龄不同密度的条件下,均表现出在入渗20 min左右入渗速率渐于平稳,在达到稳渗时,表现出稳渗速率分别随着密度和林龄的增加而变大(图3)。
![]() 图 3 同一林龄不同密度和同一密度不同林龄的刺槐林的土壤入渗过程Figure 3. Soil infiltration process of Robinia pseudoacacia plantation at same forest age with different densities and same density with varied forest ages
图 3 同一林龄不同密度和同一密度不同林龄的刺槐林的土壤入渗过程Figure 3. Soil infiltration process of Robinia pseudoacacia plantation at same forest age with different densities and same density with varied forest ages将测量的渗透数据拟合到选定的渗透模型中,即Philip、Horton、Kostiakov和通用经验模型结果如表3所示,获得了渗透模型的一系列参数,表明了不同模型对晋西黄土区刺槐林的土壤水分入渗过程模拟精度有所不同。
表 3 土壤入渗模型模拟Table 3. Simulation on soil infiltration model林龄/a
Stand
age/year密度/(株·hm−2)
Density/
(plant·ha−1)Horton 模型
Horton modelKoistakov 模型
Koistakov modelPhilip 模型
Philip model通用模型
General modelfs fo − fs β R2 a b R2 S fs R2 a fs b R2 15 1 200 1.799 18.046 0.806 0.979 8.384 0.583 0.945 19.068 0.843 0.954 8.490 0.572 0.052 0.994 1 600 1.605 26.798 0.879 0.933 10.557 0.587 0.942 21.402 1.815 0.943 14.416 0.439 3.017 0.954 1 800 2.410 18.666 0.833 0.980 9.294 0.522 0.973 22.028 0.185 0.872 8.805 0.555 0.355 0.994 2 200 2.923 20.600 0.757 0.975 10.857 0.499 0.957 22.973 0.144 0.917 12.727 0.419 1.504 0.960 25 800 2.695 25.103 1.014 0.955 10.629 0.540 0.972 19.112 0.624 0.973 11.595 0.495 0.701 0.973 1 200 1.864 21.811 0.829 0.979 9.470 0.587 0.958 22.474 1.379 0.964 11.835 0.471 1.839 0.964 1 600 2.073 24.885 1.117 0.960 9.180 0.597 0.926 24.142 0.958 0.989 8.690 0.627 0.321 0.996 2 200 2.262 23.984 0.760 0.971 10.959 0.540 0.973 25.635 0.884 0.978 13.567 0.438 2.007 0.990 35 1 200 1.954 33.780 0.810 0.925 13.712 0.502 0.920 19.426 1.213 0.927 22.707 0.321 7.474 0.950 1 600 3.207 35.086 1.103 0.979 13.050 0.539 0.936 27.598 1.210 0.951 16.410 0.445 2.577 0.992 1 800 2.642 21.209 1.089 0.937 9.173 0.546 0.961 29.314 0.352 0.908 7.692 0.651 1.028 0.986 2 200 2.890 34.562 1.229 0.918 12.139 0.558 0.968 29.068 1.208 0.969 13.691 0.504 1.134 0.969 Horton模型模拟的初始入渗速率和稳渗速率的值均比实测值大,与实测值相差1.29 ~ 5.43 mm/min和0.21 ~ 0.59 mm/min。在Kostiakov入渗模型中,参数b是指入渗速率随时间减小的程度,由表3可知,b的取值及其范围在0.499 ~ 0.597之间,由此可得,不同林龄不同密度刺槐林入渗速率随时间减小的程度相差不大。在Philip模型中,S为吸渗率,且在一定程度上能够反映初始入渗速率的大小[4];fs为稳渗速率,模拟的数值小于实测值,与实测值相差0.38 ~ 1.24 mm/min。Philip模型中的S与Horton模型中(fo − fs)值在同一密度条件下随着林龄的增加而呈现明显的增加趋势,表明刺槐林随着林龄的增加土壤入渗能力增强。回归系数R2作为模型模拟效果判定依据,其中R2越大表明模型模拟的效果越好。通过表3中模型的回归系数R2可知,该4个模型对晋西黄土区不同林龄不同密度刺槐林土壤入渗过程的模拟效果均较好(R2 > 0.900),其中通用经验模型的平均回归系数(0.977) > Horton模型的平均回归系数(0.958) > Kostiakov模型的回归系数(0.953) > Philip模型的回归系数(0.945)。即认为通用经验模型更适用于模拟本研究区刺槐林的土壤入渗过程。
2.3 土壤理化性质对入渗的影响
2.3.1 土壤入渗的相关性分析
本研究选取与土壤结构和土壤质地息息相关的11个影响因子,并将这些因子与土壤入渗的初始入渗速率、平均入渗速率和稳渗速率进行相关性分析,结果如表4可知,初始入渗速率与土壤初始含水量呈极显著负相关关系(P < 0.01);平均入渗速率与土壤初始含水量呈显著负相关关系(P < 0.05),与非毛管孔隙度和0.5 ~ 1 mm水稳性团聚体呈显著正相关关系(P < 0.05),其中与土壤初始含水量相关性最高;稳渗速率与土壤密度呈极显著负相关关系(P < 0.01),与1 ~ 2 mm水稳性团聚体和0.5 ~ 1 mm水稳性团聚体呈极显著正相关关系(P < 0.01),与有机质、土壤总孔隙度和毛管孔隙度呈显著正相关关系(P < 0.05),其中与1 ~ 2 mm水稳性团聚体相关性最高,表明稳渗速率受1 ~ 2 mm水稳性团聚体的影响最大。
表 4 土壤入渗性能与影响因子的相关性分析Table 4. Correlation analysis of soil infiltration performance and influencing factors影响因素
Influencing factor初始入渗速率
Initial infiltration rate平均入渗速率
Average infiltration rate稳定入渗速率
Stable infiltration rate土壤初始含水量
Initial moisture content of soil−0.785** −0.672* −0.201 土壤密度
Soil bulk density−0.425 −0.440 −0.751** 有机质含量
Organic matter content0.418 0.256 0.647* 土壤总孔隙度
Total porosity of soil0.238 0.277 0.663* 毛管孔隙度
Capillary porosity−0.004 0.006 0.681* 非毛管孔隙度
Non-capillary porosity0.548 0.614* 0.054 水稳性团聚体
Water-stable aggregate> 5 mm 0.030 −0.016 0.385 2 ~ 5 mm 0.199 0.504 0.169 1 ~ 2 mm 0.461 0.382 0.789** 0.5 ~ 1 mm 0.544 0.666* 0.754** 0.5 ~ 0.25 mm 0.243 0.360 0.359 注:**表示在P < 0.01水平呈极显著水平,*表示在P < 0.05水平呈显著水平。Notes: ** means very significant difference at P < 0.01 level; * means significant difference at P < 0.05 level. 2.3.2 影响土壤入渗的主导因素
将以上与土壤入渗息息相关的11个因子在SPSS中进行主成分分析,其中因子载荷是指原始变量与主成分的相关系数,相关系数越大,该主成分就越能代表该原始变量[23]。结果如表5所示:特征值大于1的成分有3个,其值分别为5.477、1.712和1.533,累积贡献率为79.287%,涵盖了大部分的信息,这表明前3个主成分能够代表最初11个因子对土壤入渗的影响,所以提取前3个因子,记作F1、F2、F3。第1个主成分因子由水稳性团聚体决定,其贡献率为49.788%,其中1 ~ 2 mm水稳性团聚体载荷最高(0.946),而 > 5 mm、2 ~ 5 mm、0.5 ~ 1 mm的水稳性团聚体载荷均在0.7附近,0.5 ~ 0.25 mm水稳性团聚体载荷极低(0.158),其次土壤密度、土壤总孔隙度和毛管孔隙度在第1主成分中也有较高的载荷;第2主成分主要由有机质决定,贡献率为15.559%,其次非毛管孔隙度和0.25 ~ 0.5 mm水稳性团聚体有较高的载荷;第3主成分因子主要有土壤初始含水量决定,其载荷量为−0.648。
表 5 土壤入渗影响因子的主成分分析分析Table 5. Principal component analysis on influencing factors of soil infiltration主成分
Principal componentF1 F2 F3 土壤初始含水量
Initial moisture content of soil−0.423 0.334 −0.648 土壤密度
Soil bulk density−0.926 −0.121 0.104 有机质含量
Organic matter content0.610 0.730 −0.216 土壤总孔隙度
Total porosity of soil0.923 −0.070 0.206 毛管孔隙度
Capillary porosity0.799 0.252 0.456 非毛管孔隙度
Non-capillary porosity0.391 −0.695 −0.504 水稳性团聚体
Water-stable aggregate> 5 mm 0.733 −0.176 0.456 2 ~ 5 mm 0.719 −0.389 0.244 1 ~ 2 mm 0.946 −0.004 −0.082 0.5 ~ 1 mm 0.671 0.203 −0.329 0.25 ~ 0.5 mm 0.158 0.628 −0.410 特征值
Characteristic value5.477 2.712 1.533 贡献率
Contribution rate/%49.788 15.559 13.939 累积贡献率
Cumulative contribution rate/%49.788 65.347 79.287 将主成分分析结果显示载荷较高的11个因子(载荷大于0.6)12组数据作为自变量分别与因变量初始入渗速率(Y1)、稳渗速率(Y2)和平均入渗速率(Y3)在SPSS中进行多元逐步回归,对选入的变量进行逐个检验,直到既无显著的自变量选入方程,也无不显著自变量从回归方程中剔除为止,并建立如下回归方程,经检验两者符合正态分布:
Y1=44.823−2.41X1R2=0.785,P=0.002<0.01 (5) Y2=0.565+1.15X2−0.754X3+0.402X4R2=0.825,P=0.002<0.01 (6) Y3=6.936−0.422X5+0.293X1R2=0.845,P=0.004<0.01 (7) 式中:X1表示土壤初始含水率,X2表示1 ~ 2 mm水稳性团聚体,X3表示土壤密度,X4表示毛管孔隙度,X5表示0.5 ~ 1 mm水稳性团聚体。R2为判定系数,也称拟合优度,其大小决定了相关的密切程度,R2越大自变量对因变量的解释程度越高。由此可得,影响初始入渗速率的显著因子为土壤初始含水量;影响稳渗速率的显著因子有1 ~ 2 mm水稳性团聚体、土壤容重和毛管孔隙度;影响平均入渗速率的显著因子为土壤初始含水量和0.5 ~ 1 mm水稳性团聚体。
3. 讨论与结论
3.1 土壤入渗过程分析
土壤水分入渗一般会经历3个阶段,即湿润阶段、渗漏阶段和渗透阶段,在这3个阶段水分受到不同力的作用[9, 24]。其中,在湿润阶段,水分在土壤中主要受分子力的作用,被土壤颗粒吸附进而形成薄膜水,使得初始含水量低的土壤,在该阶段入渗速率高于初始含水量高的土壤,同时在该阶段土壤入渗速率明显高于其他阶段。在渗漏阶段,水分主要受重力和毛细管力的作用,在土壤孔隙中移动,即毛管孔隙度大的土壤,在该阶段土壤入渗速率大,直至填满孔隙,土壤入渗速率趋于稳定。在渗透阶段,水分已填满孔隙,在重力的作用下下渗,入渗速率基本稳定不变。土壤水分入渗的3个阶段解释了不同林龄不同密度刺槐人工林土壤入渗过程存在差异的原因,即由土壤结构和性质决定。
3.2 土壤入渗特征及影响因素分析
本研究发现,在相同林龄条件下,刺槐林土壤初始入渗速率随林分密度的增加其变化规律不明显。通过比较不同密度刺槐林土壤初始含水量(表2)可知,刺槐林土壤含水量低的密度其土壤初始入渗速率高。这一现象可用土壤入渗过程中湿润阶段水分在土壤中主要受分子力的作用来解释,使得初始含水量低的土壤,入渗速率高于初始含水量高的土壤[9, 25-26]。同时表明与多元逐步回归筛选出影响初始入渗速率的显著因子为土壤初始含水量结果一致。
在一定范围内(800 ~ 2 200株/hm2),稳渗速率在同一林龄条件下,随密度的增加而增大;在同一密度条件下,随林龄的增加而增大。这一结果表明在一定范围内密度和林龄的增加改善了土壤结构,增加了入渗能力。由表2可知,随着林分密度和林龄的增加,土壤密度减小、有机质含量增加。这是因为随林分密度和林龄的增加,林内枯枝落叶增加、地表植被越来越丰富、根系越来越发达,提高了林内有机质含量,进而促进了团聚体的形成,改善了土壤结构[27]。但部分林分在一定范围内,稳渗速率随密度的增加而增大,随林龄的增加而增大,其大小差异不显著。王鑫浩等[28]在研究根系构型对土壤入渗性能的影响中发现水平根能阻止水分的下渗,数量越多稳渗速率越小。而刘秀萍等[29]在对刺槐根系分布特征研究中发现,刺槐以水平根为主,无明显主根。而这一发现可解释以上现象的原因,即随着刺槐林密度与林龄的增加,根系越来越发达,反而会阻止水分的下渗,使稳渗速率变小。
本研究选取土壤自身理化性质息息相关的11个因子与土壤入渗速率进行相关性分析(表4)可知,各因子均与入渗速率表现出相关性。通过主成分分析将11个因子进行降维,得到3个主成分,累计贡献率为79.287%,并将相关因子作为自变量与土壤入渗速率作为因变量进行逐步回归。R2为判定系数,也称拟合优度,其大小决定了相关的密切程度,R2越大自变量对因变量的解释程度越高,自变量引起的变动占总变动的百分比高。由此可知3个回归方程中的影响因素对各入渗速率均有较高的解释度和相关程度。其中,土壤密度是土壤的基本物理性质,它的大小间接反映了土壤的紧实松散程度、透气透水能力,土壤密度越小,土壤越松散,土壤总孔隙度、毛管孔隙度增多,土壤入渗性能越强[8, 30]。土壤团聚体能反映土壤结构的优劣,良好的团聚结构对保持土壤水分、肥力有着重要作用。土壤团聚结构越好,其孔隙越多、持水性、通透性越好[31]。除本研究选取的影响因素外,吕振豫等[6]在对土壤入渗研究进展及方向评述中提到土壤质地可通过改变颗粒表面能,影响土壤孔隙尺度与分布,进而影响土壤入渗能力。王意锟等[32]对浙西南毛竹(Phyllostachys heterocycla)林的土壤渗透性研究中发现,土壤中动物的多样性也会对土壤渗透性产生一定影响。王鑫浩等[28]研究了根系构型对土壤入渗性能的影响,并发现水平根能阻止水分的下渗,数量越多稳渗速率越小。故今后对土壤入渗影响因素的研究中可以更加全面的了解与揭示各影响因素的相关性与影响程度。
3.3 结 论
(1)晋西黄土残塬沟壑区土壤入渗特征,主要表现在一定范围内,稳渗速率随林龄和密度的增加而变大,初始入渗速率和平均入渗速率随林龄的增加而变大,即随着恢复年限和密度的增加,土壤结构不断改善,土壤入渗性能逐渐提升,当林龄为35年时土壤入渗性能最好。
(2)刺槐林在各密度和林龄条件下其土壤入渗均经过急速湿润阶段、平缓渗漏阶段和稳定渗透阶段。且通过对4种常用模型进行模拟可知,通用经验模型更适用于模拟晋西黄土区刺槐林的土壤入渗过程。
(3)通过对选取的影响因子进行主成分分析可知,影响初始入渗速率的决定因子为土壤初始含水量;影响稳渗速率的主要因子有1 ~ 2 mm水稳性团聚体、土壤密度和毛管孔隙度;土壤初始含水量和0.5 ~ 1 mm水稳性团聚体对平均入渗速率起主要作用。通过选取的所有因子的贡献率为79.287%,说明仍存在其他因素或其他重要因素未被考虑,可做进一步研究。
-
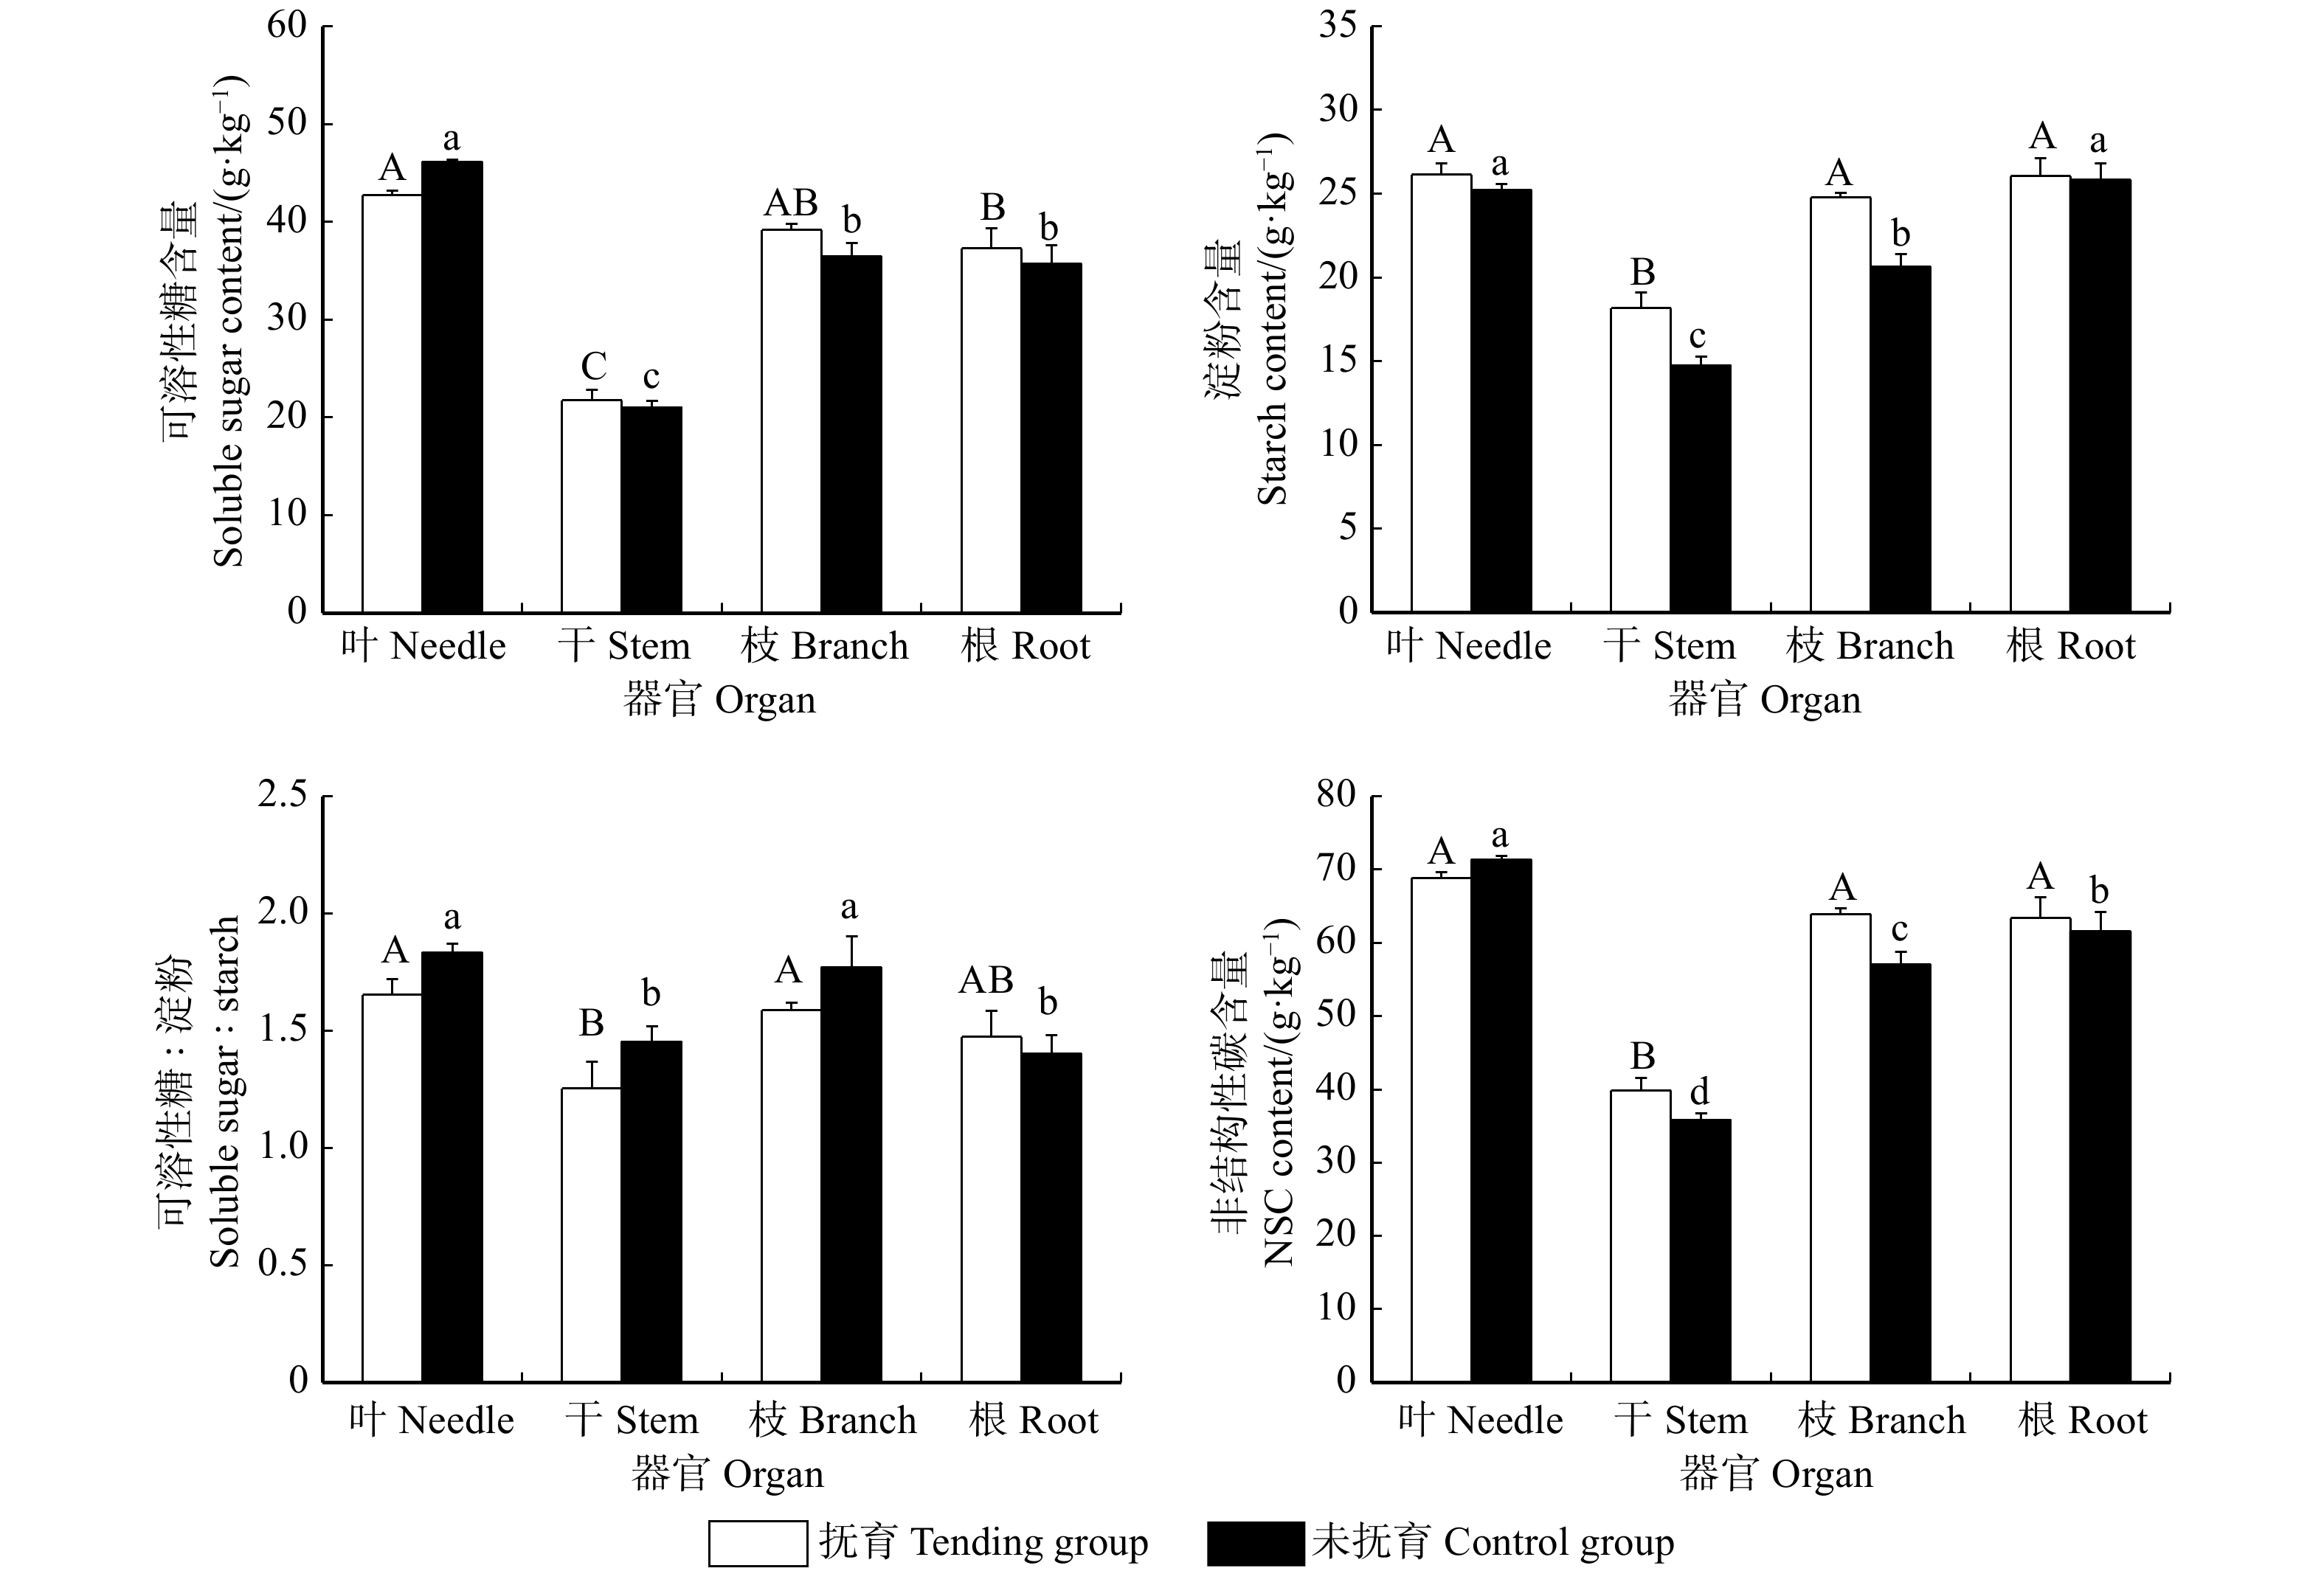
![]()
图 1 不同处理间云南松非结构性碳水化合物积累及分配
不同大写字母表示抚育组不同器官间差异显著(P < 0.05),不同小写字母表示未抚育组不同器官间差异显著(P < 0.05)。下同。Different capital letters indicate significant differences among varied organs in the tending group (P < 0.05), and different lowercase letters indicate significant differences among varied organs in the control group (P < 0.05). Same as below.
Figure 1. Accumulation and distribution of non-structural carbohydrates in Pinus yunnanensis among different treatments
![]()
图 2 不同处理间云南松碳氮磷及其计量比变化
Figure 2. Changes of C, N, P and their stoichiometric ratios of Pinus yunnanensis in different treatments
表 1 永仁县国有林场白马河林区样地基本情况调查表
Table 1 Basic information survey of Yongren County Baima River Forest Farm
样地编号
Sample plot No.海拔
Altitude/
m坡位和坡向
Slope position
and slope aspect平均
胸径
Average BDH/cm平均
树高
Average
tree
height/m间伐前
林木数
Pre-thinning
plant number采伐
株数
Felled
tree number间伐后
林木数
Post-thinning
plant number林分
密度/
(株·hm−2)
Stand density/
(tree ·ha−1)单株材积
Individual volume/
m3林分蓄积
Stand volume/
m3WFY-1 2 275 上坡位、西北330°、 半阴坡
Uphill position,
northwest 330°,
semi-shady slope12.3 10.3 126 0 126 1 890 0.068 5 8.637 2 WFY-3 2 216 中坡位、西北318°、 半阴坡
Middle slope,
northwest 318°,
semi-shady slope15.2 12.6 95 0 95 1 425 0.120 7 11.470 4 WFY-4 2 480 上坡位、正西269°、 半阳坡
Uphill position,
due west 269°,
half-sunny slope14.8 11.1 118 0 118 1 770 0.104 1 12.288 4 FY-2 2 360 上坡位、北偏东92°、 半阴坡
Uphill position,
north by east 92°,
semi-shady slope16.5 12.9 102 36 66 990 0.144 3 9.523 2 FY-5 2 530 上坡位、西北308°、 半阴坡
Uphill position,
northwest 308°,
semi-shady slope16.3 10.0 85 30 55 825 0.116 2 6.392 3 FY-6 2 438 上坡位、西北300°、 半阴坡
Uphill position,
northwest 300°,
semi-shady slope18.8 14.0 95 33 62 930 0.198 1 12.281 7 注:抚育样地间伐强度为总株数的35%,间伐木的选择按照留优去劣、间密留匀、兼顾株间距的原则确定,于2017年年初完成。对照样地不采取任何抚育措施。Notes: the thinning intensity of tending sample plots is 35% of the total number of plants. The selection of thinning is determined in accordance with the principles of keeping the best and eliminating the bad, keeping the density evenly and giving consideration to the spacing between plants, and we have completed at the beginning of year 2017. No measure was taken on the CK land.  下载: 导出CSV
表 2 样地林分调查表
Table 2 Survey of sample site stand
样地编号
Sample plot No.林木株数
Plant number胸径 DBH/cm 树高 Tree height/m 材积 Volume/m3 蓄积量
Accumulation volume/m3平均值
Average value平均增长量
Average growth平均值
Average value平均增长量
Average growth平均值
Average value平均增长量
Average growth平均值
Average value平均增长量
Average growthWFY-1 124 13.5 1.2 11.7 1.4 0.090 5 0.022 0 11.222 0 2.584 8 WFY-3 95 16.8 1.6 14.1 1.5 0.159 9 0.039 2 15.190 5 3.720 1 WFY-4 118 16.6 1.8 13.6 2.5 0.152 0 0.047 9 17.936 0 5.647 6 FY-2 66 18.9 2.4 14.9 2.0 0.209 8 0.065 5 13.846 8 4.323 6 FY-5 54 19.2 2.9 12.6 2.6 0.190 6 0.074 4 10.292 4 3.900 1 FY-6 62 20.0 1.2 15.8 1.8 0.245 0 0.046 9 15.190 0 2.908 3 注:平均增长量是指与表1中指标相比。
Note: the average growth index means compared with the indicators in Tab. 1.
下载: 导出CSV
表 3 抚育对不同器官非结构性碳水化合物含量影响的双因素方差分析(F值)
Table 3 Two-way ANOVA on the effects of tending on the content of non-structural carbohydrates indifferent organs (F value)
因素
Factor可溶性糖
Soluble sugar淀粉
StarchNSC 抚育
Tending0.096 13.610** 3.401 器官
Organ134.330** 73.269** 138.487** 抚育 × 器官
Tending × organ2.220 2.520 2.222 注:** 表示 P < 0.01。下同。Notes: ** denotes P < 0.01. Same as below.
下载: 导出CSV
表 4 抚育对不同器官非结构性碳水化合物含量影响的独立样本t检验分析
Table 4 Independent sample t-test analysis of the effects of tending on the content of non-structural carbohydrates in different organs
指标 Index 叶 Needle 干 Stem 枝 Branch 根 Root 可溶性糖 Soluble sugar −6.890** 0.404 1.623 0.527 淀粉 Starch 1.197 3.069** 4.507** 0.102 NSC −2.674** 1.967 3.230** 0.407
下载: 导出CSV
表 5 抚育对不同器官C、N、P含量及其计量比的双因素方差分析(F值)
Table 5 Two-way ANOVA on the effects of tending on C, N, P contents and their stoichiometric ratios in different organs (F value)
因素 Factor C N P C∶N C∶P N∶P 抚育 Tending 5.828* 3.817 11.902** 1.346 13.003** 18.249** 器官 Organ 18.621** 554.421** 5.560** 14.139** 7.486** 177.257** 抚育 × 器官 Tending × organ 1.308 9.838** 4.092** 0.792 3.061* 10.077** 注:*表示P < 0.05。下同。Notes: * denotes P < 0.05. Same as below.
下载: 导出CSV
表 6 抚育对不同器官C、N、P含量及其计量比的独立样本t检验分析
Table 6 Independent sample t-test analysis of the effects of tending on C, N, P contents and their stoichiometricratios in different organs
指标 Index t值 t value 叶 Needle 干 Stem 枝 Branch 根 Root C 1.564 0.246 2.370* 0.454 N 3.835** −0.489 0.040 −1.482 P −2.646* −4.167** −0.376 −0.553 C∶N −1.249 0.740 0.622 0.979 C∶P 2.216* 3.873** 0.433 1.155 N∶P 4.057** 3.327** −0.153 −0.141
下载: 导出CSV
表 7 云南松叶−干−枝−根C、N、P含量相关性
Table 7 Correlations of C, N and P contents in needle-stem-branch-root of Pinus yunnanensis
指标
Index叶C
Needle C叶N
Needle N叶P
Needle P干C
Stem C干N
Stem N干P
Stem P枝C
Branch C枝N
Branch N枝P
Branch P根C
Root C根N
Root N根P
Root P叶C Needle C 1 叶N Needle N −0.99 1 叶P Needle P −0.589* −0.341 1 干C Stem C −0.258 0.315 −0.312 1 干N Stem N −0.148 0.062 0.177 −0.101 1 干P Stem P −0.408 −0.493* 0.501* 0.100 −0.001 1 枝C Branch C 0.186 0.409 −0.124 0.129 0.165 −0.613** 1 枝N Branch N 0.008 −0.182 0.148 −0.148 −0.343 0.038 −0.387 1 枝P Branch P 0.086 −0.279 0.182 −0.064 −0.39 0.256 −0.289 0.537** 1 根C Root C 0.231 −0.263 0.226 −0.308 0.050 −0.052 −0.012 0.395 0.423 1 根N Root N −0.310 −0.031 0.247 0.173 0.654** 0.302 0.059 −0.282 −0.278 −0.077 1 根P Root P −0.200 −0.090 0.049 0.107 −0.062 0.219 −0.409 0.222 0.411 0.270 −0.061 1
下载: 导出CSV
表 8 云南松叶、干、枝、根C∶N∶P相关性
Table 8 Correlations of C, N and P stoichiometry of needle-stem-branch-root of Pinus yunnanensis
指标
Index叶C∶N
Needle
C∶N叶C∶P
Needle
C∶P叶N∶P
Needle
N∶P干C∶N
Stem
C∶N干C∶P
Stem
C∶P干N∶P
Stem
N∶P枝C∶N
Branch
C∶N枝C∶P
Branch
C∶P枝N∶P
Branch
N∶P根C∶N
Root
C∶N根C∶P
Root
C∶P根N∶P
Root
N∶P叶C∶N
Needle C∶N1 叶C∶P
Needle C∶P0.398 1 叶N∶P
Needle N∶P−0.280 0.753** 1 干C∶N
Stem C∶N−0.058 0.226 0.214 1 干C∶P
Stem C∶P−0.201 0.386 0.571* 0.168 1 干N∶P
Stem N∶P−0.210 0.298 0.516* −0.332 0.848** 1 枝C∶N
Branch C∶N−0.200 0.023 0.201 −0.172 0.118 0.232 1 枝C∶P
Branch C∶P−0.291 −0.029 0.269 −0.303 0.174 0.337 0.635** 1 枝N∶P
Branch N∶P−0.041 −0.064 0.071 −0.310 0.110 0.223 −0.078 0.671** 1 根C∶N
Root C∶N0.502* 0.388 0.041 0.246 0.166 0.060 −0.039 −0.273 −0.329 1 根C∶P
Root C∶P0.099 0.036 −0.020 −0.150 0.425 0.405 0.252 0.223 0.082 0.293 1 根N∶P
Root N∶P−0.281 −0.287 −0.090 −0.441 −0.052 0.120 0.368 0.473* 0.301 −0.570* 0.481* 1
下载: 导出CSV
表 9 云南松NSC构成与C、N、P及其计量比间相关系数
Table 9 Correlation coefficients among NSC composition, C, N, P and their stoichiometric ratios of Pinus yunnanensis
器官 Organ 指标 Index 可溶性糖 Soluble sugar 淀粉 Starch NSC C N P C∶N C∶P N∶P 叶 Needle 可溶性糖 Soluble sugar 1 淀粉 Starch −0.120 1 NSC 0.684** 0.642** 1 C −0.587* −0.110 −0.534* 1 N −0.272 0.247 −0.029 −0.099 1 P 0.561* −0.223 0.270 −0.589* −0.341 1 C∶N −0.175 −0.236 −0.308 0.664** −0.801** −0.120 1 C∶P −0.607* 0.134 −0.370 0.836** 0.149 −0.901** 0.398 1 N∶P −0.546* 0.357 −0.160 0.393 0.721** −0.864** −0.280 0.753** 1 干 Stem 可溶性糖 Soluble sugar 1 淀粉 Starch 0.543** 1 NSC 0.839** 0.913** 1 C −0.179 −0.032 −0.108 1 N 0.110 −0.016 0.043 −0.101 1 P 0.175 −0.194 −0.041 0.100 −0.001 1 C∶N −0.255 0.040 −0.098 0.370 −0.930** −0.008 1 C∶P −0.225 0.100 −0.045 −0.015 −0.170 −0.858** 0.168 1 N∶P 0.047 0.162 0.128 −0.176 0.298 0.819** −0.332 0.848** 1 枝 Branch 可溶性糖 Soluble sugar 1 淀粉 Starch 0.226 1 NSC 0.903** 0.623** 1 C −0.002 0.494* 0.216 1 N 0.085 0.037 0.084 −0.387 1 P 0.464 −0.009 0.369 −0.289 0.537* 1 C∶N −0.102 0.129 −0.025 0.705** −0.911** −0.543* 1 C∶P −0.454 0.074 −0.332 0.377 −0.591** −0.942** 0.635** 1 N∶P −0.452 −0.067 −0.392 −0.127 0.081 −0.755** −0.078 0.671** 1 根 Root 可溶性糖 Soluble sugar 1 淀粉Starch 0.703** 1 NSC 0.963** 0.868** 1 C 0.241 0.226 0.253 1 N 0.027 0.158 0.079 −0.077 1 P 0.472* 0.211 0.409 0.270 −0.061 1 C∶N −0.110 −0.238 −0.167 0.272 −0.762** −0.150 1 C∶P −0.441 −0.110 −0.349 0.161 −0.038 −0.816** 0.293 1 N∶P −0.153 0.180 −0.039 −0.175 0.769** −0.483* −0.570* 0.481* 1
下载: 导出CSV
-
[1] Russell E S, Liu H P, Thistle H, et al. Effects of thinning a forest stand on sub-canopy turbulence[J]. Agricultural and Forest Meteorology, 2018, 248: 295−305. doi: 10.1016/j.agrformet.2017.10.019
[2] 王凯, 赵成姣, 张日升, 等. 不同密度樟子松人工林土壤碳氮磷化学计量特征[J]. 生态学杂志, 2020, 39(3):741−748. Wang K, Zhao C J, Zhang R S, et al. Soil carbon, nitrogen and phosphorus stoichiometry of Pinus sylvestris var. mongolica plantations with different densities[J]. Chinese Journal of Ecology, 2020, 39(3): 741−748.
[3] 郭子武, 陈双林, 杨清平, 等. 密度对四季竹叶片 C、N、P 化学计量和养分重吸收特征的影响[J]. 应用生态学报, 2013, 24(4):893−899. Guo Z W, Chen S L, Yang Q P, et al. Effects of stand density on Oligostachyum lubricum leaf carbon, nitrogen, and phosphorus stoichiometry and nutrient resorption[J]. Chinese Journal of Applied Ecology, 2013, 24(4): 893−899.
[4] Yang Y, Liu B. Effects of planting Caragana shrubs
on soil nutrients and stoichiometries in desert steppe of northwest China[J]. Catena, 2019, 183: 104213. doi: 10.1016/j.catena.2019.104213 [5] 杜尧, 韩轶, 王传宽. 干旱对兴安落叶松枝叶非结构性碳水化合物的影响[J]. 生态学报, 2014, 34(21):6090−6100. Du Y, Han Y, Wang C K. The influence of drought on non-structural carbohydrates in the needle and twigs of Larix gmelinii[J]. Acta Ecologica Sinica, 2014, 34(21): 6090−6100.
[6] 韩发, 贲桂英, 师生波. 青藏高原不同海拔矮嵩草抗逆性的比较研究[J]. 生态学报, 1998, 18(6):92−97. Han F, Ben G Y, Shi S B. Comparative study on the resistance of Kobresia humilis grown at different altitudes in Qinghai-Xizang Plateau[J]. Acta Ecologica Sinica, 1998, 18(6): 92−97.
[7] 贺金生, 韩兴国. 生态化学计量学: 探索从个体到生态系统的统一化理论[J]. 植物生态学报, 2010, 34 (1):2−6. doi: 10.3773/j.issn.1005-264x.2010.01.002 He J S, Han X G. Ecological stoichiometry: searching for unifying principles from individuals to ecosystems[J]. Chinese Journal of Plant Ecology, 2010, 34 (1): 2−6. doi: 10.3773/j.issn.1005-264x.2010.01.002
[8] 黄小波. 云南松天然次生林生态化学计量学研究[D]. 北京: 中国林业科学研究院, 2016. Huang X B. Stoichiometry of Pinus yunnanensis natural secondary forest[D]. Beijing: Chinese Academy of Forestry, 2016.
[9] 王凯, 沈潮, 曹鹏, 等. 沙地樟子松幼苗干旱致死过程中非结构性碳水化合物的变化[J]. 应用生态学报, 2018, 29(11): 3513−3520. Wang K, Shen C, Cao P, et al. Changes of non-structural carbohydrates of Pinus sylvestris var. mongolica seedlings in the process of drought-induced mortality[J]. Chinese Journal of Applied Ecology, 2018,29(11): 3513−3520.
[10] 成向荣, 虞木奎, 葛乐, 等. 不同间伐强度下麻栎人工林碳密度及其空间分布[J]. 应用生态学报, 2012, 23(5):1175−1180. Cheng X R, Yu M K, Ge L, et al. Carbon density and its spatial distribution in Quercus acutissima plantations under different thinning intensities[J]. Chinese Journal of Applied Ecology, 2012, 23(5): 1175−1180.
[11] 刘莉, 蔡锰柯, 刘旭军, 等. 间伐对华北落叶松人工林叶、根及林下土壤C、N、P化学计量特征影响[J]. 东北林业大学学报, 2019, 47(8):1−7. doi: 10.3969/j.issn.1000-5382.2019.08.001 Liu L, Cai M K, Liu X J, et al. Effects of thinning on ecological stoichiometry C, N and P in leaves, roots and soil of Larix principis-rupprechtii plantation[J]. Journal of Northeast Forestry University, 2019, 47(8): 1−7. doi: 10.3969/j.issn.1000-5382.2019.08.001
[12] 邱勇斌, 凌高潮, 郑文华, 等. 间伐对杉木人工林不同组分碳、氮、磷含量及其生态化学计量关系的影响[J]. 林业科学研究, 2019, 32(4):64−69. Qiu Y B, Ling G C, Zheng W H, et al. Effects of thinning on contents and stoichiometry of C, N, and P in different components of Chinese fir plantation[J]. Forest Research, 2019, 32(4): 64−69.
[13] 王晓荣, 雷蕾, 曾立雄, 等. 不同抚育间伐措施对马尾松林土壤活性有机碳的短期影响[J/OL]. 生态学杂志, 2021, 40(4): 1−18 [2021−07−02]. https://doi.org/10.13292/j.1000-4890.202104.008. Wang X R, Lei L, Zeng L X, et al. Short-term effects of different tending thinning practices on soil labile organic carbon of Pinus massoniana stands[J]. Chinese Journal of Ecology, 2021, 40(4): 1−18 [2021−07−02]. https://doi.org/10.13292/j.1000-4890.202104.008.
[14] 郑云普, 王贺新, 娄鑫, 等. 木本植物非结构性碳水化合物变化及其影响因子研究进展[J]. 应用生态学报, 2014, 25(4):1188−1196. Zheng Y P, Wang H X, Lou X, et al. Changes of non-structural carbohydrates and its impact factors in trees: a review[J]. Chinese Journal of Applied Ecology, 2014, 25(4): 1188−1196.
[15] 黄小波, 李帅锋, 苏建荣, 等. 云南松天然次生林物种丰富度与生态系统多功能性的关系[J]. 生物多样性, 2017, 25(11):42−51. Huang X B, Li S F, Su J R, et al. Relationship between species richness and ecosystem multifunctionality of natural secondary forest of Pinus yunnanensis[J]. Biodiversity Science, 2017, 25(11): 42−51.
[16] 张育梅, 及利, 和春庭. 抚育间伐对云南松中幼林的影响[J]. 森林工程, 2017, 33(1):7−11. doi: 10.3969/j.issn.1006-8023.2017.01.003 Zhang Y M, Ji L, He C T. Effect of thinning on mid-young Pinus yunnanensis plantations[J]. Forest Engineering, 2017, 33(1): 7−11. doi: 10.3969/j.issn.1006-8023.2017.01.003
[17] 韩明跃, 李莲芳, 郑畹, 等. 间伐强度对云南松中龄低产林分结构的调整研究[J]. 中南林业科技大学学报, 2011, 31(2):27−33. Han M Y, Li L F, Zheng W, et al. Effects of different intensity of thinning on the improvement of middle-aged Yunnan pine stand[J]. Journal of Central South University of Forestry & Technology, 2011, 31(2): 27−33.
[18] 杨剑辉, 欧弢, 陈金龙, 等. 不同间伐梯度下云南松幼林林分结构及林木生长变化[J]. 浙江林业科技, 2015, 35(6):54−57. doi: 10.3969/j.issn.1001-3776.2015.06.010 Yang J H, Ou T, Chen J L, et al. Stand structure and tree growth of young growth of Pinus yunnanensis under different thinning intensities[J]. Journal of Zhejiang Forestry Science and Technology, 2015, 35(6): 54−57. doi: 10.3969/j.issn.1001-3776.2015.06.010
[19] 高成杰, 唐国勇, 刘方炎, 等. 林分结构调整对云南松次生林生长和土壤性质的影响[J]. 林业科学研究, 2017, 30(5):841−847. Gao C J, Tang G Y, Liu F Y, et al. Effects of stand structural adjustment on growth and soil properties of Pinus yunnanensis secondary forest[J]. Forest Research, 2017, 30(5): 841−847.
[20] 王学奎, 黄见良. 植物生理生化实验原理和技术[M].3 版. 北京: 高等教育出版社, 2018. Wang X K, Huang J L. Principles and techniques of plant physiological and biochemical experiments [M]. 3rd ed. Beijing: Higher Education Press, 2018.
[21] 鲍士旦. 土壤农化分析[M]. 3 版. 北京: 中国农业出版社, 2000. Bao S D. Soil agrochemical analysis[M]. 3rd ed. Beijing: China Agricultural Press, 2000.
[22] Chantuma P, Lacointe A, Kasemsap P, et al. Carbohydrate storage in wood and bark of rubber trees submitted to different level of C demand induced by latex tapping[J]. Tree Physiology, 2009, 29: 1021−1031. doi: 10.1093/treephys/tpp043
[23] 霍常富, 孙海龙, 王政权, 等. 光照和氮营养对水曲柳苗木生长及碳-氮代谢的影响[J]. 林业科学, 2009, 45(7):38−44. doi: 10.3321/j.issn:1001-7488.2009.07.007 Huo C F, Sun H L, Wang Z Q, et al. Effects of light and nitrogen on growth, carbon and nitrogen metabolism of Fraxinus mandshurica seedlings[J]. Scientia Silvae Sinicae, 2009, 45(7): 38−44. doi: 10.3321/j.issn:1001-7488.2009.07.007
[24] 王子纯, 李耀翔, 孟永斌, 等. 抚育间伐对针阔混交天然次生林生物量及碳密度的影响[J]. 东北林业大学学报, 2021, 49(4):5−11. doi: 10.3969/j.issn.1000-5382.2021.04.002 Wang Z C, Li Y X, Meng Y B, et al. Effect of thinning on biomass and carbon density of mixed conifer and broadleaf secondary natural forest[J]. Journal of Northeast Forestry University, 2021, 49(4): 5−11. doi: 10.3969/j.issn.1000-5382.2021.04.002
[25] Michaels A F. The ratios of life[J]. Science, 2003, 300: 906−907. doi: 10.1126/science.1083140
[26] 邬畏, 何兴东, 周启星. 生态系统氮磷比化学计量特征研究进展[J]. 中国沙漠, 2010, 30(2):296−302. Wu W, He X D, Zhou Q X. Review on N∶P stoichiometry in ecosystem[J]. Journal of Desert Research, 2010, 30(2): 296−302.
[27] Dey D C, Parker W C. Overstorey density affects field performance of underplanted red oak (Quercus rubra) in Ontario[J]. Northern Journal of Applied Forestry, 1997, 14(3): 120−125. doi: 10.1093/njaf/14.3.120
[28] 方海波, 田大伦, 康文星, 等. 间伐后杉木人工林生态系统养分动态的研究[J]. 中南林学院学报, 1999, 19(2):15−22. Fang H B, Tian D L, Kang W X, et al. Nutrient dynamics of Cunninghamia lanceolata plantation forest ecosystems after thinning[J]. Journal of Central South University of Forestry & Technology, 1999, 19(2): 15−22.
[29] 管惠文, 董希斌, 张甜, 等. 抚育间伐后落叶松天然次生林生境恢复效果的评价[J]. 东北林业大学学报, 2019, 47(7):6−13, 24. doi: 10.3969/j.issn.1000-5382.2019.07.002 Guan H W, Dong X B, Zhang T, et al. Evaluation of ecological environment restoration of thinning intensity on larch natural secondary forest in Daxing’an Mountains[J]. Journal of Northeast Forestry University, 2019, 47(7): 6−13, 24. doi: 10.3969/j.issn.1000-5382.2019.07.002
[30] Thompson K E N, Parkinson J A, Band S R, et al. A comparative study of leaf nutrient concentrations in a regional herbaceous flora[J]. New Phytologist, 1997, 136(4): 679−689. doi: 10.1046/j.1469-8137.1997.00787.x
[31] 孙小妹, 何明珠, 周彬, 等. 霸王根茎叶非结构性碳与C∶N∶P计量特征对干旱的响应[J]. 干旱区地理, 2021, 44(1):240−249. Sun X M, He M Z, Zhou B, et al. Non-structural carbohydrates and C∶N∶P stoichiometry of roots, stems, and leaves of Zygophyllum xanthoxylon in responses to xeric condition[J]. Arid Land Geography, 2021, 44(1): 240−249.
[32] 熊静, 虞木奎, 成向荣, 等. 光照和氮磷供应比对木荷生长及化学计量特征的影响[J]. 生态学报, 2021, 41(6):2140−2150. Xiong J, Yu M K, Cheng X R, et al. Effects of light and N-P supply ratios on growth and stoichiometric of Schima superba[J]. Acta Ecologica Sinica, 2021, 41(6): 2140−2150.
[33] Fife D N, Nambiar E K S, Saur E. Retranslocation of foliar nutrients in evergreen tree species planted in a Mediterranean environment[J]. Tree Physiology, 2008, 28: 187−196. doi: 10.1093/treephys/28.2.187
[34] Makino W, Cotner J B, Sterner R W, et al. Are bacteria more like plants or animals? Growth rate and resource dependence of bacterial C∶N∶P stoichiometry[J]. Functional Ecology, 2003, 17(1): 121−130. doi: 10.1046/j.1365-2435.2003.00712.x
[35] Koerselman W, Meuleman A F M. The vegetation N∶P ratios: a new tool to detect the nature of nutrient limitation[J]. Journal of Applied Ecology, 1996, 33: 1441−1450. doi: 10.2307/2404783
[36] Han W, Fang J, Guo D, et al. Leaf nitrogen and phosphorus stoichiometry across 753 terrestrial plant species in China[J]. New Phytologist, 2005, 168: 377−385. doi: 10.1111/j.1469-8137.2005.01530.x
[37] 崔宁洁, 刘小兵, 张丹桔, 等. 不同林龄马尾松人工林碳氮磷分配格局及化学计量特征[J]. 生态环境学报, 2014, 23(2):188−195. doi: 10.3969/j.issn.1674-5906.2014.02.002 Cui N J, Liu X B, Zhang D J, et al. The Distribution pattern of carbon, nitrogen and phosphorus and the stoichiometry characteristics of Pinus massoniana plantation in different ages[J]. Ecology and Environmental Sciences, 2014, 23(2): 188−195. doi: 10.3969/j.issn.1674-5906.2014.02.002
[38] Xiao L, Liu G B, Li P, et al. Nitrogen addition has a stronger effect on stoichiometries of non-structural carbohydrates, nitrogen and phosphorus in Bothriochloa ischaemum than elevated CO2[J]. Plant Growth Regulation, 2017, 83(2): 325−334. doi: 10.1007/s10725-017-0298-8
[39] 印婧婧, 郭大立, 何思源, 等. 内蒙古半干旱区树木非结构性碳、氮、磷的分配格局[J]. 北京大学学报(自然科学版), 2009, 45(3):519−527. Yin J J, Guo D L, He S Y, et al. Non-structural carbohydrate, N, and P allocation patterns of two temperate tree species in a semi-arid region of Inner Mongolia[J]. Acta Scientiarum Naturalium Universitatis Pekinensis, 2009, 45(3): 519−527.
[40] Lambers H, Chapin F, Pons T. Plant physiological ecology[M]. New York: Springer-Verlag, 1998.
[41] 王凯, 雷虹, 夏扬, 等. 杨树幼苗非结构性碳水化合物对增加降水和氮添加的响应[J]. 应用生态学报, 2017, 28(2):399−407. Wang K, Lei H, Xia Y, et al. Responses of non-structural carbohydrates of poplar seedlings to increased precipitation and nitrogen addition[J]. Chinese Journal of Applied Ecology, 2017, 28(2): 399−407.
[42] 宋同清. 西南喀斯特植物与环境[M]. 北京: 科学出版社, 2014. Song T Q. Karst plants and environment in southwest China[M]. Beijing: Science Press, 2014.
[43] 王淳, 冀盼盼, 刘璇, 等. 华北落叶松不同器官碳氮磷化学计量特征[J]. 干旱区资源与环境, 2020, 34(11):176−181. Wang C, Ji P P, Liu X, et al. Ecological C, N and P stoichiometry of the needle, twigs and fine roots in pure and mixed stands of Larix principis-rupprechtii[J]. Journal of Arid Land Resources and Environment, 2020, 34(11): 176−181.
[44] 盘金文, 郭其强, 孙学广, 等. 不同林龄马尾松人工林碳、氮、磷、钾养分含量及其生态化学计量特征[J]. 植物营养与肥料学报, 2020, 26(4):746−756. doi: 10.11674/zwyf.19272 Pan J W, Guo Q Q, Sun X G, et al. Contents and stoichiometric characteristics of C, N, P and K under different stand ages of Pinus massoninana plantations[J]. Journal of Plant Nutrition and Fertilizers, 2020, 26(4): 746−756. doi: 10.11674/zwyf.19272
[45] 贺合亮, 阳小成, 李丹丹, 等. 青藏高原东部窄叶鲜卑花碳、氮、磷化学计量特征[J]. 植物生态学报, 2017, 41(1):126−135. He H L, Yang X C, Li D D, et al. Stoichiometric characteristics of carbon, nitrogen and phosphorus of Xianbei flower in east Qinghai-Tibet Plateau[J]. Chinese Journal of Plant Ecology, 2017, 41(1): 126−135.
[46] 孙小妹, 何明珠, 杨睿哲. 白刺器官间非结构性碳水化合与C∶N∶P计量比的关联性[J]. 生态学报, 2021, 41(3):1−11. Sun X M, He M Z, Yang R Z. Correlation of non-structural carbohydrates with C∶N∶P stoichiometry among the organs of Nitraria tangutorum[J]. Acta Ecologica Sinica, 2021, 41(3): 1−11.
[47] Theodorou M, Plaxton W. Metabolic adaptations of plant respiration to nutritional phosphate deprivation[J]. Plant Physiology, 1993, 101: 339−344. doi: 10.1104/pp.101.2.339


计量
- 文章访问数: 1253
- HTML全文浏览量: 466
- PDF下载量: 135
