
Comparison of crown width models and estimation methods of natural spruce fir forest in Jingouling Forest Farm of northeastern China
-
摘要:目的 对比不同冠幅预测方法对云冷杉幼树不同方向冠幅(东、西、南、北、东西、南北、平均冠幅)的预测精度的差异,为天然云冷杉林经营提供一定的理论依据。方法 利用2013年金沟岭云冷杉3块1 hm2固定样地中云冷杉幼树各向冠幅实测数据,以逻辑斯蒂模型为基础模型,以非线性最小二乘法为基础方法进行模型初步拟合。以1/D、1/D0.5、1/D2作为模型的权函数进行模型异方差的消除。以不加权非线性似乎不相关法、加权非线性似乎不相关法、分位数回归法、非线性最小二乘法分别构建了云冷杉幼树冠幅各组分预测模型。结果 模型拟合结果显示,分位数回归模型的拟合效果在云冷杉幼树冠幅预测模型中拟合精度最低;相较于分位数回归而言,加权非线性似乎不相关回归模型拟合效果与加权最小二乘模型拟合效果相当。模型拟合效果排序为:加权NSUR ≈ 加权OLS > OLS > QR。以1/D2作为模型的权函数时,模型残差图的异方差趋势被消除最明显,该权函数为最优权函数。结论 本文中非线性分位数回归模型拟合效果不一定比非线性最小二乘法更好。加权NSUR模型(权函数为1/D2)可以为金沟岭林场云冷杉幼树冠幅的预测提供一定的理论基础。
-
关键词:
- 冠幅模型 /
- 幼树 /
- 权函数 /
- 非线性似乎不相关回归 /
- 分位数回归
Abstract:Objective Different crown prediction methods were used to predict varied crown components (east, west, south, north crown width and east-west crown width, south-north crown width, average crown width) of young spruce fir, and the prediction accuracy was compared in order to provide a theoretical basis for the tending of spruce fir management.Method The measured data of different crown components in permanent spruce fir sample plots was got from three 1 ha sample plots on Jingouling Forest Farm of northeastern China in 2013, the logistic model was chosen as base model and the ordinary least square method was used to fit crown radii of east, west, south, north and crown width of east-west, south-north, and mean direction. 1/D, 1/D0.5, and 1/D2 were used as weight function to eliminate the heteroscedasticity of model residuals. The unweighted nonlinear seemingly unrelated regression method, weighted nonlinear seemingly unrelated regression method, quantile regression method, and ordinary least square method were applied to develop different crown component prediction model.Result The fitting results indicated that, quantile regression model had the lowest fitting accuracy, compared with quantile regression, weighted nonlinear seemingly unrelated regression and weighted ordinary least square regression had nearly same fitting effectiveness. The accuracy order arrangement was weighted NSUR ≈ weighted OLS > OLS > QR, 1/D2 was the best choice to eliminate heteroscedasticity by residuals plot.Conclusion In this paper, the fitting effect of nonlinear quantile regression model was not necessarily better than that of nonlinear least square method, the weighted nonlinear seemingly unrelated regression model (1/D2 as weight function) developed in this essay can provide some theory basis for different crown components of young spruce fir. -
树冠大小指标是反映树木生长和树木健康状况的重要指标[1-2],包括冠长、冠长比、冠幅、树冠轮廓。冠幅作为衡量单木活力的重要指标,可以用来预测单木的生长、枯死[3]以及单木地上生物量[4-5]和模拟冠层光截留[6]。大树冠测量相对费时费力,且精度难以保证。幼树树冠的测量相比大树较容易,但是也存在一定的困难。冠幅模型的构建对于有效预测树冠动态生长、估计树冠单木生物量及存活概率,并通过模型构建提出一定的经营措施以加速林分的正向演替、促进林分结构的稳定具有一定的借鉴意义[7-8]。
构建冠幅模型的方法主要集中在混合效应模型、度量误差模型、广义代数差分方程、广义可加模型、分位数回归模型等,对于模拟冠幅生长有着很好的效果。如Lei等[9]采用104块蒙古栎(Quercus mongolica)调查样地冠幅数据,利用似乎不相关方法和两步度量误差模型法进行估计,构建了一步比例平差冠幅模型系统、两步比例平差冠幅模型系统和可加性冠幅模型系统;Fu等[10]利用非线性混合效应模型构建了杉木(Cunninghamia lanceolata)的平均冠幅模型;Sharma等[11]利用混合效应模型中加入Hegyi竞争指数研究了捷克的欧洲云杉(Picea abies)和欧洲山毛榉(Fagus sylvatica)冠幅模型;贺梦莹等[12]利用东北地区长白落叶松(Larix olgensis)和水曲柳(Fraxinus mandshurica)两种树种的冠幅测量数据,构建了基于哑变量的不同混交模式和不同树种的冠幅模型。李凤日等[13]以样地实测数据探讨有效冠的概念、单木和林分有效冠的确定方法, 得到了单木和林分有效冠。此外,在遥感领域,通过遥感影像可以提取出单木的冠幅数据,较为容易获取的冠幅数据对单木的胸径、单木和林分生物量的估计是常用的有效方法[14]。混合效应模型、广义代数差分方程、度量误差模型在构建树高曲线模型、生物量模型等方面的应用已经非常多,广义可加模型作为一种非参数估计方法也逐渐得到广泛应用,但分位数回归模型在冠幅预测方面的研究则很少见。
分位数回归(quantile regression,QR)是 Koenker等[15] 研究计量经济建模时提出的统计方法。分位数回归以因变量的条件分位数对自变量进行回归预测,可得到条件分位数下的回归模型,可以更加精确地描述自变量对因变量的变化,不需要满足数据必须呈现独立、正态、等方差的基本假设。已有研究显示分位数回归对于数据要求的宽松性以及模型拟合的精确性。如马岩岩等[16]和辛士冬等[17]基于分位数回归模型构建了落叶松(Larix gmelinii)和樟子松(Pinus sylvestris)树干削度方程,采用分位数组合方法和普通分位数回归方法进行树干削度方程的拟合;Özçelik等[18]基于非线性分位数回归模型和混合效应模型构建了以胸径和优势高为协变量的树高预测模型;Bohora等[19]基于分位数回归的插值方法构建了单木直径生长的分位数回归模型。
天然更新是天然林演替繁衍的重要方式,从种子萌发到成为有价值的林木,幼树是其中重要的一环,也是天然林中重要的组成部分,连续不断生长的幼苗幼树对上层林分的补充,使得天然林的结构更加稳定并向顶极群落正向演替,持续地发挥生态功能和不可或缺的经济、社会效益。树冠作为树木光合作用和有机物积累的重要场所,其重要性不言而喻,往往以冠幅大小对树冠生长好坏进行评价。对幼树而言,幼树的冠幅也是幼树处在竞争激烈环境中得以生存的重要指标。在天然林中,很多幼树由于受到上层木的竞争压制,生长缓慢,自身生长空间和生长资源相对不足;有些幼树得益于上层木之间的竞争发生了自稀疏现象产生林窗,能够获得较为充足的光照,以增强它们自身的光合作用,促进幼树自身有机物的积累。冠幅越宽,可接受到的光照面积越大,越有利于幼树自身的良性生长。幼树区别于大树,是种子天然更新至林分郁闭之前的一个过渡阶段,可以反映出天然下种种子的生存能力和竞争能力。因此,研究幼树冠幅模型是了解下层幼树林分结构和生长动态的有效手段,也是对上层林分生长进行预测的重要指标,对于预测幼树的存活和树冠生长、判断森林的更新动态、演替方向、林分生物量和碳储量,以及制定经营抚育措施具有重要的借鉴意义。云冷杉(云杉Picea、冷杉Abies)次生林是云冷杉原始林经过采伐或多次破坏后自然恢复起来的森林,在水源涵养、水土保持以及生物多样性保护等方面具有重要的生态价值。
综上所述,本文基于云冷杉天然次生混交林幼树便于准确测量的冠幅数据,利用联立方程组法和分位数回归法,并考虑模型可加性和不同条件分位数下非线性分位数回归模型,对云冷杉天然次林幼树冠幅生长进行预测,为云冷杉天然林幼树的抚育经营提供一定的理论依据。
1. 材料与方法
1.1 数据来源
2013年在吉林省汪清县林业局金沟岭林场选择具有代表性的云冷杉针阔混交次生林3块样地。样地面积均为1 hm2的(100 m × 100 m)云冷杉次生林,按相邻格子法将样地划分成100个10 m × 10 m的单元格,在每个样方的 4 个顶点处埋设水泥桩标记,检尺样地内所有1 cm < 胸径(DBH) < 5 cm,且树高(H) > 1.3 m的幼树的林木特征值,包括树种、胸径、树高、枝下高、冠幅等因子[20-21]。将数据按照70%(n = 548)和30%(n = 235)分为建模数据和检验数据,样地中幼树基本单木测量指标统计见表1。
表 1 数据描述性统计分析Table 1. Statistics of modeling data and validation data项目 Item 变量 Variable 最大值 Max. 最小值 Min. 均值 Mean 标准差 Std. 建模数据
Model-fitting data (n = 548)胸径 DBH/cm 5.00 1.00 2.99 1.14 树高 Tree height (H)/m 11.90 1.50 3.60 1.55 南冠幅 South crown width (SCR)/m 2.96 0.29 1.08 0.44 北冠幅 North crown width (NCR)/m 3.66 0.00 1.11 0.50 西冠幅 West crown width (WCR)/m 3.23 0.00 1.13 0.51 东冠幅 East crown width (ECR)/m 2.87 0.06 1.06 0.40 南北冠幅 South-north crown width (SNCW)/m 5.35 0.61 2.19 0.80 东西冠幅 East-west crown width (EWCW)/m 6.40 0.68 2.19 0.83 平均冠幅 Average crown width (CW)/m 5.35 0.68 2.19 0.77 检验数据
Model-validation data (n = 235)胸径 DBH/cm 5.00 1.00 3.01 1.18 树高 Tree height (H)/m 11.10 1.50 3.56 1.47 南冠幅 South crown width (SCR)/m 2.90 0.00 1.05 0.45 北冠幅 North crown width (NCR)/m 3.12 0.00 1.06 0.50 西冠幅 West crown width (WCR)/m 3.06 0.33 1.13 0.51 东冠幅 East crown width (ECR)/m 2.81 0.22 1.03 0.37 南北冠幅 South-north crown width (SNCW)/m 5.26 0.99 2.16 0.80 东西冠幅 East-west crown width (EWCW)/m 6.02 0.90 2.11 0.83 平均冠幅 Average crown width (CW)/m 5.13 1.01 2.13 0.77 1.2 研究方法
1.2.1 基础模型的选择
东、西、南、北、东西、南北6个方向冠幅和平均冠幅与胸径和树高之间的关系由图1可知,其存在着明显的相关关系。根据以往的经验[9],Logistic模型对于树冠冠幅的拟合预测具有较好的预测能力,并且通过与Richards模型、Mitscherlich 模型、Weibull模型、Gompertz模型、Schumacher模型、Korf模型、Hosfled模型[22]等的拟合精度对比最终选出拟合精度最高且拟合误差最小的模型。模型具体形式参见文献[22]。
![]() 图 1 不同冠幅组分与胸径、树高之间关系图SCR:南冠幅South crown width;NCR:北冠幅North crown width;ECR:东冠幅 East crown width;WCR:西冠幅 West crown width;EWCW:东西冠幅 East-west crown width;SNCW:南北冠幅South-north crown width;CW:平均冠幅 Average crown width;DBH:胸径 DBH;H:树高Tree height. YLK-6、YLK-7、YLK-12分别代表云冷杉阔叶混交林第6号、7号、12号样地YLK-6,YLK-7,YLK-12 represent the 6th, 7th, 12th sample plots of spruce-fir broadleaved mixed forestFigure 1. Relationship between different crown components and DBH, H
图 1 不同冠幅组分与胸径、树高之间关系图SCR:南冠幅South crown width;NCR:北冠幅North crown width;ECR:东冠幅 East crown width;WCR:西冠幅 West crown width;EWCW:东西冠幅 East-west crown width;SNCW:南北冠幅South-north crown width;CW:平均冠幅 Average crown width;DBH:胸径 DBH;H:树高Tree height. YLK-6、YLK-7、YLK-12分别代表云冷杉阔叶混交林第6号、7号、12号样地YLK-6,YLK-7,YLK-12 represent the 6th, 7th, 12th sample plots of spruce-fir broadleaved mixed forestFigure 1. Relationship between different crown components and DBH, H1.2.2 权函数的选择
在模型进行拟合时,模型的最终拟合残差经常会出现异方差的现象,即预测变量的残差值会随着预测值或实测值的变化呈现出明显增大或减少,或者其他残差变化不规律的现象[23-24]。此时,对模型进行异方差的消除就极为必要,常用的消除异方差的方法包括对数据进行对数转换,或者将权函数加入到模型中。可以进行对数转换的模型一般为幂函数形式,异速生长模型中就可以进行对数转换进行异方差的消除。本文中模型形式为logistic形式,对数转换后模型不能变换为线性形式,因此采用模型中加入权函数进行异方差的消除。常用的权函数有1/f(x)、1/f(x)0.5、1/f(x)2,在实际应用中,一般采用1/x,1/x0.5,1/x2,引入权函数可以提高模型的预测精度并有效降低模型的拟合误差。
1.2.3 联立方程组模型构建
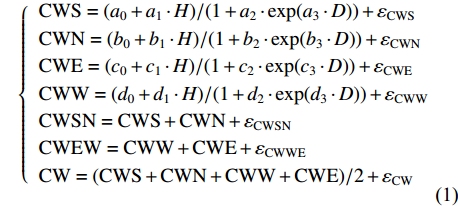
为了实现云冷杉幼树冠幅模型的可加性,本研究采用聚合型可加性冠幅模型来建立金沟岭林场天然云冷杉林分冠幅模型。模型形式如下:
{CWS=(a0+a1⋅H)/(1+a2⋅exp(a3⋅D))+εCWSCWN=(b0+b1⋅H)/(1+b2⋅exp(b3⋅D))+εCWNCWE=(c0+c1⋅H)/(1+c2⋅exp(c3⋅D))+εCWECWW=(d0+d1⋅H)/(1+d2⋅exp(d3⋅D))+εCWWCWSN=CWS+CWN+εCWSNCWEW=CWW+CWE+εCWWECW=(CWS+CWN+CWW+CWE)/2+εCW (1) 式中:CWS、CWN、CWE、CWW、CWSN、CWEW、CW分别代表南冠幅、北冠幅、东冠幅、西冠幅、南北冠幅、东西冠幅、平均冠幅,D为实测的幼树单木胸径,H为实测的幼树单木树高,
a0 ~a3 、b0 ~b3 、c0 ~c3 、d0 ~d3 分别代表南冠幅、北冠幅、东冠幅、西冠幅模型的估计参数,εCWS 、εCWN 、εCWE 、εCWW 、εCWSN 、εCWEW 、εCW 分别代表南、北、东、西、南北、东西、平均冠幅模型的残差。以东、西、南、北4个方向冠幅模型为基础,构建的冠幅各组分及东西冠幅,南北冠幅、平均冠幅的可加性相容模型。相容性联立方程组模型的拟合采用非线性似乎不相关回归(nonlinear seemingly unrelated regression,NSUR)方法进行。
1.2.4 分位数回归模型构建
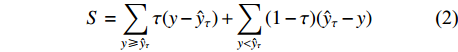
相较于传统回归方法,分位数回归灵活性更强,可预测任意分位数处因变量的变化趋势,对偏离回归曲线数据进行逼近研究,能够更详细地描述变量的统计分布[15]。分位数回归相对于最小二乘回归应用的条件更为宽松,挖掘的信息更丰富。分位数回归由于不仅能够度量回归变量对分布中心的影响,而且还能度量回归变量对分布上尾和下尾的影响,因此比经典的最小二乘回归法更具有优势,即捕捉整个条件分布的特征。特别当误差为非正态分布时,分位数回归估计量比最小二乘估计量更有效,因此它弥补了最小二乘回归的不足。分位数回归不需要对模型中的随机干扰项进行任何分布假定,且估计量因不易受异常值的影响而更加稳健,比传统的最小二乘法(least square method,OLS)更加具有优势。分位数回归的参数估计通过式(2)完成最小值线性规划[25]得以实现。
S=∑y⩾ (2) 式中:S为损失函数,τ 代表条件分位数值,y为特定分位数处的实测因变量值,
{\hat y_\tau } 为τ分位数时模型因变量估计值。在分位数 τ = 0.5 时的分位数回归又称为中位数回归。τ 在(0, 1)区间内任意取值,模型参数和曲线趋势随着 τ 的变化各不相同。当损失函数S达到最小值时估算各分位数模型的回归系数。
1.2.5 模型评价指标选取
为了比较评价不同估计方法的结果,本文采用的指标包括决定系数(R2)、均方根误差(RMSE)和平均误差(
{\overline e} )作为模型的评价指标。3个指标的计算公式如下:{R^2} = 1 - \sum\limits_{i = 1}^N {{{({y_i} - {{\hat y}_i})}^2}\Bigg/} \sum\limits_{i = 1}^N {{{({y_i} - {{\overline y}_i})}^2}} (3) {\rm{RMSE}} = \sqrt {\sum\limits_{i = 1}^N {{{({y_i} - {{\hat y}_i})}^2}/} N - P} (4) {\overline e} = \sum\limits_{i = 1}^N {{{({y_i} - {\hat y}_i})}/} N (5) 式中:
{y_i} 和{\hat y_i} 代表第i个样本的实测值和预测值,P为模型参数个数,N是总样本量,{\overline y_i} 代表实测样本的平均值,{\overline e} 为样本的平均误差。2. 结果与分析
2.1 基础模型拟合
通过基础模型的拟合,发现其他非线性模型对于树冠冠幅的模拟效果并没有优于Logistic模型,因此,Logistic模型作为本文构建树冠冠幅可加性模型的基础模型。Logistic模型具体形式如下:
{\rm{CW}} = f(x,{\beta _{{\rm{cw}}}}) = ({a_0} + {a_1} \cdot H)/(1 + {a_2} \cdot \exp ({a_3} \cdot D)) + {\varepsilon _{{\rm{cw}}}} (6) 式中:x为模型自变量,
{\beta _{{\rm{cw}}}} 为模型待估参数,{\varepsilon _{\rm cw}} 为模型的误差项。本文以实测树高和胸径对幼树冠幅进行预测,基础模型的拟合通过普通非线性最小二乘法(OLS)实现。对东冠幅、西冠幅、南冠幅、北冠幅、东西冠幅,南北冠幅,以及平均冠幅进行拟合,发现东、西、南、北4个方向的冠幅拟合精度低于东西冠幅和南北冠幅;拟合精度R2最高的是平均冠幅;其次是东西冠幅和南北冠幅;拟合精度最低的是东、西、南、北各方向的分冠幅。这与Lei等[9]的研究结果是一致的。各向冠幅的拟合统计指标见表2。
表 2 基础模型拟合指标统计Table 2. Fitting results of basic models模型 Model \overline e R2 RMSE CWS −0.000 3 0.298 3 0.369 8 CWN −0.000 2 0.278 0 0.421 1 CWE −0.000 2 0.309 8 0.329 3 CWW −0.000 2 0.267 4 0.439 5 CWEW −0.000 4 0.368 9 0.635 8 CWSN −0.000 5 0.369 1 0.656 8 CW −0.000 5 0.411 6 0.590 4 基础模型的拟合结果中,各个分向冠幅的拟合精度相当,平均误差几乎没有任何差异,R2介于0.267 4 ~ 0.309 8,RMSE介于0.329 3 ~ 0.439 5 m之间,拟合精度较低;东西、南北冠幅的R2非常接近,分别为0.368 9和0.369 1,由于拟合精度的提高,其RMSE与各向冠幅相比并不是2倍的关系,而是小于2倍;拟合精度最高的是平均冠幅,其R2最高,达到了0.411 6,RMSE与东西、南北冠幅相比要更小。平均冠幅与胸径之间的关系比各个方向冠幅与胸径之间的相关性更高,因此出现了平均冠幅的拟合精度最高的现象。
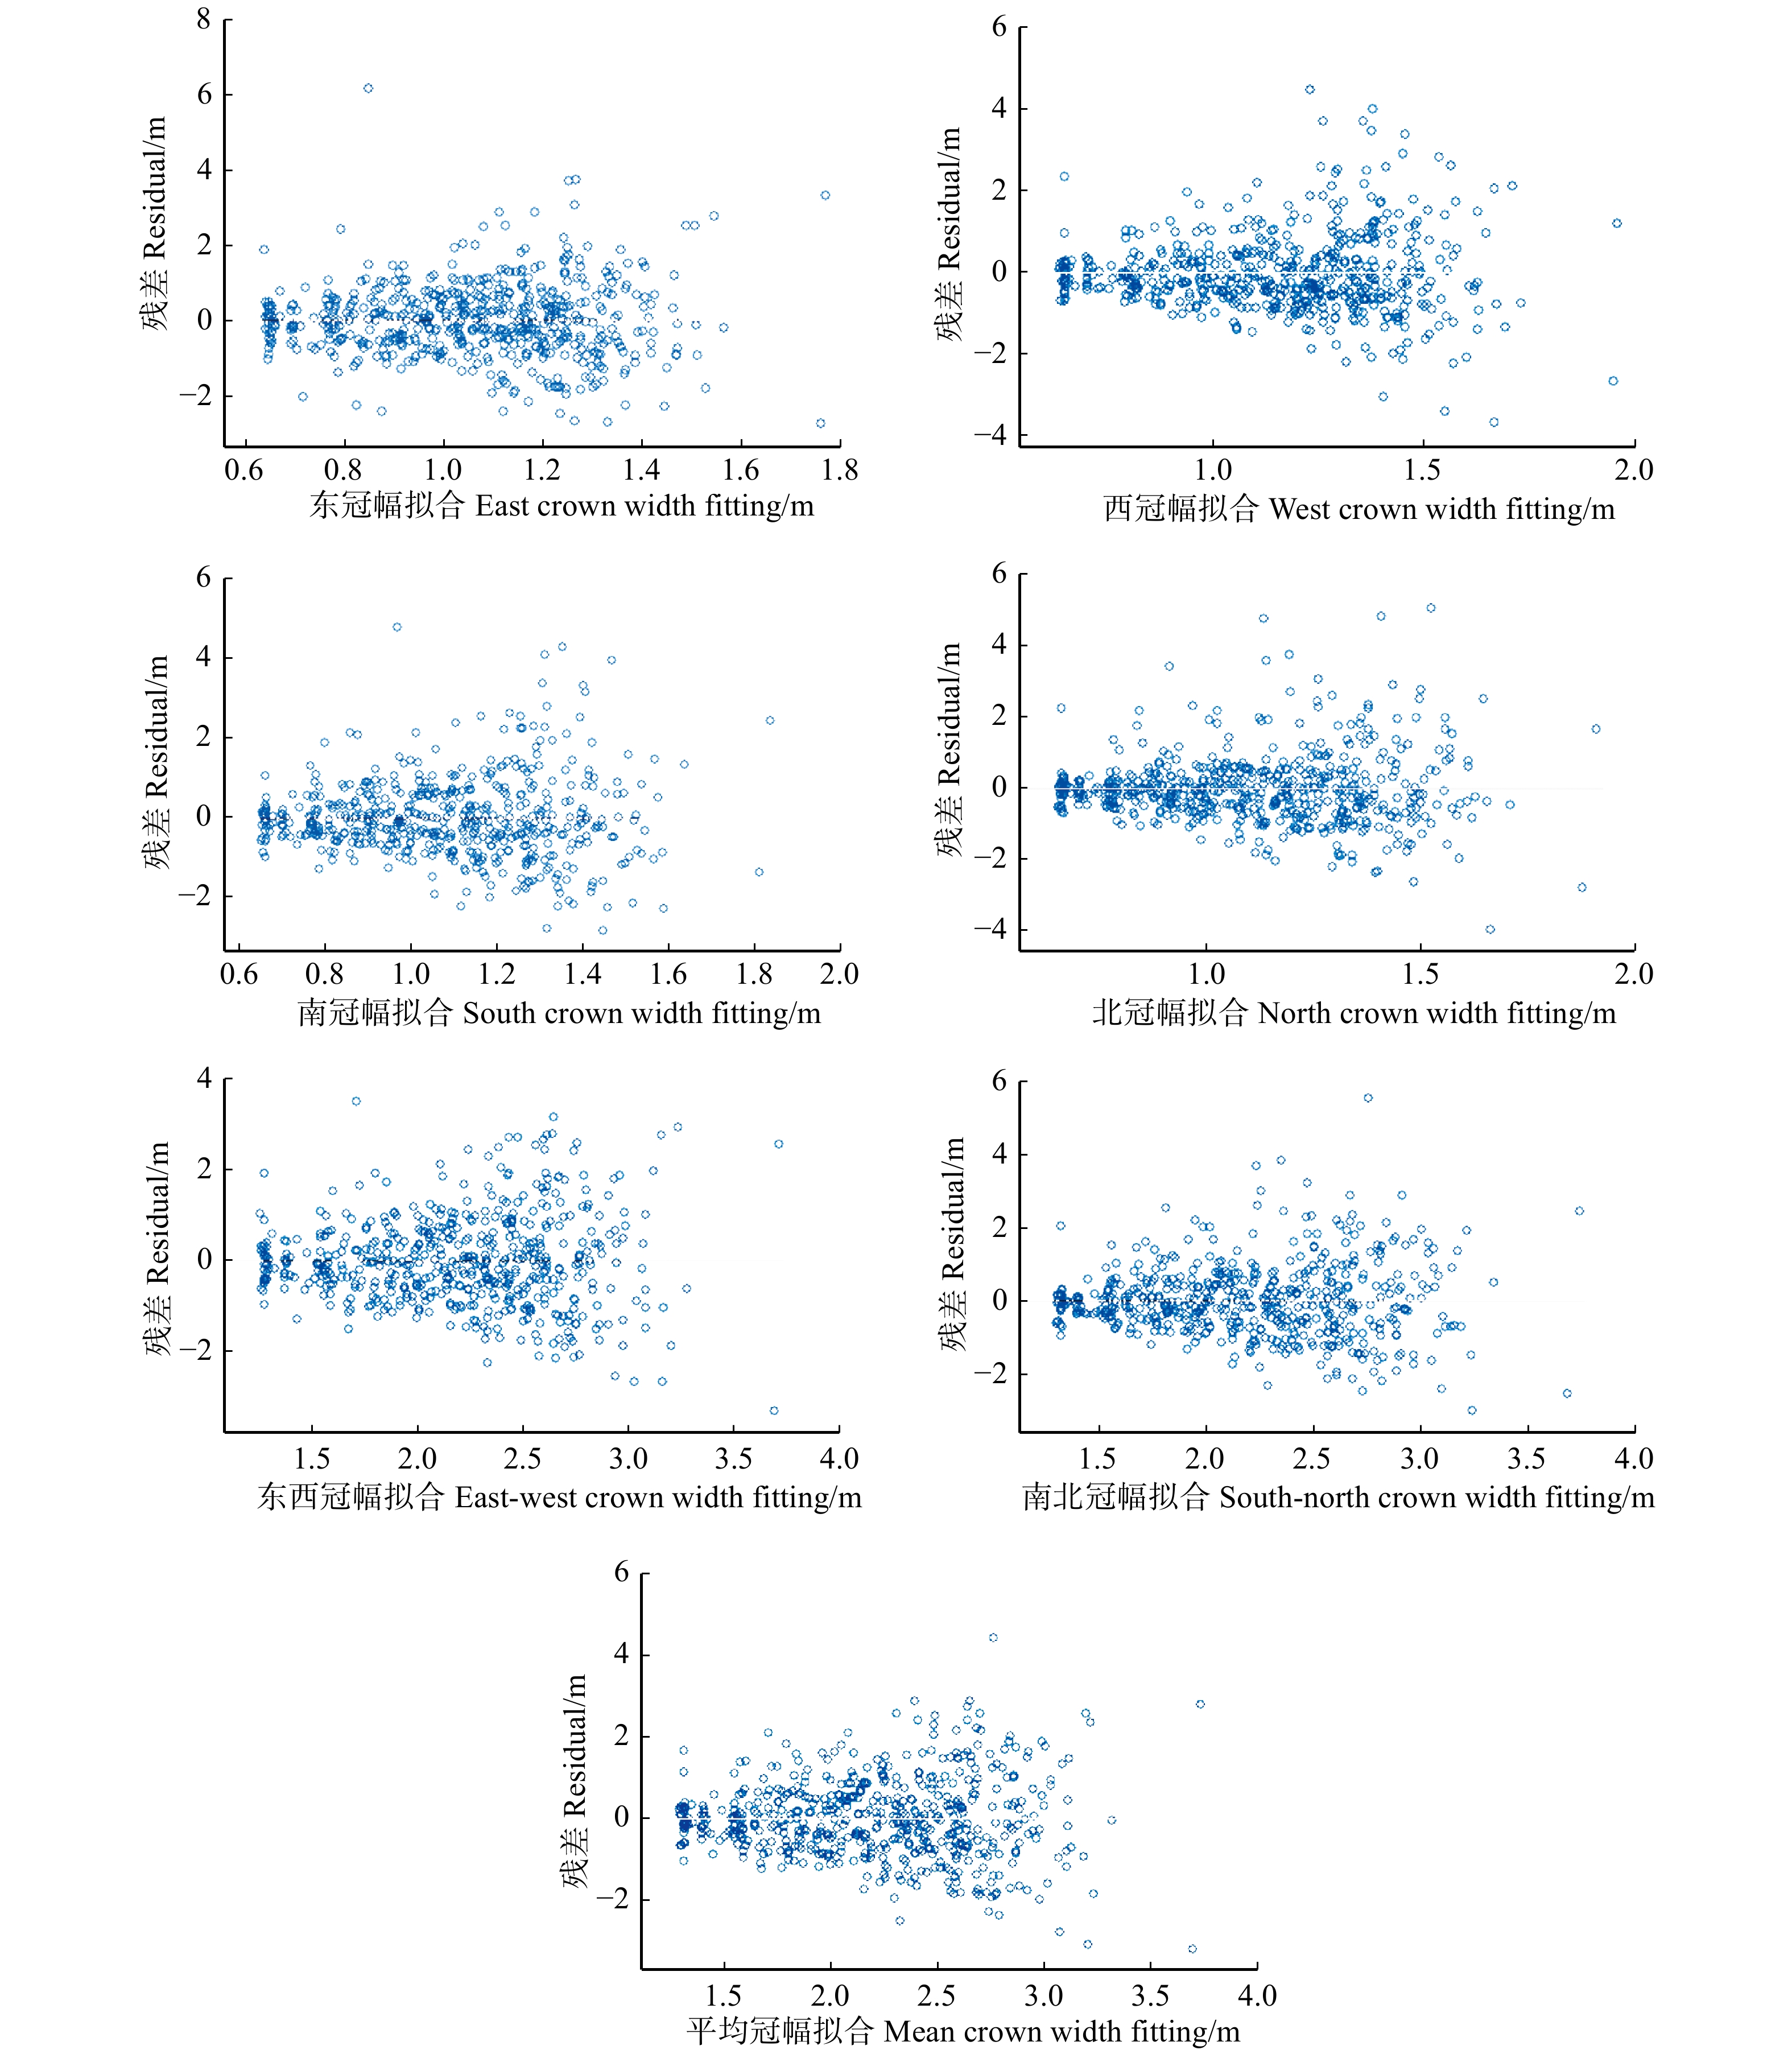
对基础模型的残差进行拟合(图2),发现基础模型对于各个方向冠幅的拟合存在异方差现象,随着胸径的变大,模型拟合残差越来越大,有效消除模型异方差现象是构建模型的关键。因此,将不同的权重因子加入到模型中以消除异方差,使模型最终满足方差齐性的基本假设。
2.2 权重因子选取
权重因子用以消除模型残差的异方差,使模型的残差呈现方差齐性。本文选取1/D、1/D0.5、1/D2作为权重因子加入到模型中以消除模型残差的异方差,其SAS命令分别为weight = 1/D、weight = 1/D0.5、weight = 1/D2。分别将3种权重函数加入到基础的非线性Logistic模型中,对比3种权函数消除异方差的效果(表3)。
表 3 加入权函数后基础模型拟合指标统计Table 3. Fitting index statistics of basic models by addition of weight function模型 Model 1/D 1/D2 1/D0.5 R2 RMSE R2 RMSE R2 RMSE CWS 0.372 4 0.205 1 0.416 1 0.122 6 0.336 9 0.273 4 CWN 0.342 4 0.233 2 0.368 7 0.140 2 0.312 7 0.310 8 CWE 0.360 1 0.195 5 0.363 6 0.128 3 0.339 3 0.250 9 CWW 0.345 4 0.244 0 0.382 2 0.147 4 0.309 0 0.324 9 CWSN 0.446 0 0.361 4 0.471 7 0.225 5 0.411 9 0.475 0 CWEW 0.444 0 0.365 4 0.479 7 0.219 5 0.409 4 0.486 4 CW 0.492 5 0.331 0 0.527 5 0.201 0 0.455 9 0.439 1 拟合结果(表3)显示,权函数为1/D2时,模型拟合效果最好。相较于不加权的基础模型,各个分向冠幅的拟合精度均得到了较大提升,但平均误差的变化无法说明权重因子对模型拟合精度变化的影响。南冠幅的拟合R2由0.298 3提高到0.416 1,R2提高了38.49%,RMSE由0.368 9降低到0.122 6,RMSE降低了66.77%;北冠幅的拟合R2由0.278 0提高到0.368 7,R2提高了32.63%,RMSE由0.4211降低到0.1402,RMSE降低了66.71%;东冠幅的拟合R2由0.309 8提高到0.363 6,R2提高了17.37%,RMSE由0.329 3降低到0.128 3,RMSE降低了61.04%;西冠幅的拟合R2由0.267 4提高到0.382 2,R2提高了42.93%,RMSE由0.439 5降低到0.147 4,RMSE降低了66.46%;南北冠幅的拟合R2由0.369 1提高到0.471 7,R2提高了27.80%,RMSE由0.656 8降低到0.225 5,RMSE降低了65.67%;东西冠幅的拟合R2由0.368 9提高到0.479 7,R2提高了30.04%,RMSE由0.635 8降低到0.219 5,RMSE降低了65.48%;平均冠幅的拟合R2由0.411 6提高到0.527 5,R2提高了28.16%,RMSE由0.590 4降低到0.201 0,RMSE降低了65.96%。拟合精度的排序仍然为平均冠幅优于东西和南北冠幅,各个分向冠幅的拟合精度仍然是最低的。权函数对于提升模型拟合精度以及降低模型的拟合误差具有很好的效果。模型的拟合残差图见图3。残差随着胸径的变化呈现出均匀的趋势,说明权函数有效消除了基础模型的异方差现象。因此。将1/D2作为可加性冠幅模型的权重函数,进行模型异方差的消除将极大提升模型的拟合效率。
2.3 冠幅各组分可加性模型构建
利用SAS/ETS中PROC MODEL过程对冠幅可加性模型进行参数估计,以东、西、南、北4个方向的冠幅模型为基础,东西冠幅则以东冠幅加西冠幅相加得到,南北冠幅则以南冠幅加北冠幅得到,平均冠幅则以东、西、南、北4个方向冠幅相加之和的0.5倍得到,由此构成了7个方程组成的模型系,用以估计7种类型的冠幅大小。将1/D2作为模型的权重函数,在SAS程序中用weight = 1/D2命令进行权函数赋值,进行模型异方差的消除。模型最终的拟合结果见表4。
表 4 可加性冠幅模型参数估计Table 4. Parameter estimation of additivity crown modelCWS CWN CWE CWW 参数
Parameter估计值
Estimation参数
Parameter估计值
Estimation参数
Parameter估计值
Estimation参数
Parameter估计值
Estimationa0 0.875 (0.112) b0 1.040 (0.184) c0 0.741 (0.102) d0 0.855 (0.133) a1 0.096 (0.018) b1 0.098 (0.022) c1 0.112 (0.018) d1 0.118 (0.021) a2 1.770 (0.352) b2 1.653 (0.324) c2 1.389 (0.423) d2 1.835 (0.421) a3 0.977 (0.237) b3 0.659 (0.188) c3 1.119 (0.378) d3 0.977 (0.265) 注: 括号内的数值是标准差。Note: value in brackets is the standard deviation. 所有参数估计均是在0.05水平下进行的,P值均显著小于0.05,所有参数的估计都是极显著的。平均误差的变化与之前的模型拟合结果一样,无法表示模型拟合效率的优劣,因此在拟合模型时只用R2和RMSE进行比较。通过表5比较模型的确定系数R2和均方根误差RMSE可以发现,在拟合幼树冠幅可加性模型时,加权OLS(weighted least square method)的拟合精度与加权NSUR(weighted nonlinear seemingly unrelated regression)的拟合精度大体相当,加权OLS的拟合精度略微高于加权NSUR。在进行加权NSUR估计时,通常认为每个子模型内误差项之间是不相关的,但是每两个子模型误差项之间是同时相关的。表6为用于估计加权NSUR模型参数的误差项之间的方差−协方差矩阵。矩阵中每个元素均不为0,因此平均冠幅、东西冠幅、南北冠幅与东、南、西、北4个冠幅之间紧密相关,不能忽略。虽然拟合精度较非线性模型稍微低一些,但是同时考虑了模型之间不可忽略的误差相关性,因此加权似乎不相关模型总体上优于加权非线性模型。
表 5 可加性冠幅模型拟合精度Table 5. Fitting accuracy of additivity crown model评价指标 Evaluation index CWS CWN CWE CWW CWSN CWEW CW R2 0.416 1 0.368 8 0.363 7 0.382 3 0.479 5 0.471 6 0.527 3 RMSE 0.122 6 0.140 2 0.128 3 0.147 4 0.219 5 0.225 6 0.201 0 表 6 参数估计的残差方差−协方差矩阵Table 6. Variance-covariance matrix of parameter estimationCWS CWN CWE CWW CWSN CWEW CW CWS 0.015 0 0.006 7 0.006 8 0.009 5 0.021 7 0.016 2 0.019 0 CWN 0.006 7 0.019 6 0.005 9 0.008 6 0.026 4 0.014 6 0.020 5 CWE 0.006 8 0.005 9 0.016 5 0.006 3 0.012 7 0.022 8 0.017 8 CWW 0.009 5 0.008 6 0.006 3 0.021 7 0.018 1 0.028 0 0.023 1 CWSN 0.021 7 0.026 4 0.012 7 0.018 1 0.048 2 0.030 9 0.039 6 CWWE 0.016 2 0.014 6 0.022 8 0.028 0 0.030 9 0.050 9 0.041 0 CW 0.019 0 0.020 5 0.017 8 0.023 1 0.039 6 0.041 0 0.040 4 在表4中,表示模型常数项的a0、b0、c0、d0中,a0、b0比c0、d0在数值上要大,最大的是b0,说明南向和北向冠幅的生长是最好的,东向和西向冠幅的生长情况要劣于南向和北向。a1、b1、c1、d1代表的是树高对于冠幅生长的影响,c1和d1要明显大于a1和b1,说明立地条件对于东西冠幅的生长要大于南北冠幅。a2、b2、c2、d2和a3、b3、c3、d3则是说明胸径的生长对冠幅生长的影响,由于是在分母部分,值越大说明其影响越小。综合比对,胸径对东、西冠幅的生长要比对南北冠幅的影响小。
2.4 分位数回归模型构建
分位数回归模型的构建在SAS 9.4中利用NLP过程进行计算,在构建分位数回归模型时,发现东、西、南、北、东西、南北、平均冠幅等7个模型均是在分位数参数τ = 0.55时,非线性分位数模型的拟合效果最好,在分位数范围为0.3 ~ 0.7之间时,模型的R2为正值,超过这个范围内的模型的R2为负值,不再适于模型的拟合。表7为分位数为0.3 ~ 0.7之间时7个模型的拟合精度值。
表 7 不同分位数模型拟合统计结果Table 7. Fitting results of various quantile crown models模型 Model 分位数 Quantile (τ) \overline e R2 RMSE CWS 0.3 0.189 4 0.083 8 0.422 5 0.4 0.127 8 0.194 9 0.396 1 0.5 0.041 4 0.287 2 0.372 7 0.6 −0.028 2 0.293 8 0.371 0 0.7 −0.147 4 0.167 2 0.402 9 CWN 0.3 0.198 4 0.093 7 0.471 7 0.4 0.124 4 0.204 0 0.442 1 0.5 0.042 9 0.264 7 0.424 9 0.6 −0.025 0 0.273 7 0.422 3 0.7 −0.134 6 0.182 8 0.447 9 CWE 0.3 0.164 6 0.106 3 0.374 7 0.4 0.096 6 0.221 5 0.349 7 0.5 0.019 7 0.282 6 0.335 7 0.6 −0.063 3 0.278 5 0.336 7 0.7 −0.148 2 0.159 0 0.363 5 CWW 0.3 0.239 7 0.019 1 0.508 4 0.4 0.153 4 0.163 0 0.469 7 0.5 0.075 9 0.241 2 0.447 3 0.6 −0.039 8 0.247 6 0.445 4 0.7 −0.153 7 0.150 7 0.473 1 CWSN 0.3 0.339 9 0.171 1 0.752 7 0.4 0.211 4 0.287 7 0.697 8 0.5 0.072 5 0.350 9 0.666 1 0.6 −0.097 6 0.348 4 0.667 4 0.7 −0.284 0 0.229 9 0.725 5 CWEW 0.3 0.341 6 0.162 2 0.732 4 0.4 0.229 9 0.267 2 0.685 0 0.5 0.046 5 0.365 3 0.637 6 0.6 −0.087 0 0.351 4 0.644 5 0.7 −0.288 4 0.212 4 0.710 1 CW 0.3 0.319 1 0.212 1 0.683 0 0.4 0.209 9 0.321 6 0.633 9 0.5 0.046 0 0.405 6 0.593 7 0.6 −0.107 9 0.388 4 0.601 9 0.7 −0.284 9 0.243 4 0.669 4 模型拟合效果最好的分位数为介于0.5到0.6之间,因此取分位数为0.51 ~ 0.59时进行验证,发现当分位数为0.55时模型的拟合效果达到最佳,因此将0.55确定为最优分位数。7个模型的参数及精度统计见表8和表9。
表 8 0.55分位数模型参数估计Table 8. Parameter estimation at 0.55 tau参数 Parameter 方法 Method CWS CWN CWE CWW CWSN CWEW CW a0 QR 1.177 1.573 1.469 1.191 4.386 2.195 2.561 a1 QR 0.072 0.040 0.032 0.082 0.148 0.160 0.122 a2 QR 1.748 2.422 2.048 1.988 3.363 1.912 2.115 a3 QR 0.580 0.518 0.521 0.620 0.332 0.725 0.628 注:QR为分位数回归。下同。Notes: QR is quantile regression. The same below. 表 9 0.55分位数回归模型拟合结果Table 9. Fitting results of 0.55 quantile models模型 Model 方法 Method \overline e R2 RMSE CWS QR −0.000 9 0.298 3 0.369 8 CWN QR −0.008 5 0.274 4 0.422 1 CWE QR −0.025 9 0.295 4 0.332 7 CWW QR 0.015 5 0.264 4 0.440 4 CWSN QR −0.022 7 0.360 4 0.661 3 CWEW QR −0.022 1 0.366 3 0.637 1 CW QR −0.028 3 0.408 6 0.591 9 通过对比发现,非线性最小二乘回归模型比非线性分位数回归模型的
\overline e 、R2、RMSE等值拟合精度要更高一些,拟合效果略好一些。用检验数据对OLS、加权OLS、加权NSUR、分位数回归4种方法构建的冠幅模型进行检验,结果见表10。
表 10 模型检验结果Table 10. Validation results of models评价指标
Evaluation index方法
MethodCWS CWN CWE CWW CWSN CWEW CW \overline e OLS −0.031 2 −0.050 0 −0.032 2 −0.000 2 −0.081 3 −0.032 5 −0.056 7 加权OLS Weighted OLS −0.025 9 0.046 9 −0.027 3 0.002 7 −0.073 0 −0.024 8 −0.048 3 加权NSUR Weighted NSUR −0.025 2 −0.046 2 −0.027 3 0.002 9 −0.071 4 −0.024 4 −0.047 9 QR −0.031 9 −0.059 8 −0.060 4 0.014 7 −0.109 7 −0.054 3 −0.086 0 R2 OLS 0.275 4 0.140 8 0.266 2 0.270 9 0.265 3 0.329 0 0.333 5 加权OLS Weighted OLS 0.277 2 0.130 9 0.273 1 0.271 4 0.258 0 0.330 9 0.329 0 加权NSUR Weighted NSUR 0.389 3 0.229 4 0.345 7 0.303 9 0.373 5 0.407 7 0.429 9 QR 0.275 2 0.142 5 0.223 8 0.281 2 0.251 5 0.329 8 0.322 8 RMSE OLS 0.385 6 0.462 5 0.320 7 0.435 8 0.714 6 0.658 3 0.630 5 加权OLS Weighted OLS 0.385 1 0.465 1 0.319 1 0.435 6 0.718 1 0.657 4 0.632 7 加权NSUR Weighted NSUR 0.121 6 0.166 6 0.121 9 0.159 1 0.243 2 0.233 3 0.219 8 QR 0.385 6 0.462 0 0.329 8 0.432 7 0.721 2 0.657 9 0.635 6 注 Notes:OLS:最小二乘法 Least square method;加权OLS:加权最小二乘法 Weighted least square method;加权NSUR:加权非线性似乎不相关回归 Weighted nonlinear seemingly unrelated regression. 由于加权NSUR模型中加入了权函数,模型的拟合效果得到了极大提升,明显优于其他模型;加权OLS模型拟合效果略优于OLS模型的拟合效果;分位数回归模型的拟合效果最低。
3. 讨 论
幼树冠幅作为幼树生长活力的重要指标,可以用来预测幼树生长趋势和判定幼树生存概率。本文基于3块1 hm2的云冷杉天然次生林林下幼树实测数据,在非线性模型的基础上比较了NSUR、加权OLS、加权NSUR、QR 4种方法的拟合效果和权函数对于消除模型异方差的作用。
以最小二乘法非线性模型进行拟合时,模型的拟合精度较低,当引入权函数1/D2时,非线性模型的拟合精度提高较大,模型的异方差现象也被消除。利用NSUR对7个子方程组成的模型系进行拟合时,模型的拟合精度较OLS略低,几乎无异;但是NSUR利用参数估计的残差的方差−协方差矩阵对模型之间的关系进行了很好的约束,以使模型系可以同时估计出7个子模型的参数和最大程度地降低模型的拟合误差。
在进行非线性QR模型的构建时,当分位数集中在0.3 ~ 0.7之间时,模型的决定系数为正,分位数在小于0.3和大于0.7时模型的决定系数均为负数,因此模型的最优分位数介于03 ~ 0.7之间。经过测试,模型的最优分位数为接近中位数的0.55时,模型的拟合精度与非线性回归接近,但是总体的拟合精度略低于非线性OLS的拟合精度。因此,就拟合精度而言,本文中加权NSUR ≈ 加权OLS > OLS > QR。
参数估计方法的好坏往往取决于研究数据本身。在构建相容性模型时,很多研究都表明,NSUR方法的拟合效果要更加精确,尤其是在生物量和碳储量的联合估计、单木材积和削度方程的联合估计等方面受到了广泛应用。本文中却发现,不加权的NSUR方法的拟合效果并不比OLS更好,但是加入权重函数后,NSUR拟合精度要优于OLS。段光爽等[26]在研究红松(Pinus koraiensis)单木在竞争环境下的树高和胸径的相对生长关系时也发现非线性OLS的拟合效果要比NSUR模型略优一些。对于OLS与QR的比较,张冬燕等[27]发现当分位数点为0.7时,模型拟合效果要优于OLS,与本文结论正好相反。本文中则发现OLS的拟合效果优于QR;QR方法在0.55分位数时拟合效果最好,但是其拟合效果仍然是最差的。在模型出现异方差现象时,要进行权函数的选择,本文采用1/D2作为模型权函数就很好地解决了模型的异方差现象,而在董灵波等[28]的研究中,由于采用混合模型,模型结构比较复杂,考虑了单木效应和时间序列相关性后依然无法消除模型异方差,最终采用CF = exp(s2/2)作为异方差函数消除了模型的异方差。很多相关研究[29-30]也采用类似方法来解决异方差问题。
在Lei等[9]的研究中,将不受平均冠幅为约束条件的各向冠幅模型系统、平均冠幅为限制的似乎不相关模型、一步比例平差法、两步比例平差法为模型形式,以非线性似乎不相关法NSUR、二步度量误差模型法2SLS、以及非线性最小二乘估计为模型参数估计方法进行蒙古栎单木冠幅模型构建,以NSUR方法的拟合效果最好。在本文中,较Lei等[9]的研究增加了东西冠幅和南北冠幅两个子模型,从而构成了包含7个子模型的模型系统,但只采用了应用最为广泛的NSUR模型系参数估计方法,在进行分级联合控制方法的模型拟合时,NSUR也不能使模型收敛。采用2SLS、3SLS等方法在估计模型参数时,模型同样出现了不能收敛的情况。此外,本文选择非线性QR及非线性OLS进行7个模型单独参数估计,QR并未显示出比OLS更加精确的拟合精度,最佳分位数点出现在0.55分位数时,可以保证模型有较好的拟合精度,但相比于传统的OLS还是效果略差。
4. 结 论
本文中构建的云冷杉幼树冠幅可加性模型的最优模型为加权NSUR模型,当权重因子为1/D2时,模型的拟合精度最佳,同时加权NSUR模型可以提高模型的拟合效率以及对模型的误差项通过残差的方差−协方差矩阵进行最优约束。非线性QR在以往的研究中要比普通的非线性OLS拟合效果好,但是本文中其效果最差,因此非线性QR的拟合效果不一定优于传统的非线性OLS。本研究所构建的加权NSUR模型可以为金沟岭林场云冷杉天然次生林的经营提供一定的理论依据。
-
![]()
图 1 不同冠幅组分与胸径、树高之间关系图
SCR:南冠幅South crown width;NCR:北冠幅North crown width;ECR:东冠幅 East crown width;WCR:西冠幅 West crown width;EWCW:东西冠幅 East-west crown width;SNCW:南北冠幅South-north crown width;CW:平均冠幅 Average crown width;DBH:胸径 DBH;H:树高Tree height. YLK-6、YLK-7、YLK-12分别代表云冷杉阔叶混交林第6号、7号、12号样地YLK-6,YLK-7,YLK-12 represent the 6th, 7th, 12th sample plots of spruce-fir broadleaved mixed forest
Figure 1. Relationship between different crown components and DBH, H
表 1 数据描述性统计分析
Table 1 Statistics of modeling data and validation data
项目 Item 变量 Variable 最大值 Max. 最小值 Min. 均值 Mean 标准差 Std. 建模数据
Model-fitting data (n = 548)胸径 DBH/cm 5.00 1.00 2.99 1.14 树高 Tree height (H)/m 11.90 1.50 3.60 1.55 南冠幅 South crown width (SCR)/m 2.96 0.29 1.08 0.44 北冠幅 North crown width (NCR)/m 3.66 0.00 1.11 0.50 西冠幅 West crown width (WCR)/m 3.23 0.00 1.13 0.51 东冠幅 East crown width (ECR)/m 2.87 0.06 1.06 0.40 南北冠幅 South-north crown width (SNCW)/m 5.35 0.61 2.19 0.80 东西冠幅 East-west crown width (EWCW)/m 6.40 0.68 2.19 0.83 平均冠幅 Average crown width (CW)/m 5.35 0.68 2.19 0.77 检验数据
Model-validation data (n = 235)胸径 DBH/cm 5.00 1.00 3.01 1.18 树高 Tree height (H)/m 11.10 1.50 3.56 1.47 南冠幅 South crown width (SCR)/m 2.90 0.00 1.05 0.45 北冠幅 North crown width (NCR)/m 3.12 0.00 1.06 0.50 西冠幅 West crown width (WCR)/m 3.06 0.33 1.13 0.51 东冠幅 East crown width (ECR)/m 2.81 0.22 1.03 0.37 南北冠幅 South-north crown width (SNCW)/m 5.26 0.99 2.16 0.80 东西冠幅 East-west crown width (EWCW)/m 6.02 0.90 2.11 0.83 平均冠幅 Average crown width (CW)/m 5.13 1.01 2.13 0.77  下载: 导出CSV
表 2 基础模型拟合指标统计
Table 2 Fitting results of basic models
模型 Model \overline e R2 RMSE CWS −0.000 3 0.298 3 0.369 8 CWN −0.000 2 0.278 0 0.421 1 CWE −0.000 2 0.309 8 0.329 3 CWW −0.000 2 0.267 4 0.439 5 CWEW −0.000 4 0.368 9 0.635 8 CWSN −0.000 5 0.369 1 0.656 8 CW −0.000 5 0.411 6 0.590 4
下载: 导出CSV
表 3 加入权函数后基础模型拟合指标统计
Table 3 Fitting index statistics of basic models by addition of weight function
模型 Model 1/D 1/D2 1/D0.5 R2 RMSE R2 RMSE R2 RMSE CWS 0.372 4 0.205 1 0.416 1 0.122 6 0.336 9 0.273 4 CWN 0.342 4 0.233 2 0.368 7 0.140 2 0.312 7 0.310 8 CWE 0.360 1 0.195 5 0.363 6 0.128 3 0.339 3 0.250 9 CWW 0.345 4 0.244 0 0.382 2 0.147 4 0.309 0 0.324 9 CWSN 0.446 0 0.361 4 0.471 7 0.225 5 0.411 9 0.475 0 CWEW 0.444 0 0.365 4 0.479 7 0.219 5 0.409 4 0.486 4 CW 0.492 5 0.331 0 0.527 5 0.201 0 0.455 9 0.439 1
下载: 导出CSV
表 4 可加性冠幅模型参数估计
Table 4 Parameter estimation of additivity crown model
CWS CWN CWE CWW 参数
Parameter估计值
Estimation参数
Parameter估计值
Estimation参数
Parameter估计值
Estimation参数
Parameter估计值
Estimationa0 0.875 (0.112) b0 1.040 (0.184) c0 0.741 (0.102) d0 0.855 (0.133) a1 0.096 (0.018) b1 0.098 (0.022) c1 0.112 (0.018) d1 0.118 (0.021) a2 1.770 (0.352) b2 1.653 (0.324) c2 1.389 (0.423) d2 1.835 (0.421) a3 0.977 (0.237) b3 0.659 (0.188) c3 1.119 (0.378) d3 0.977 (0.265) 注: 括号内的数值是标准差。Note: value in brackets is the standard deviation.
下载: 导出CSV
表 5 可加性冠幅模型拟合精度
Table 5 Fitting accuracy of additivity crown model
评价指标 Evaluation index CWS CWN CWE CWW CWSN CWEW CW R2 0.416 1 0.368 8 0.363 7 0.382 3 0.479 5 0.471 6 0.527 3 RMSE 0.122 6 0.140 2 0.128 3 0.147 4 0.219 5 0.225 6 0.201 0
下载: 导出CSV
表 6 参数估计的残差方差−协方差矩阵
Table 6 Variance-covariance matrix of parameter estimation
CWS CWN CWE CWW CWSN CWEW CW CWS 0.015 0 0.006 7 0.006 8 0.009 5 0.021 7 0.016 2 0.019 0 CWN 0.006 7 0.019 6 0.005 9 0.008 6 0.026 4 0.014 6 0.020 5 CWE 0.006 8 0.005 9 0.016 5 0.006 3 0.012 7 0.022 8 0.017 8 CWW 0.009 5 0.008 6 0.006 3 0.021 7 0.018 1 0.028 0 0.023 1 CWSN 0.021 7 0.026 4 0.012 7 0.018 1 0.048 2 0.030 9 0.039 6 CWWE 0.016 2 0.014 6 0.022 8 0.028 0 0.030 9 0.050 9 0.041 0 CW 0.019 0 0.020 5 0.017 8 0.023 1 0.039 6 0.041 0 0.040 4
下载: 导出CSV
表 7 不同分位数模型拟合统计结果
Table 7 Fitting results of various quantile crown models
模型 Model 分位数 Quantile (τ) \overline e R2 RMSE CWS 0.3 0.189 4 0.083 8 0.422 5 0.4 0.127 8 0.194 9 0.396 1 0.5 0.041 4 0.287 2 0.372 7 0.6 −0.028 2 0.293 8 0.371 0 0.7 −0.147 4 0.167 2 0.402 9 CWN 0.3 0.198 4 0.093 7 0.471 7 0.4 0.124 4 0.204 0 0.442 1 0.5 0.042 9 0.264 7 0.424 9 0.6 −0.025 0 0.273 7 0.422 3 0.7 −0.134 6 0.182 8 0.447 9 CWE 0.3 0.164 6 0.106 3 0.374 7 0.4 0.096 6 0.221 5 0.349 7 0.5 0.019 7 0.282 6 0.335 7 0.6 −0.063 3 0.278 5 0.336 7 0.7 −0.148 2 0.159 0 0.363 5 CWW 0.3 0.239 7 0.019 1 0.508 4 0.4 0.153 4 0.163 0 0.469 7 0.5 0.075 9 0.241 2 0.447 3 0.6 −0.039 8 0.247 6 0.445 4 0.7 −0.153 7 0.150 7 0.473 1 CWSN 0.3 0.339 9 0.171 1 0.752 7 0.4 0.211 4 0.287 7 0.697 8 0.5 0.072 5 0.350 9 0.666 1 0.6 −0.097 6 0.348 4 0.667 4 0.7 −0.284 0 0.229 9 0.725 5 CWEW 0.3 0.341 6 0.162 2 0.732 4 0.4 0.229 9 0.267 2 0.685 0 0.5 0.046 5 0.365 3 0.637 6 0.6 −0.087 0 0.351 4 0.644 5 0.7 −0.288 4 0.212 4 0.710 1 CW 0.3 0.319 1 0.212 1 0.683 0 0.4 0.209 9 0.321 6 0.633 9 0.5 0.046 0 0.405 6 0.593 7 0.6 −0.107 9 0.388 4 0.601 9 0.7 −0.284 9 0.243 4 0.669 4
下载: 导出CSV
表 8 0.55分位数模型参数估计
Table 8 Parameter estimation at 0.55 tau
参数 Parameter 方法 Method CWS CWN CWE CWW CWSN CWEW CW a0 QR 1.177 1.573 1.469 1.191 4.386 2.195 2.561 a1 QR 0.072 0.040 0.032 0.082 0.148 0.160 0.122 a2 QR 1.748 2.422 2.048 1.988 3.363 1.912 2.115 a3 QR 0.580 0.518 0.521 0.620 0.332 0.725 0.628 注:QR为分位数回归。下同。Notes: QR is quantile regression. The same below.
下载: 导出CSV
表 9 0.55分位数回归模型拟合结果
Table 9 Fitting results of 0.55 quantile models
模型 Model 方法 Method \overline e R2 RMSE CWS QR −0.000 9 0.298 3 0.369 8 CWN QR −0.008 5 0.274 4 0.422 1 CWE QR −0.025 9 0.295 4 0.332 7 CWW QR 0.015 5 0.264 4 0.440 4 CWSN QR −0.022 7 0.360 4 0.661 3 CWEW QR −0.022 1 0.366 3 0.637 1 CW QR −0.028 3 0.408 6 0.591 9
下载: 导出CSV
表 10 模型检验结果
Table 10 Validation results of models
评价指标
Evaluation index方法
MethodCWS CWN CWE CWW CWSN CWEW CW \overline e OLS −0.031 2 −0.050 0 −0.032 2 −0.000 2 −0.081 3 −0.032 5 −0.056 7 加权OLS Weighted OLS −0.025 9 0.046 9 −0.027 3 0.002 7 −0.073 0 −0.024 8 −0.048 3 加权NSUR Weighted NSUR −0.025 2 −0.046 2 −0.027 3 0.002 9 −0.071 4 −0.024 4 −0.047 9 QR −0.031 9 −0.059 8 −0.060 4 0.014 7 −0.109 7 −0.054 3 −0.086 0 R2 OLS 0.275 4 0.140 8 0.266 2 0.270 9 0.265 3 0.329 0 0.333 5 加权OLS Weighted OLS 0.277 2 0.130 9 0.273 1 0.271 4 0.258 0 0.330 9 0.329 0 加权NSUR Weighted NSUR 0.389 3 0.229 4 0.345 7 0.303 9 0.373 5 0.407 7 0.429 9 QR 0.275 2 0.142 5 0.223 8 0.281 2 0.251 5 0.329 8 0.322 8 RMSE OLS 0.385 6 0.462 5 0.320 7 0.435 8 0.714 6 0.658 3 0.630 5 加权OLS Weighted OLS 0.385 1 0.465 1 0.319 1 0.435 6 0.718 1 0.657 4 0.632 7 加权NSUR Weighted NSUR 0.121 6 0.166 6 0.121 9 0.159 1 0.243 2 0.233 3 0.219 8 QR 0.385 6 0.462 0 0.329 8 0.432 7 0.721 2 0.657 9 0.635 6 注 Notes:OLS:最小二乘法 Least square method;加权OLS:加权最小二乘法 Weighted least square method;加权NSUR:加权非线性似乎不相关回归 Weighted nonlinear seemingly unrelated regression.
下载: 导出CSV
-
[1] Assmann E, Davis P W. The principles of forest yield study[M]. Oxford: Pergamon Press Ltd., 1970.
[2] Hasenauer H, Monserud R A. Biased predictions for tree height increment models developed from smoothed ‘data’[J]. Ecological Modelling, 1997, 98(1): 13−22. doi: 10.1016/S0304-3800(96)01933-3
[3] Monserud R A, Sterba H. A basal area increment model for individual trees growing in even- and uneven-aged forest stands in Austria[J]. Forest Ecology & Management, 1996, 80(1−3): 57−80.
[4] Carvalho J P, Parresol B R. Additivity in tree biomass components of Pyrenean oak (Quercus pyrenaica Willd.)[J]. Forest Ecology & Management, 2003, 179(1−3): 269−276.
[5] Fu L Y, Lei Y C, Wang G X, et al. Comparison of seemingly unrelated regressions with error-in-variable models for developing a system of nonlinear additive biomass equations[J]. Trees, 2016, 30(3): 839−857. doi: 10.1007/s00468-015-1325-x
[6] Pukkala T, Becker P, Kuuluvainen T, e al. Predicting spatial distribution of direct radiation below forest canopies[J]. Agricultural and Forest Meteorology, 1991, 55: 295−307. doi: 10.1016/0168-1923(91)90067-Z
[7] 贾炜玮, 解希涛, 姜生伟, 等. 大兴安岭新林林业局3种林分类型天然更新幼苗幼树的空间分布格局[J]. 应用生态学报, 2017, 28(9):2813−2822. Jia W W, Xie X T, Jiang S W, et al. Spatial distribution pattern of seedlings and saplings of three forest types by natural regeneration in Daxin’an Mountains Xinlin Forestry Bureau, China[J]. Chinese Journal of Applied Ecology, 2017, 28(9): 2813−2822.
[8] EerikäInen K, Valkonen S, Saksa T. Ingrowth, survival and height growth of small trees in uneven-aged Picea abies stands in southern Finland[J]. Forest Ecosystems, 2014, 1(1): 1−10. doi: 10.1186/2197-5620-1-1
[9] Lei Y K, Li Y F, Affleck D L R, et al. Additivity of nonlinear tree crown width models: aggregated and disaggregated model structures using nonlinear simultaneous equations[J]. Forest Ecology and Management, 2018, 427: 372−382. doi: 10.1016/j.foreco.2018.06.013
[10] Fu L Y, Sun H, Sharma R P, et al. Nonlinear mixed-effects crown width models for individual trees of Chinese fir (Cunninghamia lanceolata) in south-central China[J]. Forest Ecology and Management, 2013, 302: 210−220. doi: 10.1016/j.foreco.2013.03.036
[11] Sharma R P, Vacek Z, Vacek S. Individual tree crown width models for Norway spruce and European beech in Czech Republic[J]. Forest Ecology and Management, 2016, 366: 208−220. doi: 10.1016/j.foreco.2016.01.040
[12] 贺梦莹, 董利虎, 李凤日. 长白落叶松−水曲柳混交林冠幅预测模型[J]. 北京林业大学学报, 2020, 42(7):23−32. doi: 10.12171/j.1000-1522.20190250 He M Y, Dong L H, Li F R. Crown width prediction models for Larix olgensis and Fraxinus mandshurica mixed plantations[J]. Journal of Beijing Forestry University, 2020, 42(7): 23−32. doi: 10.12171/j.1000-1522.20190250
[13] 李凤日, 王治富, 王保森. 落叶松人工林有效冠动态研究(Ⅰ): 有效冠的确定[J]. 东北林业大学学报, 1996, 24(1):1−8. Li F R, Wang Z F, Wang B S. Studies on the effective crown development of Larix olgensis (Ⅰ): determination of the effective crown[J]. Journal of Northeast Forestry university, 1996, 24(1): 1−8.
[14] Kajihara M. Estimation of stem-volume increment by using sunny crown-surface area and stem-surface area[J]. Journal of the Japanese Forestry Society, 2008, 67: 501−505.
[15] Koenker R, Bassett G W. Regression quantiles[J]. Econometrica, 1978, 46(1): 211−244.
[16] 马岩岩, 姜立春. 基于非线性分位数回归的落叶松树干削度方程[J]. 林业科学, 2019, 55(10):68−75. Ma Y Y, Jiang L C. Stem taper function for Larix gmelinii based on nonlinear quantile regression[J]. Scientia Silvae Sinicae, 2019, 55(10): 68−75.
[17] 辛士冬, 姜立春. 利用分位数回归模拟人工樟子松树干干形[J]. 北京林业大学学报, 2020, 42(2):1−8. doi: 10.12171/j.1000-1522.20190014 Xin S D, Jiang L C. Modeling stem taper profile for Pinus sylvestris plantations using nonlinear quantile regression[J]. Journal of Beijing Forestry University, 2020, 42(2): 1−8. doi: 10.12171/j.1000-1522.20190014
[18] Özçelik R, Cao Q V, Trincado G, et al. Predicting tree height from tree diameter and dominant height using mixed-effects and quantile regression models for two species in Turkey[J]. Forest Ecology and Management, 2018, 419−420: 240−248. doi: 10.1016/j.foreco.2018.03.051
[19] Bohora S B, Cao Q V. Prediction of tree diameter growth using quantile regression and mixed-effects models[J]. Forest Ecology and Management, 2014, 319: 62−66. doi: 10.1016/j.foreco.2014.02.006
[20] 陈科屹, 张会儒, 雷相东, 等. 基于目标树经营的抚育采伐对云冷杉针阔混交林空间结构的影响[J]. 林业科学研究, 2017, 30(5):718−726. Chen K Y, Zhang H R, Lei X D, et. al. Effect of thinning on spatial structure of spruce-fir mixed broadleaf-conifer forest base on crop tree management[J]. Forest Research, 2017, 30(5): 718−726.
[21] 陈科屹, 张会儒, 雷相东, 等. 云冷杉过伐林垂直结构特征分析[J]. 林业科学研究, 2017, 30(3):450−459. Chen K Y, Zhang H R, Lei X D, et. al. Analysis of vertical structure characteristics for spruce-fir over-cutting forest[J]. Forest Research, 2017, 30(3): 450−459.
[22] 孟宪宇. 测树学[M]. 3版. 北京: 中国林业出版社, 2006. Meng X Y. Forest mensuration[M]. 3rd ed. Beijing: China Forestry Publishing House, 2006.
[23] 曾伟生, 骆期邦, 贺东北. 论加权回归与建模[J]. 林业科学, 1999, 35(5):5−11. doi: 10.3321/j.issn:1001-7488.1999.05.002 Zeng W S, Luo Q B, He D B. Research on weighting regression and modeling[J]. Scientia Silvae Sinicae, 1999, 35(5): 5−11. doi: 10.3321/j.issn:1001-7488.1999.05.002
[24] Khurra S M, 韩斐斐, 姜立春. 不同抽样方法对兴安落叶松立木材积方程预测精度的影响[J]. 林业科学, 2018, 54(8):99−105. doi: 10.11707/j.1001-7488.20180811 Khurra S M, Han F F, Jiang L C. Effects of different sampling methods on predict precision of individual tree volume equation for Dahurian larch[J]. Scientia Silvae Sinicae, 2018, 54(8): 99−105. doi: 10.11707/j.1001-7488.20180811
[25] 关静. 分位数回归理论及其应用[D]. 天津: 天津大学, 2009. Guan J. Quantile regression theory and its application[D]. Tianjin: Tianjin University, 2009.
[26] 段光爽, 王秋燕, 宋新宇, 等. 竞争环境下红松单木树高与胸径的相对生长关系[J]. 林业科学, 2020, 56(10):108−115. Duan G S, Wang Q Y, Song X Y, et. al. Relative growth relations between height and diameter of individual Korean pine under competitive environment[J]. Scientia Silvae Sinicae, 2020, 56(10): 108−115.
[27] 张冬燕, 王冬至, 李晓, 等. 基于分位数回归的针阔混交林树高与胸径的关系[J]. 浙江农林大学学报, 2020, 37(3):424−431. Zhang D Y, Wang D Z, Li X, et al. Relationship between height and diameter at breast height (DBH) in mixed coniferous and broadleaved forest based on quantile regression[J]. Journal of Zhejiang A&F University, 2020, 37(3): 424−431.
[28] 董灵波, 刘兆刚, 李凤日, 等. 基于线性混合模型的红松人工林一级枝条大小预测模拟[J]. 应用生态学报, 2013, 24(9):2447−2456. Dong L B, Liu Z G, Li F R, et. al. Primary branch size of Pinus koraiensis plantation: a prediction based on linear mixed effect model[J]. Chinese Journal of Applied Ecology, 2013, 24(9): 2447−2456.
[29] 沈钱勇, 汤孟平. 浙江省毛竹竹秆生物量模型[J]. 林业科学, 2019, 55(11):181−188. doi: 10.11707/j.1001-7488.20191120 Shen Q Y, Tang M P. Stem biomass models of Phyllostachys edulis in Zhejiang Province[J]. Scientia Silvae Sinicae, 2019, 55(11): 181−188. doi: 10.11707/j.1001-7488.20191120
[30] 沈钱勇, 汤孟平. 浙江省毛竹竹秆材积模型[J]. 林业科学, 2020, 56(5):89−96. Shen Q Y, Tang M P. Stem volume models of Phyllostachys edulis in Zhejiang Province[J]. Scientia Silvae Sinicae, 2020, 56(5): 89−96.
-
期刊类型引用(3)
1. 刘索名,王君杰,燕云飞,姜立春. 小兴安岭兴安落叶松人工林冠幅模型构建. 北京林业大学学报. 2023(05): 79-87 .  本站查看
本站查看
2. 李应涛,刘时良,孙海龙,王卫霞,向玮. 云冷杉针阔混交林单木枝下高和冠幅模型构建. 森林与环境学报. 2022(03): 289-296 . 百度学术
3. 佟艺玟,陈东升,冯健,高慧淋. 基于线性分位数混合效应的辽东山区红松冠幅模型. 应用生态学报. 2022(09): 2321-2330 . 百度学术
其他类型引用(1)


计量
- 文章访问数: 1788
- HTML全文浏览量: 646
- PDF下载量: 158
- 被引次数: 4
