
Forest carbon sequestration potential in China under the background of carbon emission peak and carbon neutralization
-
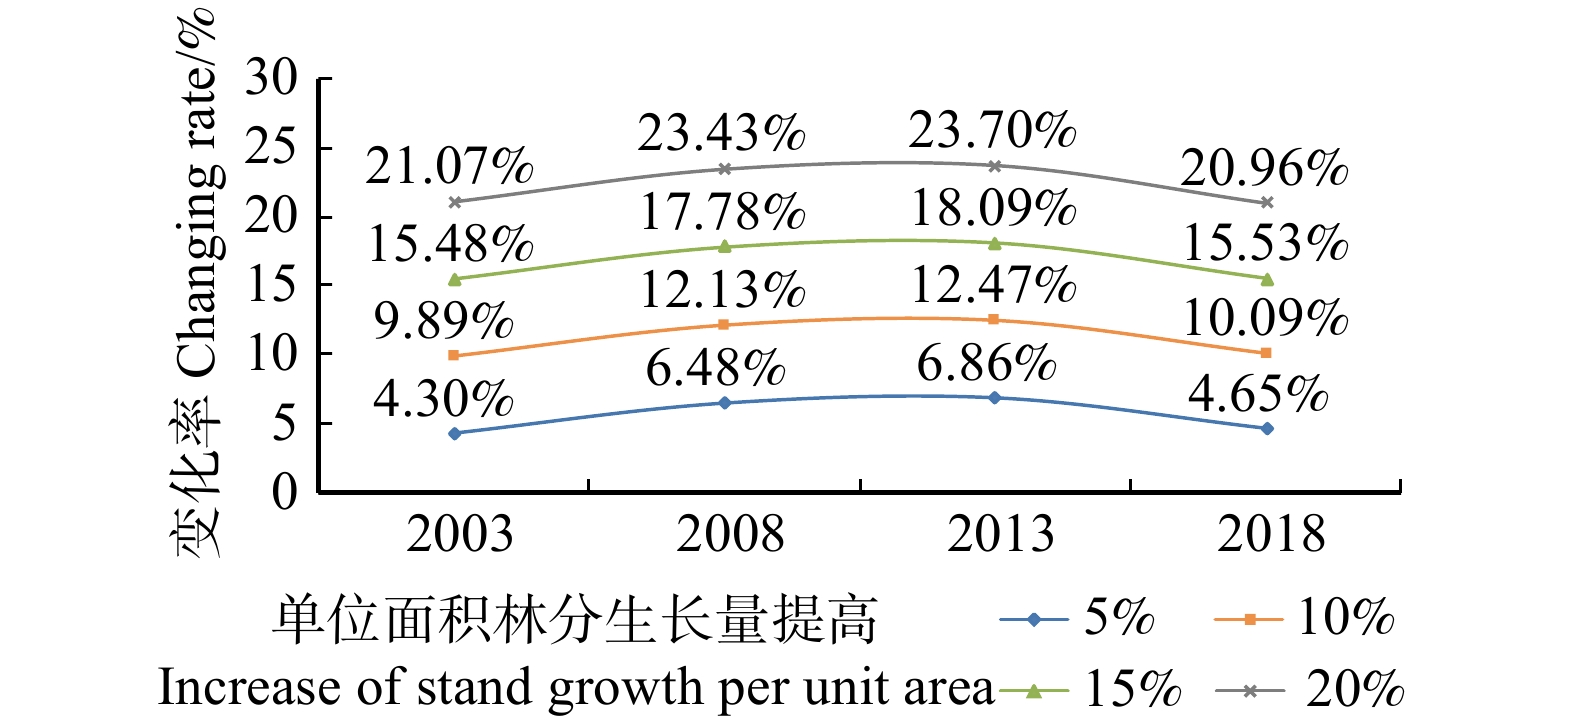
摘要:目的 核算我国森林资源碳储量和价值量,摸清我国森林资源家底,了解森林资源状况,合理制定林业发展规划。预测森林碳储量及碳汇潜力,提高森林经营管理水平,为我国实现碳达峰碳中和的林业发展目标提供参考。方法 利用1973—2018年间9次森林资源清查数据,采用森林蓄积量法核算我国森林资源总碳储量及其变化情况,并按照不同林种分类核算森林资源的碳储量和价值量。采用GM(1,1)灰色预测模型和幂函数模型联合预测我国森林资源碳汇发展潜力,并通过构建林分单位面积生长量和碳储量的回归模型,分析不同经营管理水平下碳汇量的变化率。结果 (1)40多年来中国森林资源单位面积蓄积量平均为73.56 m3/hm2,林木碳储量由1976年的51.96 × 108 t增加到2018年的87.90 ×10⁸ t,年均增汇0.855 7 × 10⁸ t/a,森林资源总碳储量(包括林木、林地和林下植被)由125.06 × 108 t增加到214.39 × 10⁸ t;其中,人工林碳储量增速明显,年均增加5.05%。(2)我国林木碳储量价值量由1976年的1 482.09 × 10⁸ 元增加到2018年的8 823.85 × 10⁸ 元,年均增加174.80 × 10⁸ 元,年复合增长率达到4.34%;其中,人工林碳储量价值年均增长8.24%。(3)GM(1,1)灰色模型预测2030年森林碳储量达到100.13 × 10⁸ t,2018—2030年年均增汇1.59 × 10⁸ t/a,预计2030年森林蓄积量可达到210.80 × 108 m3;2060年中国森林碳储量将达到180.32 × 10⁸ t,2018—2060年年均增汇2.36 × 10⁸ t/a。幂函数模型预测,2030年中国森林碳储量达到108.00 × 108 t,2018 ~ 2030年平均年碳汇量为2.25 ×10⁸ t/a,预计2030年森林蓄积量可达到227.38 × 108 m3;2060年中国森林碳储量达到212.27 × 10⁸ t,2018—2060年年增汇3.12 × 10⁸ t/a。(4)在近15年的森林碳储量平均基准上,森林经营管理水平提高5%,森林碳储量将增加4.30% ~ 6.86%;提高10%,森林碳储量将增加9.89% ~ 12.47%;提高15%,森林碳储量将增加15.48% ~ 18.09%;提高20%,森林碳储量将增加20.96% ~ 21.07%。结论 在不考虑经济、政策等外部因素的影响下,基于森林生物量和蓄积量的变化,中国森林碳储量和价值量都是增加的。按照这个发展趋势,可以实现2030、2060年碳达峰碳中和时中国林业的预期发展目标。如果目前森林经营管理水平再提高,森林碳储量的变化率将逐步增加,碳汇潜力巨大。
-
关键词:
- 碳储量 /
- 蓄积量 /
- 森林碳汇潜力 /
- GM(1,1)灰色模型 /
- 碳达峰碳中和
Abstract:Objective Carbon reserves and value of forest resources in China should be calculated to understand the status of forest resources and formulate a reasonable forestry development plan. Through the prediction of forest carbon stocks and carbon sequestration potential, it can improve the level of forest management and provide reference value for China to achieve the goal of carbon emission peak and carbon neutralization.Method Based on the data of 9 forest inventories from 1973 to 2018 in China, the total carbon stocks of forest resources in China were calculated using forest volume method, and the carbon stocks and values of forest resources were calculated according to different forest types. This paper uses GM (1,1) grey model and power function model to predict the development potential of forest carbon sequestration in China, and analyzes the changing rate of carbon sequestration under different management levels by constructing the regression model of forest growth per unit area and carbon storage.Result (1) Over the past 40 years, China’s average unit area volume of forest resources is 73.56 m3/ha, forest carbon stocks increased from 5.196 billion t in 1976 to 8.790 billion t in 2018, with an average annual increase of 0.085 57 billion t/year. The total carbon stocks of forest resources (including forest, woodland and understory vegetation) increased from 12.506 billion t to 21.439 billion t; among them, carbon stocks of plantation increased significantly, with an average annual increase of 5.05%. (2) The values of forest carbon stocks in China increased from 148.209 billion CNY in 1976 to 882.385 billion CNY in 2018, with an average annual increase of 17.480 billion CNY and a compound annual growth rate of 4.34%. Among them, the values of plantation carbon stocks increased by 8.24%. (3) The GM (1,1) grey model predicted that the forest carbon stocks will reach 10.013 billion t in 2030, the average annual increase of carbon sequestration will be 159 million t/year from 2018 to 2030, and the forest volume will reach 21.080 billion m3 in 2030; the forest carbon stocks in China will reach 18.032 billion t in 2060, and the average annual increase of carbon sequestration will be 236 million t/year from 2018 to 2060. The power function model predicted that China’s forest carbon stocks will reach 10.8 billion t in 2030, the average annual carbon sequestration will be 225 million t/year from 2018 to 2030, and the forest volume was expected to reach 22.738 billion m3 in 2030; China’s forest carbon stocks will reach 21.227 billion t in 2060, and the annual increase of carbon sequestration will be 312 million t/year from 2018 to 2060. (4) Based on the average benchmark of forest carbon stocks in recent 15 years, if the forest management level increase by 5%, the forest carbon stocks will increase by 4.30% − 6.86%; if increase by 10%, the forest carbon stocks will increase by 9.89% − 12.47%; if increase by 15%, the forest carbon stocks will increase by 15.48% − 18.09%; and if the forest management level increase by 20%, the forest carbon stocks will increase by 20.96% − 21.07%.Conclusion Without considering the influence of external factors such as economy and policy, based on the changes of forest biomass and volume, forest carbon stocks and values in China are increased. According to this development trend, China can achieve the expected development goal of carbon emission peak and carbon neutralization for forestry in 2030 and 2060. If the current forest management level is further improved, the changing rate of forest carbon stocks will gradually increase, and the carbon sequestration potential will be huge. -
-
![]()
图 1 不同经营管理水平下我国森林碳储量的变化率
Figure 1. Changing rate of forest carbon storage in China under different management levels
表 1 基于森林资源清查数据计算的中国森林资源碳储量及其变化
Table 1 Carbon stocks and changes of forest resources in China based on forest inventory data
时期 Period 森林单位面积蓄积量/
(m3·hm−2)
Stock volume per unit
area of forest/(m3·ha−1)林木碳储量
Forest carbon
storage/108 t森林资源碳储量
Carbon storage of forest
resources/108 t碳密度/(t·hm−2)
Carbon density/
(t·ha−1)碳汇量/(108 t·a−1)
Carbon sequestration/
(108 t·year−1)1976(1973—1976) 71.27 51.96 125.06 42.64 1981(1977—1981) 78.32 55.84 134.53 48.44 0.776 3 1988(1984—1988) 73.33 57.50 138.59 46.13 0.237 5 1993(1989—1993) 67.97 58.37 140.71 43.66 0.173 9 1998(1994—1998) 70.89 59.32 144.68 37.32 0.189 5 2003(1999—2003) 71.21 64.69 157.77 36.98 1.074 0 2008(2004—2008) 73.67 69.13 168.61 38.11 0.888 0 2013(2009—2013) 77.24 76.35 186.22 39.90 1.444 0 2018(2013—2018) 78.17 87.90 214.39 40.28 2.310 0 总平均 Total mean 73.56 0.855 7 注:碳汇量核算以林木碳储量为基准,下文表格中均以核算的节点年份表述。Notes: carbon sequestration accounting is based on forest carbon reserves, and the following tables are expressed in the node year of accounting.  下载: 导出CSV
表 2 按林木构成计算的中国森林资源碳储量及其变化
Table 2 Carbon stocks and change of forest resources in China based on forest composition
108 t 指标 Index 1976 1981* 1988 1993 1998 2003 2008 2013 2018 林木总碳储量 Forest total carbon storage 51.96 55.84 57.50 58.37 59.32 64.69 69.13 76.35 87.90 森林碳储量 Forest carbon storage 47.44 49.27 49.87 49.59 53.52 59.17 63.47 70.20 81.03 按林龄划分 Classification by stand age 幼龄林 Young forest 4.18 4.89 6.64 6.61 5.48 6.10 7.07 7.74 10.16 中龄林 Middle-aged forest 11.41 15.48 13.61 15.34 14.77 16.27 18.34 19.50 22.90 近熟林 Near-mature forest 32.05 25.63 6.42 7.67 9.88 10.67 12.59 14.41 16.69 成熟林 Mature forest 3.12 1.16 14.45 12.90 13.64 14.33 15.00 16.93 19.05 过熟林 Over mature forest 1.16 1.16 7.79 11.70 9.75 10.09 10.47 11.61 12.22 按起源划分 Classification by origin 天然林 Natural forest 45.42 42.22 41.46 45.79 43.10 50.32 54.16 58.41 64.94 人工林 Plantation 2.03 2.61 3.98 4.95 4.81 7.15 9.31 11.79 16.09 按用途划分 Classification by use 防护林 Protection forest 5.46 5.87 8.62 10.63 11.62 21.30 34.91 37.75 41.89 特用林 Special-use forest 1.52 1.92 3.57 3.80 3.58 4.46 8.29 10.31 12.44 用材林 Timber forest 42.38 37.83 34.06 37.10 31.42 25.24 20.08 21.86 25.72 薪炭林 Fuel forest 1.40 1.53 1.51 1.53 0.42 0.26 0.19 0.28 0.27 经济林 Economic forest 0.00 0.00 0.00 0.00 0.00 0.00 0.00 0.00 0.71 疏林 Open forest 4.12 4.05 4.07 4.06 0.65 0.61 0.54 0.50 0.48 散生木 Scattered forest 2.15 4.06 4.86 5.27 3.34 3.37 3.54 3.75 4.17 四旁树 Four-side tree 1.86 1.94 2.18 2.93 1.81 1.54 1.58 1.90 2.23 注:*表示在第2次(1977—1981)森林资源清查数据中,由于台湾和西藏自治区的森林资源单独分开统计,研究中采用的全国合计数据不包括台湾省和西藏自治区实际控制线外的森林资源统计数据,可能计算结果相对偏小。Notes: *, in the second forest resources inventory data (1977−1981), since the forest resources of Taiwan and Tibet Autonomous Region are separately counted, the national total data used in the study does not include the forest resources statistics outside the actual control line of Taiwan Province and Tibet Autonomous Region, and the possible calculation results are relatively small.
下载: 导出CSV
表 3 中国森林碳储量价值量核算表 108 元
Table 3 Monetary accounting table of forest carbon sinks in China
108 CNY 指标 Index 1976 1981 1988 1993 1998 2003 2008 2013 2018 林木总碳储量价值量 Forest total carbon storage value 1 482.09 1 449.14 3 254.98 5 102.15 7 449.81 8 122.44 7 286.51 7 176.10 8 823.85 森林碳储量价值量 Forest carbon storage value 1 353.29 1 278.66 2 823.16 4 334.23 6 721.49 7 429.27 6 690.06 6 597.97 8 133.92 按林龄划分 Classification by stand age 幼龄林 Young forest 119.19 126.79 375.70 577.76 688.48 766.42 744.86 727.88 1 020.01 中龄林 Middle-aged forest 325.45 401.60 770.40 1 340.40 1 854.76 2 043.27 1 933.24 1 833.08 2 298.98 近熟林 Near-mature forest 914.30 665.15 363.44 670.11 1 240.95 1 339.33 1 326.65 1 354.70 1 675.73 成熟林 Mature forest 88.92 30.03 818.07 1 127.69 1 712.84 1 799.25 1 581.43 1 590.94 1 912.63 过熟林 Over mature forest 33.00 30.03 440.88 1 022.79 1 223.95 1 267.35 1 103.87 1 091.37 1 226.56 按起源划分 Classification by origin 天然林 Natural forest 1 295.59 1 095.67 2 346.67 4 002.57 5 412.42 6 318.25 5 708.51 5 489.42 6 518.60 人工林 Plantation 57.99 67.85 225.34 432.79 604.31 897.38 981.55 1 108.51 1 615.32 按用途划分 Classification by forest use 防护林 Protection forest 155.72 152.24 487.73 929.37 1 459.09 2 674.75 3 679.98 3 548.30 4 204.75 特用林 Special-use forest 43.38 49.84 202.18 332.48 449.43 560.46 874.19 968.77 1 248.55 用材林 Timber forest 1 208.96 981.84 1 927.80 3 242.42 3 946.38 3 168.84 2 116.29 2 054.51 2 582.21 薪炭林 Fuel forest 39.80 39.66 85.29 133.35 53.17 33.04 19.59 26.34 27.02 经济林 Economic forest 0.00 0.00 0.00 0.00 0.00 0.00 0.00 0.00 71.39 疏林 Open forest 117.64 105.00 230.16 354.96 81.14 76.44 57.19 47.19 47.81 散生木 Scattered forest 61.29 105.34 275.02 460.49 419.57 423.68 372.83 352.06 418.68 四旁树 Four-side tree 53.13 50.23 123.12 255.85 227.42 192.79 166.43 178.88 223.44 注:美元兑人民币汇率平均值为:1976年为1.880 3,1981年为1.710 7,1988年为3.731 4,1993年为5.761 8,1998年为8.279 0,2003年为8.277 4,2008年为6.948 0,2013年为6.195 6,2018年为6.617 4[23]。
Notes: the average exchange rate of USD to RMB is: 1.880 3 in 1976, 1.710 7 in 1981, 3.731 4 in 1988, 5.761 8 in 1993, 8.279 0 in 1998, 8.277 4 in 2003, 6.948 0 in 2008, 6.195 6 in 2013, 6.617 4 in 2018[23].
下载: 导出CSV
表 4 GM(1,1)预测模型预测结果对照表
Table 4 Comparison table of prediction results of GM (1,1) prediction model
年份 Year 森林碳储量实际值
Actual value of forest
carbon stock/108 t森林碳储量预测值
Predicted value of forest
carbon stock/108 t残差
Residual相对误差
Relative error (ε)/%1976 47.44 1981 49.27 1988 49.87 49.870 0 0 1993 49.59 48.410 2 1.179 8 2.38 1998 53.52 53.397 3 0.122 7 0.23 2003 59.17 58.898 2 0.271 8 0.46 2008 63.47 64.965 9 −1.495 9 2.36 2013 70.20 71.658 6 −1.458 6 2.08 2018 81.03 79.040 8 1.989 2 2.45 平均相对误差Average relative error 1.66 后验差检验 Posterior error test(C) 0.1096
下载: 导出CSV
表 5 中国森林面积及林木碳储量预测
Table 5 Prediction of forest area and forest carbon stocks in China
年份
Year森林面积实际值/
104 hm2
Actual value of
forest area/104 ha林木碳储量实际值
Actual value of forest
carbon storage/108 tGM(1,1)模型 GM (1,1) model 幂函数模型 Power function model 森林面积预测值/104 hm2
Predicted value of
forest area/104 ha林木碳储量预测值
Predicted value of forest
carbon storage/108 t森林面积预测值/104 hm2
Predicted value of
forest area /104 ha林木碳储量预测值
Predicted value of forest
carbon storage/108 t1976 12 186.00 47.44 1981 11 527.74 49.27 1988 12 465.28 49.87 12 465.28 49.87 12 358.99 49.53 1993 13 370.35 49.59 14 084.08 48.41 13 930.07 50.56 1998 15 894.09 53.52 15 341.53 53.40 15 443.59 53.36 2003 17 490.92 59.17 16 711.24 58.90 16 936.12 57.81 2008 18 138.09 63.47 18 203.25 64.97 18 415.17 63.82 2013 19 133.00 70.20 19 828.46 71.66 19 884.29 71.36 2018 21 822.05 81.03 21 598.78 79.04 21 345.54 80.40 2023 23 527.15 87.18 22 800.28 90.89 2028 25 627.69 96.16 24 249.46 102.83 2033 27 915.77 106.07 25 693.81 116.19 2038 30 408.13 117.00 27 133.88 130.95 2043 33 123.01 129.05 28 570.10 147.11 2048 36 080.28 142.35 30 002.84 164.64 2053 39 301.58 157.01 31 432.39 183.54 2058 42 810.49 173.19 32 859.01 203.79 2063 46 632.67 191.03 34 282.91 225.38 C 0.174 7 0.109 6 R2 0.973 48 0.994 02 平均绝对误差百分比
Average absolute error percentage (MAPE)/%3.08 1.66 2.68 1.17 2030 26 542.92 100.13 24 827.75 108.00 2060 44 339.36 180.32 33 428.88 212.27
下载: 导出CSV
-
[1] Richards K R, Stokes C. A review of forest carbon sequestration cost studies: a dozen years of research[J]. Climatic Change, 2004, 63(1−2): 1−48.
[2] 姜霞, 黄祖辉. 经济新常态下中国林业碳汇潜力分析[J]. 中国农村经济, 2016(11):57−67. Jiang X, Huang Z H. Analysis of China’s forestry carbon sink potential under the economic new normal[J]. Chinese Rural Economy, 2016(11): 57−67.
[3] 国家林业和草原局. 中国森林资源清查报告(2014—2018)[M]. 北京: 中国林业出版社, 2019. National Forestry and Grassland Administration. Forest resources inventory report of China (2014−2018)[M]. Beijing: China Forestry Publishing House, 2019.
[4] 刘国华, 傅伯杰, 方精云. 中国森林碳动态及其对全球碳平衡的贡献[J]. 生态学报, 2000, 20(5):733−740. doi: 10.3321/j.issn:1000-0933.2000.05.004 Liu G H, Fu B J, Fang J Y. Carbon dynamics of Chinese forests and its contribution to global carbon balance[J]. Acta Ecologica Sinica, 2000, 20(5): 733−740. doi: 10.3321/j.issn:1000-0933.2000.05.004
[5] 张颖, 周雪, 覃庆锋, 等. 中国森林碳汇价值核算研究[J]. 北京林业大学学报, 2013, 35(6):124−131. Zhang Y, Zhou X, Qin Q F, et al. Value accounting of forest carbon sinks in China[J]. Journal of Beijing Forestry University, 2013, 35(6): 124−131.
[6] 马学威, 熊康宁, 张俞, 等. 森林生态系统碳储量研究进展与展望[J]. 西北林学院学报, 2019, 34(5):62−72. doi: 10.3969/j.issn.1001-7461.2019.05.10 Ma X W, Xiong K N, Zhang Y, et al. Research progresses and prospects of carbon storage in forest ecosystems[J]. Journal of Northwest Forestry University, 2019, 34(5): 62−72. doi: 10.3969/j.issn.1001-7461.2019.05.10
[7] Paul S. Can intensive management increase carbon storage in forests[J]. Environment Management, 1991, 15(4): 475−481.
[8] Golub A, Hertel T, Lee H L, et al. The opportunity cost of land use and the global potential for greenhouse gas mitigation in agriculture and forestry[J]. Resource and Energy Economics, 2009, 31(4): 299−319. doi: 10.1016/j.reseneeco.2009.04.007
[9] Nepal P, Ince P J, Skog K E, et al. Projection of US forest sector carbon sequestration under US and global timber market and wood energy consumption scenarios, 2010−2060[J]. Biomass and Bioenergy, 2012, 45(45): 251−264.
[10] 续珊珊. 森林碳储量估算方法综述[J]. 林业调查规划, 2014, 39(6):28−33. doi: 10.3969/j.issn.1671-3168.2014.06.007 Xu S S. A review of forest carbon storage estimation methods[J]. Forest Survey and Planning, 2014, 39(6): 28−33. doi: 10.3969/j.issn.1671-3168.2014.06.007
[11] 郗婷婷, 李顺龙. 黑龙江省森林碳汇潜力分析[J]. 林业经济问题, 2006(6):519−522, 526. doi: 10.3969/j.issn.1005-9709.2006.06.008 Xi T T, Li S L. Analysis of forest carbon mitigation potential in Heilongjiang Province[J]. Issues in Forestry Economy, 2006(6): 519−522, 526. doi: 10.3969/j.issn.1005-9709.2006.06.008
[12] 方精云, 郭兆迪, 朴世龙, 等. 1981—2000年中国陆地植被碳汇的估算[J]. 中国科学(D辑: 地球科学), 2007, 37(6):804−812. Fang J Y, Guo Z D, Piao S L, et al. Estimation of terrestrial vegetation carbon sink in China from 1981 to 2000[J]. Science in China (Series D: Earth Sciences), 2007, 37(6): 804−812.
[13] 方精云, 陈安平, 赵淑清, 等. 中国森林生物量的估算: 对Fang等Science一文(Science, 2001, 291: 2320−2322)的若干说明[J]. 植物生态学报, 2002, 26(2):243−249. doi: 10.3321/j.issn:1005-264X.2002.02.018 Fang J Y, Chen A P, Zhao S Q, et al. Estimation of forest biomass in China: notes to Fang et al. Science (Science, 2001, 291: 2320−2322)[J]. Chinese Journal of Plant Ecology, 2002, 26(2): 243−249. doi: 10.3321/j.issn:1005-264X.2002.02.018
[14] 方精云, 陈安平. 中国森林植被碳库的动态变化及其意义[J]. 植物学报, 2001, 43(9):967−973. Fang J Y, Chen A P. Dynamic forest biomass carbon pools in China and their significance[J]. Acta Botanica Sinica, 2001, 43(9): 967−973.
[15] 张颖, 吴丽莉, 苏帆, 等. 我国森林碳汇核算的计量模型研究[J]. 北京林业大学学报, 2010, 32(2):194−200. Zhang Y, Wu L L, Su F, et al. An accounting model for forest carbon sinks in China[J]. Journal of Beijing Forestry University, 2010, 32(2): 194−200.
[16] 李奇, 朱建华, 冯源, 等. 中国森林乔木林碳储量及其固碳潜力预测[J]. 气候变化研究进展, 2018, 14(3):287−294. Li Q, Zhu J H, Feng Y, et al. Carbon storage and carbon sequestration potential of the forest in China[J]. Climate Change Research, 2018, 14(3): 287−294.
[17] 张煜星, 王雪军. 全国森林蓄积生物量模型建立和碳变化研究[J]. 中国科学: 生命科学, 2021, 51(2):199−214. Zhang Y X, Wang X J. Study on forest volume-to-biomass modeling and carbon change in forest dynamics in China[J]. Scientia Sinica Life Sciences, 2021, 51(2): 199−214.
[18] 李顺龙, 杜咏梅, 蒋敏元. 我国森林碳汇问题初探[J]. 林业财务与会计, 2004(7):5−6. Li S L, Du Y M, Jiang M Y. A preliminary study on forest carbon sink in China[J]. Forestry Finance and Accounting, 2004(7): 5−6.
[19] 新华网, 碳交易网. 习近平: 中国努力争取2060年前实现碳中和[EB/OL]. [2021−04−08]. http://www.tanpaifang.com/tanzhonghe/2020/0923/74144.html. Xinhua Net, Carbon Trading Net. Xi Jinping: China is striving to be carbon neutral by 2060 [EB/OL]. [2021−04−08]. http://www.tanpaifang.com/tanzhonghe/2020/0923/74144.html.
[20] 张颖, 潘静. 森林碳汇经济核算及资产负债表编制研究[J]. 统计研究, 2016, 33(11):71−76. Zhang Y, Pan J. The research on economic accounting of forest carbon sinks and its balance sheet establishment[J]. Statistical Research, 2016, 33(11): 71−76.
[21] 孙毅兵. 森林生态系统土壤碳影响因素研究[J]. 林业勘查设计, 2021, 50(3):73−75. Sun Y B. Research on influencing factors of soil carbon in forest ecosystem[J]. Forestry Work Research, 2021, 50(3): 73−75.
[22] 陈叙图, 李怒云, 高岚, 等. 美国林业碳汇市场现状及发展趋势[J]. 林业经济, 2009(7):76−80. Chen X T, Li N Y, Gao L, et al. The development background, development status and tide of the American forest carbon market[J]. Forestry Economics, 2009(7): 76−80.
[23] 中国外汇交易中心. 人民币汇率年平均汇率[EB/OL]. [2021−04−06]. http://www.chinamoney.com.cn/chinese/bkccpr/?tab=2. China Foreign Exchange Trade Center. The annual average exchange rate of RMB exchange rate [EB/OL]. [2021−04−06]. http://www.chinamoney.com.cn/chinese/bkccpr/?tab=2.
[24] 曾伟生, 孙乡楠, 王六如, 等. 东北林区10种主要森林类型的蓄积量、生物量和碳储量模型研建[J]. 北京林业大学学报, 2021, 43(3):1−8. doi: 10.12171/j.1000-1522.20200058 Zeng W S, Sun X N, Wang L R, et al. Developing stand volume, biomass and carbon stock models for ten major forest types in forest region of northeastern China[J]. Journal of Beijing Forestry University, 2021, 43(3): 1−8. doi: 10.12171/j.1000-1522.20200058
[25] 徐宁,丁松, 公彦德. 灰色GM(1,1)预测模型及拓展研究进展[J]. 数学的实践与认识, 2021, 51(13):52−59. Xu N, Ding S, Gong Y D. Advances in grey GM(1,1) forecasting model and its extension[J]. Mathematics in Practice and Theory, 2021, 51(13): 52−59.
[26] 陈景和, 王家福, 赵廷翠, 等. 我国与世界森林资源评估分析[J]. 山东林业科技, 2015, 45(3):94−96. doi: 10.3969/j.issn.1002-2724.2015.03.031 Chen J H, Wang J F, Zhao T C, et al. Analysis of forest resources assessment between China and the world[J]. Shandong Forestry Science and Technology, 2015, 45(3): 94−96. doi: 10.3969/j.issn.1002-2724.2015.03.031
[27] 陕西森工. 我国森林植被总碳储量已达92亿吨! 森林碳汇作用这么强大?[EB/OL].[2021−01−15]. https://m.sohu.com/a/444763670_187549/. Shaanxi Forest Industry. China’s total carbon storage of forest vegetation has reached 9.2 billion tons! Are forest sinks so powerful?[EB/OL]. [2021−01−15]. https://m.sohu.com/a/444763670_187549/.
计量
- 文章访问数: 5049
- HTML全文浏览量: 3970
- PDF下载量: 1246
