
Changing patterns of nitrogen and phosphorus contents in leaf-branch-root of natural Pinus tabuliformis with precipitation and temperature
-
摘要:目的
对油松叶、枝、根的氮、磷含量随水热变化的响应规律进行研究,有助于加深对我国暖温带地区森林植物应对气候变化策略的认识。
方法本文基于生态化学计量学理论,在我国天然油松林主要分布区选择7个代表性样点,对优势种油松叶、枝、根的氮、磷含量进行定量分析。
结果(1)油松叶、枝、根器官间氮、磷含量存在显著差异,叶的氮、磷含量均高于枝和根的氮、磷含量,其中当年生叶、当年生枝的氮、磷含量高于多年生叶、多年生枝的氮、磷含量。吸收根氮、磷含量高于次生根氮、磷含量。当年生叶、当年生枝的氮磷比低于多年生叶、多年生枝的氮磷比,次生根氮磷比高于吸收根氮磷比。(2)油松叶、枝、根的氮、磷含量的变异程度存在差异,整体变异系数范围为12.3% ~ 44.4%,其中吸收根磷含量的变异系数最大,多年生叶氮含量的变异系数最小。(3)油松不同器官的氮磷化学计量特征随环境变化的响应存在差异,油松多年生叶氮含量、多年生及当年生枝氮、磷含量随降水量的增加呈显著下降的趋势。多年生及当年生叶磷含量、枝磷含量均随温度的升高呈显著上升的趋势。多年生及当年生叶氮磷比、枝氮磷比随温度的升高呈显著下降的趋势。次生根磷含量随温度的升高呈显著上升的趋势,次生根氮磷比随温度升高呈显著下降的趋势。
结论降水、温度对我国天然油松林优势物种油松叶、枝、根的氮磷化学计量特征有显著影响,不同器官应对这两个环境因子的响应趋势及适应机制不同。
Abstract:ObjectiveStudying the response of nitrogen and phosphorus contents in leaf-root of Pinus tabuliformis to hydrothermal changes can enhance our understanding of the strategies for forest community plants in warm temperate regions of China to confront the challenges posed by climatic shifts.
MethodSeven representative sample locations were selected in the main distribution areas of natural P. tabuliformis forests in China, and the nitrogen (N) and phosphorus (P) contents in the leaves, branches, and roots of P. tabuliformis were meticulously assessed according to the theory of ecological stoichiometry.
Result(1) Differences in nitrogen (N) and phosphorus (P) contents among various plant organs of leaves, branches, and roots were evident. Notably, concentrations of N and P in leaves surpassed those in branches and roots. Additionally, both current leaves and branches exhibited higher N and P levels compared with their perennial counterparts, while absorbed roots displayed elevated N and P contents compared with secondary roots. The N∶P ratios in current leaves and branches were lower than those in perennial leaves and in perennial branches, whereas secondary roots demonstrated a higher N∶P ratio than absorbed roots. (2) Variability in nitrogen (N) and phosphorus (P) content differed among leaves, branches, and roots, as indicated by the overall coefficient of variation ranging from 12.3% to 44.4%. Notably, the highest variability was observed in absorbed roots, contrasting with the lowest variability observed in perennial leaves. (3) The adaptive responses of nitrogen (N) and phosphorus (P) stoichiometry within distinct organs of P. tabuliformis to environmental shifts exhibited notable variations. Specifically, the N content in perennial leaves, perennial branches, and current branches, along with the P content in perennial branches and both current branches and leaves, experienced significant decreases with escalating precipitation. Conversely, a significant uptrend in P content was observed in perennial leaves, perennial branches, current leaves, and current branches as the temperature increased. Simultaneously, the N∶P ratio in perennial leaves, perennial branches, and both current leaves and branches demonstrated substantial declines with rising temperatures. Notably, the P content in secondary roots displayed a marked increase with elevated temperature, whereas the N∶P ratio in secondary roots exhibited a notable decrease.
ConclusionBoth precipitation and temperature exert significant impacts on the nitrogen (N) and phosphorus (P) stoichiometry in the leaves, branches, and roots of P. tabuliformis. The diverse response trends and adaptation mechanisms of distinct organs to these two environmental factors exhibite marked variations.
-
中国木结构古建筑是人类文明长河中最悠久持续的传统建筑之一,其体系的完备和规范无与伦比,堪称中华文化瑰宝中的璀璨明珠[1]。木柱是木结构古建筑的关键承重构件之一,支撑着建筑顶部的全部重量。古建筑木柱根据其与墙体间的位置关系,可分为露明柱、半露明柱和墙内暗柱3类[2]。其中,墙内暗柱是指完全被墙体包裹的木柱,因其根部处于易潮湿和缺乏通风的环境,易产生腐朽及由严重腐朽导致的材料缺失等缺陷。这些缺陷会使木柱丧失原有的承重能力,给整个古建筑的安全带来隐患。
为了检测古建筑木柱内部以及被墙体遮挡处的缺陷,往往需要采用无损检测技术,这类非破坏式检测可在尽量保持材料和结构完整的前提下,利用现代物理手段和仪器对其缺陷情况以及物理力学性能进行检测与分析[3−4]。根据T/CECS714—2020《古建筑木结构检测标准》[5]和DB11/T1190.1—2015《古建筑结构安全性鉴定技术规范第一部分》[6],目前用于检测古建筑木柱缺陷的方法主要有微钻阻力法和应力波法等。陈勇平等[7]通过分析微钻阻力曲线的轮廓和走势,实现了对瓜棱柱露明柱内部结构的精确探测,从而推断出早期和后期瓜棱柱维修的差异。段新芳等[8]采用应力波测定仪FAKOPP对塔尔寺大金瓦殿部分木构件中的木柱进行了检测,结果表明应力波技术可以判断和测量木构件内部的缺陷情况和力学强度。张典等[2]、于永柱等[9]对故宫养心殿墙体木柱(半露明柱和墙内暗柱)缺陷状况进行了无损检测研究,对半露明柱的检查充分利用了木柱外露表面提供的仪器操作空间,而墙内暗柱利用透风墙体的通风口拆除部分砖块形成的拆口,作为仪器操作空间进行检查,并利用有限元进行了安全性分析。Kandemir-Yucel等[10]利用超声波速测量技术与其他技术结合对土耳其清真寺中的木结构进行无损检测,评估包括木柱在内的结构木构件的保存状态、潮湿情况与修复情况。
到目前为止,古建筑木柱无损检查研究和应用多针对的是露明柱和半露明柱,而对墙内暗柱缺陷状况检测相对很少,且往往需要利用墙内暗柱透风口并拆除部分砖块形成的拆口进行检测。这种墙内暗柱检查方式在一定程度上会破坏古建筑原有结构与形貌,且由于仪器无法全面铺开,存在检测死角,检测效果并不理想。因此,亟需一种不破坏古建筑结构的墙内暗柱无损检查方法。
红外热成像技术利用物体会按照温度辐射不同波长电磁波的原理,将检测物体发出的红外辐射转换为可视化温度场,实现对物体的缺陷测量[11]。有研究者将红外热成像技术应用到墙壁外保温层的热工缺陷、表面开裂和墙面间空鼓等的检测中。Grinzato等[12]通过热像仪记录温度的空间分布与时间演变过程,基于最合适的局部热参数对数据进行处理,以检测出墙体的缺陷分布,但无法检测具有较低热信号特征的缺陷。Tavukçuoğlu等[13]将红外热成像技术与超声波相结合,有效地检测了历史砌体的裂缝,并区分裂缝深度,但需要对区域进行连续热监测,以升温速率判断深度。Afshani等[14]基于被动热成像检测损伤的混凝土结构中的缺陷,解释了由于传导、对流和辐射机制引起的混凝土管片、隧道空气和空隙内部空气中的热量传递,并分析了空洞类型、温差和空洞深度对检测精度的影响。Martínez等 [15]利用被动红外热成像技术评估西班牙马德里木质屋顶建筑的缺陷情况,证明该技术可以检测热变化的缺陷,但环境因素与检测时间会影响热检测的效果,且没有进行主动热成像的缺陷检测研究。
本研究团队针对古建筑墙内暗柱缺陷状况检测困难的问题,基于红外热成像无损检测技术开展了相关研究。首先,从理论上分析墙体与木柱传热机理,以及缺陷参数对热传导的影响;然后,建立试验模型,进行墙内暗柱材料缺失红外检查试验,采集红外图像;最后,通过分析获得的红外热图,探讨墙内暗柱缺陷大小与墙体表面温度分布之间的关系。以期为基于红外热成像的墙内暗柱缺陷状况的材料缺失无损检测方法的建立,奠定部分前期基础。
1. 热成像检测理论基础
1.1 红外热成像检测原理
因为墙内暗柱根部最易腐朽,所以按照外表面垂直剖面介质的不同,将古建筑墙内暗柱观测面分为3个部分:纯墙体区域P1、完整木柱区域P2、缺陷木柱区域P3(图1)。本研究模拟冬季暖气等加热设备加热室内墙体的环境,近似认为加热设备给墙面施加均匀稳定的热。此时室内的墙体表面靠近热源,被定义为内表面,远离热源的室外墙体表面被定义为外表面。当P3区域木柱出现缺陷缺失时,热量辐射到墙壁内表面并传热至观测面(外表面),导致观测面上P1、P2、P3区域的温度存在一定差异,从而产生不同的红外表征,红外热像仪利用这种辐射差异,在形成的红外热图上出现其相对应的“热区”和“冷区”。因此,可以通过红外热像图红外表征分析古建筑墙内暗柱缺陷情况。
![]() 图 1 墙内暗柱观测区域划分P1. 纯墙体区域 Pure wall area;P2. 完整木柱区域 Complete wood column area;P3. 缺陷木柱区域 Defective wood column areaFigure 1. Division of observation area of fully-concealed wood column in walls
图 1 墙内暗柱观测区域划分P1. 纯墙体区域 Pure wall area;P2. 完整木柱区域 Complete wood column area;P3. 缺陷木柱区域 Defective wood column areaFigure 1. Division of observation area of fully-concealed wood column in walls1.2 传热机理
1.2.1 墙体与木柱传热机理
以Y-Z平面为剖面剖切墙体,图2a为P1区域单层砖墙体导热[16]示意图,其两个表面分别维持在均匀且恒定的温度T0、T1中,图2b为P2区域3层导热示意图,第一层和第三层为砖墙体,第二层为木柱,两个表面分别维持在均匀且恒定的温度T0、T3中。该导热问题的数学描述为
![]() 图 2 墙体一维热传导T0. 加热温度 Heating temperature;T1. 单层墙外表面温度 Single-layer wall exterior surface temperature;T1′. 3层墙第一、二层之间温度 Temperature between the first and second layers of the three-layer wall;T2. 3层墙第二、三层之间温度 Temperature between the second and third layers of the three-layer wall;T3. 3层墙外表面温度 Three-layer wall exterior surface temperature;d. 墙体厚度 Wall thickness;δ1. 第一层墙厚度 First layer wall thickness;δ2. 第二层墙厚度/木柱直径 Second layer wall thickness/wood column diameter;δ2. 第三层墙厚度 Third layer wall thickness;q. 热流密度 Heat fluxFigure 2. One-dimensional heat conduction of wall
图 2 墙体一维热传导T0. 加热温度 Heating temperature;T1. 单层墙外表面温度 Single-layer wall exterior surface temperature;T1′. 3层墙第一、二层之间温度 Temperature between the first and second layers of the three-layer wall;T2. 3层墙第二、三层之间温度 Temperature between the second and third layers of the three-layer wall;T3. 3层墙外表面温度 Three-layer wall exterior surface temperature;d. 墙体厚度 Wall thickness;δ1. 第一层墙厚度 First layer wall thickness;δ2. 第二层墙厚度/木柱直径 Second layer wall thickness/wood column diameter;δ2. 第三层墙厚度 Third layer wall thickness;q. 热流密度 Heat fluxFigure 2. One-dimensional heat conduction of walld2Tdx2=0 (1) 式中:T为温度,℃;x为表示长度的横坐标,m。
将式(1)连续积分两次,并将边界条件x = 0,T = T0和 x = d(墙体厚度),T = T1分别代入其中,可得出温度分布。
T=T1−T0δx+T0 (2) 因为δ、T0、T1为定值,所以温度呈线性分布,即温度分布曲线的斜率是常数。
dTdx=T1−T0δ (3) 对于表面积为A(m2),两侧表面各自维持均匀温度的墙壁,将式(3)代入傅里叶定律的表达式可得
q=ΦA=−λdTdx (4) 式中:q为热流密度,W/m2;Φ为热流量,W;λ为导热系数,W/(m·℃)。
R为单位面积热阻,m2·℃/W,它表示热量传递过程中的阻力,热阻越小则单位面积热流量越大。
R=ΔTxq=δλ (5) 式中:δ为墙体沿x轴方向的厚度,m;∆Tx为平壁两侧的温差,℃。由式(5)可知热传导中热阻与材料厚度和导热系数有关。
将P2区域的稳态导热过程简化为3层平壁导热,理想状况下假设墙壁与木柱界面无接触热阻,则热流密度的计算式为
q=T0−T3δ1λw+δ2λt+δ3λw (6) 式中:λw、λt分别为墙体和木柱横向导热系数,W/(m·℃)。
木材细胞中空,内部空气是热电不良导体,故木材是一种天然的、隔热性能较好的材料。落叶松的横向导热系数远小于墙体导热系数,即λw > λt。根据式(5)可知墙体单位面积热阻Rw < 木柱单位面积热阻 Rt,根据式(6)可知纯墙体区域热流密度qP1 > 完整木柱区域热流密度qP2。故相比于P1区域,P2区域的单位热阻较大,传导能力较弱。加热面加热温度相同的情况下,P2区域所对应的温度偏低,故可以通过区域的温度差异实现墙内暗柱位置的判断。
1.2.2 缺陷处传热原理
为了简化计算我们将木柱看成墙体结构中连续的一部分(图3),无接触热阻。由于古建筑墙体木柱的墙壁面积与厚度之比很大,将其近似为一个无限大平壁,符合如下条件[17]。
∂∂x(λ∂T∂x)=ρc∂T∂t (7) 式中:ρ 为墙体的密度,kg/m3;c为墙体的比热容,J/(kg·℃);Tf为对流换热的流体温度,℃;h为表面换热系数,W/(m2·℃)。当时间t = 0时,T = T0;当x = 0时,∂T/∂x = 0;当 x = d时,∂T/∂x = h(T – Tf)。
![]() 图 3 墙内暗柱热传导示意图T0. 加热温度Heating temperature;δ1. 第一层墙厚度 First layer wall thickness;δ2. 第二层墙厚度/木柱直径 Second layer wall thickness/wood column diameter;δ2. 第三层墙厚度 Third layer wall thickness;q. 热流密度 Heat flux;h. 传热系数 Heat transfer coefficient;Tf. 流体温度 Fluid temperature;TP2. P2区域温度 P2 area temperature;TP3. P3区域温度 P3 area temperatureFigure 3. Heat conduction diagram of fully-concealed wood column in walls
图 3 墙内暗柱热传导示意图T0. 加热温度Heating temperature;δ1. 第一层墙厚度 First layer wall thickness;δ2. 第二层墙厚度/木柱直径 Second layer wall thickness/wood column diameter;δ2. 第三层墙厚度 Third layer wall thickness;q. 热流密度 Heat flux;h. 传热系数 Heat transfer coefficient;Tf. 流体温度 Fluid temperature;TP2. P2区域温度 P2 area temperature;TP3. P3区域温度 P3 area temperatureFigure 3. Heat conduction diagram of fully-concealed wood column in walls对于无缺陷的墙体传热,引入过余温度θ = T – Tf,则导热微分方程可表示为
∂θ∂t=α∂2θ∂X2 (8) 式中:当t = 0时, θ = θ0 = T – Tf ;Tf为环境流体温度,℃;α为热扩散率,α = λ/ρc。将数据进行无量纲化,F = θ/θ0作为替代后的无量纲温度变量,X = x/d作为替代后的无量纲坐标变量,从而得到
∂F∂(αt/d2)=∂2F∂X2 (9) 当t = 0时,F = F0 = 1;当X = 0时,∂F/∂X=0;当 X = 1时,∂F/∂X = hd·F/λ。
本研究涉及流体,傅里叶数为Fo = αt/d2,表示墙体热传导过程替代后的时间变量;毕渥数为Bi = hd/λ,表示墙体内部单位面积的热阻与表面处外部热阻之比,其中d为墙体厚度(特征长度)。从而得到无量纲化的温度变量F,F是傅里叶数Fo、毕渥数Bi和无量纲化后的坐标变量X的函数,可写为
F=g(Fo,Bi,X) (10) 假设木柱缺陷部位的墙体外表面温度为TP3,木柱无缺陷部位的墙体外表面温度为TP2,那么可以得到有木柱缺陷和无木柱缺陷部位墙体外表面的温度之差,即
ΔT=TP2−TP3 (11) 考虑到木柱环形套筒式缺陷和尺寸,即缺陷高度l、缺陷深度w与木柱直径δ2的作用,∆T可以表示为
ΔT=g(θ0,t,α,d,λ,h,l,w,δ2) (12) 式中:θ0为初始时刻的过余温度,℃;t为时间,s;α为热扩散率,m2/s;d为墙体厚度,m;λ为导热系数,W/(m·℃)或J/(m·℃·s);h为传热系数,J/(m2·℃·s);l为缺陷高度,m;w为缺陷深度,m;δ2为木柱直径,m。则基本量纲为s、℃、m、J。
依据量纲分析法基本原理—π定理,选择ΔT、t、λ和d这4个有量纲的物理量,则剩余物理量在所参与物理过程中的函数关系可表示为
π1=θ0ΔTα1ty1λz1dw1,π2=αΔTα2ty2λz2dw2,π3=hΔTα3ty3λz3dw3,π4=αΔTα4ty4λz4dw4,π5=wΔTα5ty5λz5dw5,π6=wΔTα6ty6λz6dw6 (13) 应用量纲和谐原理,各π项的指数为
A1=θ0ΔT,A2=αtd2,A3=hdλ,A4=ld,A5=wd,A6=δ2d (14) 则得到无量纲方程
ΔT=f(αtd2,hdλ,ld,wd,δ2d)⋅θ0 (15) 式中:傅里叶数αt/d2、毕渥数hd/λ为热力学参量,其大小跟温度环境与材料自身性质有关; θ0表示初始时刻的过余温度,与温度环境有关;直径δ2为定值。故缺陷高度l、缺陷深度w与为主要研究变量。利用热成像技术检测墙内暗柱的检测效果主要受到缺陷尺寸(即缺陷高度l、缺陷深度w)的影响。本理论分析将为后续试验组的设置和试验结果的分析提供依据。
2. 材料与方法
2.1 材 料
2.1.1 墙体模型
图4为试验用墙体模型及其尺寸。古建筑各部位和构件之间的比例关系构成了古建筑设计和施工的固定法则,《清式营造则例》[18]规定 “隔断墙,在柱之里外,每面加厚,按柱径四分之一,故墙厚合一柱径半”,即墙厚度为柱厚度的1.5倍。因为实际模型尺寸与质量较大,很难在实验室环境下加工放置与全面加热,故按清式带斗拱建筑檐柱尺寸中九等材的三分之一建造,木柱直径为130 mm,墙壁厚度为200 mm。
根据实地检测,发现墙体与木柱间有很小的空隙,几十至几百年间空隙中积累的碎土、灰尘等导致墙体与木柱间大部分相接触。故在墙体模型设计与建造中,在中心位置设置一个直径130 mm、高度500 mm的圆柱空洞,每次试验开始前将不同的木柱试件放入其中,木柱试件与墙体的配合状态为接触性过渡配合。
另外,古建筑墙体木柱往往设有“透风”,即通风口,起到空气交换、循环的作用。但长年累月的碎土、灰尘沉积使通风口空气流通受到很大的限制,通风口几乎失去作用,故设计试验模型时忽略了通风口因素。墙内暗柱模型尺寸如图4b所示。
在古建筑建造过程中,工匠将木柱底部与建造于地面上的柱础相接,以防木柱受潮腐蚀。为了最大程度地模拟实际情况,本研究在制造模型时,于底部构造了台基与墙体相连,此台基尺寸为500 mm(长) × 500 mm(宽) × 65 mm(厚),试验墙体模型如图4c所示。
2.1.2 木柱试件
结合参考文献与课题组现场检测经验,古建筑墙内暗柱缺陷主要发生在其下部,根部最严重,往上逐渐减轻。缺陷形式主要是木柱与墙壁接触表面的腐朽,以及由腐朽严重后形成的材料缺失,形状为三角形截面的环形套筒(图5a、b)。为便于试验开展,本研究选用北京古建筑木构件常见树种落叶松(Larix gmelinii)木材加工木柱试件,且用去除部分木材的形式模拟木柱缺陷,后文中提到的缺陷均为材料缺失缺陷。
![]() 图 5 木柱试件材料缺失缺陷及其分类示意图l. 缺陷高度 Defect height;w. 缺陷深度 Defect depth;δ2. 木柱直径 Wood column diameterFigure 5. Material deficiency defects and classification schematic diagram of wood column specimens
图 5 木柱试件材料缺失缺陷及其分类示意图l. 缺陷高度 Defect height;w. 缺陷深度 Defect depth;δ2. 木柱直径 Wood column diameterFigure 5. Material deficiency defects and classification schematic diagram of wood column specimens将落叶松木材自然风干,使用YM-50A含水率测试仪测得试件平均含水率约为8%。参照 GB/T 18000—1999《木材缺陷图谱》[19],沿顺纹方向对木材试件进行车削从而获得落叶松缺陷木柱。
为探究木柱材料缺失的缺陷尺寸对红外热成像检测效果的影响趋势,采用控制变量法,对不同缺陷高度l与缺陷深度w进行组合。缺陷木柱试件编号以DCl-w表示,l表示为缺陷高度编号,w表示为缺陷深度编号(图5e)。例如DC2-3表示缺陷高度200 mm、缺陷深度32.5 mm的缺陷木柱试件(图5c)。无缺陷木柱试件编号为DC0;缺陷木柱试件编号从DC1-1到DC4-4,共16组(表1)。
表 1 木柱试件几何参数表Table 1. Geometric parameters of defective woodcolumn specimen模型编号
Model No.缺陷高度
Defect height (l)/mm缺陷深度
Defect depth (w)/mmDC0 0 0 DC1-1 100 9.0 DC1-2 100 19.0 DC1-3 100 32.5 DC1-4 100 65.0 DC2-1 200 9.0 DC2-2 200 19.0 DC2-3 200 32.5 DC2-4 200 65.0 DC3-1 300 9.0 DC3-2 300 19.0 DC3-3 300 32.5 DC3-4 300 65.0 DC4-1 400 9.0 DC4-2 400 19.0 DC4-3 400 32.5 DC4-4 400 65.0 2.2 红外热成像检测方法
搭建墙体木柱缺陷红外热成像检测系统,主要构成如图6a所示。试验控制在室温(20 ± 0.5) ℃的环境下进行,试验前将墙体和检测系统提前48 h放置在室温为(20 ± 0.5)℃的室内静置。实验室环境光线会影响结果的准确性,为了减少光照对本试验的影响,本试验在暗室内进行,并使用遮光布完全遮盖住检测系统。为保证加热的均匀性,基于GB/T 10295—2008《绝热稳态传热性质的测定标定和防护热箱法》[20]设计均匀热激振装置。该装置通过恒定温度接触式电加热层发热,接触式电加热层外侧填充保温隔热材料,通过紧贴的铝板将热激振均匀传导到墙体加热面。
![]() 图 6 红外热成像检测系统和结果示意图1. 电脑(1.1 Smartview4.3所得红外热成像图像,1.2 透视变换、中值滤波,1.3时序排列) Computer (1.1 Infrared thermal imaging images obtained by Smartview4.3, 1.2 Perspective transformation, median filtering, 1.3 Timing arrangement);2. 红外热像仪Infrared thermal imager;3. 墙内暗柱模型Fully-concealed wood column in walls;4. 均匀热激励装置(4.1自热式工业电加热装置,4.2保温后盖,4.3支撑桁架,4.4铝板)Uniform thermal excitation device (4.1 Thermal industrial electric heating device, 4.2 Thermal insulation back cover, 4.3 Support truss, 4.4 Aluminum plate)Figure 6. Infrared thermal imaging detection system and result diagram
图 6 红外热成像检测系统和结果示意图1. 电脑(1.1 Smartview4.3所得红外热成像图像,1.2 透视变换、中值滤波,1.3时序排列) Computer (1.1 Infrared thermal imaging images obtained by Smartview4.3, 1.2 Perspective transformation, median filtering, 1.3 Timing arrangement);2. 红外热像仪Infrared thermal imager;3. 墙内暗柱模型Fully-concealed wood column in walls;4. 均匀热激励装置(4.1自热式工业电加热装置,4.2保温后盖,4.3支撑桁架,4.4铝板)Uniform thermal excitation device (4.1 Thermal industrial electric heating device, 4.2 Thermal insulation back cover, 4.3 Support truss, 4.4 Aluminum plate)Figure 6. Infrared thermal imaging detection system and result diagram采用Fluke Ti55红外热成像仪拍摄红外热图,热像仪探测类型为320 × 240像素的焦平面阵列,带有25 μm间距的Vanadium Oxide非制冷微量热型探测器,其捕获光谱带为8 ~ 14 µm,温度测量量程为−20 ~ 350 ℃,能满足实验所需精度。拍摄时将红外热像仪放置于距离墙体模型2 m处,设置电加热装置温度为70 ℃,加热时间为24 h,墙体表面发射率为0.9,采集观测表面红外热图的频率为每小时一张,使用Elitech BT-3型温度计进行室温的检测并记录。
选择拍摄墙内暗柱墙壁的4个直角点进行透视变换,获得的正视图的热图序列混有随机噪声与图像信息,采用中值滤波的方法去除(图6a的1.2)。然后将红外热图按照时间顺序排列(图6a的1.3),获得连续热图序列(以试件DC2-3为例,图6b)。最后,对采集到的非稳态、稳态温度数据进行数据分析。
3. 结果与分析
以图6b所示的木柱试件DC2-3试验红外热图为例,自加热第6小时起,纯墙体区域P1与木柱区域P2、P3的温度存在显著差异,纯墙体区域温度高于木柱区域表面,即木柱区域颜色更浅。这是因为在传热方向上木柱的传热系数远小于墙体,相比纯墙体,包含木柱的墙体热阻更大,传热能力更弱。在其他木柱试件的红外热图上,均有相似的现象。另外,由图6b还可观察到墙体底部存在一个热流相对密集、温度较低的热桥[21]区域,这是由台基吸热造成的。
从图6b中同时可以发现:完整木柱区域P2与缺陷木柱区域P3的温度在加热过程中也存在差异,自加热第4小时开始,P3区域的温度大于P2区域的温度,即缺陷木柱区域颜色比完整木柱区域更深。从热传导的角度,这种现象可以解释为:在加热初期,由于墙体较厚,传导、辐射、对流所传递的热量无法在观测面上体现出来,此时各区域温度一致;加热中后期,P3区域木柱缺陷处存在的热辐射与热对流现象,增强了热量对墙体的穿透力,造成缺陷木柱区域P3墙体外表面温度高于非缺陷区域P2。由此可以得出,红外热成像检测技术可以对墙内暗柱材料缺失缺陷进行检测。
图7为DC2-3不同区域的中点位置温度变化图。当墙体加热20 ~ 24 h时,墙体表面的温度增长率不足5%,并长期维持稳定。此时墙体内部的物理量在一段时间内保持稳定,或者变化缓慢,因此可以认为此时墙体已经达到稳态热传导。而0 ~ 20 h时,其内部物理量在持续变化,因此被认为是墙体的非稳态热传导阶段。
![]() 图 7 DC2-3不同区域的中点位置温度变化图Figure 7. Temperature change diagram of midpoint in different regions of DC2-3
图 7 DC2-3不同区域的中点位置温度变化图Figure 7. Temperature change diagram of midpoint in different regions of DC2-3加热20 ~ 24 h的P3温度大于P2温度,验证了1.2.1节的理论分析。式(5)、(6)所体现的理论结果也可用于无透风口情况下墙内暗柱位置的判断。
3.1 稳态下红外热图分析
3.1.1 缺陷高度对热成像影响
图8分别为稳态下木柱试件DC0、DC1-4、DC2-4、DC3-4、DC4-4的红外热图。结果为固定变量重复验证试验所得,结果显示:DC0木柱区域P2的温度由上至下逐渐减少,DC1-4缺陷区域P3的温度与完整木柱区域P2温度基本一致,DC2-4、DC3-4、DC4-4上的缺陷区域P3颜色比非缺陷区域P2颜色更深,即温度更高。随着木柱缺陷高度l的增加,温度分布形状由原先的“1 1”型逐渐转变为“U”型,而且底部缺陷高温区域随着缺陷高度l的增加而逐渐增大。这意味着随着缺陷高度的增加,缺陷的温度影响范围扩大了,根据热成像所得的缺陷温度影响范围判断墙内暗柱内的缺陷高度l是可能的。
3.1.2 缺陷深度对热成像影响
图9分别为稳态下木柱试件DC0、DC3-1、DC3-2、DC3-3、DC3-4的红外热图。结果为固定变量重复验证试验所得,结果显示:DC0木柱区域P2的温度由上至下逐渐减少,DC3-1缺陷区域P3的温度与完整木柱区域P2的温度近乎一致,DC3-2、DC3-3、DC3-4的P3区域温度高于P2区域温度。随着缺陷深度w的增加,温度分布形状由原先的“1 1”型逐渐转变为“U”型,且缺陷区域P3的颜色逐渐变深,温度变高,但缺陷的影响范围几乎没有变化。这表明根据热成像所得的缺陷温度值判断墙体木柱的缺陷深度w也是可能的。
综合试验结果看,当缺陷深度小于等于9 mm,缺陷高度小于等于100 mm时,无法观测到木柱缺陷所导致的观测面温度变化。这可能是因为:(1)缺陷尺寸小,缺陷内部空气量少,存在的热辐射和热对流现象弱;(2)墙体模型底部台基吸收了缺陷处所堆积的热量。
通过试验结果可以发现:不同缺陷尺寸模型下的试验现象差异主要体现在完整木柱区域与缺陷木柱区域的温度差异,缺陷高度l、缺陷深度w可以影响热成像的检测结果。这也验证了1.2.2节的理论分析。
3.2 稳态下温度对比度分析
基于上述结论,提出稳态下墙壁区域与木柱区域之间温度对比度[22]这一概念,以此进一步分析缺陷高度与深度。从上至下提取木柱中线上温度,标记为Tm;从上至下提取中线两侧距离125 mm处的温度,左侧的温度线标记为Ml,右侧的温度线标记为M2。根据式(16)将同一高度下的Ml与M2平均,并与Tm作差,得到温度对比度ΔC。
ΔC=M1+M22−Tm (16) 3.2.1 缺陷高度对温度对比度的影响
图10为不同缺陷深度w下,缺陷高度l对温度对比度的影响。图10a展示了缺陷深度为9 mm时,通过改变缺陷高度所得的温度对比度折线图。从图中可以看出:在区间范围内,折线趋势基本趋于一致。证明在这一较小缺陷深度下缺陷高度对温度对比度的影响不明显,这与3.1.1结论一致。从图10b、c、d的虚线位置可以看出:温度对比度分别在缺陷高度约为100、200、300、400 mm时迅速降低至同一位置,并且随着缺陷深度的增大这种情况越发的明显。木柱高度尺度上的缺失缺陷只能改变其温度对比度变化的相应位置,但无法改变其底部区域所对应的温度对比度的值。
3.2.2 缺陷深度对温度对比度的影响
图11为处理所得的温度对比度,固定缺陷的高度改变缺陷深度进行分组的结果。图11a为缺陷高度100 mm时,改变缺陷深度所得的温度对比度折线图。从图中可以看出:在0 ~ 500 mm范围内,其折线趋势基本趋于一致。可以得到结论:过小的缺陷深度并不能改变其温度对比度的大致趋势,这与3.1.2结论一致。图11b、c、d分别为缺陷高度200、300、400 mm时,改变缺陷深度所得的温度对比度折线图,在缺陷区间P3内,随着缺陷深度的逐渐增加,其温度对比度下降趋势由缓变快,在非缺陷区域P2内,温度对比度的变化趋势趋于一致。缺陷深度的改变无法影响温度对比度降低时的位置,但可以改变温度对比度的最低温度。
综上所述,木柱高度尺度上的缺陷只能改变其温度变化的相应位置,深度尺度上的缺陷可以改变温度对比度的最低值。同时,研究结果表明红外热成像在检测缺陷时存在一定的限制,即无法有效检测缺陷高度与缺陷深度过小的墙内暗柱缺陷。
为了更具体地说明单一变量对温度对比度的影响,通过计算温度对比度的积分值,可以得出一个量化的结果,用于描述整体的温度变化情况。在本研究中,木柱的缺陷程度越大,其温度对比度的下降趋势越明显,积分值越小。使用离散点积分公式,对温度对比度进行积分(式18),得到的温度对比度积分如表2所示。
表 2 各缺陷尺寸的温度对比度积分Table 2. Temperature contrast integral foreach defect size缺陷高度
Defect height/mm缺陷深度 Defect depth/mm 9.0 19.0 32.5 65.0 100 676.44 652.41 636.22 621.68 200 696.33 666.96 596.57 495.85 300 685.92 582.95 502.53 404.21 400 615.91 500.73 385.24 287.24 S=∫xnx1f(x)dx≈12∑n−1i=1(xi+1−xi)[f(xi+1)+f(xi)] (17) 图12 显示了单一变量与温度对比度积分间的关联性,缺陷高度l或深度w越大,其温度对比度积分值越小。由上文可知,温度对比度对过小的缺陷高度和缺陷深度都不敏感,因此去除缺陷深度9 mm、缺陷高度100 mm的情况,得到较大的缺陷高度、深度与温度对比度积分值之间呈较高的负相关性。其中,当l ≥ 200 mm时,缺陷高度与温度对比度积分的决定系数 > 0.826;当w ≥ 19 mm时,缺陷深度与温度对比度积分的决定系数 > 0.993。
![]() 图 12 单一变量与温度对比度积分间的关联性Figure 12. Correlation between single variable and temperature contrast integral
图 12 单一变量与温度对比度积分间的关联性Figure 12. Correlation between single variable and temperature contrast integral3.3 非稳态下红外热图分析
根据红外热图所观测到的墙壁表面温度场分布情况,从上至下提取木柱中线上的温度,标记为Tm(图13)。试验无法实现理想中的一维传热,故在260 ~ 500 mm范围内会产生温度的降低;降至低值时,由于材料缺失缺陷导致热量滞留在底部,故在150 ~ 260 mm范围内会产生温度的抬升;最后因为底部台基传热的影响,在0 ~ 150 mm范围内温度急剧降低。规定距底部距离0 ~ 500 mm的第一次温度最低值为Tmin,最高值为 Tmax,Tmax与Tmin作差得到温差ΔT[23]。
3.3.1 最佳观测时间分析
以DC2-2为例,根据其中线温度得到非稳态温度差ΔT(表3),可以观察到温差ΔT在加热4 ~ 6 h达到最大值;随着加热时间增加,ΔT的值先增大后减小。这可能是由于在加热初期,由于墙体较厚,传导、辐射、对流所传递的热量无法在观测面上体现出来,此时各区域温度一致,ΔT接近0;加热中期,P3区域存在的热辐射与热对流能量大于P2区域热传导的能量,因此这一阶段内P3的表面温度高于非缺陷区域P2的表面温度,ΔT增大;加热后期,热辐射所传递的热量要小于固体传热的热量,故ΔT为0。结合本研究实际条件,墙体温度随着室外光照、空气温度的变化而做周期性变化,检测时间越短,影响结果的程度越小。故选择最佳检测时刻[24]为加热第4小时。
表 3 DC2-2各时刻非稳态温度差(ΔT)Table 3. Unsteady temperature difference (ΔT) of DC2-2 at each time加热时间
Heating time/hΔT/℃ 加热时间
Heating time/hΔT/℃ 0 ~ 2 0 ~ 0.049 12 ~ 14 0.069 ~ 0.257 2 ~ 4 0.049 ~ 0.445 14 ~ 16 0.069 ~ 0.074 4 ~ 6 0.445 ~ 0.544 16 ~ 18 0 6 ~ 8 0.381 ~ 0.544 18 ~ 20 0 8 ~ 10 0.356 ~ 0.381 20 ~ 22 0 10 ~ 12 0.257 ~ 0.356 22 ~ 24 0 3.3.2 缺陷尺寸与加热第4小时温差间的定量关系
表4为各缺陷尺寸的非稳态温度差ΔT对照表,由该表数据可得到不同缺陷尺寸与非稳态温度差ΔT之间的关系。不同缺陷深度的工况下,木柱缺陷高度与表面温差最大值的关系曲线如图14a所示,从中可以看出:每个缺陷深度下,缺陷高度不断增加,表面最大温差均不断增大,两者间呈现极强的正相关性(R2 ≥ 0.964,排除掉DC l-1情况),且当高度增大时,这种正相关性表现得越明显即斜率绝对值增大。在不同缺陷高度的工况下,缺陷深度与表面温差最大值的关系曲线如图14b所示,图中可以看出:相同缺陷高度下,随缺陷深度增加,表面最大温差先迅速增加后缓慢增加,符合二次函数曲线分布,两者间呈现极强的正相关性(R2 ≥ 0.951),当缺陷高度增大时,这种正相关性表现的愈发明显,即斜率的绝对值增大。缺陷尺寸与加热第4小时温差间极强的正相关性,也是对1.2.2理论分析的一个验证。
表 4 加热第4小时各缺陷尺寸的非稳态温度差对照表Table 4. Comparison table of unsteady temperature difference for each defect size at the 4th h of heating℃ 缺陷高度
Defect height/mm缺陷深度 Defect depth/mm 9 19 32.5 65 100 0 0.178 0.219 0.374 200 0 0.356 0.470 0.594 300 0 0.471 0.831 0.861 400 0.277 0.625 0.938 1.170 ![]() 图 14 单一变量与非稳态温差(ΔT)间的关联性Figure 14. Correlations between single variable and unsteady temperature difference (ΔT)
图 14 单一变量与非稳态温差(ΔT)间的关联性Figure 14. Correlations between single variable and unsteady temperature difference (ΔT)当缺陷高度为100、200、300 mm,缺陷深度为 9 mm 时,最大表面温差为 0 ℃ 。经研究,最大表面温差为 0 ℃的原因为缺失缺陷处深度较小,该区域接受到的热辐射总量有限,热辐射在传递的过程中损耗严重;缺陷内部存在的空气介质较少,影响对流传热的程度;底部热桥热传导性能明显高于周围正常部位,影响温度正常传递,因此产生的温度差异并不明显。
绘制不同缺失缺陷尺寸下的非稳态温差热力图,图15为不同缺陷高度与缺陷深度所对应的温差热力图,图中可以看出温差随着缺陷高度与缺陷深度的增加而增大。在缺陷深度为9 mm处,温差温度为0 ~ 0.234 ℃,很难被检测到;在缺陷深度为65 mm处,温差温度为0.234 ~ 1.170 ℃,可以被检测到。因此红外热成像技术可以用于墙内暗柱较大缺陷的温差温度检测。利用热力图可以判断加热第4小时非稳态温差ΔT所对应的缺陷尺寸,实现缺陷的预估。
![]() 图 15 缺陷程度的非稳态温差热图Figure 15. Heat map of unsteady temperature difference of defect degree
图 15 缺陷程度的非稳态温差热图Figure 15. Heat map of unsteady temperature difference of defect degree4. 结 论
材料缺失是古建筑墙内暗柱因严重腐朽导致的一种常见缺陷形式,本研究在从理论角度探讨红外检测墙内暗柱材料缺失状况机理的基础上,试验研究了木柱试件不同尺寸的材料缺失缺陷对墙体热传导和红外图像的影响,得到以下主要结论。
(1)理论研究表明:由于木材的横向导热系数远小于墙体导热系数,加热面加热温度相同的情况下,木柱墙体外表面所对应的温度偏低;墙内暗柱的检测效果主要受到材料缺失缺陷尺寸,即缺陷高度、缺陷深度的影响。
(2)试验结果表明:在墙体内外热传导稳态状态下,内含木柱处的墙体表面温度要低于不含木柱的墙体表面温度,即前者的红外图像颜色更浅;木柱材料缺失缺陷的存在会使缺陷处墙体外表面温度变高,红外图像颜色变深;木柱缺陷高度越大,缺陷导致的高温范围越大;木柱缺陷深度越大,缺陷区域温度值越高。
(3)在墙体内外热传导非稳态状态下,选择木柱中线温差ΔT最大的时刻,可知木柱中线温差ΔT与木柱缺陷高度(R2≥ 0.964)、深度(R2 ≥ 0.951)呈现极强的正相关性。
(4)在木柱试件缺陷高度不大于100 mm,深度不大于9 mm等较小缺陷情况下,墙体表面红外图像和温度不因缺陷的存在而发生明显改变,所以红外热成像可以用于古建筑墙内暗柱较大缺陷的筛查与大致评估,不能进行墙内暗柱缺陷的精确检查。
本研究成果显示了基于红外热成像无损筛查古建筑墙面暗柱缺陷这一新思路的可能性,但距离实际应用还有许多研究工作需要去做。下一步会将检测对象由材料缺失扩展到木柱一般性腐朽缺陷,以及研究实际检测环境与实验室环境差别的影响等。
-
![]()
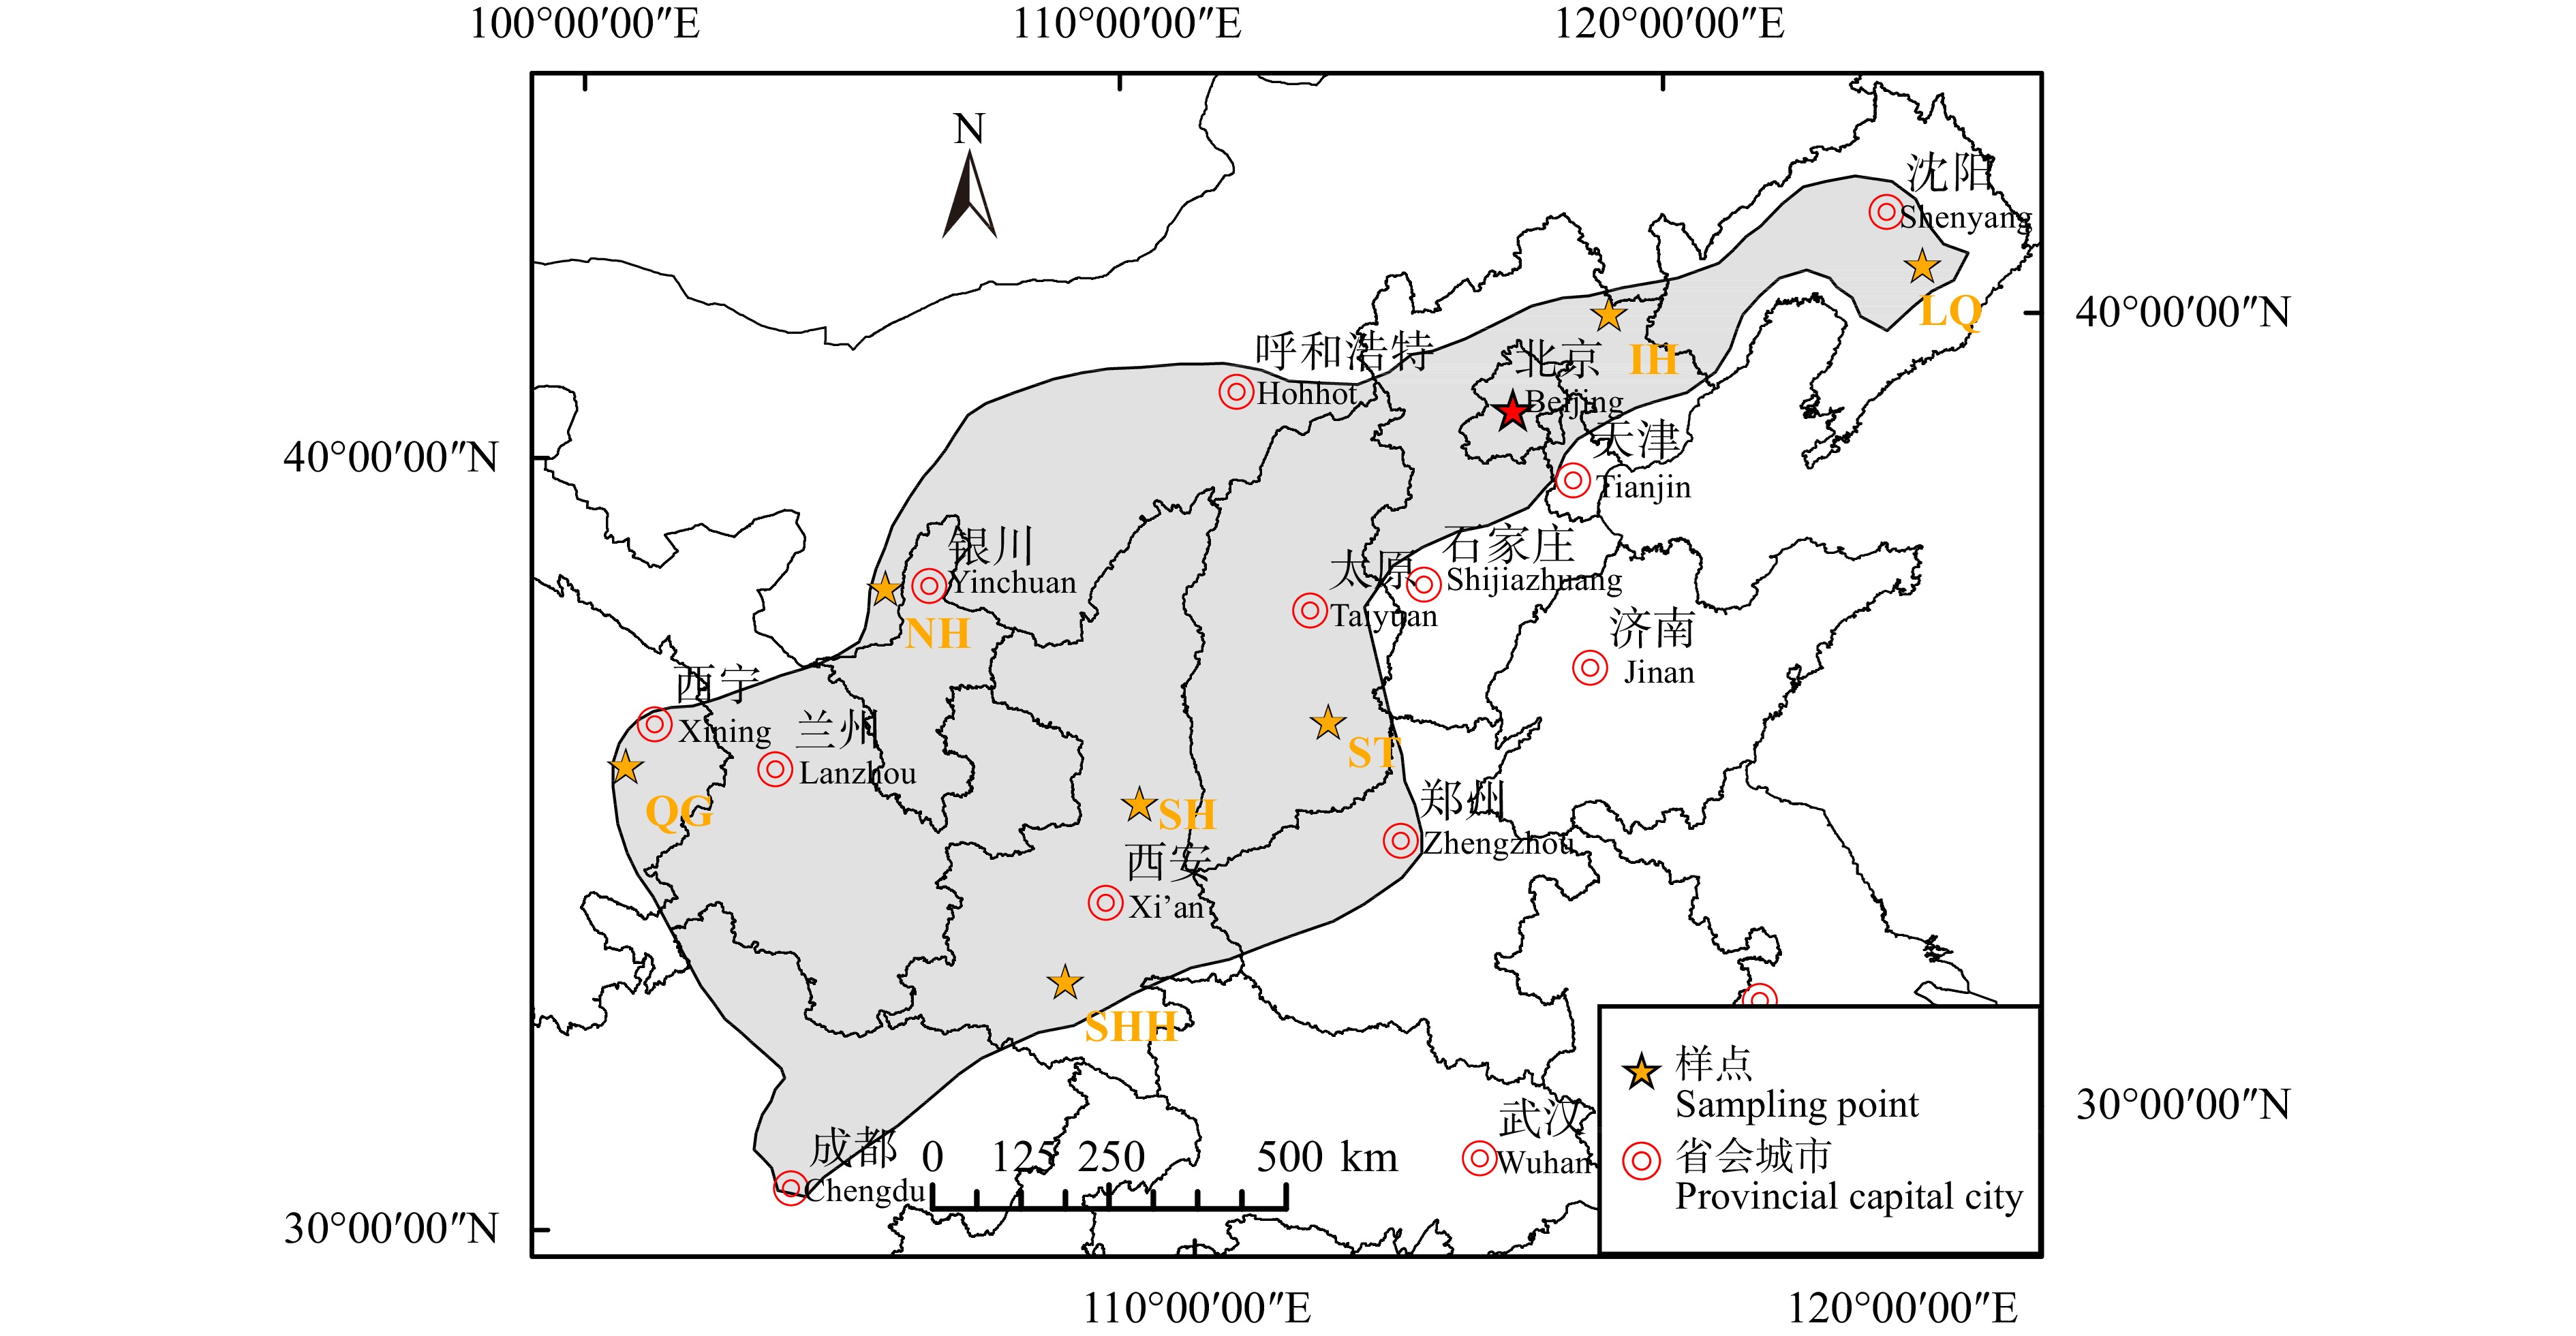
图 1 天然油松林的分布区及样点空间分布
LQ.辽宁千山;IH.内蒙古黑里河;SH.陕西黄龙;ST.山西太岳山;SHH.陕西火地塘;QG.青海贵德;NH.宁夏贺兰山。下同。LQ, Liaoning Qianshan; IH, Inner Mongolia Heili Rever; SH, Shaanxi Huanglong; ST, Shanxi Taiyue Mountains; SHH, Shaanxi Huoditang; QG, Qinghai Guide; NH, Ningxia Helan Mountains. The same below.
Figure 1. Distribution area and spatial distribution of natural P. tabulIformis forests
![]()
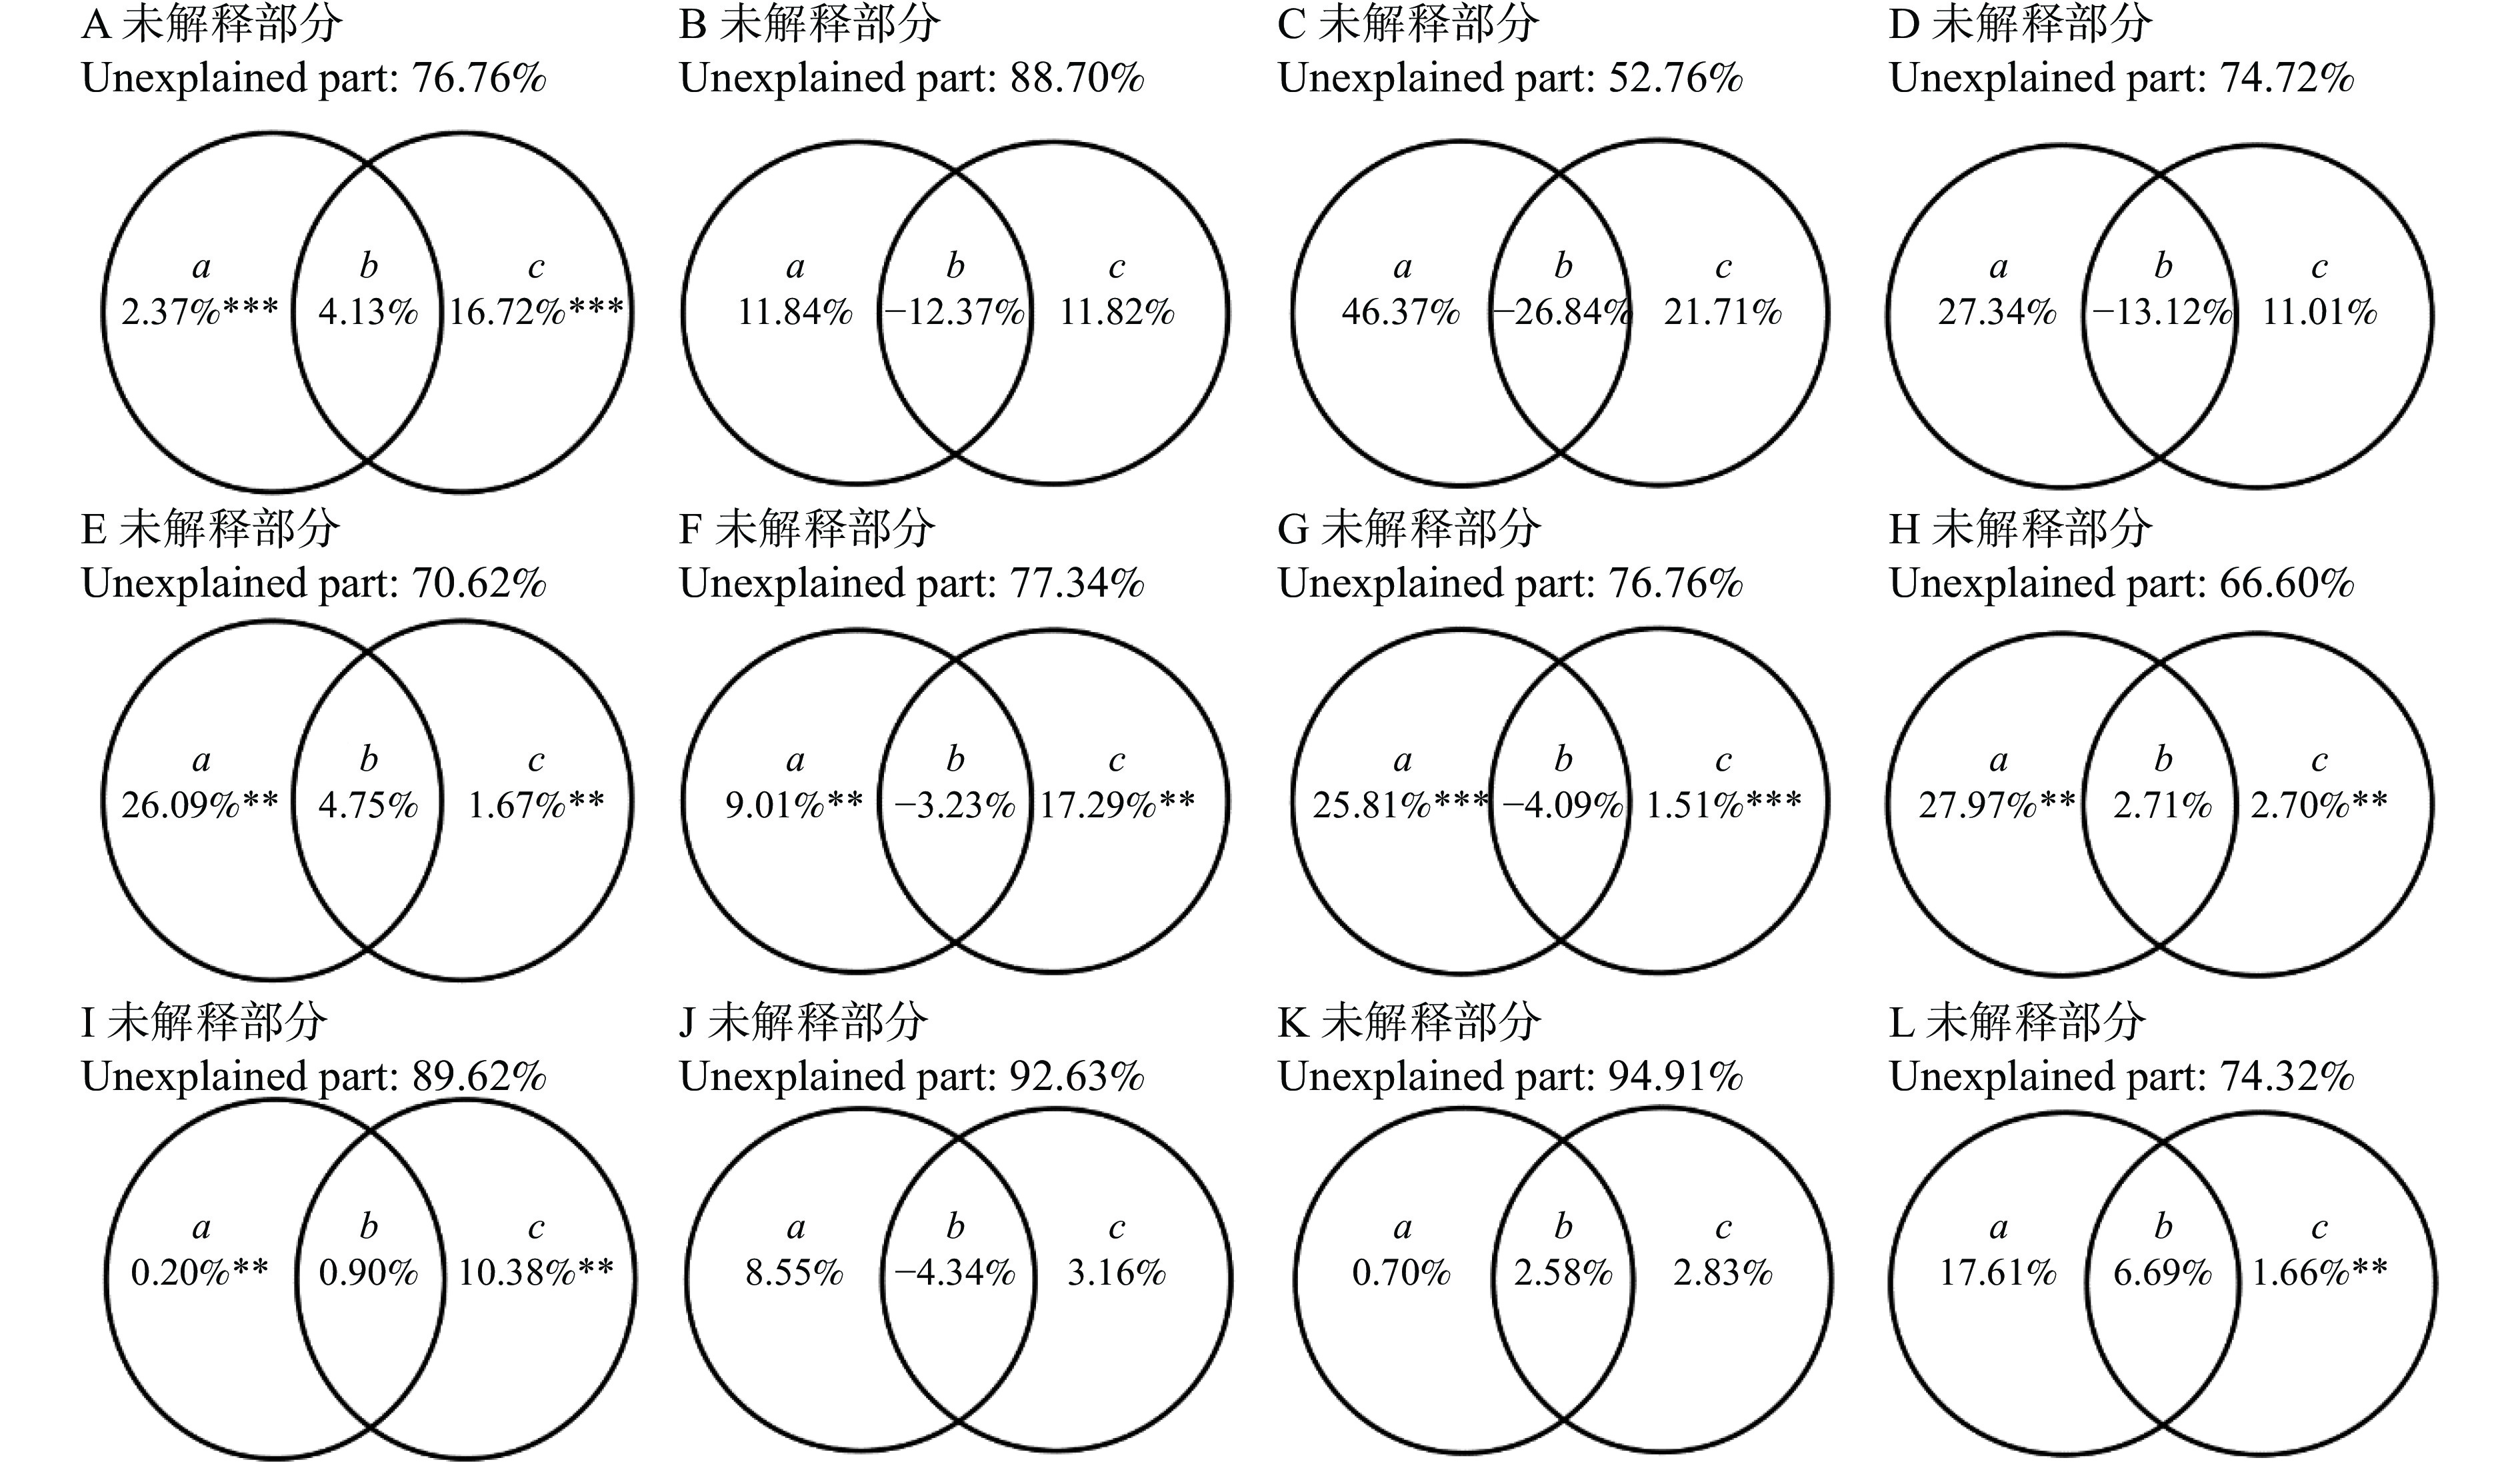
图 2 气候和土壤因子对油松叶、枝、根的氮、磷含量影响的方差分解图
A.当年生叶氮;B.当年生叶磷;C.当年生枝氮;D.当年生枝磷;E.多年生叶氮;F.多年生叶磷;G.多年生枝氮;H.多年生枝磷;I.吸收根氮;J.吸收根磷;K.次生根氮;L.次生根磷。a和c分别为气候和土壤的单独解释力,b为两者的协同作用。采用F检验对a、c的显著性进行检验。***表示 P < 0.001;**表示P < 0.01;*表示P < 0.05。下同。A, annual leaf N; B, annual leaf P; C, annual branch N; D, annual branch P; E, perennial leaf N; F, perennial leaf P; G, perennial branch N; H, perennial branch P; I, absorbing root N; J, absorbing root P; K, secondary root N; L, secondary root P. a and c are the pure effects of climate and soil, respectively; b is their synergistic effects. The significances of a and c are evaluated with F test. *** means P < 0.001; ** means P < 0.01; * means P < 0.05. The same below.
Figure 2. Variation partitioning analysis of the effects of climate and soil factors on nitrogen and phosphorus content in leaves, branches, and roots of P. tabuliformis
![]()
图 3 气候和土壤因子对油松叶、枝、根氮磷比的影响的方差分解图
A.当年生叶;B.当年生枝;C.多年生叶;D.多年生枝;E.吸收根;F.次生根。A, annual leaf; B, annual branch; C, perennial leaf ; D, perennial branch; E, absorbing root; F, secondary root.
Figure 3. Variation partitioning analysis of the effects of climate and soil factors on the ratio of nitrogen and phosphorus in leaves, branches, and roots of P. tabuliformis
![]()
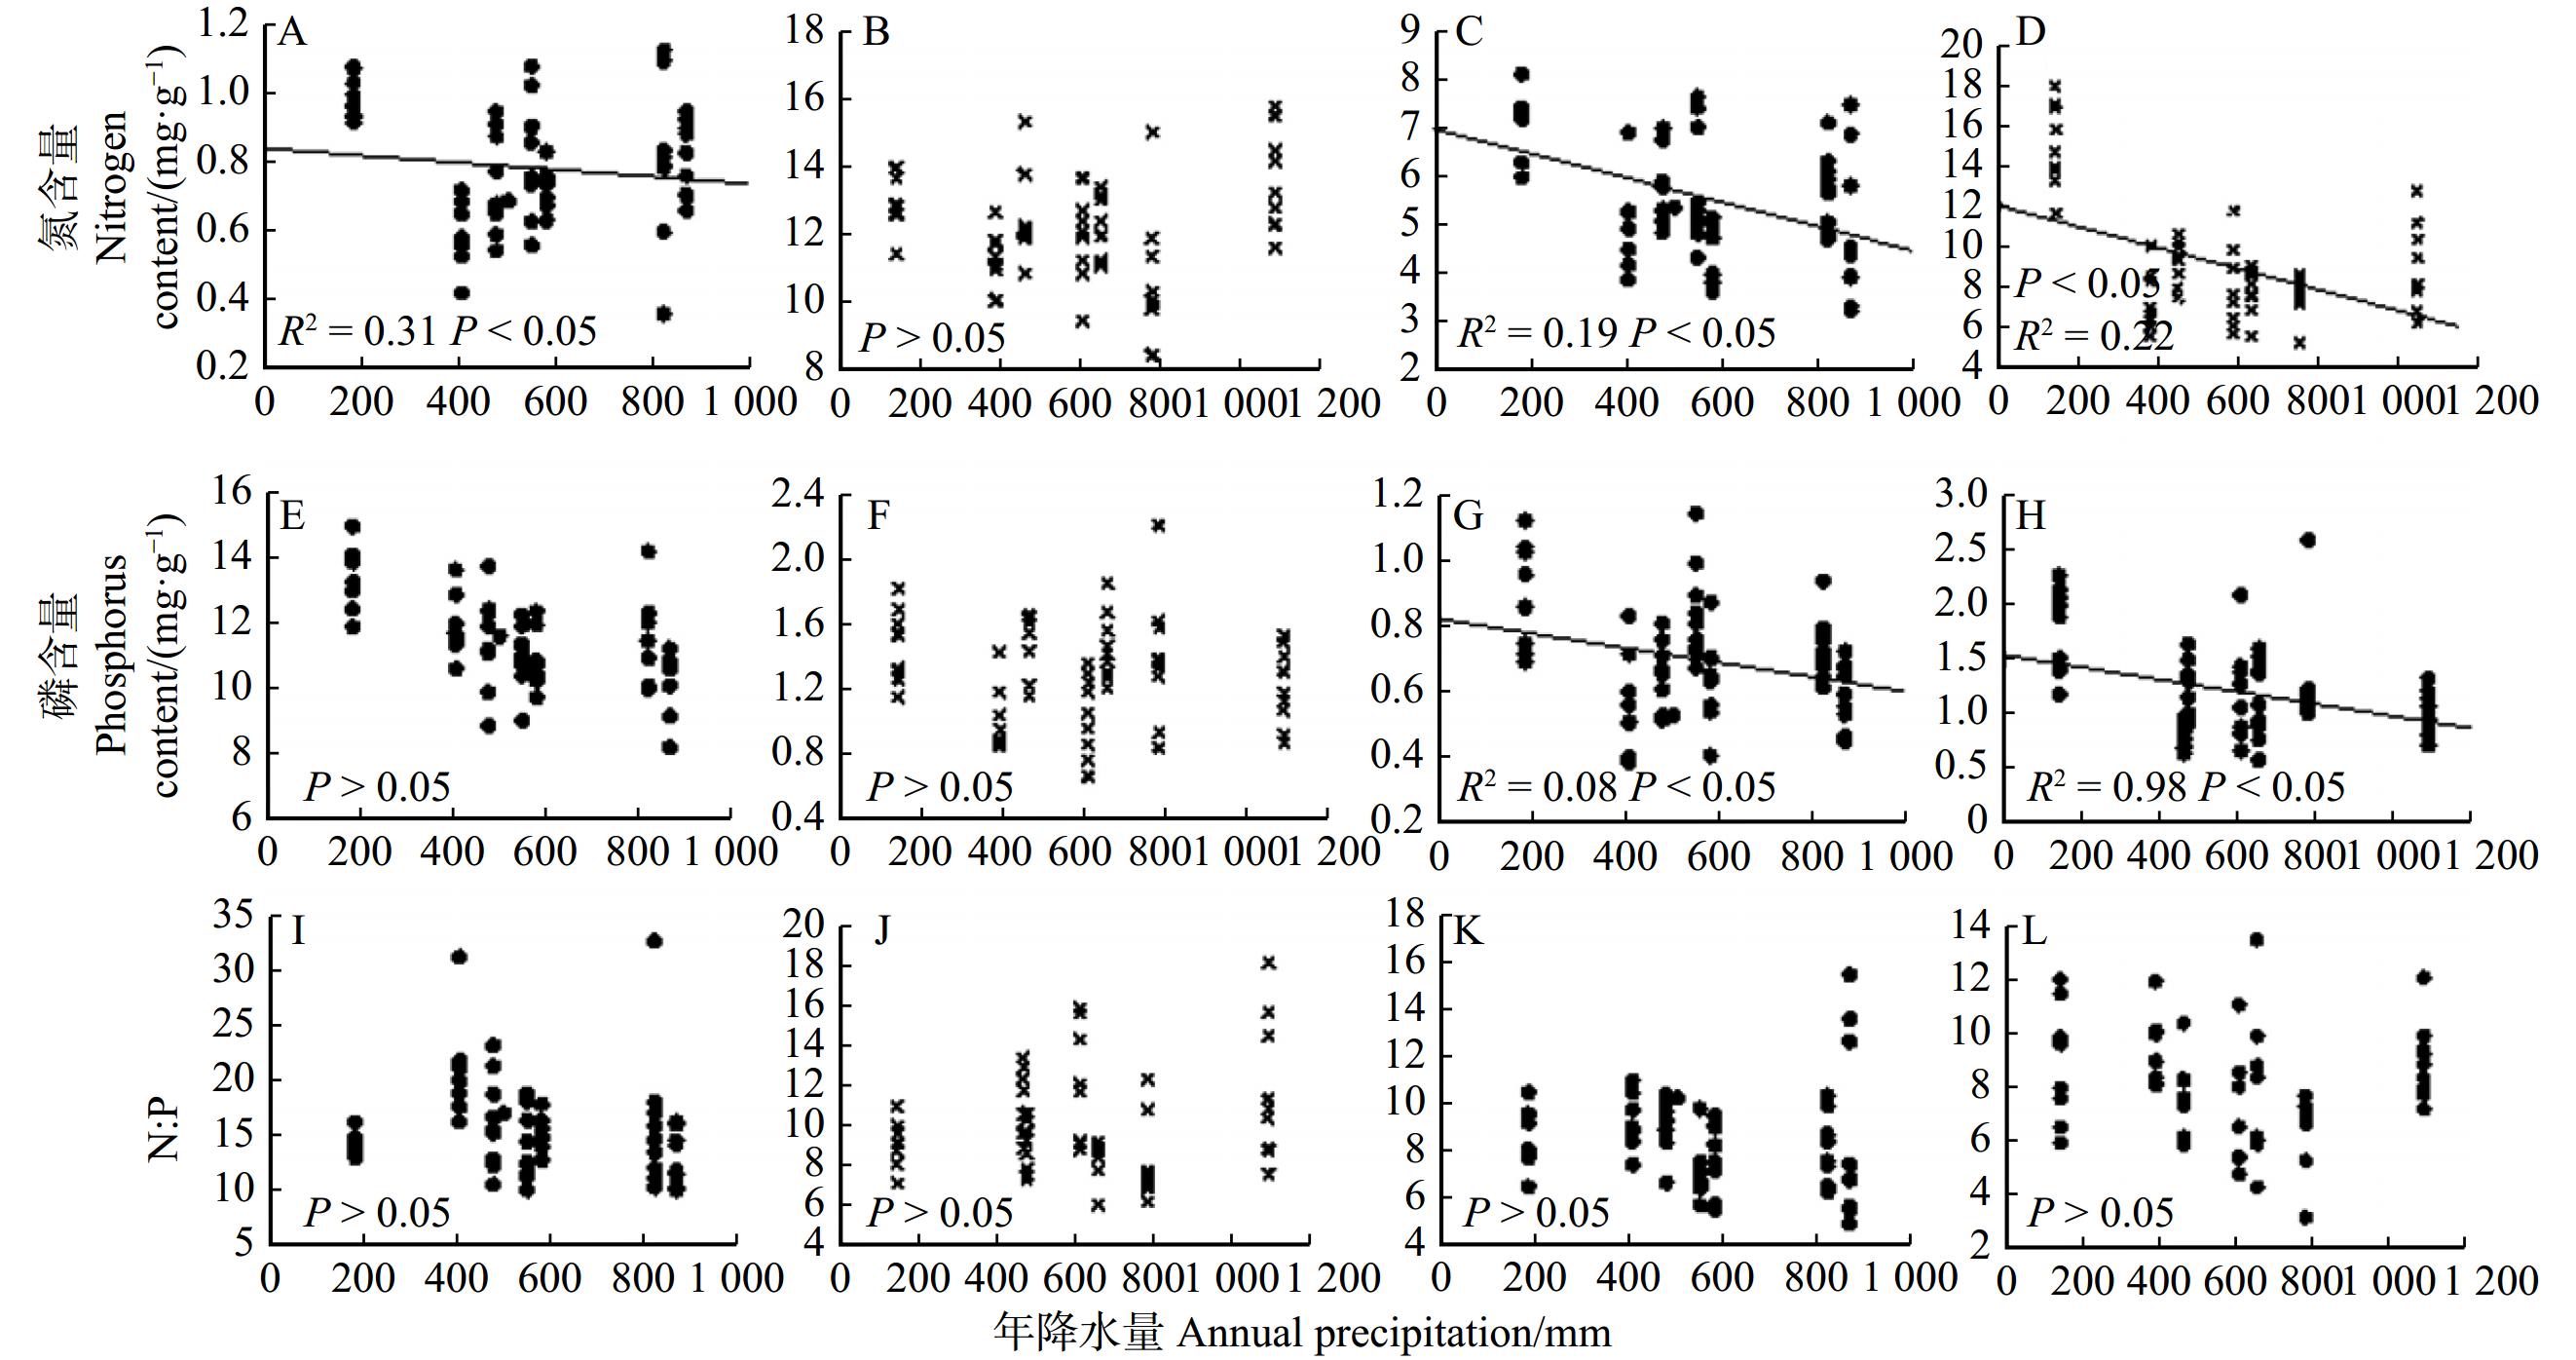
图 4 油松叶、枝氮、磷含量随降水的变化
A、E、I.多年生叶;B、F、J.当年生叶; C、G、K.多年生枝;D、H、L.当年生枝。A, E and I, perennial leaves; B, F and J, annual leaves; C, G and K, perennial branches; D, H and L, annual branches.
Figure 4. Changes of nitrogen and phosphorus contents in leaves and branches of P. tabuliformis with precipitation
![]()
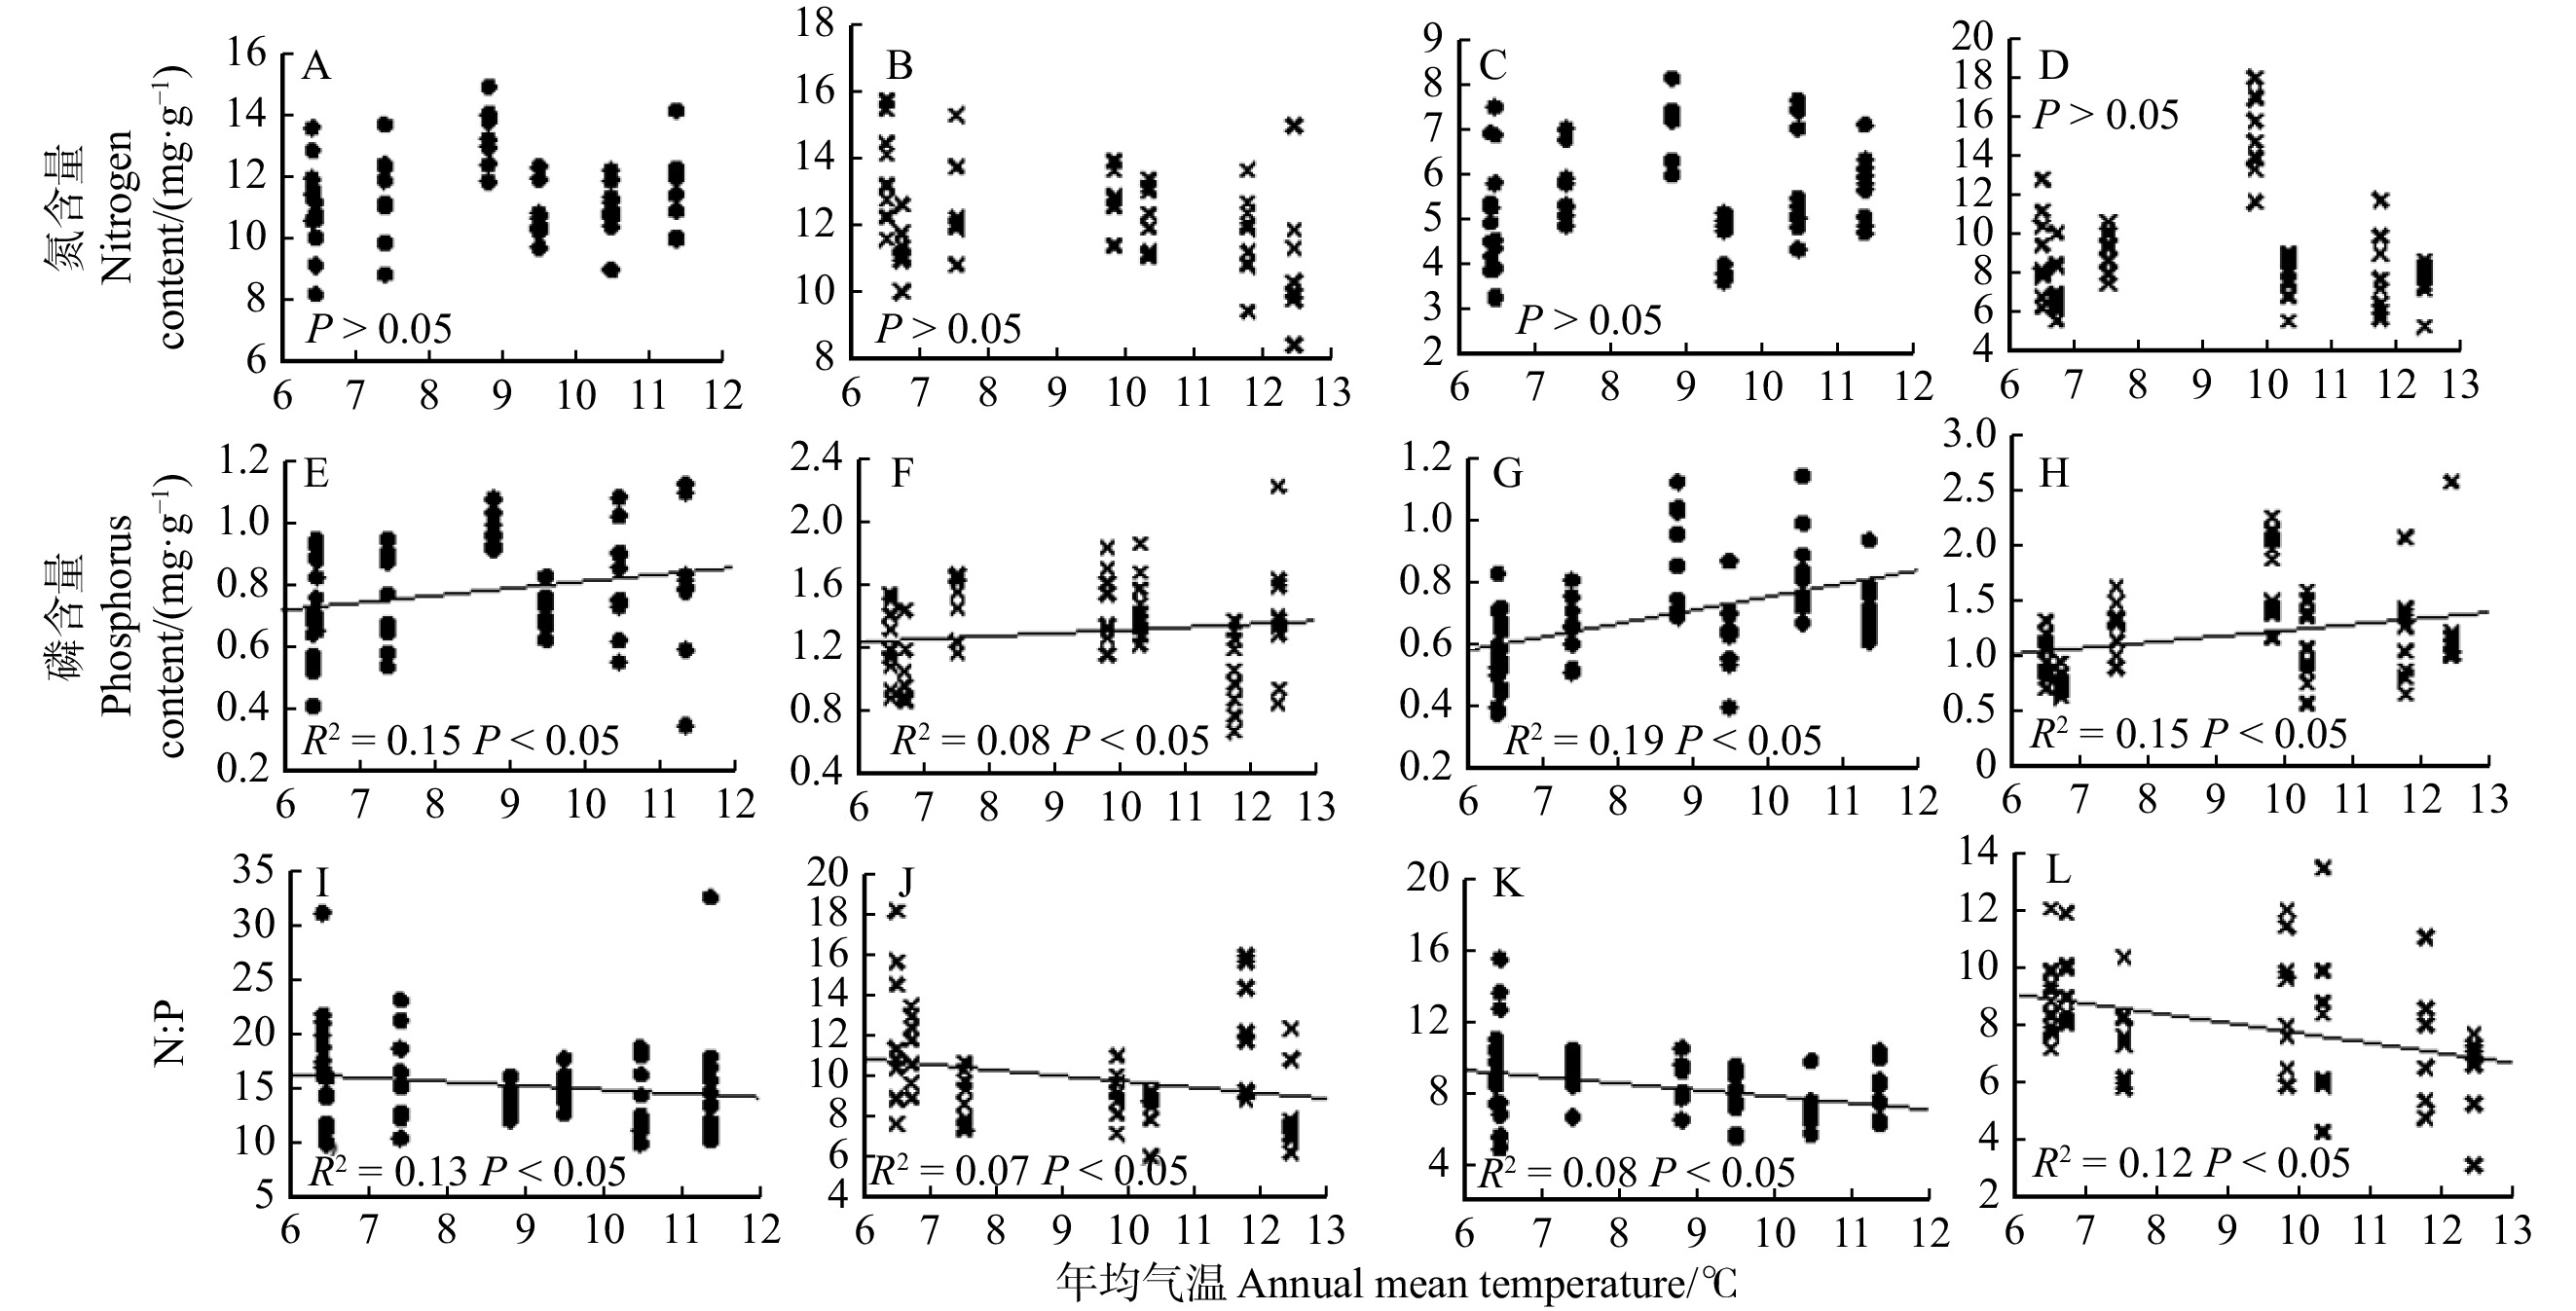
图 5 油松叶和枝氮、磷含量随温度的变化
A、E、I.多年生叶;B、F、J.当年生叶; C、G、K.多年生枝;D、H、L.当年生枝。A, E and I, perennial leaves; B, F and J, annual leaves; C, G and K, perennial branches; D, H and L, annual branches.
Figure 5. Changes of nitrogen and phosphorus contents in leaves and branches of P. tabuliformis with temperature
表 1 研究地区自然状况
Table 1 Natural situation of study region
研究地点
Study site经度
Longitude纬度
Latitude海拔
Altitude/m年降水量
Annual
precipitation/
mm年均温度
Annual mean
temperature/℃前一年年
降水量
Annual precipitation
of the previous
year/mm前一年年均温度
Annual mean
temperature of
the previous year/℃土壤氮含量
Soil nitrogen
content/
(mg·g−1)土壤磷含量
Soil phosphorus
content/
(mg·g−1)LQ 123°08′E 40°00′N 260 872 6.45 1 092 6.50 11.05 4.50 IH 118°28′E 41°21′N 1 138 479 7.40 464 7.53 18.98 3.34 SH 109°57′E 35°52′N 1 190 552 10.48 609 11.77 19.84 6.04 ST 112°07′E 36°39′N 1 496 583 9.50 656 10.33 22.98 5.80 SHH 108°28′E 33°26′N 1 643 825 11.09 783 12.45 22.54 5.09 QG 101°36′E 36°05′N 2 804 407 6.40 391 6.72 48.84 2.08 NH 105°55′E 38°44′N 2 131 184 8.81 142 9.82 24.54 4.59  下载: 导出CSV
表 2 不同地区油松叶、枝、根氮磷化学计量特征比较
Table 2 Comparison of stoichiometric characteristics of nitrogen and phosphorus in leaves, branches and roots of P. tabuliformis from different regions
性状
Trait器官
Organ类型
TypeNH/
(mg·g−1)IH/
(mg·g−1)QG/
(mg·g−1)SH/
(mg·g−1)ST/
(mg·g−1)SHH/
(mg·g−1)LQ/
(mg·g−1)平均
Mean/
(mg·g−1)变异率
Mutation
rate/%F 最小值
Min. value/
(mg·g−1)最大值
Max. value/
(mg·g−1)氮含量
Nitrogen
content叶
Leaf多年生
Perennial13.38 ± 0.94a 11.34 ± 1.45b 11.81 ± 0.89b 10.90 ± 0.94ab 10.72 ± 0.84ab 11.49 ± 1.27b 10.11 ± 0.95a 11.39 ± 1.40 12.29 8.52** 8.14 14.93 当年生
Annual13.06 ± 0.86cd 12.43 ± 1.31bcd 11.16 ± 0.83ab 11.63 ± 1.24ab 12.00 ± 0.98abc 10.71 ± 1.87a 13.53 ± 1.48 12.08 ± 1.53 12.72 5.62** 8.39 15.74 枝
Branch多年生
Perennial7.41 ± 0.82a 5.75 ± 0.73b 5.04 ± 0.88ab 5.78 ± 1.23b 4.54 ± 0.58a 5.72 ± 0.77b 4.81 ± 1.55ab 5.58 ± 1.29 23.17 8.24** 3.21 8.13 当年生
Annual14.98 ± 2.07c 9.17 ± 1.04b 7.06 ± 1.53a 7.63 ± 2.10ab 7.69 ± 1.09ab 7.61 ± 1.02ab 8.92 ± 2.15b 9.01 ± 3.00 33.29 24.82** 5.18 17.94 根
Root吸收根
Absorbing
root8.70 ± 0.74d 5.95 ± 0.44b 5.35 ± 0.93b 4.05 ± 0.79a 6.03 ± 0.53b 7.50 ± 0.99c 8.01 ± 1.21cd 6.51 ± 1.72 26.43 33.44** 2.68 9.93 次生根
Secondary root5.89 ± 0.57b 4.52 ± 0.30a 5.58 ± 0.76b 5.90 ± 1.19b 4.16 ± 0.34a 5.48 ± 0.68b 5.82 ± 1.19b 5.34 ± 1.00 18.76 7.02** 3.55 8.02 磷含量
Phosphorus
content叶
Leaf多年生
Perennial0.98 ± 0.06a 0.73 ± 0.14ab 0.59 ± 0.09a 0.82 ± 0.17b 0.71 ± 0.05ab 0.79 ± 0.23b 0.80 ± 0.10b 0.77 ± 0.172 22.19 6.60** 0.35 1.12 当年生
annual1.46 ± 0.21b 1.44 ± 0.20b 1.00 ± 0.19a 1.03 ± 0.24a 1.45 ± 0.20b 1.39 ± 0.40b 1.21 ± 0.23ab 1.28 ± 0.30 23.85 5.73** 0.66 2.21 枝
Branch多年生
Perennial0.88 ± 0.15d 0.63 ± 0.10ab 0.55 ± 0.14a 0.83 ± 0.15cd 0.62 ± 0.12ab 0.73 ± 0.09bc 0.58 ± 0.09a 0.69 ± 0.17 24.54 9.01** 0.38 1.14 当年生
Annual1.74 ± 0.38c 1.25 ± 0.22b 0.76 ± 0.10a 1.16 ± 0.42b 1.11 ± 0.36b 1.26 ± 0.49b 1.00 ± 0.19ab 1.18 ± 0.42 36.00 7.017** 0.56 2.57 根
Root吸收根
Absorbing
root0.87 ± 0.14d 0.47 ± 0.07bc 0.38 ± 0.06b 0.24 ± 0.07a 0.52 ± 0.05c 0.84 ± 0.18d 0.57 ± 0.20c 0.55 ± 0.24 44.37 29.35** 0.12 1.08 次生根
Secondary root0.52 ± 0.08bc 0.42 ± 0.08b 0.23 ± 0.03a 0.47 ± 0.11b 0.48 ± 0.12b 0.61 ± 0.20c 0.41 ± 0.14b 0.45 ± 0.15 35.23 7.96** 0.19 0.91 氮磷比
N∶P叶
Leaf多年生
Perennial13.64 ± 1.21a 16.17 ± 4.23a 20.49 ± 4.47b 13.81 ± 3.19a 14.98 ± 1.52a 16.03 ± 6.77a 12.77 ± 2.41a 15.41 ± 4.37 28.38 4.01** 9.89 32.67 当年生
Annual9.02 ± 1.10a 8.70 ± 1.29a 11.37 ± 1.56b 11.76 ± 2.93b 8.35 ± 0.98a 8.07 ± 2.05a 11.77 ± 3.57b 9.86 ± 2.56 26.03 5.61** 5.97 18.18 枝
Branch多年生
Perennial8.50 ± 1.24ab 9.17 ± 1.17b 9.30 ± 1.12b 6.93 ± 1.16a 7.45 ± 1.58ab 7.90 ± 1.51ab 8.71 ± 4.03ab 8.28 ± 2.02 24.49 1.85 4.84 15.48 当年生
Annual8.93 ± 2.10bc 7.46 ± 1.42abc 9.17 ± 1.26b 6.98 ± 2.17ab 7.63 ± 2.80abc 6.44 ± 1.41a 8.93 ± 1.46bc 7.93 ± 2.05 25.85 2.94* 3.13 13.46 根
Root吸收根
Absorbing
root10.23 ± 2.07ab 12.65 ± 1.45abc 14.06 ± 1.99bcd 18.20 ± 5.92d 11.63 ± 1.57ab 9.26 ± 2.41a 16.70 ± 9.51cd 13.25 ± 5.29 39.99 4.73** 6.92 36.75 次生根
Secondary root11.50 ± 1.85ab 11.27 ± 2.96ab 23.64 ± 3.46d 12.73 ± 3.06bc 9.02 ± 2.16a 9.79 ± 3.02ab 15.59 ± 6.07c 13.36 ± 5.72 42.80 18.70** 5.85 27.95 注:同行不同小写字母表示不同地区之间差异显著(P < 0.05)。*表示在P < 0.05水平上显著相关;**表示在P < 0.01水平上显著相关。Notes: different lowercase letters in the same line indicate significant differences among different regions (P < 0.05). * means significant correlation at P < 0.05 level; ** means significant correlation at P < 0.01 level.
下载: 导出CSV
表 3 油松根系氮、磷化学计量特征与降水和温度的相关性分析
Table 3 Correlation analysis of nitrogen and phosphorus stoichiometry characteristics of P. tabuliformis root system with precipitation and temperature
气候因子
Climatic factor吸收根氮
Absorbing root N吸收根磷
Absorbing root P次生根氮
Secondary root N次生根磷
Secondary root P吸收根氮比
Absorb root N∶P次生根氮磷比
Absorb root N∶P年降水量
Annual precipitation/mm0.052 −0.008 −0.013 0.166 0.124 −0.120 年均温度
Annual mean temperature/℃−0.086 0.220 −0.006 0.565** −0.184 −0.559** 注:**表示在P < 0.01水平上显著相关。Note: ** means significant correlation at P < 0.01 level.
下载: 导出CSV
-
[1] Yu Q, Chen Q S, Elser J J, et al. Linking stoichiometric homoeostasis with ecosystem structure, functioning and stability[J]. Ecology Letters, 2010, 13(11): 1390−1399. doi: 10.1111/j.1461-0248.2010.01532.x
[2] Song Z L, Liu H Y, Zhao F J, et al. Ecological stoichiometry of N∶P: Si in China’s grasslands[J]. Plant and Soil, 2014, 380(1/2): 165−179.
[3] Roscher C, Thein S, Schmid B, et al. Complementary nitrogen use among potentially dominant species in a biodiversity experiment varies between two years[J]. Journal of Ecology, 2008, 96(3): 477−488. doi: 10.1111/j.1365-2745.2008.01353.x
[4] Han W X, Fang J Y, Guo D L, et al. Leaf nitrogen and phosphorus stoichiometry across 753 terrestrial plant species in China[J]. New Phytologist, 2005, 168(2): 377−385. doi: 10.1111/j.1469-8137.2005.01530.x
[5] 杨明飞. 我国北方干旱至半湿润区分布的植物叶碳氮磷化学计量特征研究[D]. 兰州: 兰州大学, 2017. Yang M F. Leaf carbon, nitrogen and phosphorus stoichiometry across plant species in the arid to semi-humid regions, North China[D]. Lanzhou: Lanzhou University, 2017.
[6] 赵广帅, 刘珉, 石培礼, 等. 羌塘高原降水梯度植物叶片、根系性状变异和生态适应对策[J]. 生态学报, 2020, 40(1): 295−309. Zhao G S, Liu M, Shi P L, et al. Variation of leaf and root traits and ecological adaptive strategies along a precipitation gradient on Changtang Plateau[J]. Acta Ecologica Sinica, 2020, 40(1): 295−309.
[7] 宗宁, 石培礼, 赵广帅, 等. 降水量变化对藏北高寒草地养分限制的影响[J]. 植物生态学报, 2021, 45(5): 444−455. doi: 10.17521/cjpe.2020.0135 Zong N, Shi P L, Zhao G S, et al. Variations of nitrogen and phosphorus limitation along the environmental gradient in alpine grasslands on the Northern Xizang Plateau[J]. Chinese Journal of Plant Ecology, 2021, 45(5): 444−455. doi: 10.17521/cjpe.2020.0135
[8] Lü X T, Kong D L, Pan Q M, et al. Nitrogen and water availability interact to affect leaf stoichiometry in a semi-arid grassland[J]. Oecologia, 2012, 168(2): 301−310. doi: 10.1007/s00442-011-2097-7
[9] Reich P B, Oleksyn J. Global patterns of plant leaf N and P in relation to temperature and latitude[J]. Proceedings of the National Academy of Sciences, 2004, 101(30): 11001−11006. doi: 10.1073/pnas.0403588101
[10] Tjoelker M G, Reich P B, Oleksyn J. Changes in leaf nitrogen and carbohydrates underlie temperature and CO2 acclimation of dark respiration in five boreal tree species[J]. Plant, Cell & Environment, 1999, 22(7): 767−778.
[11] Han W X, Fang J Y, Reich P B, et al. Biogeography and variability of eleven mineral elements in plant leaves across gradients of climate, soil and plant functional type in China[J]. Ecology Letters, 2011, 14(8): 788−796. doi: 10.1111/j.1461-0248.2011.01641.x
[12] 赵姗宇, 黎锦涛, 孙学凯, 等. 樟子松人工林原产地与不同自然降水梯度引种地土壤和植物叶片生态化学计量特征[J]. 生态学报, 2018, 38(20): 7189−7197. Zhao S Y, Li J T, Sun X K, et al. Responses of soil and plant stoichiometric characteristics along rainfall gradients in Mongolian pine plantations in native and introduced regions[J]. Acta Ecologica Sinica, 2018, 38(20): 7189−7197.
[13] Chen Y H, Han W X, Tang L Y, et al. Leaf nitrogen and phosphorus concentrations of woody plants differ in responses to climate, soil and plant growth form[J]. Ecography, 2013, 36(2): 178−184. doi: 10.1111/j.1600-0587.2011.06833.x
[14] 王凯, 张大鹏, 宋立宁, 等. 氮沉降和降水增加对榆树幼苗不同器官碳氮磷分配格局的影响[J]. 林业科学, 2020, 56(3): 172−183. Wang K, Zang D P, Song L N, et al. Effects of icreasing nitrogen peposition and precipitation on carbon, nitrogen, and phosphorus allocation in different organs of Ulmus pumila seedlings[J]. Scientia Silvae Sinicae, 2020, 56(3): 172−183.
[15] 李俊慧, 彭国全, 杨冬梅. 常绿和落叶阔叶物种当年生小枝茎长度和茎纤细率对展叶效率的影响[J]. 植物生态学报, 2017, 41(6): 650−660. doi: 10.17521/cjpe.2016.0376 Li J H, Peng G Q, Yang D M. Effect of stem length to stem slender ratio of current-year twigs on the leaf display efficiency in evergreen and deciduous broadleaved trees[J]. Chinese Journal of Plant Ecology, 2017, 41(6): 650−660. doi: 10.17521/cjpe.2016.0376
[16] Yao F Y, Chen Y H, Yan Z B, et al. Biogeographic patterns of structural traits and C∶N∶P stoichiometry of tree twigs in China’s forests[J/OL]. PLoS One, 2015, 10(2): e0116391. https://orcid.org/0000-0001-8678-7147.
[17] 邹丽梅. 亚热带6个树种细根形态比较与根序分级构型研究 [D]. 长沙: 中南林业科技大学, 2015. Zou L M. Root identification and varitation in architecture of fine roots of subtropical tree species in southern China[D]. Changsha: Central South University of Forestry and Technology, 2015.
[18] Guo D L, Xia M X, Wei X, et al. Anatomical traits associated with absorption and mycorrhizal colonization are linked to root branch order in twenty-three Chinese temperate tree species[J]. New Phytologist, 2008, 180(3): 673−683. doi: 10.1111/j.1469-8137.2008.02573.x
[19] Freschet G T, Valverde-Barrantes O J, Tucker C M, et al. Climate, soil and plant functional types as drivers of global fine-root trait variation[J]. Journal of Ecology, 2017, 105(5): 1182−1196. doi: 10.1111/1365-2745.12769
[20] Hong J T, Wang X D, Wu J B. Stoichiometry of root and leaf nitrogen and phosphorus in a dry alpine steppe on the Northern Tibetan Plateau[J]. PLoS One, 2018, 9(10): e109052. doi: 10.1371/journal.pone.0109052
[21] 张赟, 赵亚洲, 张春雨, 等. 北京松山油松种群结构及空间分布格局[J]. 应用与环境生物学报, 2009, 15(2): 175−179. Zhang Y, Zhao Y Z, Zhang C Y, et al. Structure and spatial distribution of Pinus tabulaeformis population in the Songshan Nature Reserve, Beijing, China[J]. Chinese Journal of Applied and Environmental Biology, 2009, 15(2): 175−179.
[22] 刘思文, 艾也博, 刘艳红. 北京松山油松叶功能性状沿海拔梯度的变化及其环境解释[J]. 北京林业大学学报, 2021, 43(4): 47−55. Liu S W, Ai Y B, Liu Y H. Variations in leaf functional traits along the altitude gradient of Pinus tabuliformis and its environmental explanations in Beijing Songshan Mountain[J]. Journal of Beijing Forestry University, 2021, 43(4): 47−55.
[23] 田岳梨, 杨航, 王芳玲, 等. 秦岭中段山脊油松叶功能性状差异及其对海拔梯度的响应[J]. 西北植物学报, 2021, 41(2): 300−309. doi: 10.7606/j.issn.1000-4025.2021.02.0300 Tian Y L, Yang H, Wang F L, et al. Difference of leaf functional traits of Pinus tabuliformis and its response to altitude gradient in the middle of Qinling mountains[J]. Acta Botanica Boreali-Occidentalia Sinica, 2021, 41(2): 300−309. doi: 10.7606/j.issn.1000-4025.2021.02.0300
[24] 张凯, 侯继华, 梁冬. 降水梯度对油松天然林内主要植物叶功能性状的影响[J]. 中南林业科技大学学报, 2016, 36(7): 48−54. Zhang K, Hou J H, Liang D. Effect of precipitation gradients on leaf functional traits of main plant in Pinus tabulaeformis forest[J]. Journal of Central South University of Forestry and Technology, 2016, 36(7): 48−54.
[25] 姜沛沛, 曹扬, 陈云明, 等. 不同林龄油松(Pinus tabulaeformis)人工林植物、凋落物与土壤C、N、P化学计量特征[J]. 生态学报, 2016, 36(19): 6188−6197. Jiang P P, Cao Y, Chen Y M, et al. Variation of C, N, and P stoichiometry in plant tissue, litter, and soil during stand development in Pinus tabulaeformis plantation[J]. Acta Ecologica Sinica, 2016, 36(19): 6188−6196.
[26] 黄萍, 刘艳红. 北京松山油松林林分结构和地形对幼苗更新的影响[J]. 生态学杂志, 2018, 37(4): 1003−1009. Huang P, Liu Y H. Effects of stand structure and terrain factors on seedling regeneration of Pinus tabuliformis forest in the Songshan National Nature Reserve, Beijing[J]. Chinese Journal of Ecology, 2018, 37(4): 1003−1009.
[27] 欧晓岚, 刘艳红. 不同坡向及径级油松异龄叶的功能性状[J]. 南京林业大学学报(自然科学版), 2017, 41(4): 80−88. Ou X L, Liu Y H. Effect of age, slope aspects and diameter classes on leaf functional traits of Pinus tabulaeformis in Songshan, Beijing[J]. Journal of Nanjing Forestry University (Natural Science Edition), 2017, 41(4): 80−88.
[28] 张凯. 油松各器官功能性状及其对环境因子响应的研究[D]. 北京: 北京林业大学, 2016. Zhang K. The functional traits of different organs of Pinus tabulaeformis and their response to the environment[D]. Beijing: Beijing Forestry University, 2016.
[29] 鲍士旦. 土壤农化分析[M]. 北京: 中国农业出版社, 2000. Bao S D. Soil agrochemical analysis[M]. Beijing: China Agriculture Press, 2000.
[30] 杨蕾, 孙晗, 樊艳文, 等. 长白山木本植物叶片氮磷含量的海拔梯度格局及影响因子[J]. 植物生态学报, 2017, 41(12): 1228−1238. doi: 10.17521/cjpe.2017.0115 Yang L, Sun H, Fan Y W, et al. Changes in leaf nitrogen and phosphorus stoichiometry of woody plants along an altitudinal gradient in Changbai Mountain, China[J]. Chinese Journal of Plant Ecology, 2017, 41(12): 1228−1238. doi: 10.17521/cjpe.2017.0115
[31] He J S, Wang X P, Flynn D F B, et al. Taxonomic, phylogenetic, and environmental trade-offs between leaf productivity and persistence[J]. Ecology, 2009, 90(10): 2779−2791. doi: 10.1890/08-1126.1
[32] Yuan Z Y, Chen H Y, Reich P B. Global-scale latitudinal patterns of plant fine-root nitrogen and phosphorus[J]. Nature Communications, 2011, 2: 344. doi: 10.1038/ncomms1346
[33] Wang Z Q, Gong H Y, Sardans J, et al. Divergent nitrogen and phosphorus allocation strategies in terrestrial plant leaves and fine roots: a global meta-analysis[J]. Journal of Ecology, 2022, 110: 2745−2758. doi: 10.1111/1365-2745.13985
[34] Reich P B, Tjoelker M G, Pregitzer K S, et al. Scaling of respiration to nitrogen in leaves, stems and roots of higher land plants[J]. Ecology Letters, 2008, 11(8): 793−801. doi: 10.1111/j.1461-0248.2008.01185.x
[35] 周红艳, 吴琴, 陈明月, 等. 鄱阳湖沙山单叶蔓荆不同器官碳、氮、磷化学计量特征[J]. 植物生态学报, 2017, 41(4): 461−470. doi: 10.17521/cjpe.2016.0231 Zhou H Y, Wu Q, Chen M Y, et al. C, N and P stoichiometry in different organs of Vitex rotundifolia in a Poyang Lake desertification hill[J]. Chinese Journal of Plant Ecology, 2017, 41(4): 461−470. doi: 10.17521/cjpe.2016.0231
[36] Pregitzer K S, de Forest J L, Burton A J, et al. Fine root architecture of nine north American trees[J]. Ecological Monographs, 2002, 72(2): 293−309. doi: 10.1890/0012-9615(2002)072[0293:FRAONN]2.0.CO;2
[37] Li A, Guo D L, Wang Z Q, et al. Nitrogen and phosphorus allocation in leaves, twigs, and fine roots across 49 temperate, subtropical and tropical tree species: a hierarchical pattern[J]. Functional Ecology, 2010, 24(1): 224−232. doi: 10.1111/j.1365-2435.2009.01603.x
[38] Bo H J, Wen C Y, Song L J, et al. Fine-root responses of Populus tomentosa forests to stand density[J]. Forests, 2018, 9(9): 562. doi: 10.3390/f9090562
[39] Hishi T. Heterogeneity of individual roots within the fine root architecture: causal links between physiological and ecosystem functions[J]. Journal of Forest Research, 2007, 12(2): 126−133. doi: 10.1007/s10310-006-0260-5
[40] Zadworny M, Eissenstat D M. Contrasting the morphology, anatomy and fungal colonization of new pioneer and fibrous roots[J]. New Phytologist, 2011, 190(1): 213−221. doi: 10.1111/j.1469-8137.2010.03598.x
[41] Williams K, Percival F, Merino J, et al. Estimation of tissue construction cost from heat of combustion and organic nitrogen content[J]. Plant, Cell & Environment, 1987, 10(9): 725−734.
[42] Kerkhoff A J, Fagan W F, Elser J J, et al. Phylogenetic and growth form variation in the scaling of nitrogen and phosphorus in the seed plants[J]. The American Naturalist, 2006, 168(4): E103−E122. doi: 10.1086/507879
[43] Sims D A, Pearcy R W. Response of leaf anatomy and photosynthetic capacity in Alocasia macrorrhiza (Araceae) to a transfer from low to high light[J]. American Journal of Botany, 1992, 79(4): 449−455. doi: 10.1002/j.1537-2197.1992.tb14573.x
[44] Bleecker A B. The evolutionary basis of leaf senescence: method to the madness?[J]. Current Opinion in Plant Biology, 1998, 1(1): 73−78. doi: 10.1016/S1369-5266(98)80131-3
[45] Field C, Mooney H A. Leaf age and seasonal effects on light, water, and nitrogen use efficiency in a California shrub[J]. Oecologia, 1983, 56(2-3): 348−355. doi: 10.1007/BF00379711
[46] 刘万德, 苏建荣, 李帅锋, 等. 云南普洱季风常绿阔叶林优势物种不同生长阶段叶片碳、氮、磷化学计量特征[J]. 植物生态学报, 2015, 39(1): 52−62. doi: 10.17521/cjpe.2015.0006 Liu W D, Su J R, Li S F, et al. Leaf carbon, nitrogen and phosphorus stoichiometry at different growth stages in dominant tree species of a monsoon broad-leaved evergreen forest in Pu’er, Yunnan Province, China[J]. Chinese Journal of Plant ecology, 2015, 39(1): 52−62. doi: 10.17521/cjpe.2015.0006
[47] 汪涛, 杨元合, 马文红. 中国土壤磷库的大小、分布及其影响因素[J]. 北京大学学报(自然科学版), 2008, 44(6): 945−952. Wang T, Yang Y H, Ma W H. The size, distribution and influencing factors of soil phosphorus pools in China storage, patterns and environmental controls of soil phosphorus in China[J]. Acta Scientiarum Naturalium Universitae Pekinensis (Natural Sciences Edition), 2008, 44(6): 945−952.
[48] Smeck N E. Phosphorus dynamics in soils and landscapes[J]. Geoderma, 1985, 36(3−4): 185−199. doi: 10.1016/0016-7061(85)90001-1
[49] 宁志英, 李玉霖, 杨红玲, 等. 科尔沁沙地主要植物细根和叶片碳、氮、磷化学计量特征[J]. 植物生态学报, 2017, 41(10): 1069−1080. doi: 10.17521/cjpe.2017.0048 Ning Z Y, Li Y L, Yang H L, et al. Carbon, nitrogen and phosphorus stoichiometry in leaves and fine roots of dominant plants in Horqin Sandy Land[J]. Chinese Journal of Plant Ecology, 2017, 41(10): 1069−1080. doi: 10.17521/cjpe.2017.0048
[50] 高德新, 张伟, 任成杰, 等. 黄土高原典型植被恢复过程土壤与叶片生态化学计量特征[J]. 生态学报, 2019, 39(10): 3622−3630. Gao D X, Zhang W, Ren C J, et al. Ecological stoichiometry characteristics of soil and leaves during the recovery process of typical vegetation on the Loess Plateau[J]. Acta Ecologica Sinica, 2019, 39(10): 3622−3630.
[51] 姜沛沛, 曹扬, 陈云明, 等. 陕西省3种主要树种叶片、凋落物和土壤N、P化学计量特征[J]. 生态学报, 2017, 37(2): 443−454. Jiang P P, Cao Y, Chen Y M, et al. N and P stoichiometric characteristics of leaves, litter, and soil for three dominant tree species in the Shaanxi Province[J]. Acta Ecologica Sinica, 2017, 37(2): 443−454.
[52] He J S, Fang J Y, Wang Z H, et al. Stoichiometry and large-scale patterns of leaf carbon and nitrogen in the grassland biomes of China[J]. Oecologia, 2006, 149(1): 115−122. doi: 10.1007/s00442-006-0425-0
[53] 张慧, 郭卫红, 杨秀清, 等. 麻栎种源林叶片碳、氮、磷化学计量特征的变异[J]. 应用生态学报, 2016, 27(7): 2225−2230. Zhang H, Guo W H, Yang X Q, et al. Variations in leaf C, N, P stoichiometry of Quercus acutissima provenance forests[J]. Chinese Journal of Applied Ecology, 2016, 27(7): 2225−2230.
[54] Dijkstra F A, Blumenthal D, Morgan J A, et al. Contrasting effects of elevated CO2 and warming on nitrogen cycling in a semiarid grassland[J]. New Phytologist, 2010, 187(2): 426−437. doi: 10.1111/j.1469-8137.2010.03293.x
[55] Liu G F, Freschet G T, Pan X, et al. Coordinated variation in leaf and root traits across multiple spatial scales in Chinese semiarid and arid ecosystems[J]. New Phytologist, 2010, 188(2): 543−553. doi: 10.1111/j.1469-8137.2010.03388.x
[56] Mcgroddy M, Daufresne T, Hedin L. Scaling of C∶N∶P stoichiometry in forests worldwide: implications of terrestrial redfield type rations[J]. Ecology, 2004, 85(9): 2390−2401. doi: 10.1890/03-0351
[57] Lovelock C E, Feller I C, Ball M C, et al. Testing the growth rate vs. geochemical hypothesis for latitudinal variation in plant nutrients[J]. Ecology Letters, 2007, 10(12): 1154−1163. doi: 10.1111/j.1461-0248.2007.01112.x
[58] 任书杰, 于贵瑞, 陶波, 等. 中国东部南北样带654种植物叶片氮和磷的化学计量学特征研究[J]. 环境科学, 2007, (12): 2665−2673. doi: 10.3321/j.issn:0250-3301.2007.12.001 Ren S J, Yu G R, Tao B, et al. Leaf nitrogen and phosphorus stoichiometry across 654 terrestrial plant species in NSTEC[J]. Environmental Science, 2007, (12): 2665−2673. doi: 10.3321/j.issn:0250-3301.2007.12.001
-
期刊类型引用(2)
1. 康向阳. 关于理想森林及其经营的遗传学思考. 北京林业大学学报. 2024(06): 1-9 .  本站查看
本站查看
2. 胡勐鸿,吕寻,戴小芬,李宗德,李万峰. 日本落叶松无性系种子园和优树半同胞家系苗期比较. 东北林业大学学报. 2024(12): 10-17 . 百度学术
其他类型引用(0)


计量
- 文章访问数: 489
- HTML全文浏览量: 86
- PDF下载量: 57
- 被引次数: 2
