
Quantitative assessment for forest fire risk based on fire simulation: taking the Subtropical Forest Experimental Center of Chinese Academy of Forestry as an example
-
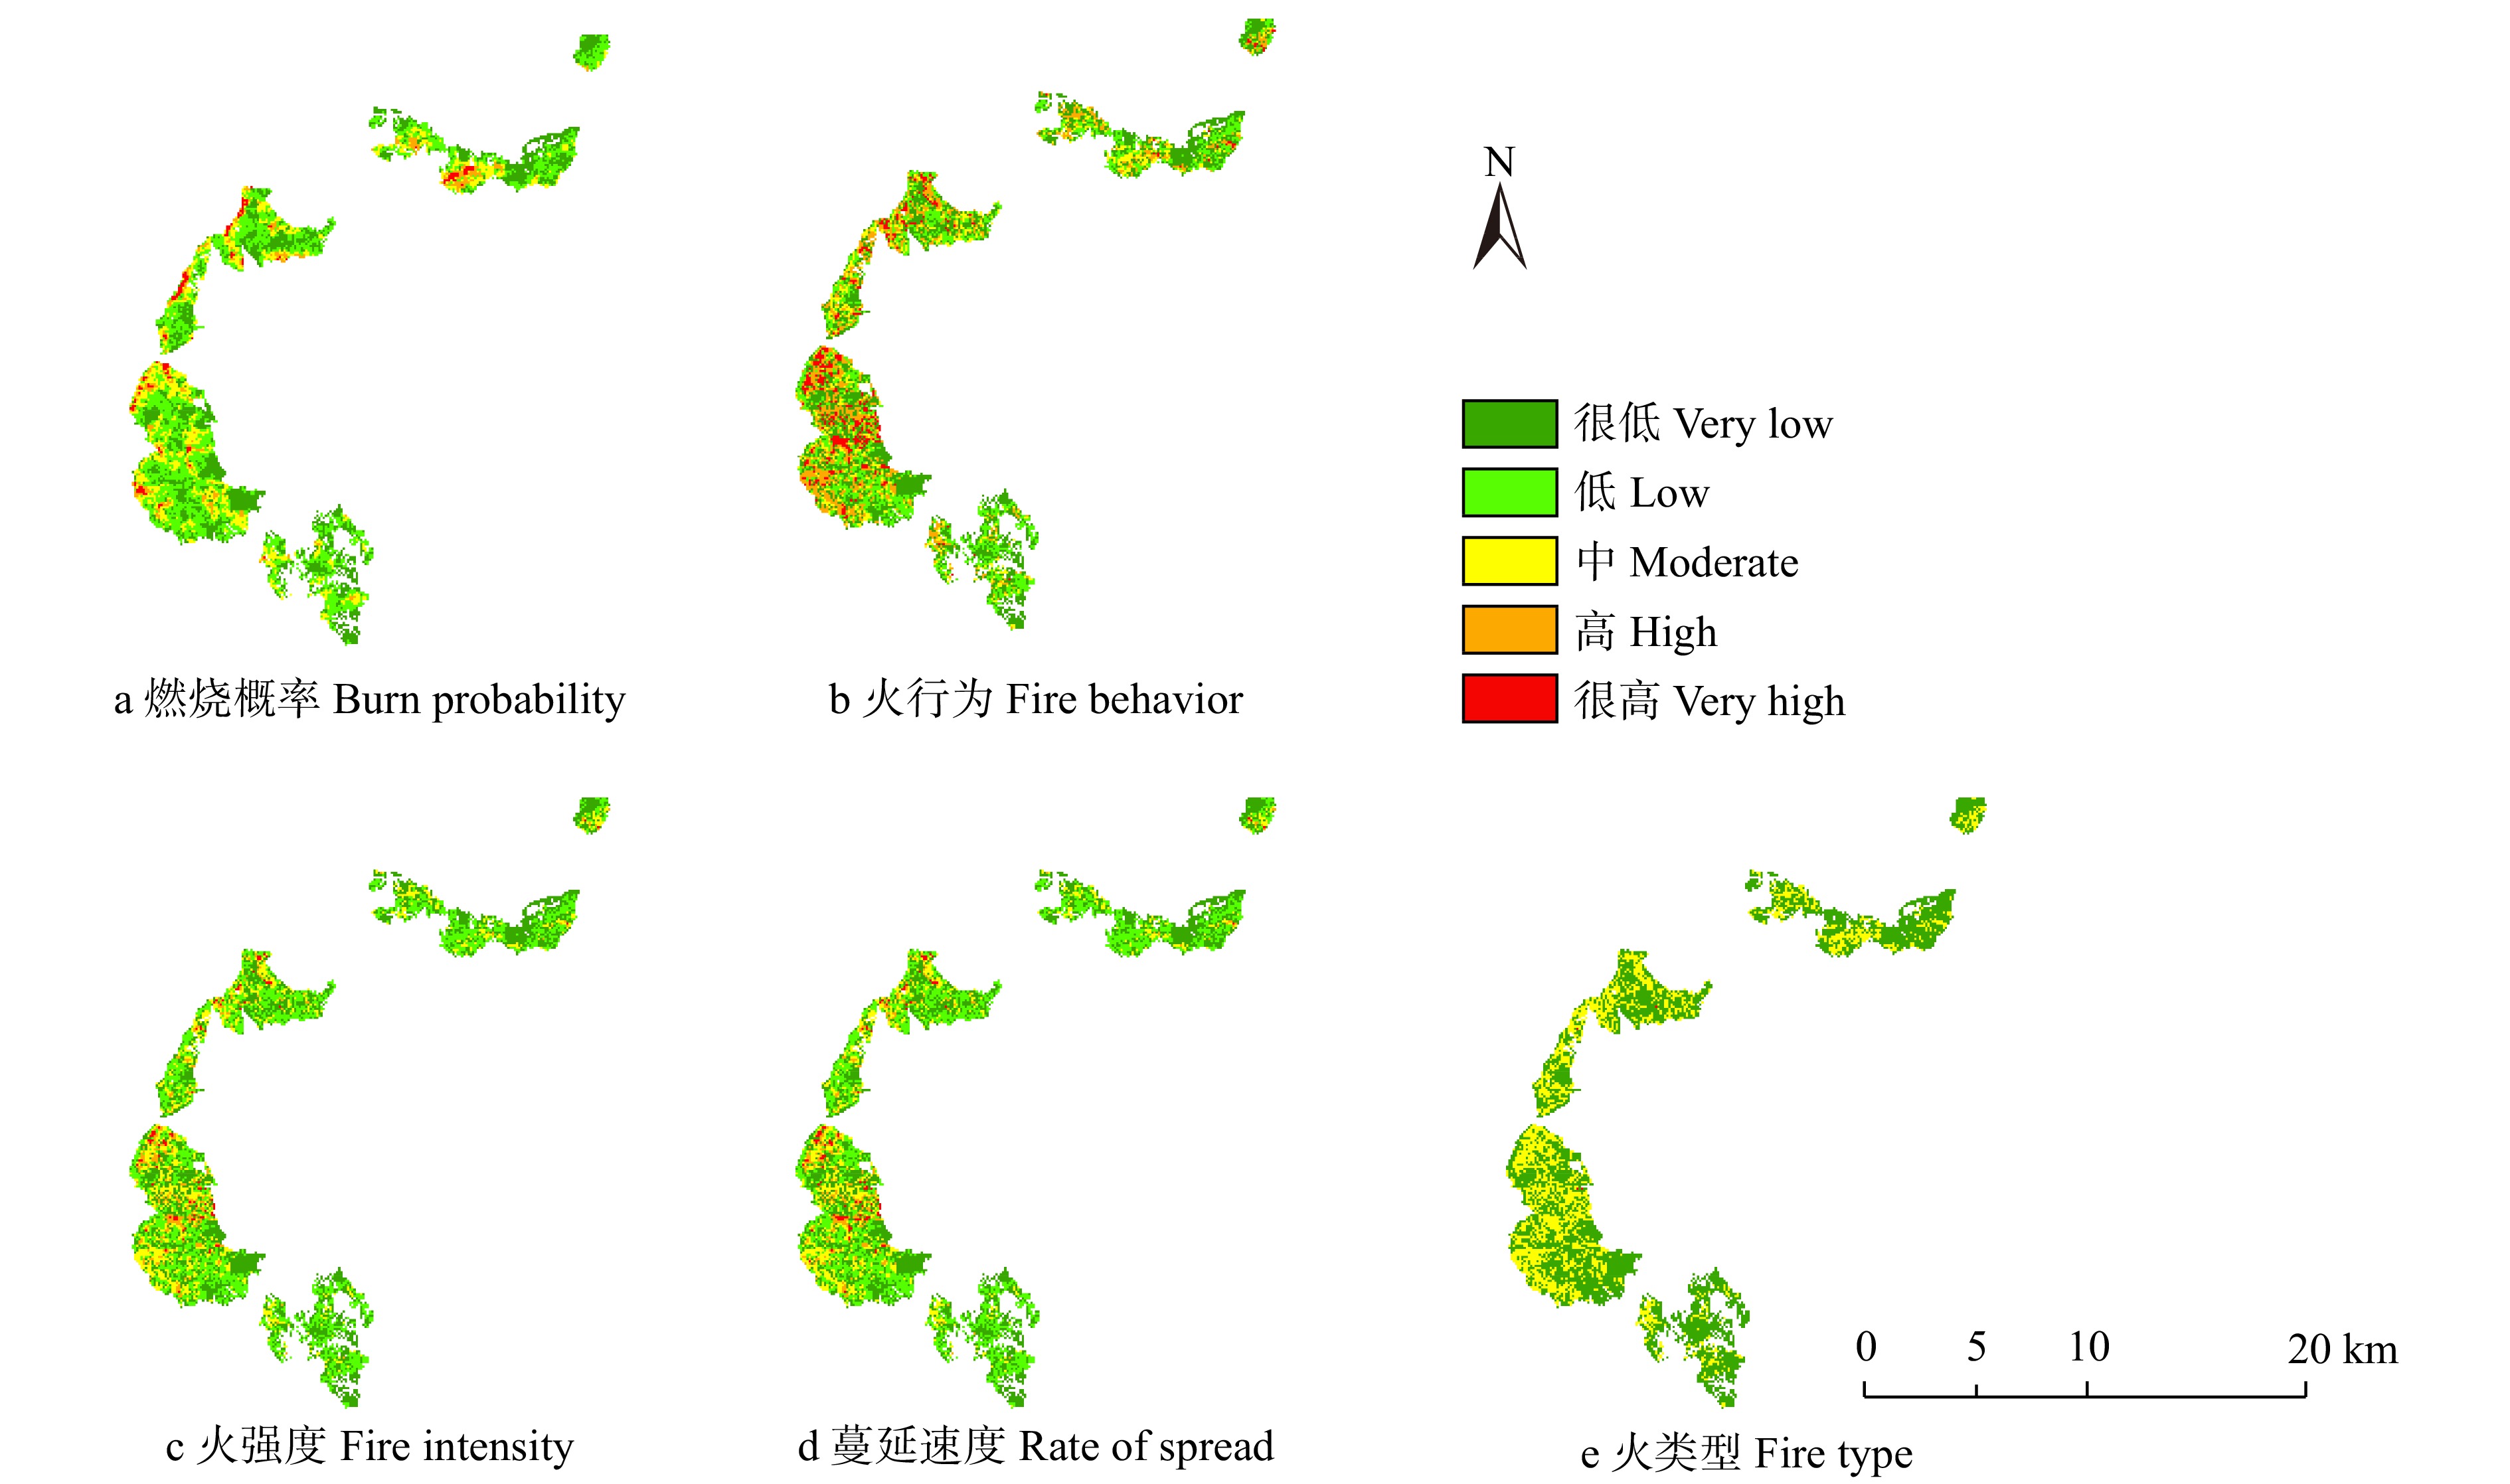
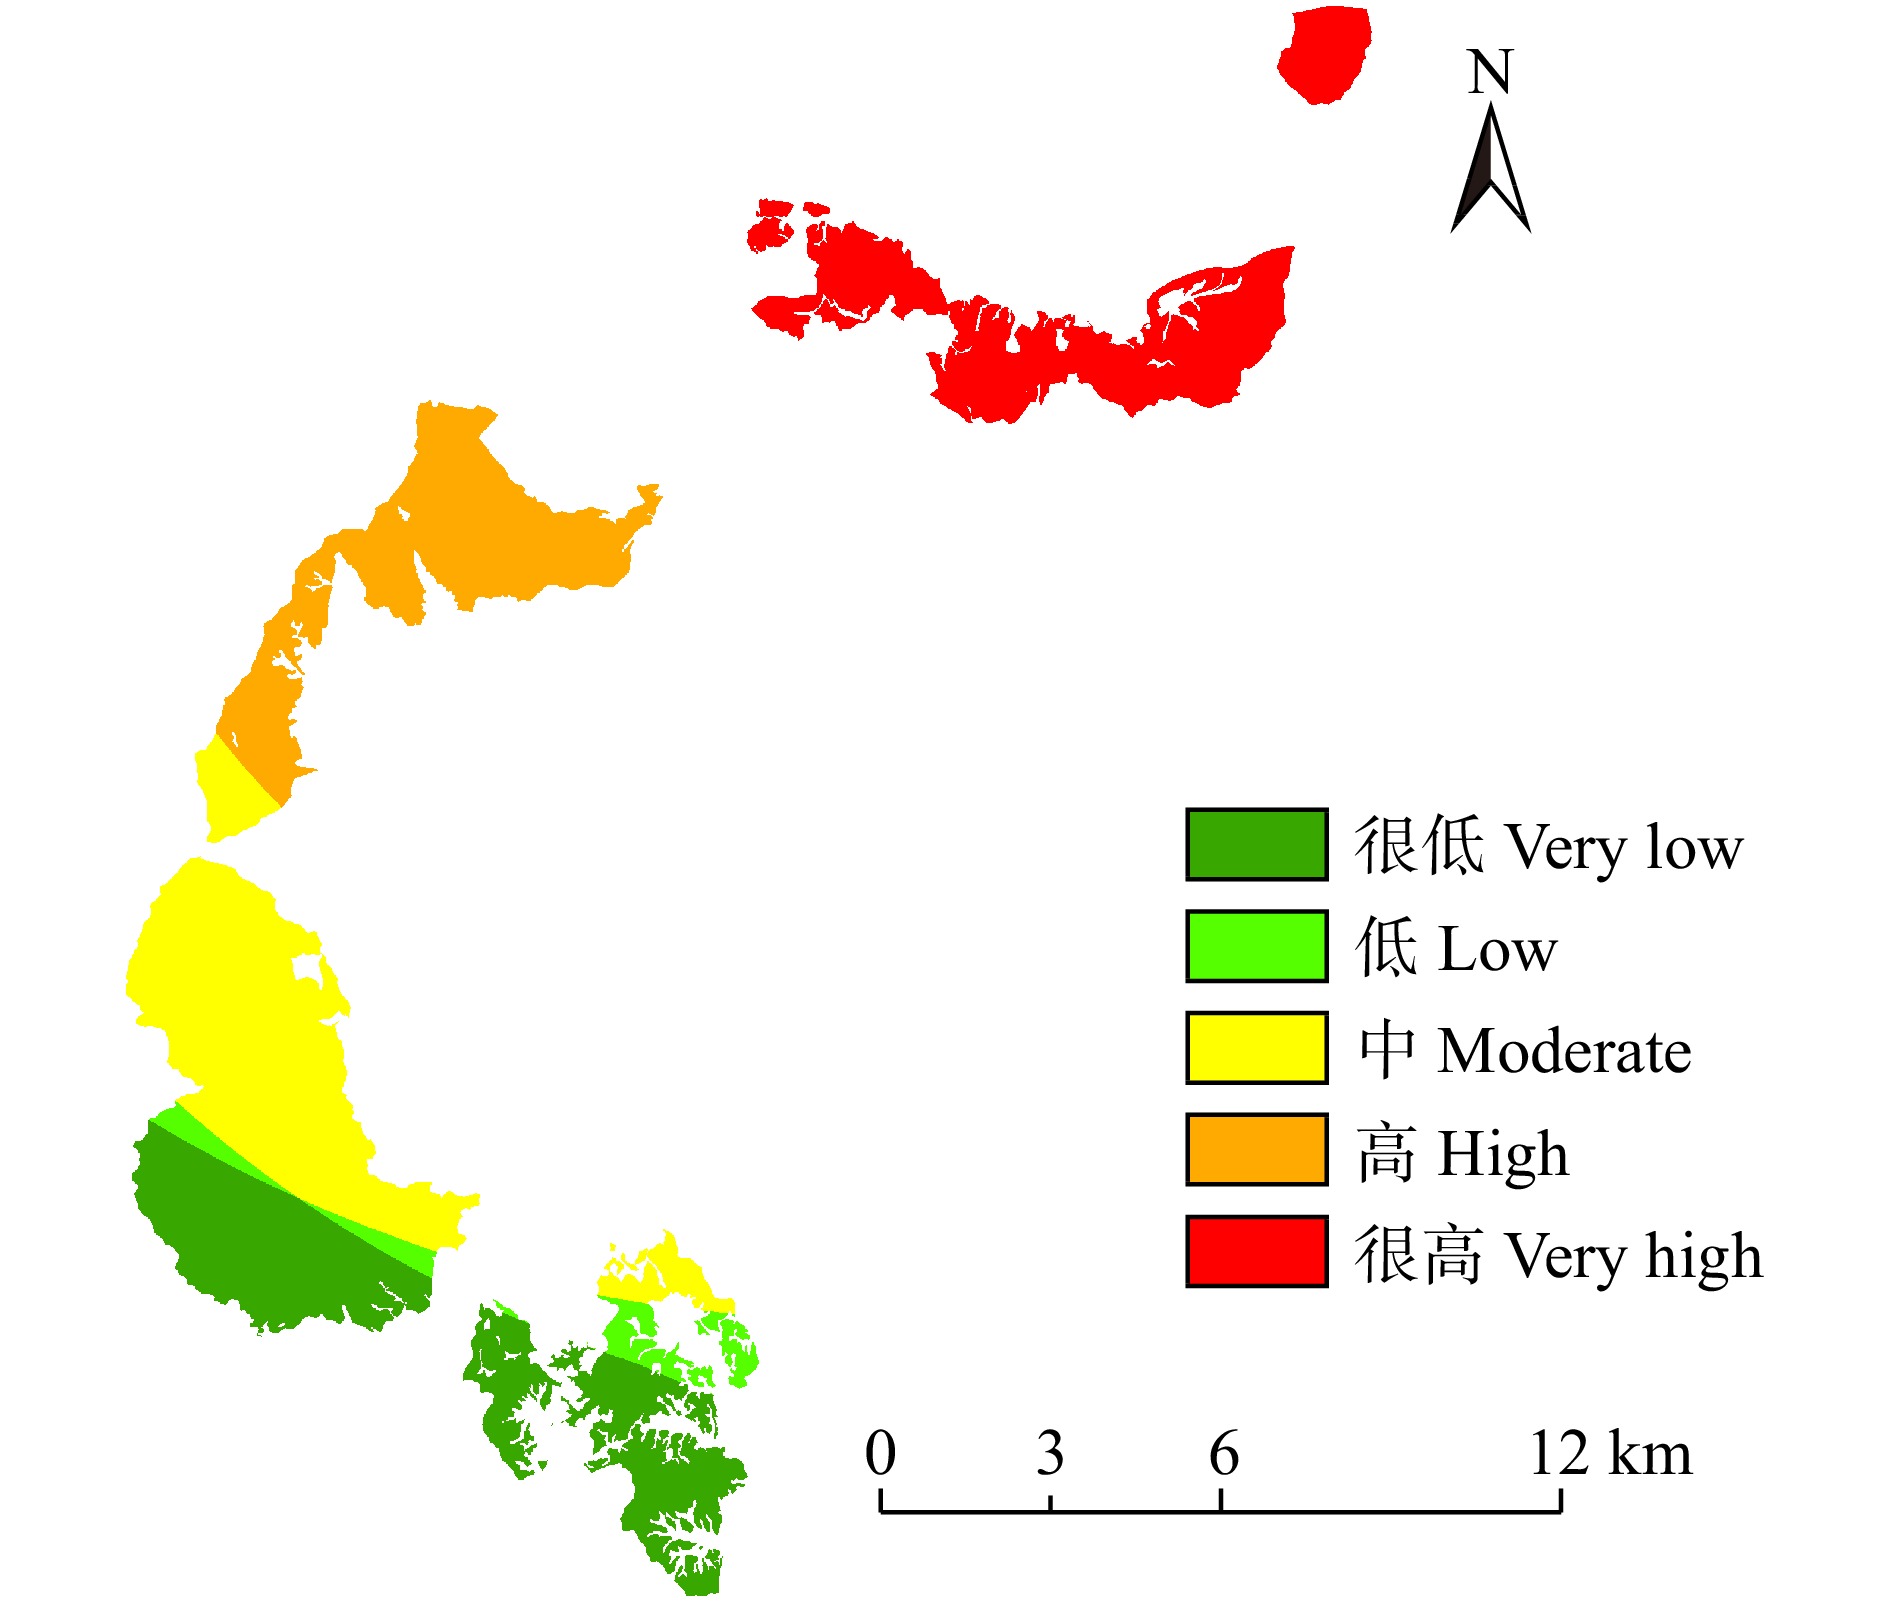
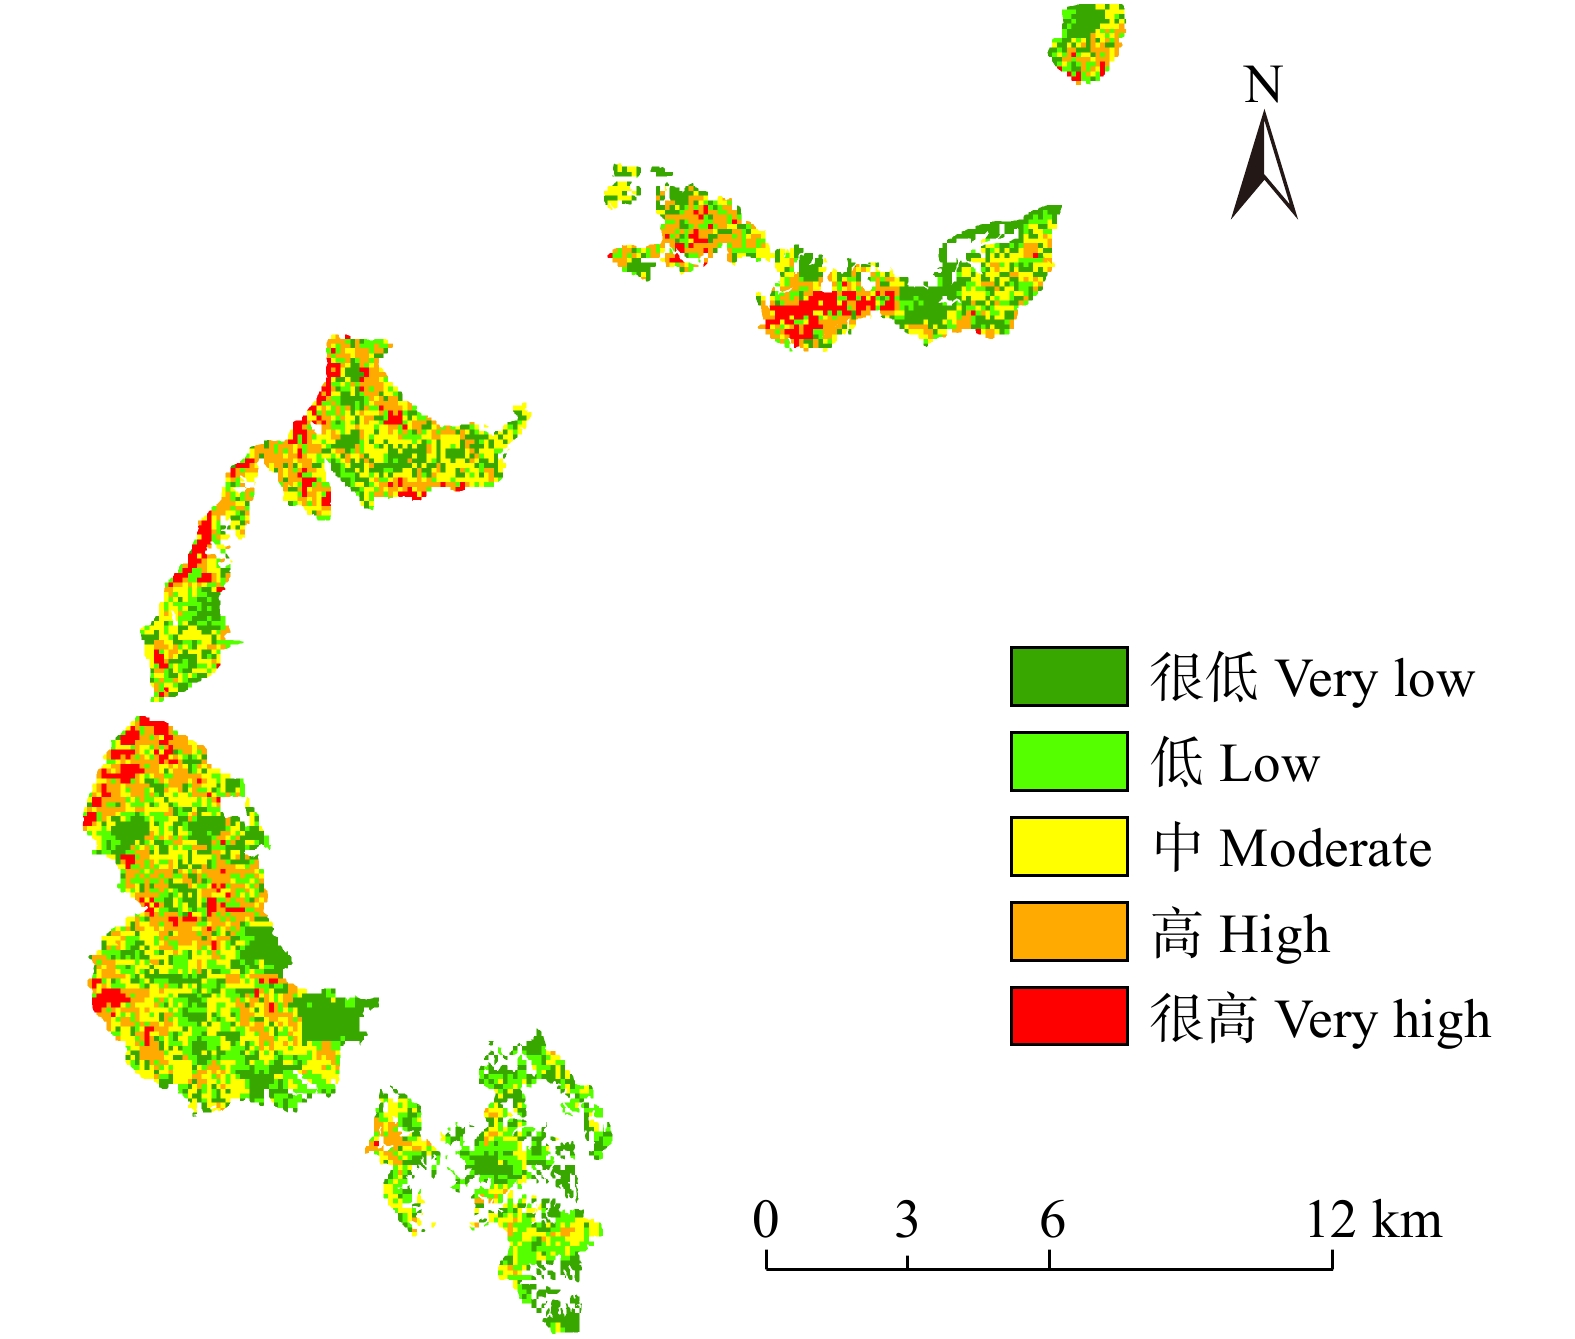
摘要:目的 森林火灾风险评估是利用定量或定性的方法综合考虑一个区域的火发生可能性及对环境造成的潜在影响,识别区域内的高火灾风险区是开展科学林火管理的基础。本研究基于森林燃烧概率、潜在火行为和暴露性综合评估一个区域的森林火灾风险,为林火管理部门开展林火管理和可燃物处理提供指导。方法 利用燃烧概率模型(Burn-P3)在景观尺度上模拟亚热带林业实验中心所属林区的燃烧概率、潜在火强度、蔓延速度及火发生类型。根据火对周围城镇和水源的潜在环境和安全问题计算火灾暴露性。综合这些指标利用层次分析方法定量评估森林火灾风险,分析火灾风险的空间特征和不同类型植被的燃烧性差异。结果 火模拟结果表明:研究区的平均燃烧概率为0.040 1,燃烧概率高和很高的区域分别占研究区的5.3%和2.3%。火烧以地表火和间歇性树冠火为主,平均火强度及蔓延速度分别为2 043.6 kW/m2和2.5 m/min。火行为指数高和很高的区域分别占17.3%和6.2%。针阔混交林的燃烧概率和潜在火行为指数最高,阔叶林的燃烧概率及潜在火行为指数最低,但其暴露性指数最高。火灾风险综合评估结果表明,风险高和很高的区域分别占19.7%和6.5%,针阔混交林的火灾风险指数高于其他植被类型。结论 研究区内大部分区域的燃烧概率较低,但潜在火行为指数较高。城镇和水源附近森林的火灾风险等级高,是林火管理的重点区域。部分针叶林和针阔混交林存在发生稳进树冠火的可能,可以通过可燃物处理措施来减少可燃物梯及地表易燃可燃物,降低火灾风险。Abstract:Objective Forest fire risk assessment is to describe the potential occurrence of forest fire and the direct or indirect fire impacts on environment at the landscape scale by qualitative and/or quantitative indicators. Identifying the areas with high fire risk is the base of forest fire management. Comprehensive assessment on forest fire risk for a region based on burn probability, potential fire behavior, and exposure provides a guide for local fire agency to carry out fire and fuel management.Method We simulated the burn probability, potential fire intensity, spreading speed, and fire types on the landscape scale for the forests in the Subtropical Forestry Experimental Center by the burn probability model (Burn-P3). The potential fire impacts on surrounding communities and water sources were analyzed for exposure. We also analyzed the spatial characteristics of fire risk, burn probability, and potential fire behavior of every vegetation type. A comprehensive assessment model on fire risk was constructed by analytic hierarchy process.Result The fire simulation results showed that the average burn probability of the study area was 0.040 1, and the areas with high and very high burn probability accounted for 5.3% and 2.3%, respectively. The fire types were mainly surface fire and intermittent crown fire. The average fire intensity and spread speed were 2 043.6 kW/m2 and 2.5 m/min, respectively. The areas with high and very high fire behavior index accounted for 17.3% and 6.2% of the total areas, respectively. The coniferous and broadleaved mixed forest had the highest rating on burn probability and potential fire behavior index. The broadleaved forest had the lowest grade on burn probability and fire behavior index, but showed the highest exposure. The comprehensive assessment results on fire risk showed that the areas with high and very high risk accounted for 19.7% and 6.5%, respectively. The fire risk of coniferous and broadleaved mixed forest was higher than that of the other vegetation types.Conclusion Most of the study area has low burn probability and high potential fire behavior index. The forests near towns and water sources show high fire risks, which should be the key areas for fire management in the future. It is necessary to carry out fuel cleaning measures to reduce fuel ladder and surface inflammable fuels in coniferous forest and coniferous and broadleaved mixed forest in order to reduce their fire risk.
-
Keywords:
- forest fire /
- burn probability /
- fire behavior /
- risk assessment /
- fire simulation
-
竹材具生长周期短、硬度强、韧性高、可降解的生物性材料。且在现有木材资源不能适应家具产业发展迫切需要的情况下,竹材是取代实木的最理想材料[1],竹集成材作为保持了竹材优异的物理力学性能的竹制家具用材,具有良好的发展前景。众所周知,竹材容易受外界环境如光照、水、微生物等的侵害而发生变色、腐朽[2],竹集成材亦如是。对竹集成材进行表面涂饰是最能够有效保护其性能的方法之一。
以水作为溶剂的水性漆与传统油性漆相比,不含挥发性有机物(volatile organic compounds,VOCs),具有绿色环保、节约资源的特性[3]。伴随着国家环保政策的不断完善和绿色环保理念的普及,水性漆在家具、室内装饰、建筑等领域将逐步替代传统涂料[4]。然而竹集成材水性漆涂饰面临着竹集成材密度大,纹孔少,横向渗透困难等问题[5],使得水性漆漆膜附着力差,竹集成材水性漆涂饰工业化进度缓慢。为了克服这些问题,Lu[6]通过对毛竹表面进行过氧化氢表面预处理的方法,提高了水性漆在毛竹表面的附着力。此外其他研究人员通过使用湿热处理[7-8]、碱液浸泡处理[9]等方法,也在一定程度上提高了竹材表面的润湿性和粗糙度,改善了水性漆等流体在竹材内部的渗透效率,漆膜的附着力由此增强。涂饰工艺对涂料性能的发挥有着重要影响,是涂饰过程中的关键技术环节。但目前有关水性涂饰工艺的研究还着重于水曲柳、杨木等木质材料上[10-12],对竹集成材涂饰工艺研究较少,且未有水性清漆和色漆对竹集成材硬度、附着力等漆膜性能影响方面的研究。
为了解决竹集成材水性涂装这些难题,本研究以家具中最为常用的毛竹集成材为基材,在省去预处理的基础上优化了竹集成材水性涂饰工艺,提高了水性涂饰工艺的效率,系统地探究了竹集成材清漆与色漆涂饰性能的影响及竹集成材水性漆漆膜的附着机理,为竹家具的水性化涂装提升提供理论支持和科学依据。
1. 材料与方法
1.1 材 料
选取含水率为11%的毛竹集成材,制成尺寸为100 mm(长) × 100 mm(宽) × 10 mm(厚)的试样18块,并对试样在室温和湿度为(65 ± 3)%的环境下进行打磨。选用涂料为自制水性底漆和商业水性面漆(分为清漆与色漆两种类型,主要成分为水性聚氨酯树脂,底漆固体含量为39.2%,面漆固体含量为34.6%)。
1.2 基材涂饰
依次用80目、120目、180目和240目砂纸对基材进行顺纹打磨并用羊毛刷除尘。涂饰前底漆与面漆分别添加5% 和8%的去离子水进行调配。调配底漆涂布量为80 g/m2,面漆涂布量为120 g/m2,在室温下均匀地喷涂底漆3遍、面漆1遍,每遍喷涂干燥之后再次顺纹打磨1遍(图1)。涂饰完后基材后在室温下干燥8 h。
1.3 测试方法
将无差别的18个样品分为A、B和C这3组,每组6个,按照字母加数字的方式编号成A1 ~ A6、B1 ~ B6和C1 ~ C6。
1.3.1 漆膜硬度、附着力、光泽度测试
选取A组试样进行漆膜的硬度测试。根据ISO 15184—1998 《色漆和清漆 铅笔法测定漆膜硬度》标准测试。选取B组试样进行漆膜的附着力测定。根据ISO 2409—2013《色漆和清漆交叉切割试验》中的检测标准,按照规定的步骤,使用QFH漆膜划格仪依次对每个试样进行测定。参照ISO 2813—2014《色漆和清漆在20°、60°和85°非金属色漆漆膜镜面光泽的测定》使用60°光泽度仪对C组和对照试样进行光泽度测试。
1.3.2 表面粗糙度测试
参照GB/T 12472—2003《产品几何量技术规范(GPS) 表面结构 轮廓法 木制件表面粗糙度参数及其数值》,使用TR240便携式表面粗糙度仪测试试样的表面粗糙度,将触针的运动转变为电信号,测量出各粗糙度参数。设置取样长度为2.5 mm,为了提高准确率,在每一块试件上选取4 个点测试,并对测试结果进行记录。
1.3.3 色度值测试
使用SP60色差仪按照国际照明委员会CIE标准色度系统对C组试样基材涂饰前后的颜色变化进行定量的度量。CIE由L*、a*、b*这3个数值进行评估。L*表示亮度;a*表示红绿,数值变化由正到负,表示颜色从红(正)到绿(负);b*表示黄蓝,数值变化由正到负,表示颜色从黄(正)到蓝(负)。总色差值ΔE表示颜色知觉差异,数值越小则表示颜色变化越小。ΔE由公式(1)确定:
ΔE=√ΔL∗2+Δa∗2+Δb∗2 (1) 式中:ΔL*、Δa* 和Δb*分别为涂饰前后的L*、a*和b*差值。
1.3.4 扫描电镜(scanning electron microscope,SEM)分析
使用场发射环境扫描电镜(FEG-ESEM,XL30ESEMFEG,FEI Company,USA)观察并记录基材涂饰前后的表面形态。将加速电压设置为7 kV后,着重对涂饰后基材与漆膜界面结合处的形态进行观察。
1.3.5 傅里叶变换红外光谱(Fourier transform infrared spectroscopy,FTIR)分析
用溴化钾压片法分别测定涂饰前后试样的FTIR。设置光谱分辨率为4 cm−1,在500 ~ 4 000 cm−1范围内,利用傅里叶变换红外光谱仪(Nicolet6700傅里叶红外光谱仪,Thermo Scientific, Waltham, USA)扫描得到清漆、色漆、竹集成材、清漆和色漆涂饰后的基材的5种FTIR。测试完成后,将所有5个样品的光谱绘制成图表,分析每个样品的特征峰的变化,并据此探究水性漆与竹集成材的结合机理。
2. 结果与讨论
2.1 漆膜硬度与附着力
漆膜硬度代表了涂饰在基材上的漆膜的机械强度,反映了漆膜对来自外界的碰擦、刺划等机械作用的耐受能力[13]。从表1可以看出:清漆的漆膜硬度为1H,而色漆的漆膜硬度为2H。这是因为漆膜的硬度是由成膜物质的性能所决定的,色漆中含有较高硬度的颜料,因而色漆的硬度优于清漆。但两者的硬度均能够满足GB/T 3324—2017《木家具通用技术条件》中室内装饰、实木地板的使用要求[14]。此外,我们发现清漆和色漆的漆膜硬度均比之前研究的水性漆涂饰水曲柳所得的硬度高[12],这充分说明了水性漆采用喷涂的涂饰工艺能在竹集成材上产生能媲美在木材上的效果。
表 1 水性漆漆膜的硬度与附着力Table 1. Hardness and adhesion of film of waterborne paint清漆 Varnish 色漆 Color paint 试件 Sample 硬度 Hardness 附着力 Adhesion 试件 Sample 硬度 Hardness 附着力 Adhesion A1 1H 0级 Grade 0 B1 2H 1级 Grade 1 A2 1H 0级 Grade 0 B2 2H 1级 Grade 1 A3 1H 0级 Grade 0 B3 2H 1级 Grade 1 A4 1H 0级 Grade 0 B4 2H 1级 Grade 1 A5 1H 0级 Grade 0 B5 2H 1级 Grade 1 A6 1H 0级 Grade 0 B6 2H 1级 Grade 1 平均值 Average value 1H 0级 Grade 0 平均值 Average value 2H 1级 Grade 1 漆膜附着力是指导家具涂装工艺优化方向的关键数据,也是影响漆膜性能的重要指标之一[15-16]。由表1可知:清漆漆膜的附着力比色漆漆膜的附着力更高,可达为最高的0级,这是由于色漆由于含有颜料,其固含量高于清漆,所以清漆具有更高的渗透能力,因而清漆能更好地填充在基材的细胞腔里。从SEM图中也能清晰地看到涂饰前后的差别。在未涂饰基材图(图2a、2b)中可以看到有较大的导管存在基材的横切面上,而纵切面上较多的则是裸露的细胞腔,基材表面裸露的细胞腔为水性漆在基材表面良好的附着性能提供了一定的基础。基材涂饰清漆和色漆后(图2c、2d),沟槽状的细胞腔和细胞胞间层中都有成膜物填充,因而达到较强的附着力。且从图2c、2d中也能看出:因清漆的渗透性能更好,使得在相同涂布量下,色漆的漆膜厚度明显高于清漆。此外,竹集成材水性清漆涂饰的漆膜附着力与之前研究的木材水性漆涂饰的附着力相当[12]。这也再次证明了使用“三低一面”的喷涂涂饰工艺能达到较好的漆膜性能。
2.2 光泽度
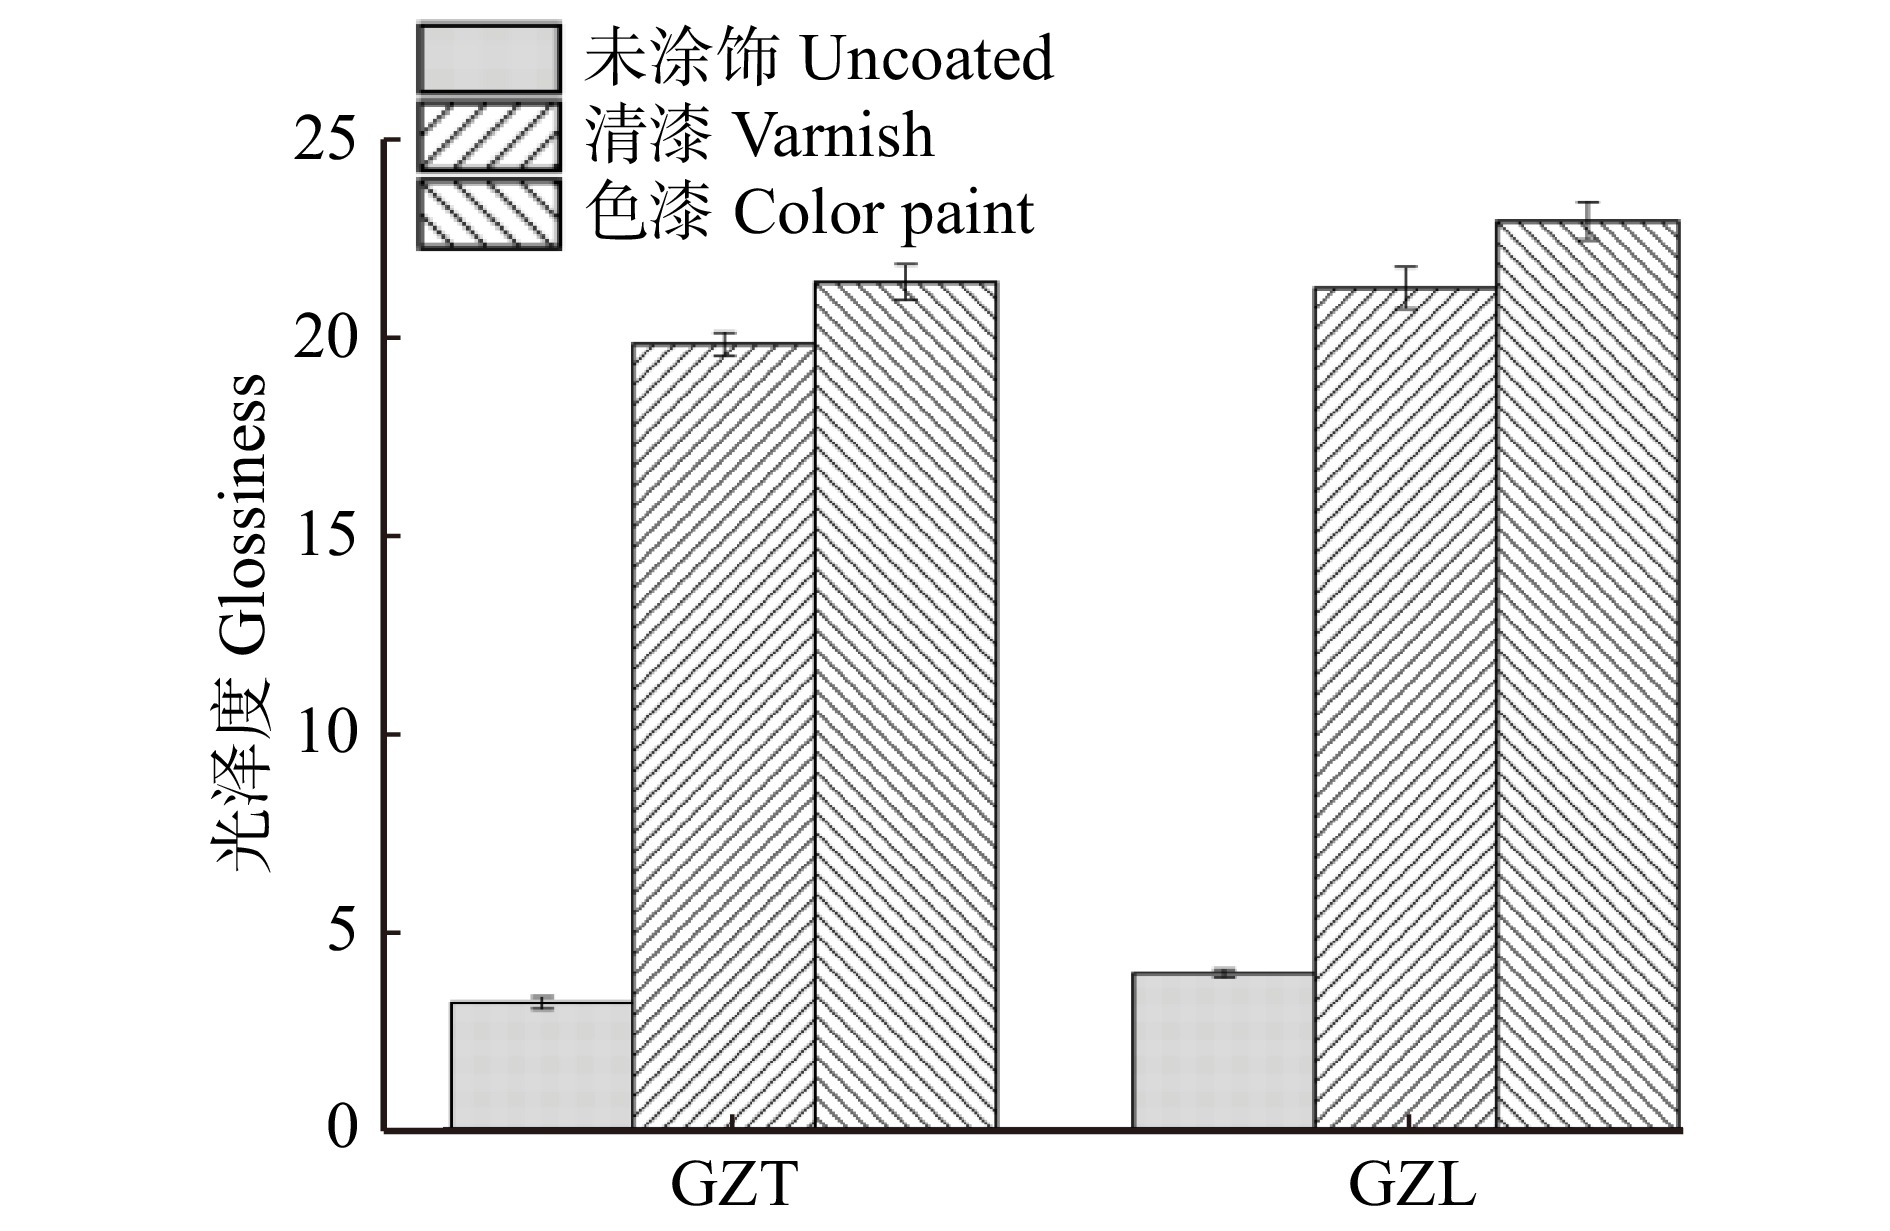
漆膜的光反射能力是通过漆膜的光泽度来衡量的,在一定范围内,随着竹材基材的表面光泽度增加,视觉效果变好[17]。涂饰前后基材的光泽度一般区分为垂直竹材纹理的光泽度值(gloss value of vertical bamboo texture,GZT)和平行竹材纹理的光泽度值(gloss value of parallel bamboo texture,GZL)。由图3可得涂饰后试样光泽度明显高于未涂饰试样,这是因为水性漆成膜物的光泽度比竹材自身的光泽度高。清漆涂饰后的平均GZT和GZL分别为19.83和21.24,色漆涂饰后的分别为21.39和22.93,均比未涂饰时提高了5倍以上,大大提升了竹集成材的装饰效果。且色漆因颜料填料含量较高,成膜物质在竹材表面固着占比更多,从而使得色漆光泽度均高于清漆。通过进一步对比发现试样的GZL均高于GZT,这是因为竹材大多数细胞是轴向排列的,在平行纹理方向,大部分细胞被剖开,细胞腔呈沟槽状暴露出来,因此成膜物容易填充到腔径大的细胞腔中;细胞壁的相对含量在垂直纹理方向上较多,因此成膜物很难渗透到具有纳米级孔的细胞壁中,导致平行纹理方向上成膜物的含量高于垂直纹理方向上的含量,因此其光泽度也显著增加[18-19]。
![]() 图 3 基材涂饰前后光泽度GZT为光泽度仪垂直于木材纹理方向时所测得的光泽度值;GZL为光泽度仪平行于木材纹理方向时所测得的光泽度值。 GZT is the glossiness value measured when glossmeter is perpendicular to the direction of wood texture. GZL is the glossiness value measured when glossmeter is parallel to the direction of wood texture.Figure 3. Glossiness of substrate before and after painting
图 3 基材涂饰前后光泽度GZT为光泽度仪垂直于木材纹理方向时所测得的光泽度值;GZL为光泽度仪平行于木材纹理方向时所测得的光泽度值。 GZT is the glossiness value measured when glossmeter is perpendicular to the direction of wood texture. GZL is the glossiness value measured when glossmeter is parallel to the direction of wood texture.Figure 3. Glossiness of substrate before and after painting2.3 表面粗糙度
表面粗糙度是指竹材在加工的过程中表面留下的各种不同程度的微观加工痕迹或不平度,常被用来评价竹材表面的质量,将会直接影响竹材的涂饰效果以及涂料的用量,常用轮廓算数平均偏差Ra、轮廓算数均方偏差Rq、微观不平度十点高度Rz和轮廓最大高度Ry表示[20]。本实验主要采用Ra表征试样的表面粗糙度,Ra的值越小,说明其表面越光滑平整。不同涂饰情况对应试样的表面粗糙度和电镜图见图4和图5。涂饰后的Ra值均小于未涂饰的Ra值,从SEM图也可以清楚地看出基材裸露的细胞腔被水性漆覆盖,表面粗糙度降低。且清漆涂饰后的Ra值比色漆涂饰后的Ra值小。这是因为色漆中含有颜料颗粒(图5b),可能影响成膜的交联程度,这导致涂饰色漆后表面粗糙度高于涂饰清漆后的表面粗糙度。
![]() 图 4 涂饰前后试样表面粗糙度平均值Ra为评定轮廓的算数平均偏差; Rz为微观不平度十点高度,是指在取样长度内5 个最大的轮廓峰高的平均;Rq为评定轮廓的算数均方偏差;Ry为轮廓最大高度,是指在取样长度内,轮廓峰顶线和轮廓谷底线之间的距离。Ra is the arithmetical mean deviation of assessed profile; Rz is the height of ten points of micro unevenness, which refers to the average of five maximum contour peak heights within the sampling length; Rq is the root mean square deviation of the assessed profile; Ry is the maximum height of profile, which refers to the distance between the contour peak line and the contour bottom line within the sampling length.Figure 4. Surface roughness of substrate before and after painting
图 4 涂饰前后试样表面粗糙度平均值Ra为评定轮廓的算数平均偏差; Rz为微观不平度十点高度,是指在取样长度内5 个最大的轮廓峰高的平均;Rq为评定轮廓的算数均方偏差;Ry为轮廓最大高度,是指在取样长度内,轮廓峰顶线和轮廓谷底线之间的距离。Ra is the arithmetical mean deviation of assessed profile; Rz is the height of ten points of micro unevenness, which refers to the average of five maximum contour peak heights within the sampling length; Rq is the root mean square deviation of the assessed profile; Ry is the maximum height of profile, which refers to the distance between the contour peak line and the contour bottom line within the sampling length.Figure 4. Surface roughness of substrate before and after painting2.4 色度值
色差是指两种颜色之间的差异。色差值是色差的数值表达。色差和色差值受涂料成分、涂饰工艺等因素的影响[21]。涂膜前后的色度值变化如图6所示。涂饰清漆前L*值为72.38,涂饰清漆后降低至64.37;a*值由原来的7.03增加到10.12;b*值由24.48增加到30.64。结果表明,涂层后基材表面明度略有下降,红色和黄色指数略有增加。ΔE较小为10.56,说明涂饰清漆前后竹集成材的表面颜色相差不大。这是因为水性清漆不含颜料,在竹集成材表面固化后是透明的,能较好地保持竹集成材本身的颜色。而涂饰色漆后L*值降低至34.74;a*值增加到12.03;b*值降低至18.30。说明涂层后基材表面明度有一定程度的下降,红色和蓝色指数略有增加。ΔE值较大,为38.46,这表明竹集成材表面的色彩特征因色漆中颜料的颜色发生了较大程度的改变。
![]() 图 6 涂饰前后色度值对比L*表示亮度;a*表示红绿;b*表示黄蓝。 L* indicates lightness, a* indicates red and green, and b* indicates yellow and blue.Figure 6. Comparison of chromaticity values before and after painting
图 6 涂饰前后色度值对比L*表示亮度;a*表示红绿;b*表示黄蓝。 L* indicates lightness, a* indicates red and green, and b* indicates yellow and blue.Figure 6. Comparison of chromaticity values before and after painting2.5 FTIR分析
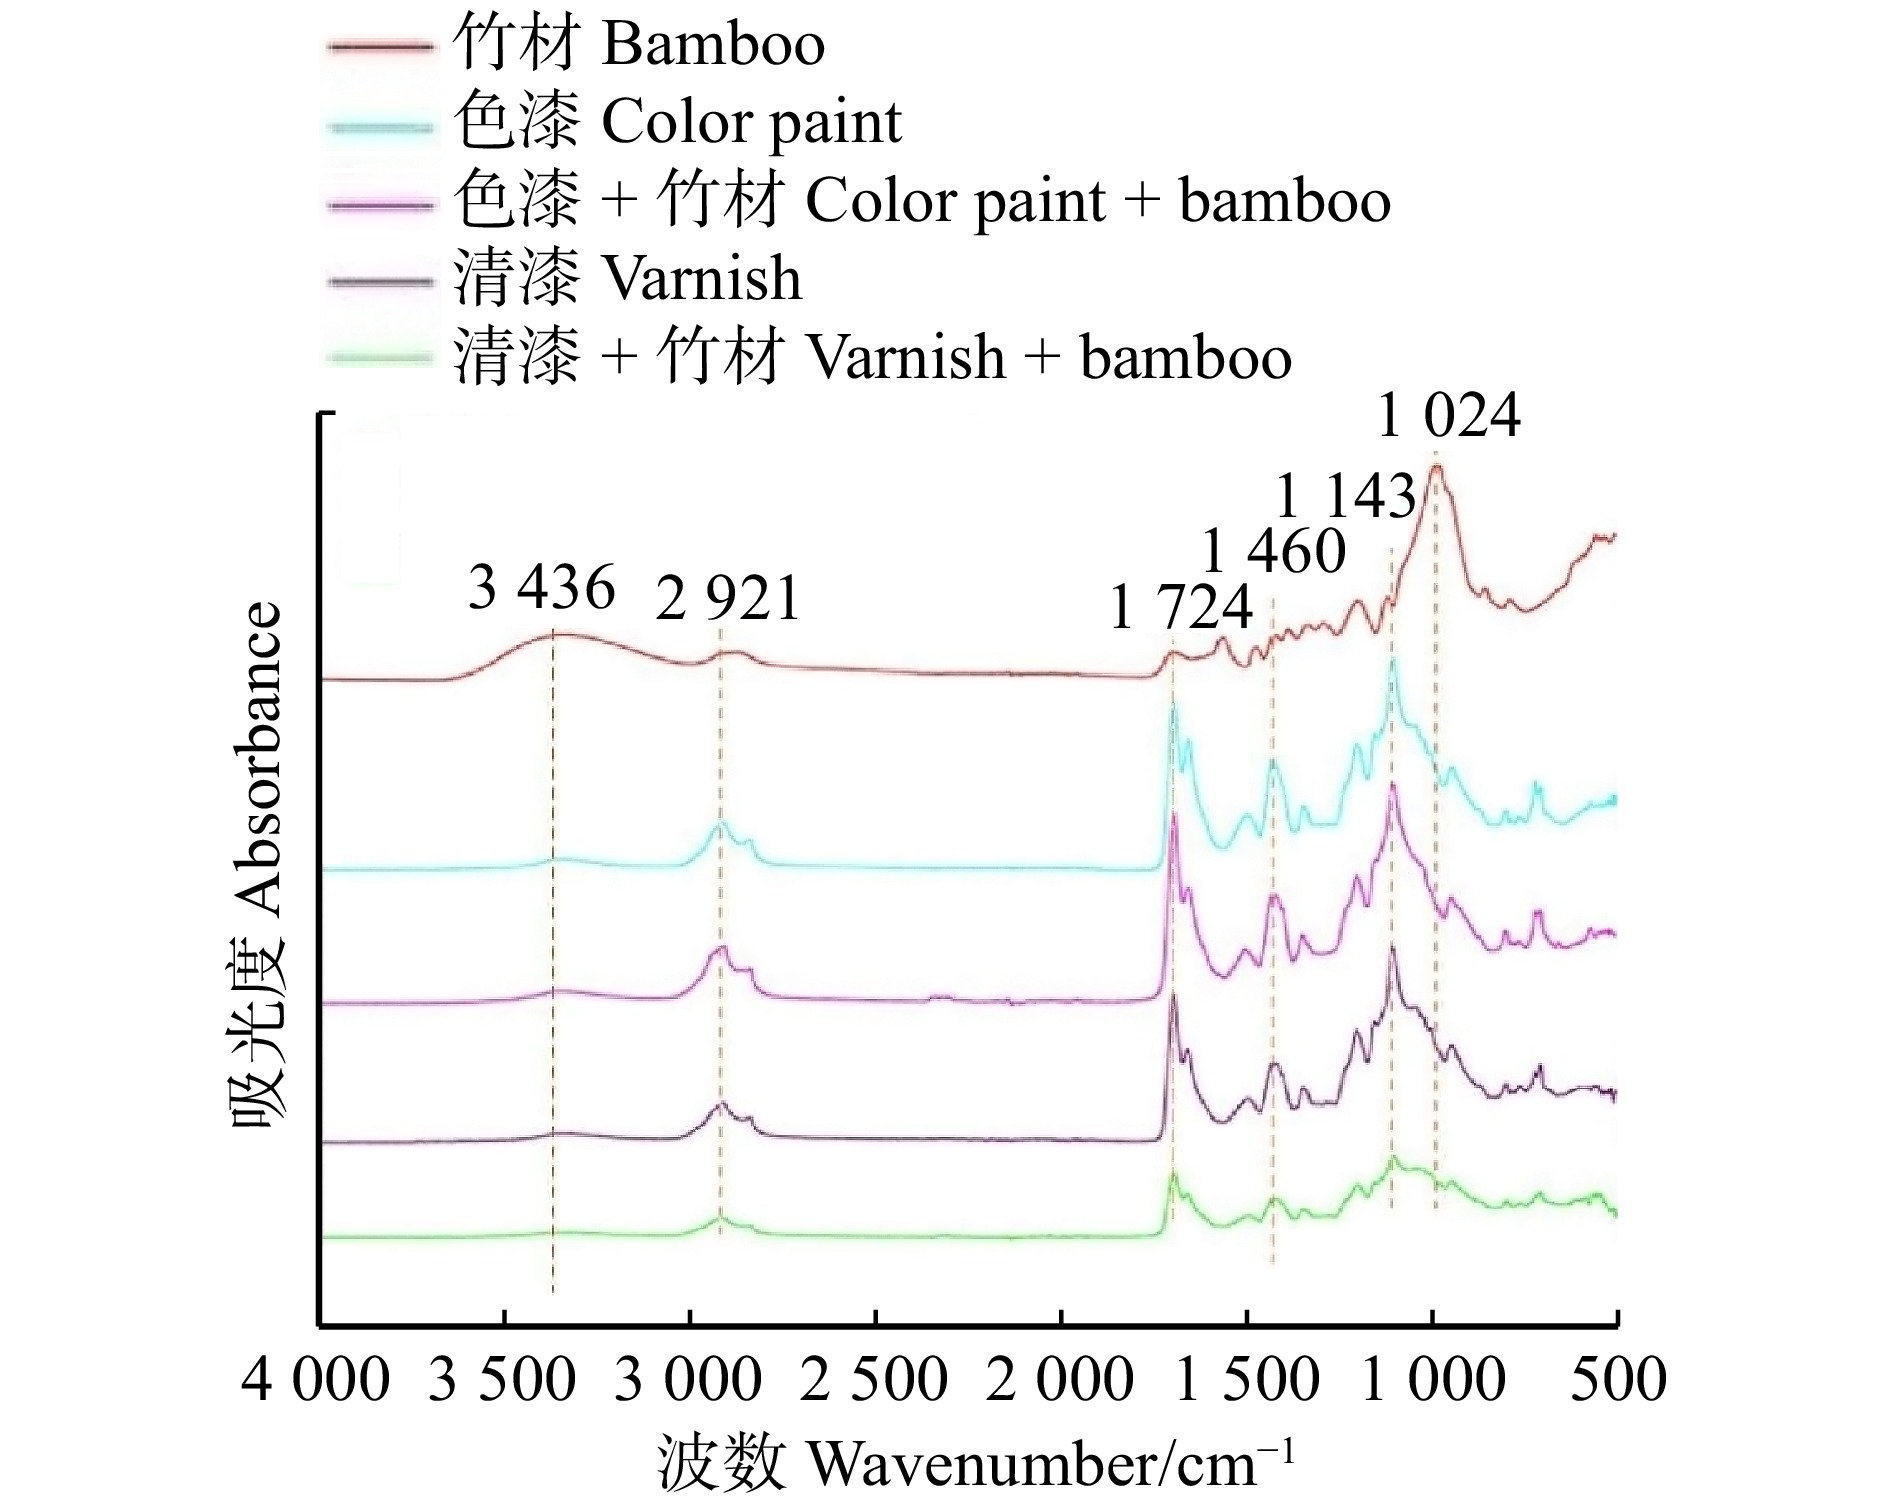
图7显示了各试样的FTIR,可以看出:3 436 cm−1处吸收峰是由−OH伸缩振动引起的,与其他谱线相比,竹材谱线在这一位置的峰值明显最强,且涂饰后色漆和清漆在1 724 cm−1处(C=O的拉伸振动特征峰)的强度分别较纯色漆与清漆小得多,在1 143 cm−1处(酯基中C−O伸缩振动峰)的峰值比竹材谱线的更强,说明水性漆中的极性分子(如羧基、羟基)与基材中的羟基结合后,水性底漆中的羧基与基材中的羟基发生了酯化反应,两者之间形成了氢键使结合更加稳固[22-23]。此外色漆在2 921 cm−1(−CH2反对称伸缩振动峰)、1 724 cm−1(C=O的拉伸振动特征峰)、1 460 cm−1(−CH2弯曲振动峰)、1 143 cm−1(C−O伸缩振动)处的峰值均比清漆所在的峰值高,这是由于色漆中相应的基团的占比比清漆中的高。所以水性底漆除物理结合外,还会与基材发生化学反应,使成膜物能很好地附着在竹集成材表面。
![]() 图 7 水性漆与竹集成材涂饰前后的红外表征Figure 7. Infrared characterization of waterborne paint and bamboo laminated lumber before and after painting
图 7 水性漆与竹集成材涂饰前后的红外表征Figure 7. Infrared characterization of waterborne paint and bamboo laminated lumber before and after painting3. 结 论
本研究所获得的清漆的漆膜硬度为1H,色漆的漆膜硬度为2H。涂饰后,水性漆与竹集成材以机械互锁的物理形式和化学反应结合的形式使成膜物质能很好地附着在基材表面。由于色漆中含有颜料,清漆的附着性能优于色漆,可达最高的0级,与木材水性涂饰的附着性能相当。而颜料颗粒的存在影响了成膜的交联程度,使得色漆的表面粗糙度高于清漆。清漆和色漆涂饰后基材的光泽度提高了5倍以上,且平行纹理方向上的光泽度高于垂直纹理方向上。因色漆含有颜料,清漆涂饰前后总色差值较低,较好地保持了竹集成材本身优美的颜色。因此,本水性涂饰工艺在竹集成材上能获得较好的漆膜性能和较强的附着力,并能在很大程度上提升了竹集成材的装饰效果,为竹材及其制品的水性化涂装提供了重要的理论和技术支持。
-
![]()
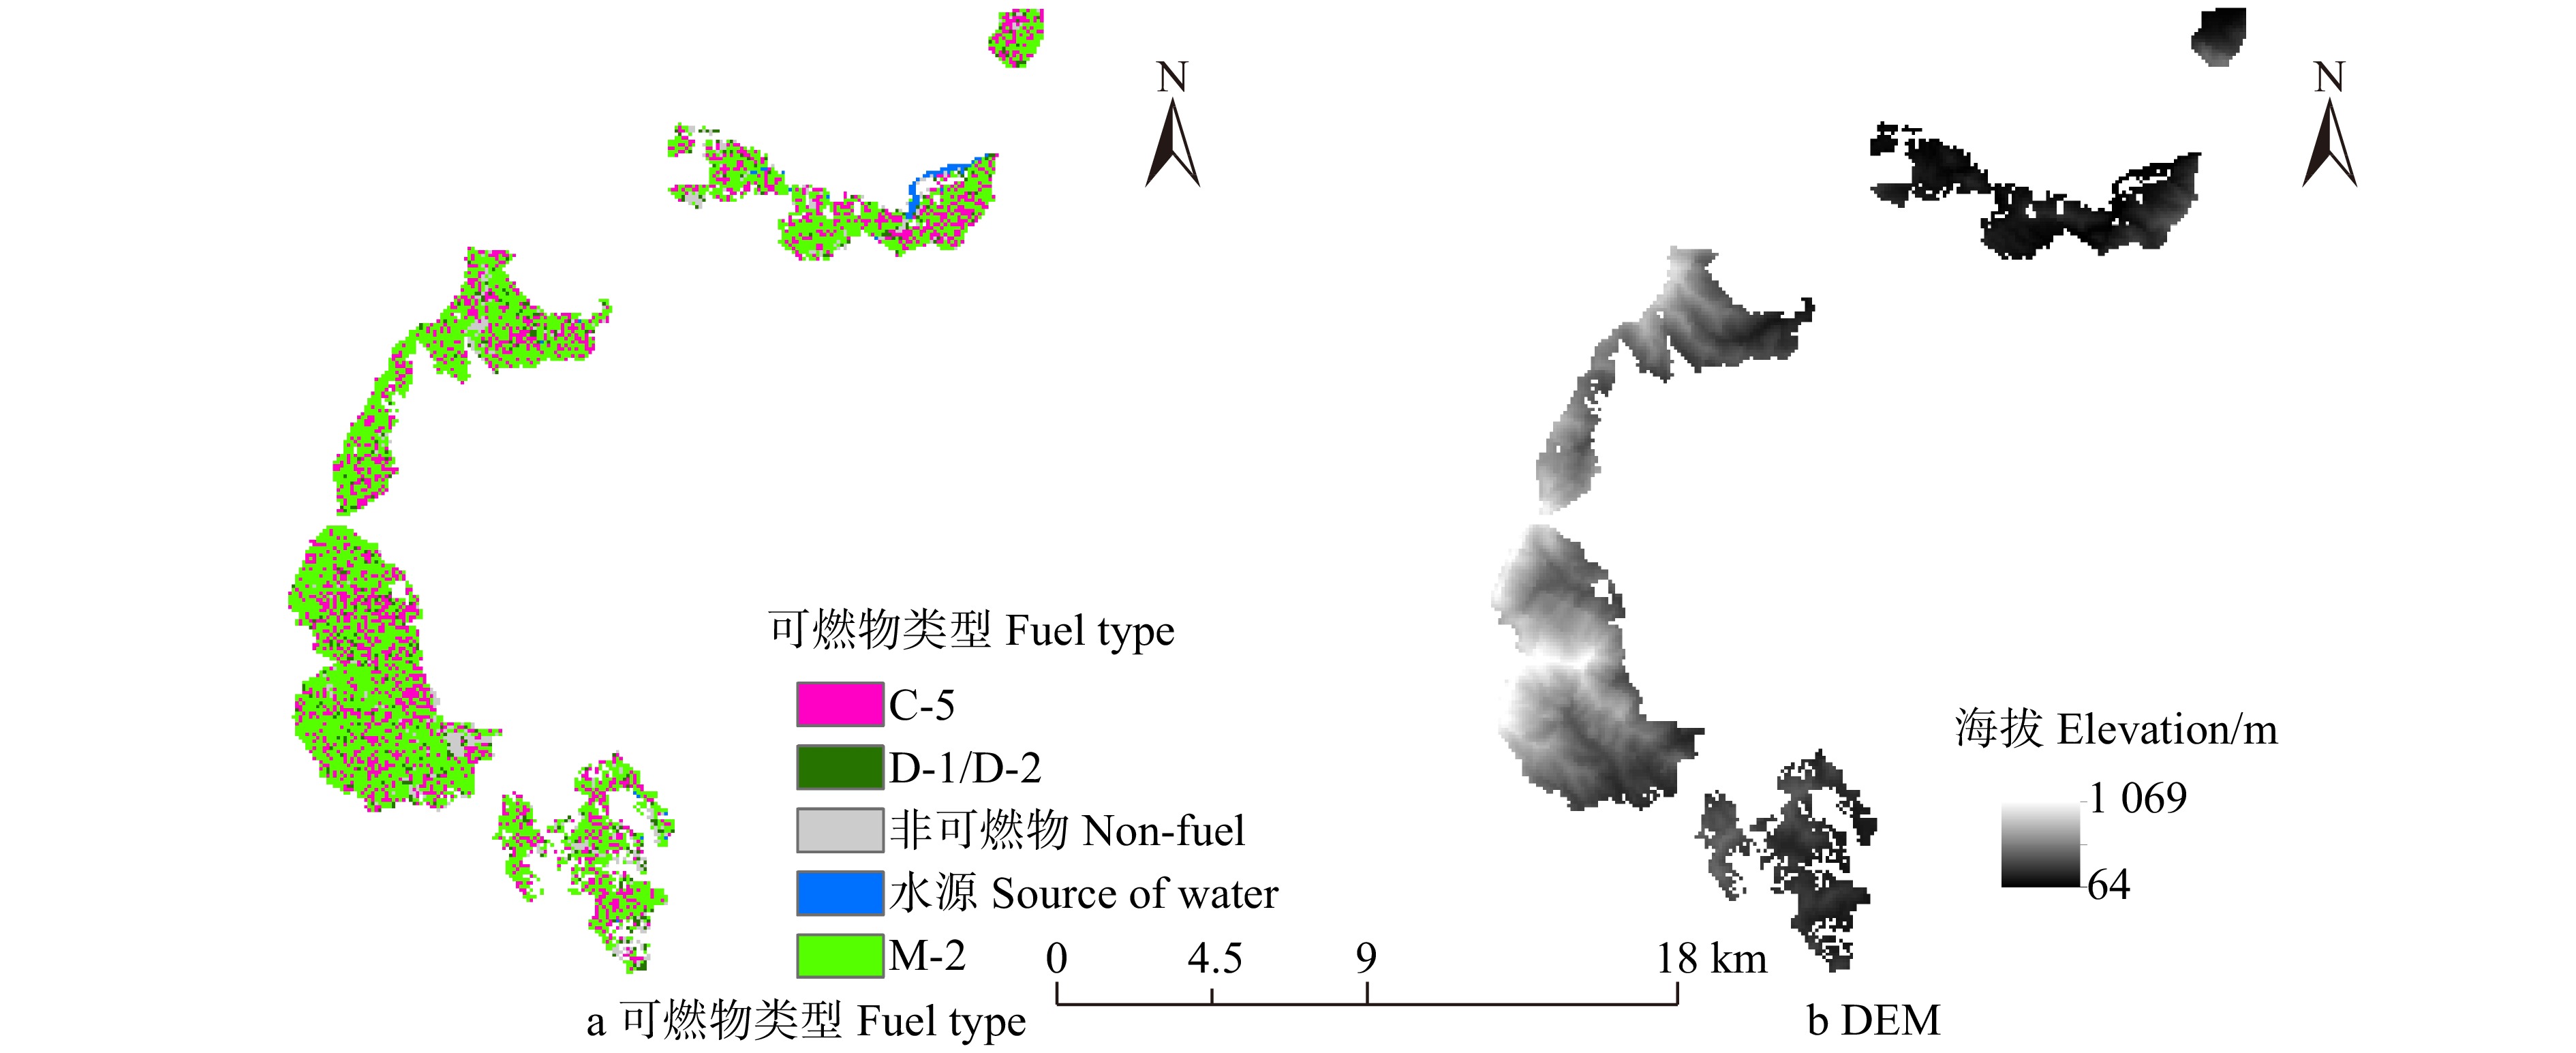
图 2 Burn-P3模型输入的可燃物类型和DEM数据
C-5.成熟的常绿针叶林;D-1/D-2.常绿及落叶阔叶林混交;M-2.由80%常绿针叶林和20%阔叶林组成的混交林。C-5, the mature evergreen coniferous forest, D-1/D-2, mixed stands with evergreen and deciduous broadleaved trees. M-2, mixed stands with 80% evergreen coniferous trees and 20% broadleaved trees.
Figure 2. Inputs of fuel types and DEM for Burn-P3 model
表 1 燃烧概率及火行为赋值
Table 1 Assignments for burn probability and fire behavior
燃烧概率 Burn probability 火强度 Fire intensity 蔓延速度 Spread speed 火类型 Fire type 赋值 Score 很低 Very low 很低 Very low 很低 Very low 地表火 Surface fire 1 低 Low 低 Low 低 Low 3 中 Moderate 中 Moderate 中 Moderate 间歇性树冠火 Intermittent crown fire 5 高 High 高 High 高 High 7 很高 Very high 很高 Very high 很高 Very high 稳进树冠火 Continuous crown fire 9  下载: 导出CSV
表 2 森林火险评估指标的权重
Table 2 Weight of the indexes for forest fire risk assessment
B层指数
Index in B layerB层权重
Weight of index
in B layerC层指标
Index in C layerC层相对B层权重
Weight of index in
C layer to B layerC层相对目标层权重
Weight of index in
C layer to target layer火发生可能
Burn probability0.5 燃烧概率
Burn probability1.00 0.50 火行为
Fire behavior0.4 火强度
Fire intensity0.36 0.15 蔓延速度
Rate of spread0.18 0.07 火类型
Fire type0.46 0.18 暴露性
Exposure0.1 距城镇距离
Distance to towns0.63 0.06 距水体距离
Distance to water0.37 0.04
下载: 导出CSV
表 3 各植被类型的火灾风险值
Table 3 Fire risk indexes of every forest type
林型 Forest type 燃烧概率
Burn probability火行为
Fire behavior暴露性
Exposure火险风险指数
Fire risk index针阔混交林 Coniferous and broadleaved mixed forest 0.369 0 0.320 3 0.405 4 0.354 5 常绿针叶林 Evergreen coniferous forest 0.114 2 0.006 1 0.432 5 0.103 0 阔叶林 Broadleaved forest 0.040 2 0.000 1 0.440 5 0.064 5
下载: 导出CSV
-
[1] Chuvieco E, Aguado I, Yebra M, et al. Development of a framework for fire risk assessment using remote sensing and geographic information system technologies[J]. Ecological Modelling, 2010, 221(1): 46−58. doi: 10.1016/j.ecolmodel.2008.11.017
[2] Johnston L M, Wang X, Erni S, et al. Wildland fire risk research in Canada[J]. Environmental Reviews, 2020, 28(2): 1−23.
[3] 郑忠, 高阳华, 杨庆媛, 等. 西南山地区域森林火险综合预报模型研究: 以重庆市为例[J]. 自然灾害学报, 2020, 29(1): 152−161. Zheng Z, Gao Y H, Yang Q Y, et al. Research on the construction of composite risk prediction model for forest fire in the mountainous area of southwestern China: taking Chongqing City as an example[J]. Journal of Natural Disasters, 2020, 29(1): 152−161.
[4] United Nations Office for Disaster Risk Reduction. Words into action guidelines: national disaster risk assessment hazard specific risk assessment[R]. New York: United Nations Office for Disaster Risk Reduction, 2017.
[5] Calkin D E, Cohen J D, Finney M A, et al. How risk management can prevent future wildfire disasters in the wildland-urban interface[J]. Proceedings of the National Academy of Sciences, 2014, 111(2): 746−751. doi: 10.1073/pnas.1315088111
[6] Chuvieco E, Aguado I, Jurdao S, et al. Integrating geospatial information into fire risk assessment[J]. International Journal of Wildland Fire, 2014, 23(5): 606−619. doi: 10.1071/WF12052
[7] 田晓瑞, 代玄, 王明玉, 等. 多气候情景下中国森林火灾风险评估[J]. 应用生态学报, 2016, 27(3): 769−776. Tian X R, Dai X, Wang M Y, et al. Forest fire risk assessment for China under different climate scenarios[J]. Chinese Journal of Applied Ecology, 2016, 27(3): 769−776.
[8] Woo H, Chung W, Graham J M, et al. Forest fire risk assessment using point process modelling of fire occurrence and Monte Carlo fire simulation[J]. International Journal of Wildland Fire, 2017, 26(9): 789−805. doi: 10.1071/WF17021
[9] Molaudzi O D, Adelabu S A. Review of the use of remote sensing for monitoring wildfire risk conditions to support fire risk assessment in protected areas[J]. South African Journal of Geomatics, 2019, 7(3): 222−242. doi: 10.4314/sajg.v7i3.2
[10] 颜峻, 左哲. 自然灾害风险评估指标体系及方法研究[J]. 中国安全科学学报, 2010, 20(11): 61−65. doi: 10.3969/j.issn.1003-3033.2010.11.011 Yan J, Zuo Z. Research on natural disaster risk assessment index system and method[J]. China Safety Science Journal, 2010, 20(11): 61−65. doi: 10.3969/j.issn.1003-3033.2010.11.011
[11] You W, Lin L, Wu L, et al. Geographical information system-based forest fire risk assessment integrating national forest inventory data and analysis of its spatiotemporal variability[J]. Ecological Indicators, 2017, 77: 176−184. doi: 10.1016/j.ecolind.2017.01.042
[12] Thompson M P, Calkin D E, Finney M A, et al. A risk-based approach to wildland fire budgetary planning[J]. Forest Science, 2013, 59(1): 63−77. doi: 10.5849/forsci.09-124
[13] Alcasena F J, Salis M, Ager A A, et al. Assessing landscape scale wildfire exposure for highly valued resources in a Mediterranean area[J]. Environmental Management, 2015, 55(5): 1200−1216. doi: 10.1007/s00267-015-0448-6
[14] Xi D D Z, Taylor S W, Woolford D G, et al. Statistical models of key components of wildfire risk[J]. Annual Review of Statistics and Its Application, 2017, 6(1): 1−26.
[15] Kanga S, Sharma L K, Pandey P C, et al. Forest fire modeling to evaluate potential hazard to tourism sites using geospatial approach[J]. Journal of Geomatics, 2013, 7(1): 93−99.
[16] Ajin R S, Ciobotaru A, Vinod P G, et al. Forest and wildland fire risk assessment using geospatial techniques: a case study of Nemmara forest division, Kerala, India[J]. Journal of Wetlands Biodiversity, 2015, 5: 29−37.
[17] Thompson M P, Freeborn P, Rieck J D, et al. Quantifying the influence of previously burned areas on suppression effectiveness and avoided exposure: a case study of the Las Conchas Fire[J]. International Journal of Wildland Fire, 2016, 25(2): 167−181. doi: 10.1071/WF14216
[18] Ager A A, Preisler H K, Arca B, et al. Wildfire risk estimation in the Mediterranean area[J]. Environmetrics, 2014, 25(6): 384−396. doi: 10.1002/env.2269
[19] Mitsopoulos I, Trapatsas P, Xanthopoulos G. SYPYDA: a software tool for fire management in Mediterranean pine forests of Greece[J]. Computers and Electronics in Agriculture, 2016, 121: 195−199. doi: 10.1016/j.compag.2015.12.011
[20] Noonan-Wright E K, Opperman T S, Finney M A, et al. Developing the US wildland fire decision support system[J]. Journal of Combustion, 2011, 2011: 1−14.
[21] Massada A B, Radeloff V C, Stewart S I, et al. Wildfire risk in the wildland-urban interface: a simulation study in northwestern Wisconsin[J]. Forest Ecology and Management, 2009, 258(9): 1990−1999. doi: 10.1016/j.foreco.2009.07.051
[22] Beverly J L, Mcloughlin N. Burn probability simulation and subsequent wildland fire activity in Alberta, Canada: implications for risk assessment and strategic planning: reply to Parisien et al. [J/OL]. Forest Ecology and Management, 2020, 460: 117819[2021−05−19]. https://doi.org/10.1016/j.foreco.2019.117819.
[23] Carmel Y, Paz S, Jahashan F, et al. Assessing fire risk using Monte Carlo simulations of fire spread[J]. Forest Ecology and Management, 2009, 257(1): 370−377. doi: 10.1016/j.foreco.2008.09.039
[24] Oban H O, Erdin C. Forest fire risk assessment using GIS and AHP integration in Bucak forest enterprise, Turkey[J]. Applied Ecology and Environmental Research, 2020, 18(1): 1567−1583. doi: 10.15666/aeer/1801_15671583
[25] Mhawej M, Faour G, Abdallah C, et al. Towards an establishment of a wildfire risk system in a Mediterranean country[J]. Ecological Informatics, 2016, 32: 167−184. doi: 10.1016/j.ecoinf.2016.02.003
[26] Parisien M A, Dawe D A, Miller C, et al. Applications of simulation-based burn probability modelling: a review[J]. International Journal of Wildland Fire, 2020, 28(12): 913−926.
[27] 宗学政, 田晓瑞, 田恒, 等. 计划火烧对区域森林燃烧性的影响[J]. 林业科学研究, 2020, 33(3): 19−27. Zong X Z, Tian X R, Tian H, et al. Influences of prescribed burning on regional forest burning probability[J]. Forest Research, 2020, 33(3): 19−27.
[28] 苗庆林, 田晓瑞. 多气候情景下大兴安岭森林燃烧性评估[J]. 林业科学, 2020, 33(3): 19−27. Miao Q L, Tian X R. Assessment of burn probability assessment in Daxing’anling under multi-climatic scenarios[J]. Scientia Silvae Sinicae, 2020, 33(3): 19−27.
[29] 陈宏伟, 胡远满, 常禹, 等. 呼中林区不同森林采伐方式对林火的长期影响模拟[J]. 北京林业大学学报, 2011, 33(5): 13−19. Chen H W, Hu Y M, Chang Y, ET al. Simulating long-term effects of different harvesting modes on forest fire in Huzhong Forest Region, northeastern China[J]. Journal of Beijing Forestry University, 2011, 33(5): 13−19.
[30] Liu Z, Yang J, He H S. Studying the effects of fuel treatment based on burn probability on a boreal forest landscape[J]. Journal of Environmental Management, 2013, 115: 42−52.
[31] Reimer J, Thompson D K, Povak N. Measuring initial attack suppression effectiveness through burn probability[J]. Fire, 2019, 2(4): 60. doi: 10.3390/fire2040060
[32] 刘兴朋, 张继权, 范久波. 基于历史资料的中国北方草原火灾风险评价[J]. 自然灾害学报, 2007, 1: 61−65. doi: 10.3969/j.issn.1004-4574.2007.04.010 Liu X P, Zhang J Q, Fan J B. Historical data-based risk assessment of fire in grassland of northen China[J]. Journal of Natural Disasters, 2007, 1: 61−65. doi: 10.3969/j.issn.1004-4574.2007.04.010
[33] 周雪, 张颖. 中国森林火灾风险统计分析[J]. 统计与信息论坛, 2014, 29(1): 34−39. doi: 10.3969/j.issn.1007-3116.2014.01.006 Zhou X, Zhang Y. Statistical analysis of forest fire risk in China[J]. Statistics & Information Forum, 2014, 29(1): 34−39. doi: 10.3969/j.issn.1007-3116.2014.01.006
[34] 田晓瑞, 舒立福, 赵凤君, 等. 中国主要生态地理区的林火动态特征分析[J]. 林业科学, 2015, 51(9): 71−77. Tian X R, Shu L F, Zhao F J, et al. Dynamic characteristics of forest fires in the main ecological geographic districts of China[J]. Scientia Silvae Sinicae, 2015, 51(9): 71−77.
[35] 宋庆丰, 王兵, 牛香, 等. 江西大岗山低海拔常绿阔叶林物种组成与群落结构特征[J]. 生态学杂志, 2020, 39(2): 384−393. Song Q F, Wang B, Niu X, et al. The characteristic of species composition and community structure of low-altitude evergreen broad-leaved forest in Dagang Mountain, Jiangxi Province[J]. Chinese Journal of Ecology, 2020, 39(2): 384−393.
[36] Wang X, Wotton B M, Cantin A S, et al. Cffdrs: an R package for the Canadian forest fire danger rating system[J]. Ecological Processes, 2017, 6(1): 5. doi: 10.1186/s13717-017-0070-z
[37] Hirsch K G. Canadian forest fire behavior prediction (FBP) system: user’s guide [M]. Edmonton: Northern Forestry Centre, 1996.
[38] 田晓瑞, 舒立福, 阎海平, 等. 华北地区防火树种筛选[J]. 火灾科学, 2002, 11(1): 43−48. doi: 10.3969/j.issn.1004-5309.2002.01.007 Tian X R, Shu L F, Yan H P, et al. Selecting fire-resistance tree species in northern China[J]. Fire Safety Science, 2002, 11(1): 43−48. doi: 10.3969/j.issn.1004-5309.2002.01.007
[39] Parisien M A, Miller C, Ager A A, et al. Use of artificial landscapes to isolate controls on burn probability[J]. Landscape Ecology, 2010, 25(1): 79−93. doi: 10.1007/s10980-009-9398-9
[40] Wagenbrenner N S, Forthofer J, Lamb B, et al. Downscaling surface wind predictions from numerical weather prediction models in complex terrain with WindNinja[J]. Atmospheric Chemistry and Physics, 2016, 16(8): 5229−5241. doi: 10.5194/acp-16-5229-2016
[41] Wang X, Parisien M, Taylor S W, et al. Future burn probability in south-central British Columbia[J]. International Journal of Wildland Fire, 2016, 25(2): 200−212. doi: 10.1071/WF15091
[42] Pan J, Wang W, Li J. Building probabilistic models of fire occurrence and fire risk zoning using logistic regression in Shanxi Province, China[J]. Natural Hazards, 2016, 81(3): 1879−1899. doi: 10.1007/s11069-016-2160-0
[43] 马振宇, 陈博伟, 庞勇, 等. 基于林火特征分类模型的森林火情等级制图[J]. 国土资源感, 2020, 32(1): 43−50. Ma Z Y, Chen B W, Pang Y, et al. Forest fire potential forecast based on FCCS model[J]. Remote Sensing for Land & Resources, 2020, 32(1): 43−50.
[44] Zong X, Tian X, Wang X. An optimal firebreak design for the boreal forest of China [J/OL]. Science of the Total Environment, 2021, 781: 146822 [2021−12−29]. https://www.sciencedirect.com/science/article/pii/S0048969721018921. -
期刊类型引用(2)
1. 谷国泽,宋魁彦. 水性清漆涂饰对皮影表面的装饰效果. 家具. 2025(01): 19-22 .  百度学术
百度学术
2. 钟成龙,侯贤锋,卓光武,高振忠,涂登云,胡传双. 重组竹表面涂饰工艺研究. 竹子学报. 2023(02): 41-47 . 百度学术
其他类型引用(2)


计量
- 文章访问数: 1318
- HTML全文浏览量: 349
- PDF下载量: 189
- 被引次数: 4
