
Growth and biomass of two poplar clones in short rotation coppice under different densities
-
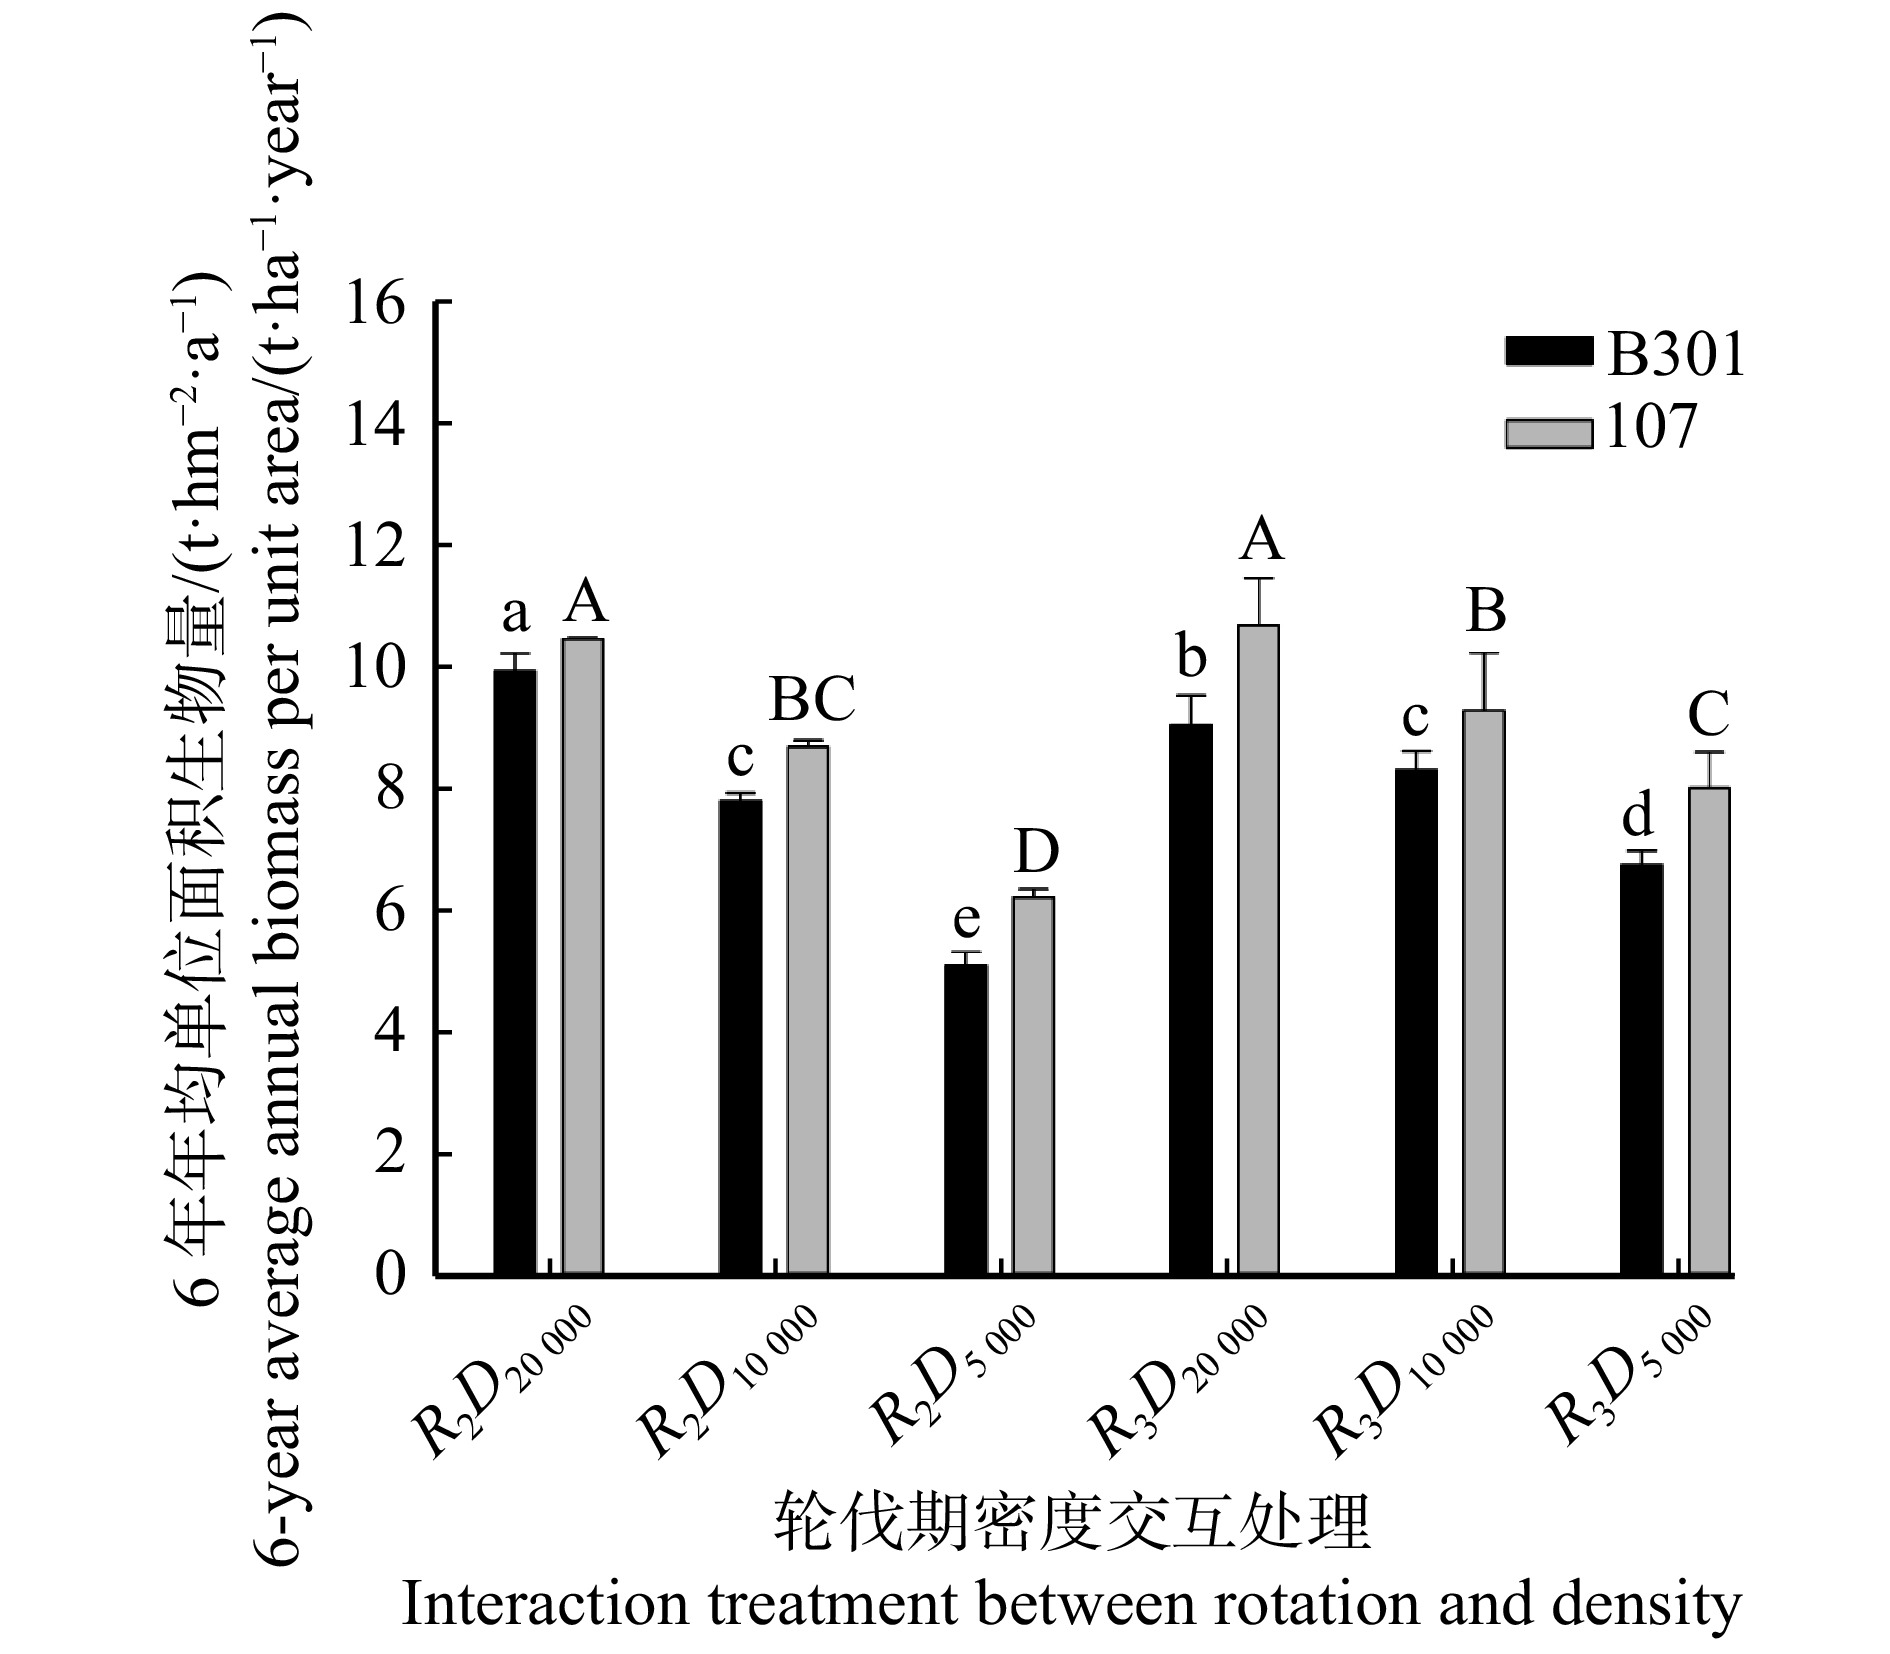
摘要:目的 在培育能源林的过程中,短轮伐期矮林(SRC)培育模式在生产力及环境上有着优良表现,并正受到各国关注,但不同栽植密度及经营方式对其生长及生产力的影响尚有许多值得深入探讨的方面。本研究旨在探究在不进行后期人工水肥管理的情况下,2种杨树短轮伐期矮林的生长和生物量差异及其可持续性。方法 本研究以种植在山东省高唐县的三倍体毛白杨B301(以下简称“B301”)和欧美杨107(以下简称“107”)为试验材料,以3种栽植密度(5 000、10 000、20 000株/hm2)和3种不同轮伐期(2、3、4年)为处理,历时6年,研究其存活率、离地22 cm处萌条直径(D22)、单株萌条数及各周期和6年间单位面积的生物量。结果 (1)2树种的存活率在2年轮伐期中较高,在栽植密度为20 000株/hm2时较低。存活率最高可达98.89%,处于B301中的2年轮伐期、10 000株/hm2栽植密度的第2次轮伐。经过6年的短轮伐管理后,2年与3年轮伐期所有处理的存活率均显著下降,B301的存活率保持在66%以上,107在58%以上。(2)2树种的D22与单株萌条数均在较小栽植密度下得到较大值,D22在较长的轮伐周期及第1次轮伐中较大,而单株萌条数在2年和3年的轮伐周期及后2次轮伐中较大。2树种D22均在4年轮伐期、5 000株/hm2、第1次轮伐的处理下最大,B301可达到5.83 cm,而107可达到7.32 cm。B301平均单株萌条数为1.10 ~ 5.52枝,107为1.14 ~ 9.55枝。107有更强的萌蘖能力。(3)华北地区以本试验条件所栽植短轮伐期矮林的生产力:单个轮伐周期内B301的年均单位面积生物量为3.36 ~ 13.42 t/(hm2·a),107为4.58 ~ 14.45 t/(hm2·a)。在6年时间内B301的单位面积年均生物量为5.10 ~ 9.95 t/(hm2·a),107则为6.22 ~ 10.69 t/(hm2·a);B301单位面积总生物量为30.63 ~ 59.68 t/hm2,107为37.32 ~ 64.17 t/hm2。结论 (1)在未进行人工水养管理的情况下,2种杨树短轮伐期矮林在第1次轮伐时生产力最高,之后随轮伐次数增加生产力下降。(2)在该地区培育短轮伐期矮林,若要取得较高生产力,107整体上优于B301。(3)考虑到实际经营中栽植和管理成本,3年轮伐期、10 000株/hm2是这2种杨树较为适宜的轮伐期与栽植密度。
-
关键词:
- 短轮伐期 /
- 栽植密度 /
- 三倍体毛白杨B301 /
- 欧美杨107 /
- 生产力
Abstract:Objective In the cultivation process of energy forest, the cultivation pattern of short rotation coppice (SRC) has attracted attention from various countries due to its excellent performance in productivity and environment. However, the influence of different planting densities and management modes on its growth and productivity still needs further discussion. The purpose of this study was to investigate the difference in growth, productivity, and sustainability of two poplar clones’ short rotation coppice without later artificial water and fertilizer management.Method (P. tomentosa × P. bolleana) × P. tomentosa (hereinafter referred to as “B301”) and Populus × euramericana cv.‘74/76’ (hereinafter referred to as “107”) planted in Gaotang County, Shandong Province of eastern China were used as experimental materials, with three planting densities (5 000, 10 000, 20 000 plant/ha) and three different rotation cycles (2, 3, 4 years). It took 6 years to study the survival rate, shoot diameter (D22) at 22 cm aboveground, number of shoots per plant, and biomass per unit area during each cycle and during 6 years.Result (1) The survival rate of the two species was higher in two-year rotation cycle, and lower in the planting density of 20 000 plant/ha. The maximum value of survival rate was 98.89%, which appeared in the second round of B301 of 2-year rotation and the planting density of 10 000 plant/ha. After six years of short-rotation management, the survival rate decreased significantly in all treatments of two- and three- year rotation cycle, with the survival rate of B301 remained above 66%, and that of 107 above 58%. (2) Both the average D22 and the average stoop per stump of the two clones were larger in the lower planting density. The average D22 was larger in the longer rotation and the first rotation, while the average stoop per stump was larger in the 2- and 3-year rotation and the last two rotations. The largest average D22 of the two clones appeared in the first rotation of the four-year rotation and the planting density of 5 000 plant/ha. It could reach 5.83 cm in B301, while it could reach 7.32 cm in 107. The average stoop per stump of B301 ranged from 1.10 to 5.52, and that of 107 ranged from 1.14 to 9.55, and 107 has better resprout capacity. (3) Productivity of short-rotation coppice planted under this experimental conditions in North China: in a single rotation cycle, the average annual biomass per unit area was 3.36−13.42 t/(ha·year) for B301 and 4.58−14.45 t/(ha·year) for 107. During 6 years, the average annual biomass per unit area of B301 ranged from 5.10 to 9.95 t/(ha·year), while that of 107 ranged from 6.22 to 10.69 t/(ha·year). The total biomass per unit area was 30.63 − 59.68 t/ha for B301 and 37.32 − 64.17 t/ha for 107.Conclusion (1) Without artificial water and fertilizer management, the productivity of 2 species of short-rotation poplar coppice is the highest at the first rotation, and declines with the increase of the number of rotations. (2) To build SRC in this region, 107 is superior to B301 on the whole in order to obtain higher productivity. (3) Considering the actual planting and management costs in operation, the rotation period of 3 years and the plant density of 10 000 plant/ha are the more suitable rotation and planting density for these two poplar clones. -
有数据显示,全球陆地土壤碳含量为1 750 Pg,植被碳含量为550 Pg,总量约为大气碳含量的3倍[1],即无论土壤作为“碳源”还是“碳汇”都将对气候变化产生巨大影响,故在全球气候变化和生态扰动背景下,陆地生态系统有机碳(SOC)分布与动态变化受到广大学者的广泛重视。尤其表层土壤,是SOC的集中分布层,其SOC含量更显著的受到微地形[2]、植被类型[3-4]、枯落物数量[5-6]、人为扰动[7]等因素的影响,使其在空间分布上具有更强的异质性,而成为研究者关注的一个焦点。
在不同空间尺度上,SOC分布的异质性为SOC储量的科学估算及关键影响因素的研究提出了挑战,故随着地统计分析工具的出现,广大学者采用地统计学的方法针对不同生态类型、空间尺度等条件下SOC的分布特征及空间变异性进行了研究,并表明地统计学是研究SOC空间分布的一种有效工具[8]。如Gao等[9]基于地统计方法研究得出中国北方丘陵地区SOC的空间异质性受随机性和结构性因素的共同控制。Göl等[10]研究发现球状模型可以很好地模拟黑海不同土地利用方式SOC的空间分布。SOC的空间分布还具有尺度效应[11],然而在区域、县域等大、中尺度下的空间分布与预测往往简化了某些生态过程,可能增加碳研究的不确定性[12],相比之下,小尺度下的空间预测反映的信息量更加丰富[13],因此揭示小尺度SOC的空间分布格局及其影响因素对于精确估算SOC含量是必要的。
青藏高原属于典型的生态脆弱区和气候变化的敏感区,在全国乃至全球都具有重要的生态地位。近年来,随着交通不断便利,不少学者开展了青藏高原土壤碳循环研究,如王建林等[14]关于草地土壤化学计量特征的大尺度空间分布研究,从宏观上了揭示青藏高原的土壤养分状况。叶成龙等[15]人基于野外定点试验和室内试验的研究表明,氮输入将增加预测青藏高原高寒草甸地区土壤碳排放的不确定性。其他研究如吕韶利[16]、刘合满[17]等,研究结果为高寒地区土壤碳循环研究奠定了丰富的理论和技术参考。青藏高原地形、植被、气候等具有显著的差异,导致SOC含量具有高度的空间异质性,然而目前针对SOC的空间分布与模拟研究仍少见报道,尤其是在小尺度空间范围,这将阻碍我们对于青藏高原这一特殊生态系统土壤碳动态变化的认识。为科学阐明高寒地区典型植被类型表层SOC及SOCD的空间分布特征与影响因素,本研究以西藏东南部色季拉山西坡广泛分布的草甸和杜鹃灌丛土壤为研究对象,采用地统计分析方法,旨在阐明小尺度下不同植被类型SOC及SOCD的空间变异及格局,以期为高寒环境下土壤有机碳循环研究及土壤碳储量的准确估算提供理论支撑。
1. 研究区概况与研究方法
1.1 研究区概况
本研究以色季拉山西坡相邻分布的灌丛、草甸为研究样地,其海拔4 200 ~ 4 400 m,地理位置29°36′N、94°38′E。根据色季拉山道班阴坡林外(29°35′51″N,94°36′43″E,4 390 m)2005 — 2012年的观测数据,该区域年均气温约为0.64 ℃,年均相对湿度为77%,年降雨量为877 mm。土壤类型属于亚高山林灌草甸土、沼泽草甸土[18]。
本研究所选样区主要包含苔草高寒草甸(Carex alpine meadow,CAM)、林芝杜鹃灌丛(Rhododendron tanastylum shrub,RTS)、雪山杜鹃灌丛(Rhododendron aganniphum shrub,RAS)3种植被类型。苔草高寒草甸,地面以苔草为建群种,其中还分布有委陵菜(Potentilla chinensis)、老鹳草(Geranium wilfordii)、阜莱氏马先蒿(Pedicularis fletcherii)、西藏糙苏(Phlomis tibetica)、偃卧繁缕(Stellaria decumbens)、蒲公英(Taraxacu mmongolicum)等,地面凹凸不平,存在沟壑。林芝杜鹃灌丛是以林芝杜鹃(Rhododendron tanastylum)为优势种,红枝小檗(Berberis erythroclada)和雪层杜鹃(Rhododendron nivale)为亚优势种的灌草丛地,植被分布不均一。雪山杜鹃灌丛主要生长雪山杜鹃(Rhododendron aganniphum),并伴有高山柏(Sabina squamata)和急尖长苞冷杉(Abies georgei var. smithii)零星分布,地面有较厚的枯落物层(最厚可达10 cm)。样地概况如表1所示。
表 1 样地基本概况Table 1. Basic condition of sample plots植被类型
Vegetation
type海拔
Altitude/m植被盖度
Vegetation
coverage/%坡度
Slope/(°)全氮
Total nitrogen
(TN)/(g·kg−1)全磷
Total phosphorus
(TP)/(g·kg−1)pH 含水率
Water
content/%土壤密度
Soil density/
(g·cm−3)黏粒
Clay/%粉粒
Silt/%砂粒
Sand/%CAM 4242 95 16 6.54 1.12 5.59 55.37 0.81 3.82 62.76 33.42 RTS 4264 75 14 3.29 0.39 5.47 72.01 0.82 3.55 61.45 35.00 RAS 4387 > 95 25 5.48 0.37 4.30 72.62 0.46 3.19 62.07 34.75 注:CAM为苔草高寒草甸;RTS为林芝杜鹃灌丛;RAS为雪山杜鹃灌丛。黏粒粒径< 0.002 mm,粉粒粒径在0.002~0.05 mm之间,砂粒粒径在0.05~2 mm之间。下同。Notes: CAM is Carex alpine meadow; RTS is Rhododendron tanastylum shrub; RAS is Rhododendron aganniphum shrub. Clay particle size is less than 0.002 mm; silt particle size is between 0.002−0.05 mm; sand particle size is between 0.05−2 mm. The same below. 1.2 样品采集与处理
于2018年10月,在野外考察的基础上,选择坡度较缓,植被类型连续的区域作为研究区(图1),采用10 m × 10 m网格法采样。即在3种植被类型区采用测量绳分别划定一个50 m × 50 m的样地,然后按照10 m × 10 m网格设置采样点,共计36个采样点。分别采集0 ~ 10 cm层次土壤和原状土壤样品,共获得土壤样品和环刀土样各108个,详细记录每一采样点的地形(海拔、坡度、坡位、凸起、沟壑)、植被覆盖等信息。采集的样品去杂置于风干盘自然风干后,经研磨使其分别通过2.00、0.25 mm土壤筛,用以测定土壤碳、氮等理化性质。SOC采用重铬酸钾容量−外加热法测定,全氮(TN)采用半微量凯氏法测定,全磷(TP)采用钼锑抗比色法测定,土壤密度、机械组成分别采用环刀法和激光粒度分布仪(Bettersize2000,丹东百特仪器有限公司)测定,以上实验过程参照文献[19-20]进行。
1.3 土壤有机碳密度计算
SOCD的计算采用如下公式:
SOCD=CDE(1−G)/100 式中:
C 为有机碳含量(g/kg),D 为土壤密度(g/cm3),E 为土层厚度(cm),G 为直径 > 2 mm石砾百分含量(%),这里忽略G 后计算SOCD[21]。1.4 数据处理与分析
在SPSS 22.0中计算SOC及SOCD的最大值、最小值、平均值、标准差、变异系数(Coefficient of variation, CV),其中CV值在0 ~ 10%、10% ~ 100%和 > 100%之间时,分别属于弱、中等和强变异。对不同植被类型SOC、SOCD的差异显著性检验采用LSD法(P < 0.01)。在GS+ 9.0中建立半方差函数模型,模型拟合可以得到块金值(C0)、基台值(C0 + C)、变程(A0)3个评价空间变异程度的参数,其中块金值与基台值的比值(C0/(C0 + C))即结构比,反映了随机性因素引起的空间变异占系统总变异的比值,比值在 < 25%、25% ~ 75%、> 75%范围,分别表示强、中、弱的空间自相关性,随机性因素引起的空间变异逐渐增大[22],变程反映了区域化变量存在空间自相关性的距离上限。基于半方差函数模型,在ArcGIS10.2中完成克里格插值。冗余分析采用Canoco 5.0进行,并采用Forward selection和Monte Carlo permutation test进行环境因子重要性排序和显著性检验。
2. 结果与分析
2.1 SOC及SOCD的分布特征
不同植被类型的SOC、SOCD差异显著(P < 0.01)(表2),SOC含量表现为RAS(146.45 g/kg) > CAM(95.60 g/kg) > RTS(60.43 g/kg),RAS分别较CAM和RTS的SOC含量高53.19%、142.35%,SOCD表现为CAM(7.34 kg/m2) > RAS(6.32 kg/m2) > RTS(4.80 kg/m2),CAM分别较RAS和RTS高22.31%、61.04%。该研究区SOC和SOCD均具有中等程度的空间变异。
表 2 SOC及SOCD的描述性统计特征Table 2. Descriptive statistics of SOC and SOCD指标
Item植被类型
Vegetation type样本量
Sample size平均值
Mean最大值
Max.最小值
Min.变异系数
CV/%P 分布类型
Distribution typeSOC/(g·kg−1) CAM 33 95.60 ± 44.31b 219.85 49.63 46.35 0.169 N RTS 36 60.43 ± 25.73a 148.31 24.01 42.58 0.359 N RAS 36 146.45 ± 49.67c 252.15 69.10 33.92 0.500 N SOCD/(kg·m−2) CAM 36 7.73 ± 2.39c 12.77 4.50 30.92 0.538 L RTS 36 4.80 ± 2.01a 8.92 1.90 41.88 0.943 N RAS 36 6.32 ± 1.98b 11.22 1.53 31.33 0.747 N 注:不同小写字母表示植被类型之间SOC或SOCD差异显著(P < 0.01)。N为正态分布;L为对数正态分布。Notes: different lowercase letters indicate significant differences in SOC or SOCD between vegetation types (P < 0.01). N means normal distribution; L means lognormal distribution. 在K-S检验结果如表2所示,CAM的SOC在剔除3个异常值后符合正态分布,SOCD则符合对数正态分布,RTS及RAS的SOC和SOCD均符合正态分布。
2.2 SOC及SOCD的空间自相关性
本研究以最大间距的1/2(35.56 m)为样本变化范围,以最小间距(10 m)为步长,并以平均预测误差(ME)最接近于0,决定系数(R2)和均方根标准预测误差(RMSSE)最接近于1交叉验证模型精度,最优模型如图2所示。
在不考虑各向异性的前提下,除RAS外,CAM和RTS的SOC、SOCD均得到了较好的拟合(表3)。CAM、RTS的SOC最优拟合为球状模型(spherical model),R2分别达0.998、0.432,ME依次为3.268、0.506,RMSSE为0.920、1.057;RAS的SOC最佳拟合模型为线性模型(linear model),R2为0.091,拟合效果较差。3种植被类型SOCD的拟合效果均较好,CAM、RTS及RAS分别符合指数模型(exponential model)、球状模型和线性模型,R2达0.965、0.864和0.996,ME在−0.145 ~ 0.021之间,RMSSE在1.017 ~ 1.059之间。
表 3 不同植被类型SOC及SOCD半方差函数模型及交叉验证Table 3. Semivariogram and cross-validation of SOC and SOCD under different vegetation types指标
Item植被类型
Vegetation
type理论模型
Theoretical model块金值
Nugget
(C0)基台值
Sill
(C0 + C)结构比
Structure ratio
(C0/(C0 + C))/%变程
Range (A0)/
m决定系数
Determination
coefficient (R2)预测误差 Prediction error ME RMSSE SOC CAM 球状模型 Spherical model 25.00 1716.00 1.46 30.29 0.998 −3.268 0.920 RTS 球状模型 Spherical model 58.00 721.30 8.04 17.68 0.432 0.506 1.057 RAS 线性模型 Linear model 2338.32 2338.32 100.00 32.69 0.091 −1.009 1.068 SOCD CAM 指数模型 Exponential model 0.01 4.67 2.14 20.31 0.965 −0.145 1.042 RTS 球状模型 Spherical model 0.58 4.64 12.51 17.44 0.864 0.021 1.059 RAS 线性模型 Linear model 4.00 4.00 100.00 32.69 0.996 −0.065 1.017 从结构比来看,除RAS外,其他植被类型的SOC及SOCD均具有强烈的空间自相关性。CAM与RTS的SOC结构比分别为1.46%、8.04%,SOCD结构比分别为2.14%、12.51%,即CAM < RTS < 25%,结构性因素引起的空间变异大于75%,具有较强的空间依赖性。RAS的SOC及SOCD块金值等于基台值,结构比达100%,属于纯块金方差,空间自相关性较弱,随机性因素控制为主。
从变程来看,SOC、SOCD的空间变异尺度存在差异,反映出不同程度的空间连续性。3种植被类型SOC的变程表现为RAS(32.69 m) > CAM(30.29 m) > RTS(17.68 m),SOCD为RAS(32.69 m) > CAM(20.31 m) > RTS(17.44 m),即SOC、SOCD的空间连续性从RAS、CAM到RTS逐渐变差。除RNS外,CAM和RTS的空间变程均表现为SOC > SOCD,即SOC可能较SOCD具有更大的空间自相关距离,在考察SOC含量时的采样可以适当加大采样间距。
2.3 SOC及SOCD的空间分布
本研究RAS的SOC及SOCD空间上主要受随机因素控制,故不适合做空间插值[23]。CAM及RTS的SOC及SOCD的空间分布如图3所示。总体而言,SOC及SOCD呈斑状或条带状分布,并且同一植被类型的SOC与SOCD空间分布相似。其中CAM的SOC、SOCD高值区集中分布在样地南部和东部边缘,分别在90.29 ~ 219.85 g/kg、8.05 ~ 14.05 kg/m2之间,并且由北部、西部边缘向中部延伸分别形成两个低值分布带,值在49.63 ~ 90.29 g/kg、8.05 ~ 14.50 kg/m2之间。RTS的SOC、SOCD具有相似的高低值分布区,高值区SOC、SOCD分别为56.63 ~ 148.31 g/kg、5.31 ~ 13.09 kg/m2范围,低值区分别在24.01 ~ 56.63 g/kg和2.67 ~ 5.31 kg/m2范围,但与CAM相比,RTS的SOC及SOCD均未表现出明显的边缘效应,而呈高低值交错分布的特征,空间连续性较差。
![]() 图 3 SOC及SOCD的水平分布格局Figure 3. Horizontal distribution patterns of SOC and SOCD under different vegetation types
图 3 SOC及SOCD的水平分布格局Figure 3. Horizontal distribution patterns of SOC and SOCD under different vegetation types2.4 SOC和SOCD与土壤因子的相关性分析
如图4所示,RDA排序图的典型轴1和轴2解释了SOC、SOCD与土壤性质总体变异的58.2%。土壤含水率、TN在SOC箭头连线上的投影长度最长,表明其与SOC呈较强的正相关性,土壤密度、pH在SOC箭头反向延长线上的投影较长,表明二者与SOC呈较强的负相关性,而土壤机械组成、坡度、TP与SOC的相关性不大。SOCD与SOC呈正相关性,但与土壤各性质的相关性不如SOC显著,主要与TP、TN的关系较为密切。
![]() 图 4 SOC及SOCD与土壤因子相关性的冗余分析排序图SOC. 土壤有机碳;SOCD. 土壤有机碳密度;TN. 全氮;TP. 全磷;Water content. 含水率;Soil density. 土壤密度;Slope. 坡度;Clay. 黏粒;Silt.粉粒;Sand. 砂粒。SOC, soil organic carbon.; SOCD, soil organic carbon density; TN, total nitrogen; TP, total phosphorus.Figure 4. Redundancy analysis on the correlation between SOC and SOCD with soil properties
图 4 SOC及SOCD与土壤因子相关性的冗余分析排序图SOC. 土壤有机碳;SOCD. 土壤有机碳密度;TN. 全氮;TP. 全磷;Water content. 含水率;Soil density. 土壤密度;Slope. 坡度;Clay. 黏粒;Silt.粉粒;Sand. 砂粒。SOC, soil organic carbon.; SOCD, soil organic carbon density; TN, total nitrogen; TP, total phosphorus.Figure 4. Redundancy analysis on the correlation between SOC and SOCD with soil properties由表4可知,各土壤因子对SOC、SOCD的影响存在一定差异。各土壤因子对SOC、SOCD影响的重要性排序从大到小依次为含水率 > 土壤密度 > pH > TN > 黏粒 > 砂粒 > 粉粒 > 坡度 > TP,除TP对SOC、SOCD的影响未达显著水平外(P > 0.05),其他土壤因子对SOC、SOCD的影响均达极显著水平(P < 0.01),其中含水率、土壤密度和pH因子对SOC、SOCD空间变异的贡献率较高,分别为69.60%、65.70%、53.50%,其次是TN和黏粒,贡献为44.20%和30.10%。表明土壤含水率、土壤密度、pH是影响研究区SOC、SOCD空间分布的关键因素。
表 4 土壤因子解释量及显著性检验Table 4. Explanation rate and significance test of soil factors土壤因子
Soil
factor重要性排序
Importance
ranking因子解释量
Factor explanation
rate/%F P 含水率 Water content 1 69.60 98.40 0.002 土壤密度 Soil density 2 65.70 88.30 0.002 pH 3 53.50 62.10 0.002 全氮 TN 4 44.20 46.60 0.002 黏粒 Clay 5 30.10 27.80 0.002 砂粒 Silt 6 17.50 14.60 0.002 粉粒 Sand 7 15.80 13.00 0.002 坡度 Slope 8 12.50 10.00 0.004 全磷 TP 9 0.20 0.10 0.740 3. 讨 论
3.1 植被类型对SOC和SOCD的影响
本研究中植被类型显著影响了表层0 ~ 10 cm土壤有机碳含量(P < 0.01),与前人研究结果一致[24-25]。表层SOC含量为RAS > CAM > RTS,与植被覆盖度规律一致(表1),即RAS(> 95%) > CAM(95%) > RTS(75%)。这是因为自然生态系统植被枯落物是表层土壤有机碳的重要来源,并与植被覆盖度显著正相关。研究区SOC含量处于较高水平,均值达100.97 g/kg,显著高于全国0 ~ 10 cm土壤水平(24.56 g/kg)[26]。与相似生态类型区比较,CAM的SOC(95.60 g/kg)亦高于青海省河南县杂类草型草甸(74.99 g/kg)[27]和江西省武功山草甸(63.52 g/kg)[28],两种灌丛SOC的平均含量(103.44 g/kg)亦显著高于燕山北部绣线菊(Spiraea salicifolia)灌丛(37.65 g/kg)和榛子(Corylus heterophylla)灌丛(64.74 g/kg)[29]。这可能与低温抑制酶活性、减缓土壤有机质的矿化分解有关[30],该区域年均气温仅0.64 ℃,且降水丰富,年降雨达877 mm,有利于表层有机质的积累。SOCD与SOC的表现基本一致,CAM(7.73 kg/m2)、RTS(4.8 kg/m2)和RAS(6.32 kg/m2)的SOCD显著高于全国10 cm土壤厚度的SOCD(1.21 kg/m2)[31],表明色季拉山高海拔区土壤有机碳储量较丰富,可能成为未来大气CO2浓度升高的潜在碳源。
3.2 SOC及SOCD的空间异质性
本研究小空间尺度上,植被类型影响了表层土壤有机碳的空间分布与变异特征。SOC和SOCD的空间变异半方差函数分析结果表明,拟合度以CAM最佳,其次为RTS,而RAS则较差。这可能是由于小空间尺度上RAS地表地形及植被、枯落物等基本立地条件较为破碎有关,故可能需要增加采样点或缩小采样间距[32]。结构比反映了引起变量空间异质性的主要影响因素,本研究中CAM、RTS的SOC、SOCD结构比均小于13%,由结构性因素引起的空间异质性占总空间异质性的87.49% ~ 98.54%,表明小尺度空间范围,在气候、土壤类型一致的前提下,地面枯落物量、微地形、土壤理化性质等结构性因素是表层SOC、SOCD空间变异的主要原因。而RAS的SOC、SOCD表现为以人为干扰等随机因素控制为主,考虑是采样间距大于其空间变异尺度引起的[33]。
变程反映的是变量的空间自相关范围,在变程内的变量才具有空间自相关性[23]。本研究中CAM和RTS的SOC、SOCD变程均大于取样距离(10 m),表明本研究在该小尺度下设置的采样间距是合理的,可以反映SOC、SOCD的空间异质性。对于RAS而言,10 m可能超出了其SOC、SOCD空间自相关的最大距离,而未表现出空间结构性,反映了SOC、SOCD的尺度效应。本研究中,SOC由空间自相关部分引起的变异占总变异的91.96% ~ 98.54%,表现在30.29 m以下的范围,与辽东山区次生林[34]土壤有机质由空间自相关引起的变异占总变异的65.40%,发生在46.77 m尺度以内相比,本研究SOC在较小尺度内存在较强的空间自相关性,表明色季拉山微生境比较复杂,SOC的空间破碎化严重。
3.3 SOC及SOCD水平分布格局的影响因素分析
SOC空间分布受多种因素的综合影响,其中土壤含水率、微地形是影响该研究区SOC空间分布格局的重要环境变量。CAM样地东、南边缘是SOC、SOCD高值的集中分布区,该边缘与嵩草沼泽化草甸接壤,土壤含水率较高(多数采样点超过100%),在低温通气不良的条件下,微生物活动受限,植物残体和根系不易分解,使土壤有机物质大量积累,符合冗余分析中SOC与土壤含水率极显著正相关的规律。在CAM的中部到北部边缘,存在一条东西方向的沟壑,在地面径流的作用下,导致土壤中可溶性有机碳向地势较低的东部边缘迁移,可能是CAM北部低值分布带形成的主要原因,与石峰[35]关于土壤无机氮的研究结果一致,表明在小尺度空间范围,微地形可能成为土壤养分空间分布的主要驱动因子[36-37]。在本研究中,坡度与SOC、SOCD的相关性较低(P > 0.05),这与Ritchie等[38]的研究结果相异,可能是水、热等条件的差异弱化了小尺度下坡度对SOC、SOCD的影响[39]。
研究区RTS样地为裸地、草本和灌丛镶嵌性分布,可能是其SOC、SOCD空间连续性较CAM差,破碎化程度高的原因。有研究表明土壤有机碳含量与灌丛凋落物生物量呈正相关性[40],在本研究中,灌丛斑块地上凋落物数量明显高于灌丛间裸地、草地斑块,导致交错分布的不同斑块下表层SOC存在差异,从而表现出空间异质性,与何俊龄[41]的研究结果一致,其研究亦表明金露梅(Potentilla fruticosa)灌丛表层土壤养分含量显著高于灌丛间草地。本研究未对RAS的SOC、SOCD进行空间插值,但其纯块金效应的出现表明其SOC、SOCD的空间连续性可能较差,事实上RAS微地形较复杂,平均坡度达25°,且地面枯落物分布不均匀,厚度0 ~ 10 cm不等,因此有待更小尺度的研究。
土壤密度、pH、TN、机械组成亦是影响SOC及SOCD空间分布格局的重要因素。冗余分析结果表明,土壤密度、pH是影响研究区SOC、SOCD空间变异的关键因子,与SOC、SOCD呈极显著负相关,这一结果与卓志清等[42]、贡璐等[43]人的研究结果一致,SOC含量提高时有利于改善土壤结构,使土壤疏松多孔,降低土壤紧实度。同时在一定范围内,随着土壤酸性增强,微生物活动受限,从而导致碳的积累。土壤中TN大部分来源于土壤有机质,因此与SOC极显著正相关。本研究SOC、SOCD与土壤黏粒、粉粒呈负相关,与砂粒正相关,这是因为黏粒、粉粒含量的降低,有利于提高土壤透气性,从而加快微生物分解释放养分元素,与马文瑛等[44]、Igor等[45]的研究结果相似。
4. 结 论
(1)SOC、SOCD显著受植被类型的影响,本研究区SOC表现为RAS > CAM > RTS,SOCD为CAM > RAS > RTS。
(2)研究区CAM、RTS的SOC和SOCD主要受结构性因素的影响,具有较强的空间自相关性,二者空间自相关的最大距离在17.44 ~ 30.29 m之间,表明本研究采取的地统计采样间隔是合理的。RAS的SOC、SOCD具有纯块金效应,即随采样间隔变化,其方差均为一常量,说明本研究采取的10 m间隔采样超出了RAS 的SOC、SOCD的空间变异尺度。
(3)在水平方向,CAM的SOC、SOCD主要受含水率、微地形影响,而在样地的东部、南部边缘存在高值区,在北部存在东西向的低值分布带。RTS的SOC、SOCD呈高低值交错分布,破碎化程度高,可能与地面覆被物的镶嵌性分布有关。
(4)冗余分析表明,土壤含水率、土壤密度、pH、TN是影响表层SOC、SOCD空间变异的关键要素。
-
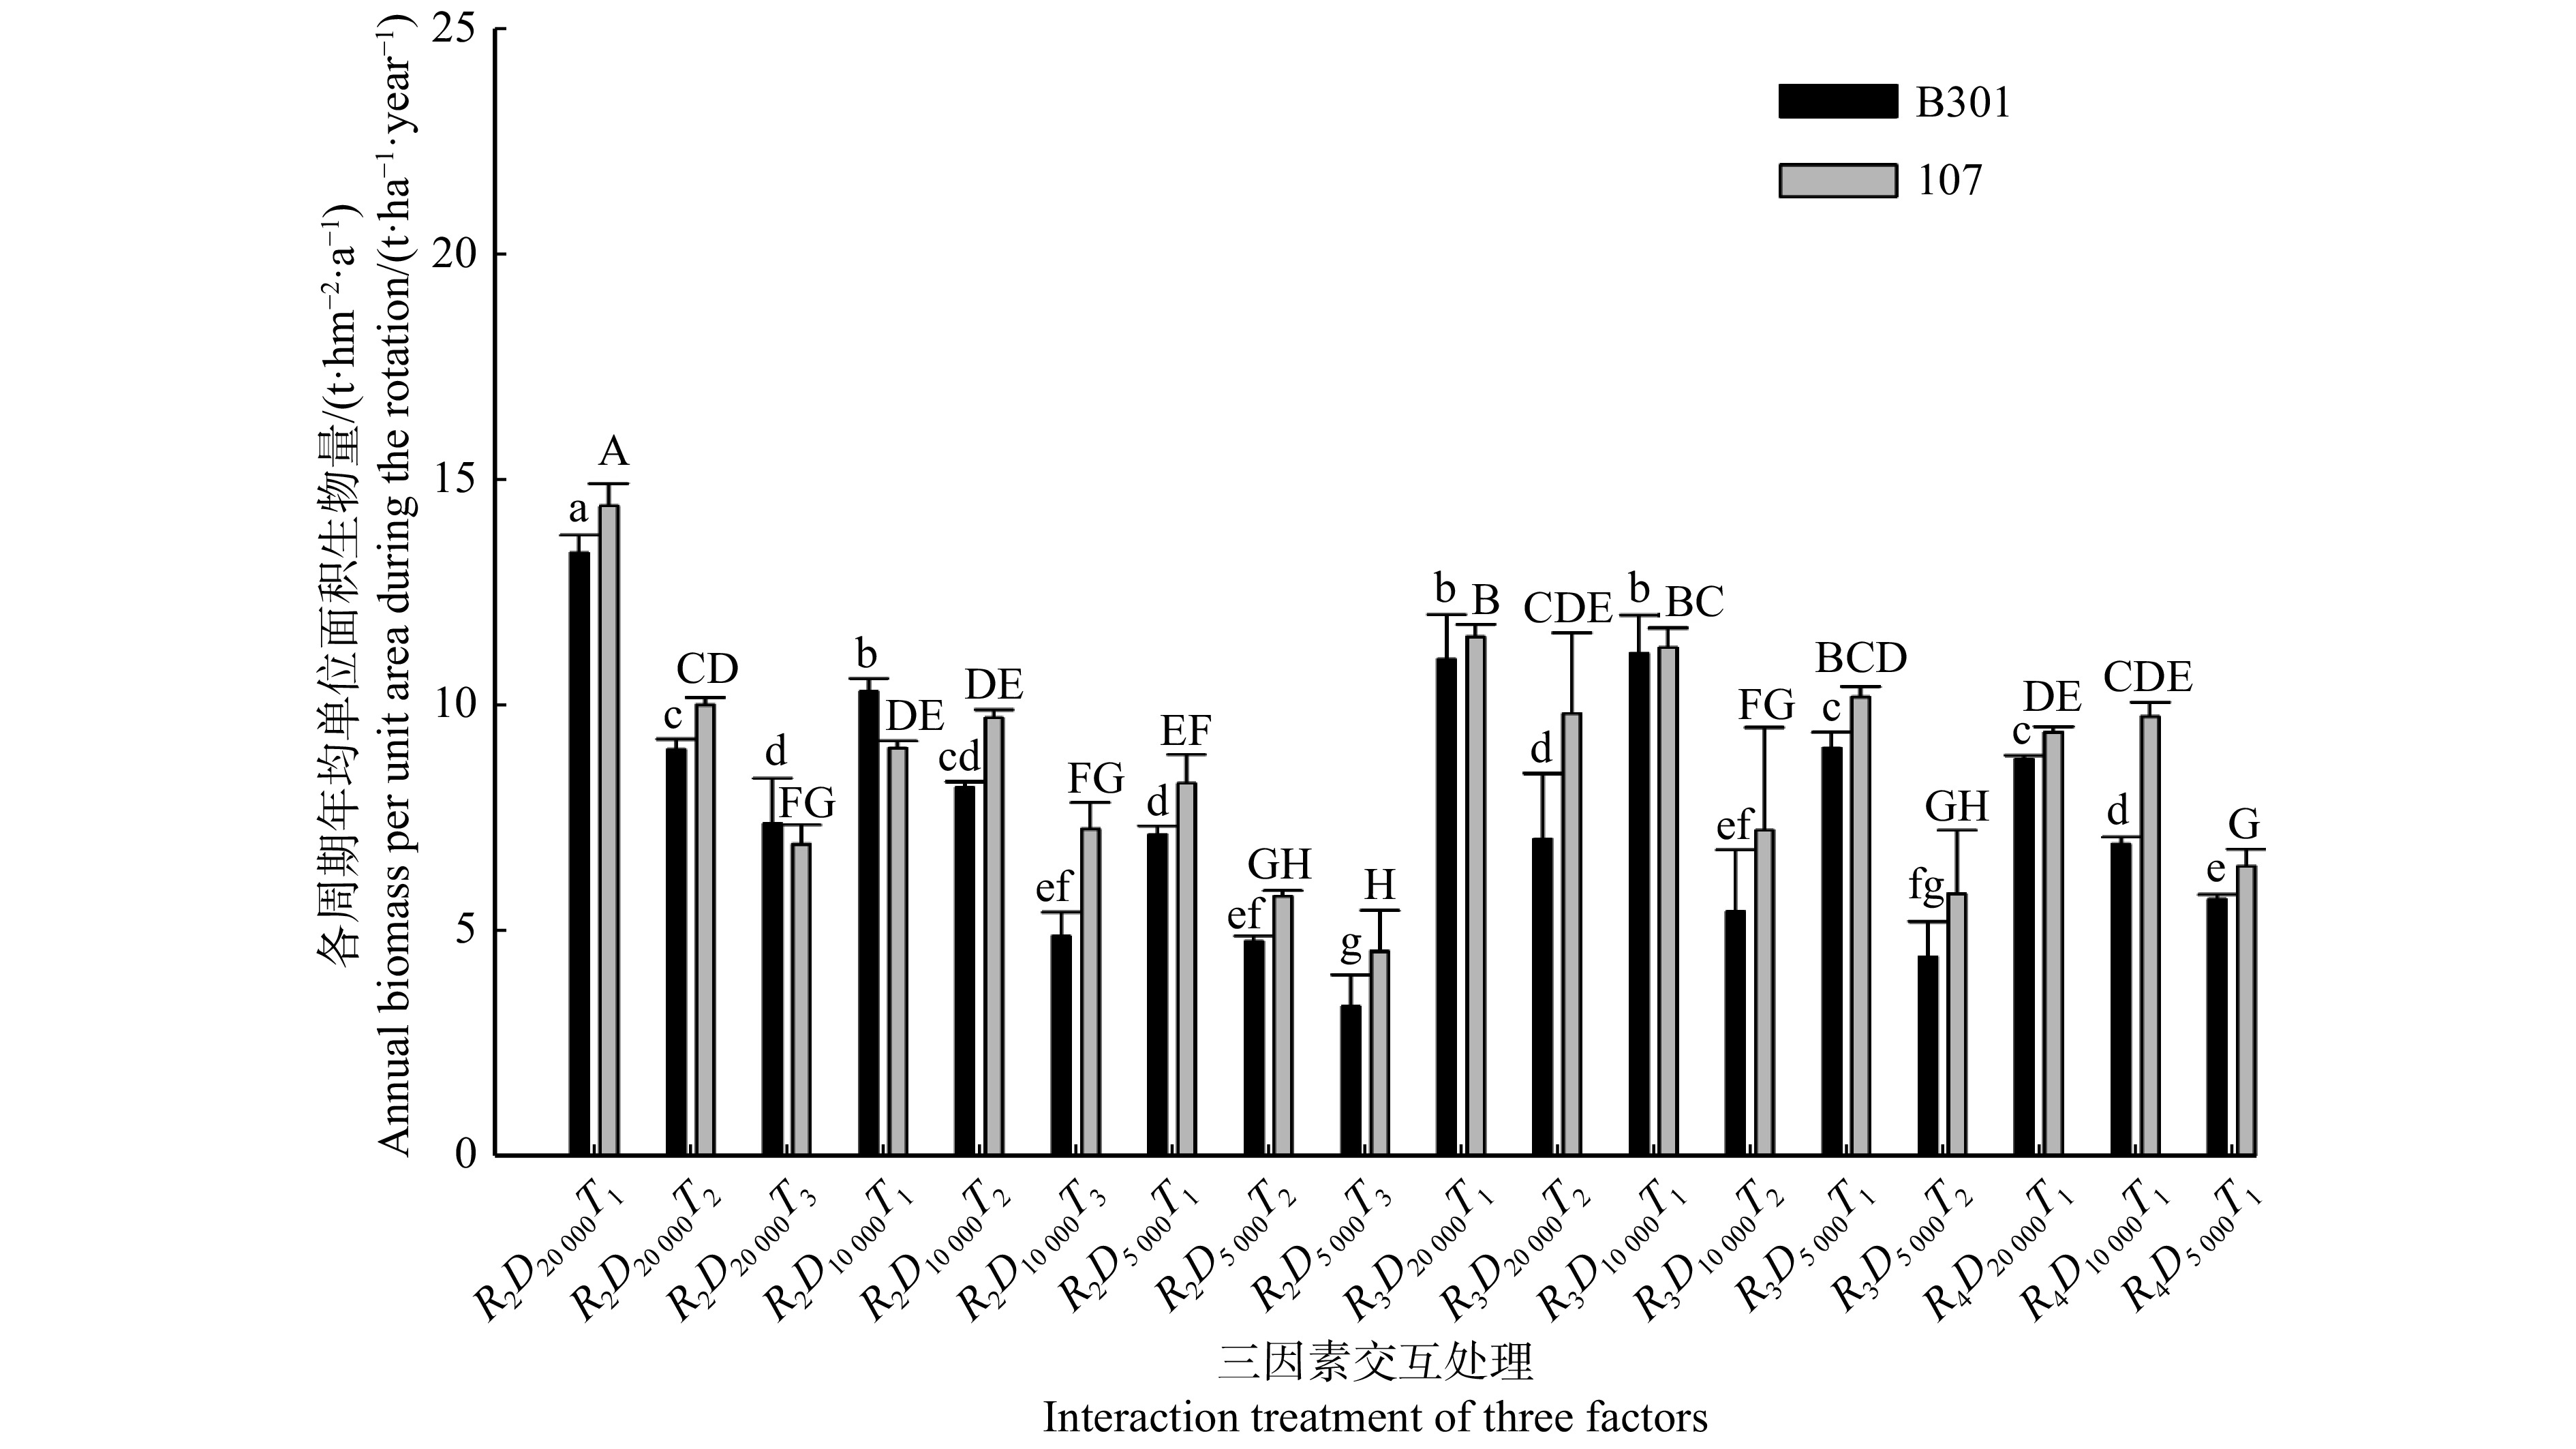
![]()
图 1 2树种各周期年均单位面积生物量在三因素交互处理下的差异
不同小写字母代表B301不同处理间差异显著(P < 0.05),不同大写字母代表107不同处理间差异显著(P < 0.05)。下同。Different lowercase letters mean significant difference among varied treatments of B301 at P<0.05 level, different uppercase letters mean significant difference among varied treatments of 107 at P<0.05 level. The same below.
Figure 1. Difference of annual biomass per unit area during the rotation between the two species under the interaction treatment of three factors
![]()
图 2 2树种6年单位面积总生物量在不同处理下的差异
Figure 2. Difference of total biomass per unit area of two tree species in 6 years under different treatments
![]()
图 3 2树种6年年均单位面积生物量在不同处理下的差异
Figure 3. Differences in 6-year average annual biomass per unit area of two tree species under different treatments
表 1 轮伐期、轮伐次数、栽植密度对三倍体毛白杨B301及欧美杨107存活率及生长状况主效应及其互作效应的P值
Table 1 P-values for the main and interaction effects of rotation cycles, harvest number and planting density on the survival rates and growth of (P. tomentosa × P. bolleana) × P. tomentosa and Populus × euramericana cv. ‘74/76’
变异来源
Source of variationB301 107 存活率
Survival rate/%平均D22
Average D22/cm平均单株萌条数
Average stoop per stump存活率
Survival rate/%平均D22
Average D22/cm平均单株萌条数
Average stoop per stump轮伐期
Rotation (R)0.000** 0.000** 0.148 0.000** 0.000** 0.000** 轮伐次数
Rotation number (T)0.000** 0.000** 0.000** 0.008** 0.000** 0.000** 栽植密度
Planting density (D)0.004** 0.000** 0.000** 0.001** 0.001** 0.000** R×T 0.000** 0.545 0.671 0.194 0.744 0.000** T×D 0.035* 0.006** 0.000** 0.087 0.000** 0.007** R×D 0.001** 0.810 0.593 0.032* 0.633 0.000** R×T×D 0.368 0.438 0.880 0.117 1.000 0.121 注:D22.离地 22 cm 处萌条直径。*代表差异显著(P < 0.05),**代表差异极显著(P < 0.01)。Notes: D22, shoot diameter at 22 cm aboveground. * represents significant difference (P < 0.05), ** represents extremely significant difference (P < 0.01).  下载: 导出CSV
表 2 三因素交互处理下2树种存活率及生长状况的差异
Table 2 Difference of survival rates and growth in two tree species under the interaction of three factors
处理
Treatment存活率
Survival rate/%平均D22
Average D22/cm平均单株萌条数
Average stoop per stumpB301 107 B301 107 B301 107 R2D20 000T1 76.11 ± 8.55def 78.89 ± 7.88abcde 3.69 ± 0.23fgh 3.39 ± 0.16ef 1.21 ± 0.08i 1.14 ± 0.82j R2D20 000T2 78.50 ± 6.06cde 70.00 ± 9.99def 2.83 ± 0.15ij 2.91 ± 0.11fg 2.16 ± 0.19ef 2.28 ± 0.17fg R2D20 000T3 76.00 ± 8.66def 58.13 ± 9.38f 2.38 ± 0.04j 2.17 ± 0.03g 2.76 ± 0.27d 4.10 ± 0.19d R2D10 000T1 91.67 ± 4.17ab 90.28 ± 4.81ab 4.34 ± 0.19de 4.07 ± 0.07cde 1.41 ± 0.13hi 1.96 ± 0.12fghi R2D10 000T2 98.89 ± 1.92a 72.22 ± 3.85cdef 3.01 ± 0.12i 3.20 ± 0.28f 3.00 ± 0.24cd 3.52 ± 0.12de R2D10 000T3 81.00 ± 7.94cd 90.00 ± 6.50ab 2.32 ± 0.08j 2.22 ± 0.06g 4.32 ± 0.19b 7.39 ± 0.37b R2D5 000T1 92.59 ± 6.42ab 85.19 ± 6.42abcd 5.18 ± 0.80bc 5.48 ± 0.30b 1.94 ± 0.33fgh 1.83 ± 0.07fghi R2D5 000T2 97.50 ± 0.00a 95.00 ± 4.33a 3.15 ± 0.10hi 3.40 ± 0.08ef 3.49 ± 0.36c 4.02 ± 0.44d R2D5 000T3 76.00 ± 3.46def 90.00 ± 7.50ab 2.27 ± 0.11j 2.30 ± 0.16g 5.52 ± 0.56a 9.55 ± 0.70a R3D20 000T1 74.07 ± 1.85def 80.86 ± 2.14abcde 4.26 ± 0.22def 3.63 ± 0.32def 1.22 ± 0.10i 1.45 ± 0.12hij R3D20 000T2 66.00 ± 4.50f 65.63 ± 4.96ef 3.04 ± 0.43j 3.06 ± 0.31f 2.21 ± 0.22ef 3.22 ± 0.27e R3D10 000T1 88.89 ± 6.36abc 87.50 ± 8.33abc 5.13 ± 0.18bc 4.32 ± 0.21cd 1.32 ± 0.16i 2.06 ± 0.21fgh R3D10 000T2 80.00 ± 3.46cde 76.25 ± 8.66bcde 3.45 ± 0.77ghi 3.34 ± 0.30ef 2.69 ± 0.58de 4.07 ± 0.31d R3D5 000T1 85.19 ± 6.42bcd 88.89 ± 19.25abc 5.57 ± 0.51ab 5.59 ± 0.58b 2.02 ± 0.47fg 2.39 ± 0.20f R3D5 000T2 66.00 ± 12.00f 75.00 ± 15.00bcde 3.82 ± 0.42efg 3.43 ± 0.34ef 3.49 ± 0.52c 6.11 ± 0.36c R4D20 000T1 78.50 ± 4.58cde 74.00 ± 2.50bcdef 4.72 ± 0.14cd 4.66 ± 0.23c 1.10 ± 0.03i 1.33 ± 0.04ij R4D10 000T1 69.00 ± 0.00ef 75.00 ± 3.00bcde 5.20 ± 0.24bc 5.82 ± 0.23b 1.22 ± 0.08i 1.72 ± 0.16ghij R4D5 000T1 80.00 ± 3.46cde 58.00 ± 13.03f 5.83 ± 0.23a 7.32 ± 1.45a 1.50 ± 0.19ghi 1.58 ± 0.22hij 总计 Total 80.88 ± 10.80 78.38 ± 13.03 3.68 ± 1.15 3.54 ± 1.44 2.36 ± 1.23 3.32 ± 2.28 注:表中数据为平均值 ± 标准差,同列不同小写字母代表处理间差异显著(P < 0.05)。Notes: data in the table is average ± standard deviation, different lowercase letters in the same column mean significant difference among treatments at P < 0.05 level.
下载: 导出CSV
-
[1] Scholz V, Ellerbrock R. The growth productivity, and environmental impact of the cultivation of energy crops on sandy soil in Germany[J]. Biomass & Bioenergy, 2002, 23(2): 81−92.
[2] Langeveld H, Quist-Wessel F, Dimitriou I, et al. Assessing environmental impacts of short rotation coppice (SRC) expansion: model definition and preliminary results[J]. Bioenergy Research, 2012, 5(3): 621−635. doi: 10.1007/s12155-012-9235-x
[3] Rowe R L, Street N R, Taylor G. Identifying potential environmental impacts of large-scale deployment of dedicated bioenergy crops in the UK[J]. Renewable and Sustainable Energy Reviews, 2009, 13(1): 271−290. doi: 10.1016/j.rser.2007.07.008
[4] Lindegaard K N, Adams P, Holley M, et al. Short rotation plantations policy history in Europe: lessons from the past and recommendations for the future[J]. Food and Energy Security, 2016, 5(3): 125−152. doi: 10.1002/fes3.86
[5] Kalt G, Mayer A, Theurl M C, et al. Natural climate solutions versus bioenergy: can carbon benefits of natural succession compete with bioenergy from short rotation coppice?[J]. GCB Bioenergy, 2019, 11(11): 1283−1297. doi: 10.1111/gcbb.12626
[6] 钱能志. 我国林业生物质能源资源现状与潜力[J]. 化学工业, 2007, 25(7): 1−5. doi: 10.3969/j.issn.1673-9647.2007.07.001 Qian N Z. Current situation and development of biomass resources in China[J]. Chemical Industry, 2007, 25(7): 1−5. doi: 10.3969/j.issn.1673-9647.2007.07.001
[7] 李洪. 杨柳能源林种植密度和轮伐期试验及其燃烧特性分析[D]. 北京: 中国林业科学研究院, 2009. Li H. Test on planting density and rotation time and analysis on combustion characteristics of poplar and willow energy plantation[D]. Beijing: Chinese Academy of Forestry, 2009.
[8] Broeckx L S, Verlinden M S, Ceulemans R. Establishment and two-year growth of a bio-energy plantation with fast-growing Populus trees in Flanders (Belgium): effects of genotype and former land use[J]. Biomass & Bioenergy, 2012, 42(1): 151−163.
[9] Armstrong A, Johns C, Tubby I. Effects of spacing and cutting cycle on the yield of poplar grown as an energy crop[J]. Biomass & Bioenergy, 1999, 17(4): 305−314.
[10] Matteo G D, Sperandio G, Verani S. Field performance of poplar for bioenergy in southern Europe after two coppicing rotations: effects of clone and planting density[J]. Iforest, 2012, 5: 224−229. doi: 10.3832/ifor0628-005
[11] Wilkinson J M, Evans E J, Bilsborrow P E, et al. Yield of willow cultivars at different planting densities in a commercial short rotation coppice in the north of England[J]. Biomass & Bioenergy, 2007, 31(7): 469−474.
[12] Nasso N, Guidi W, Ragaglini G, et al. Biomass production and energy balance of a 12-year-old short-rotation coppice poplar stand under different cutting cycles[J]. GCB Bioenergy, 2010, 2(2): 89−97. doi: 10.1111/j.1757-1707.2010.01043.x
[13] Dillen S Y, Djomo S N, Afas N A, et al. Biomass yield and energy balance of a short-rotation poplar coppice with multiple clones on degraded land during 16 years[J]. Biomass & Bioenergy, 2013, 56(9): 157−165.
[14] Benetka V, Novotná K, Stochlová, P. Biomass production of Populus nigra L. clones grown in short rotation coppice systems in three different environments over four rotations[J]. Iforest Biogeosciences & Forestry, 2014, 7(4): 1−15.
[15] Dillen S Y, Marron N, Bastien C, et al. Effects of environment and progeny on biomass estimations of five hybrid poplar families grown at three contrasting sites across Europe[J]. Forest Ecology and Management, 2007, 252(1–3): 12–23.
[16] Fabio E S, Volk T A, Miller R O, et al. Genotype × environment interaction analysis of North American shrub willow yield trials confirms superior performance of triploid hybrids[J]. GCB Bioenergy, 2016, 9(2): 445−459.
[17] Guo X Y, Zhang X S. Performance of 14 hybrid poplar clones grown in Beijing, China[J]. Biomass & Bioenergy, 2010, 34(6): 906−911.
[18] Gong J R, Zhang X S, Huang Y M. Comparison of the performance of several hybrid poplar clones and their potential suitability for use in northern China[J]. Biomass & Bioenergy, 2011, 35(7): 2755−2764.
[19] Zhang J, Song X, Zhang L, et al. Agronomic performance of 27 Populus clones evaluated after two 3-year coppice rotations in Henan, China[J]. GCB Bioenergy, 2020, 12(2): 168−181.
[20] Benomar L, DesRochers A, Larocque G R, et al. The effects of spacing on growth, morphology and biomass production and allocation in two hybrid poplar clones growing in the boreal region of Canada[J]. Trees, 2012, 26(3): 939−949. doi: 10.1007/s00468-011-0671-6
[21] Brodie L C, Debell D S. Evaluation of field performance of poplar clones using selected competition indices[J]. New Forests, 2004, 27(3): 201−214. doi: 10.1023/B:NEFO.0000022217.68697.48
[22] Djomo S N, Ac A, Zenone T, et al. Energy performances of intensive and extensive short rotation cropping systems for woody biomass production in the EU[J]. Renewable and Sustainable Energy Reviews, 2015, 41: 845−854. doi: 10.1016/j.rser.2014.08.058
[23] Gouker F E, Fabio E S, Serapiglia M J, et al. Yield and biomass quality of shrub willow hybrids in differing rotation lengths and spacing designs[J]. Biomass and Bioenergy, 2021, 146: 105977.
[24] Verlinden M S, Broeckx L S, Ceulemans R. First vs. second rotation of a poplar short rotation coppice: above-ground biomass productivity and shoot dynamics-science direct[J]. Biomass and Bioenergy, 2015, 73: 174−185. doi: 10.1016/j.biombioe.2014.12.012
[25] 方升佐, 徐锡增. 杨树超短轮伐期经营的生产力及材性的研究[J]. 林业科学, 1996, 32(4): 334−341. Fang S Z, Xu X Z. The biomass productivity and wood quality of eastern cottonwood in minirotation management systems[J]. Scientia Silvae Sinicae, 1996, 32(4): 334−341.
[26] Pontailler J Y, Ceulemans R, Guittet J. Biomass yield of poplar after five 2-year coppice rotation[J]. Forestry, 1999, 72(2): 157−163.
[27] Deckmyn G, Laureysens I, Garcia J, et al. Poplar growth and yield in short rotation coppice: model simulations using the process model SECRETS[J]. Biomass & Bioenergy, 2004, 26(3): 221−227.
[28] Laureysens I, Pellis A, Willems J, et al. Growth and production of a short rotation coppice culture of poplar( Ⅲ): second rotation results[J]. Biomass and Bioenergy, 2005, 29(1): 10−21. doi: 10.1016/j.biombioe.2005.02.005
[29] Liesebach M, Wuehlisch G V, Muhs H J. Aspen for short-rotation coppice plantations on agricultural sites in Germany: effects of spacing and rotation time on growth and biomass production of aspen progenies[J]. Forest Ecology & Management, 1999, 121(1−2): 25−39.
[30] 邸楠, 席本野, Pinto J R, 等. 宽窄行栽植下三倍体毛白杨根系生物量分布及其对土壤养分因子的响应[J]. 植物生态学报, 2013, 37(10): 961−971. Di N, Xi B Y, Pinto J R, et al. Root biomass distribution of triploid Populus tomentosa under wide- and narrow-row spacing planting schemes and its responses to soil nutrients[J]. Chinese Journal of Plant Ecology, 2013, 37(10): 961−971.
[31] 戴丽莉, 贾黎明, 高媛, 等. 两种杨树矮林地上生物量及树皮比例早期测算[J]. 东北林业大学学报, 2015, 43(7): 102−109. doi: 10.3969/j.issn.1000-5382.2015.07.023 Dai L L, Jia L M, Gao Y, et al. Biomass and bark content estimation of two poplar clones in short rotation coppice[J]. Journal of Northeast Forestry University, 2015, 43(7): 102−109. doi: 10.3969/j.issn.1000-5382.2015.07.023
[32] 戴丽莉. 两种杨树能源林生物量及其三素含量早期研究[D]. 北京: 北京林业大学, 2015. Dai L L. An early study on biomass and chemical characteristics of two poplar energy plantations[D]. Beijing: Beijing Forestry University, 2015.
[33] Ceulemans R, Deraedt W. Production physiology and growth potential of poplars under short-rotation forestry culture[J]. Forest Ecology and Management, 1999, 121(1−2): 9−23. doi: 10.1016/S0378-1127(98)00564-7
[34] Stochlová P, Novotná K, Costa M, et al. Biomass production of poplar short rotation coppice over five and six rotations and its aptitude as a fuel[J]. Biomass and Bioenergy, 2019, 112: 183−192.
[35] Landgraf D, Carl C, Neupert M. Biomass yield of 37 different SRC poplar varieties grown on a typical site in north eastern Germany[J]. Forests, 2020, 11(10): 1048. doi: 10.3390/f11101048
[36] Kopp R F, Abrahamson L P, White E H, et al. Cutting cycle and spacing effects on biomass production by a willow clone in New York[J]. Biomass and Bioenergy, 1997, 12(5): 313−319. doi: 10.1016/S0961-9534(96)00077-3
[37] Blake T J. Coppice systems for short-rotation intensive forestry: the influence of cultural, seasonal and plant factors[J]. Australian Forest Research, 1983, 13: 279−291.
[38] Rosso L, Facciotto G, Bergante S, et al. Selection and testing of Populus alba and Salix spp. as bioenergy feedstock: preliminary results[J]. Applied Energy, 2013, 102(2): 87−92.
[39] Afas N A, Marron N, Dongen S V, et al. Dynamics of biomass production in a poplar coppice culture over three rotations (11 years)[J]. Forest Ecology & Management, 2008, 255(5−6): 1883−1891.
[40] Sabatti M, Fabbrini F, Harfouche A, et al. Evaluation of biomass production potential and heating value of hybrid poplar genotypes in a short-rotation culture in Italy[J]. Industrial Crops & Products, 2014, 61: 62−73.
[41] Weiner J, Freckleton R P. Constant final yield[J]. Annual Review of Ecology Evolution & Systematics, 2010, 41(1): 173−192.
[42] Laureysens I, Deraedt W, Indeherberge T, et al. Population dynamics in a 6-year old coppice culture of poplar (I): clonal differences in stool mortality, shoot dynamics and shoot diameter distribution in relation to biomass production[J]. Biomass & Bioenergy, 2003, 24(2): 81−95.
-
期刊类型引用(1)
1. 杨冲,张子木,朱麒轩,杜瑶,李黎,罗斌. 基于中密度纤维板磨削的定组态砂带寿命研究. 林业机械与木工设备. 2023(03): 62-66+75 .  百度学术
百度学术
其他类型引用(4)


计量
- 文章访问数: 543
- HTML全文浏览量: 134
- PDF下载量: 105
- 被引次数: 5
