
Inversion of forest aboveground biomass from combined images of GF-1 and GF-3
-
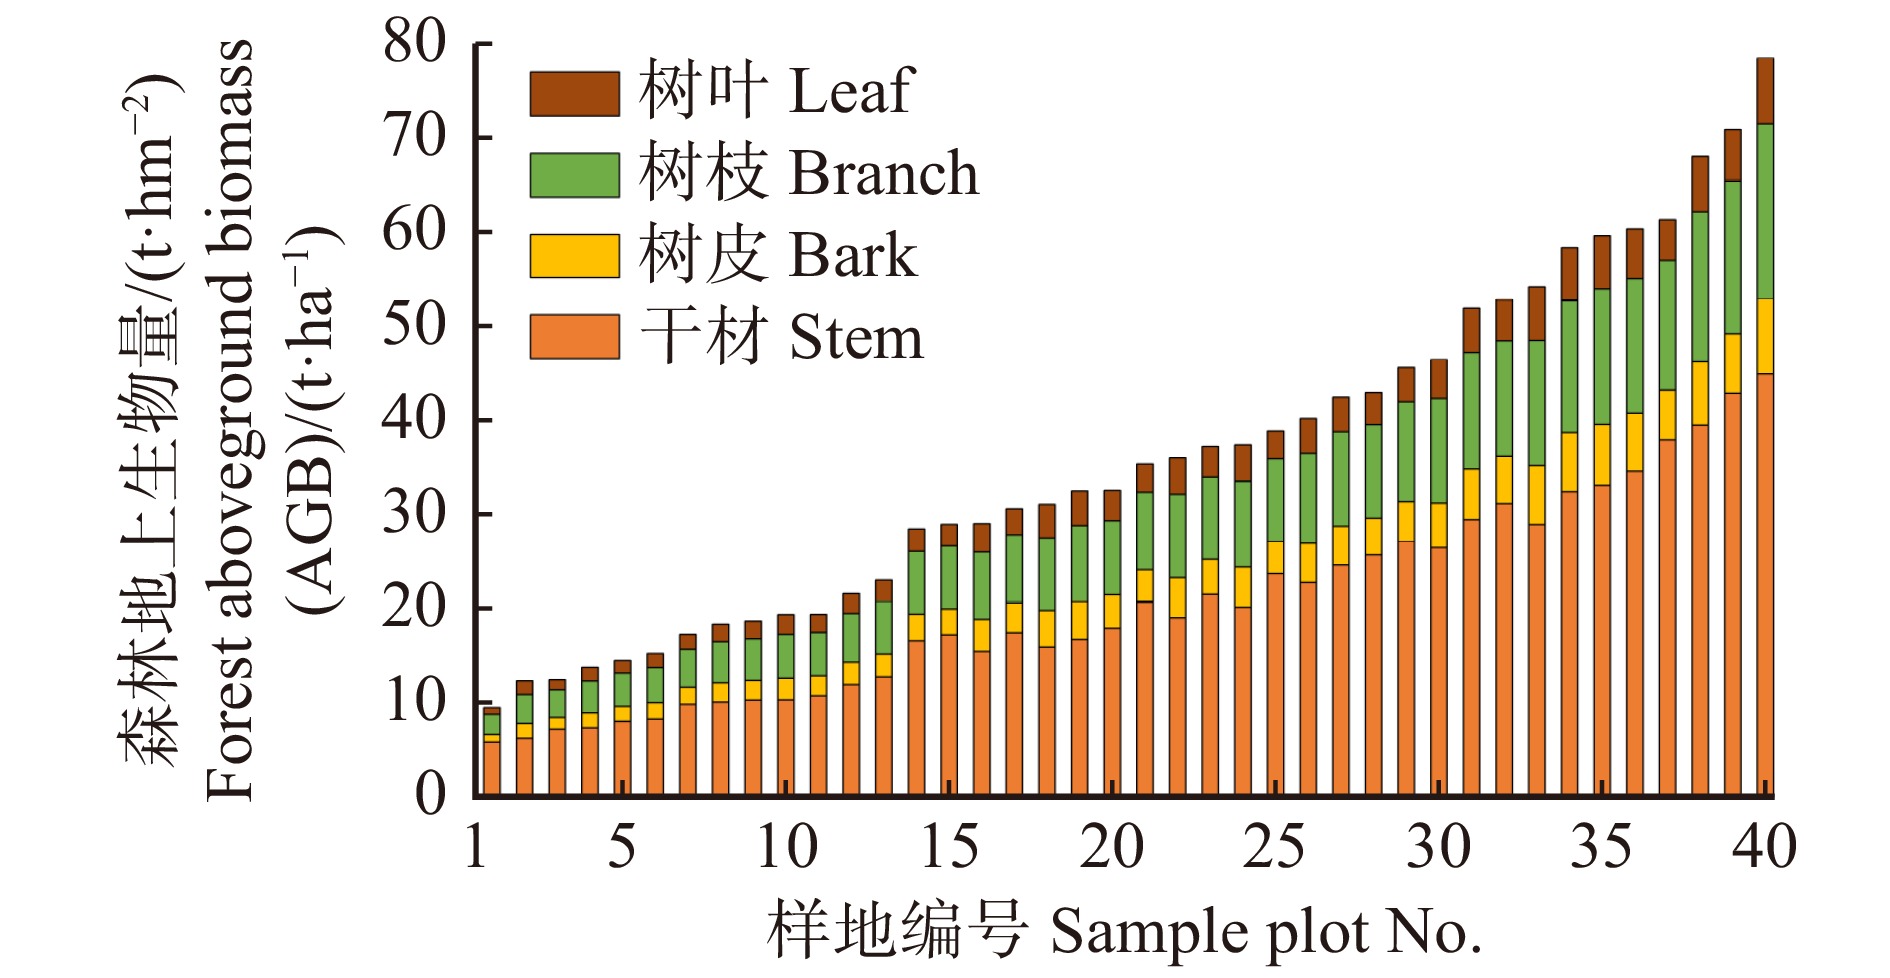
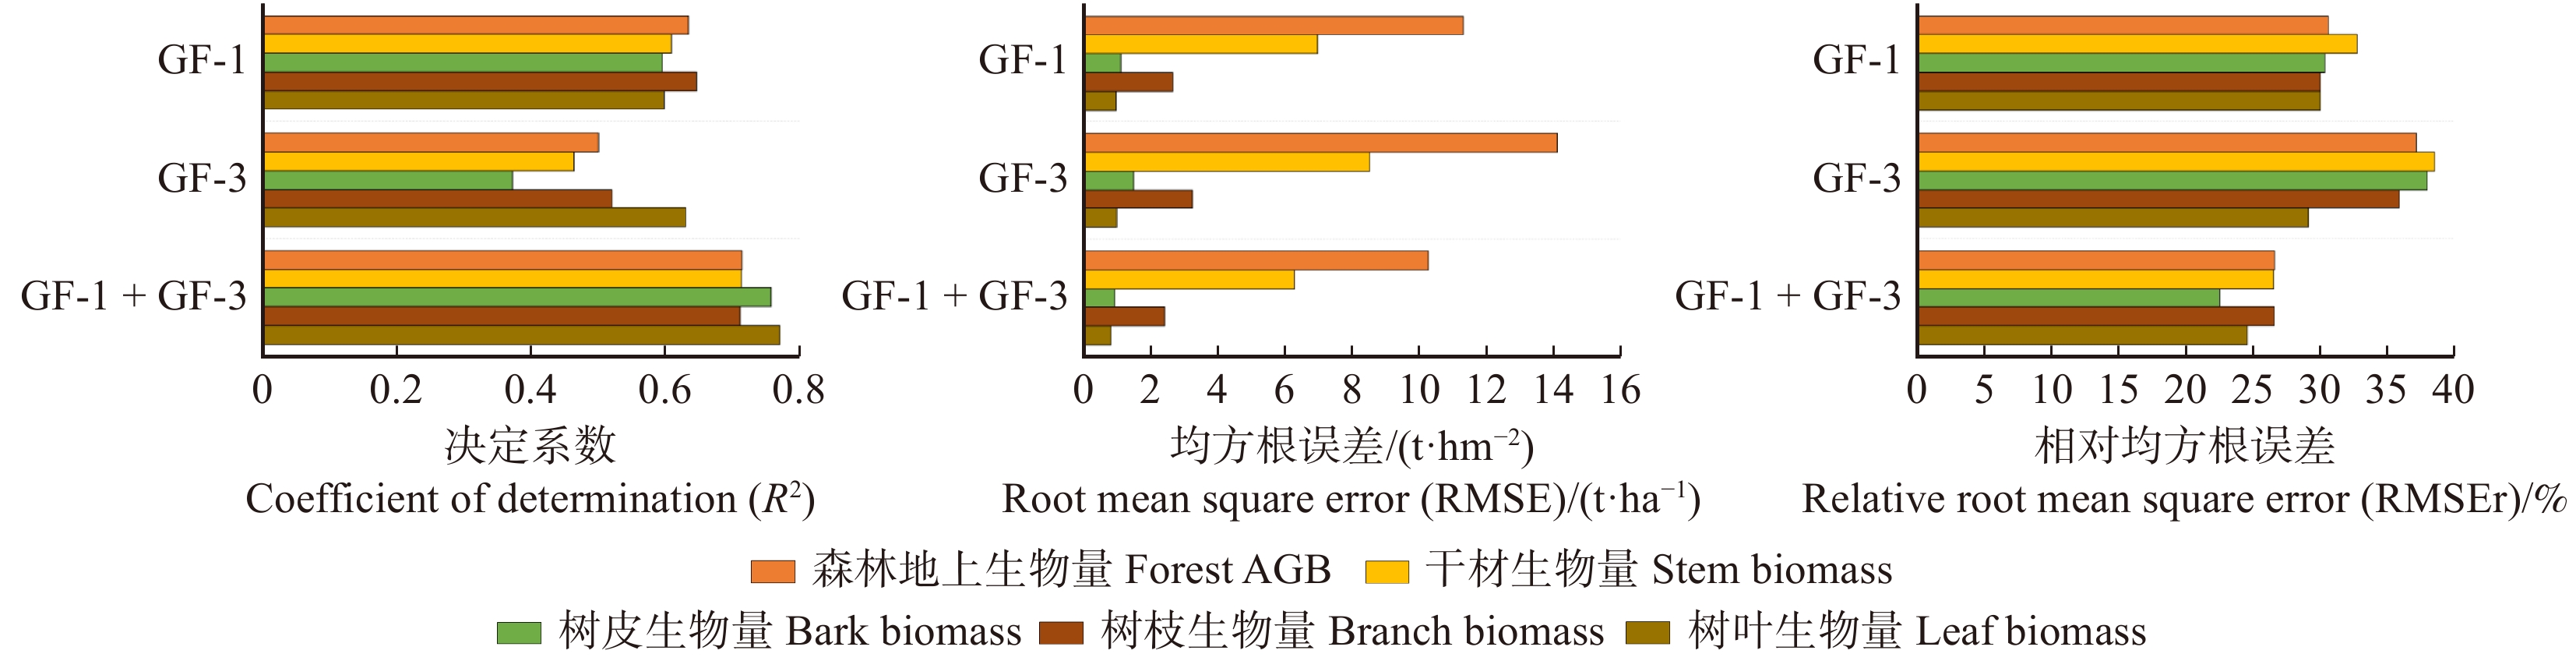
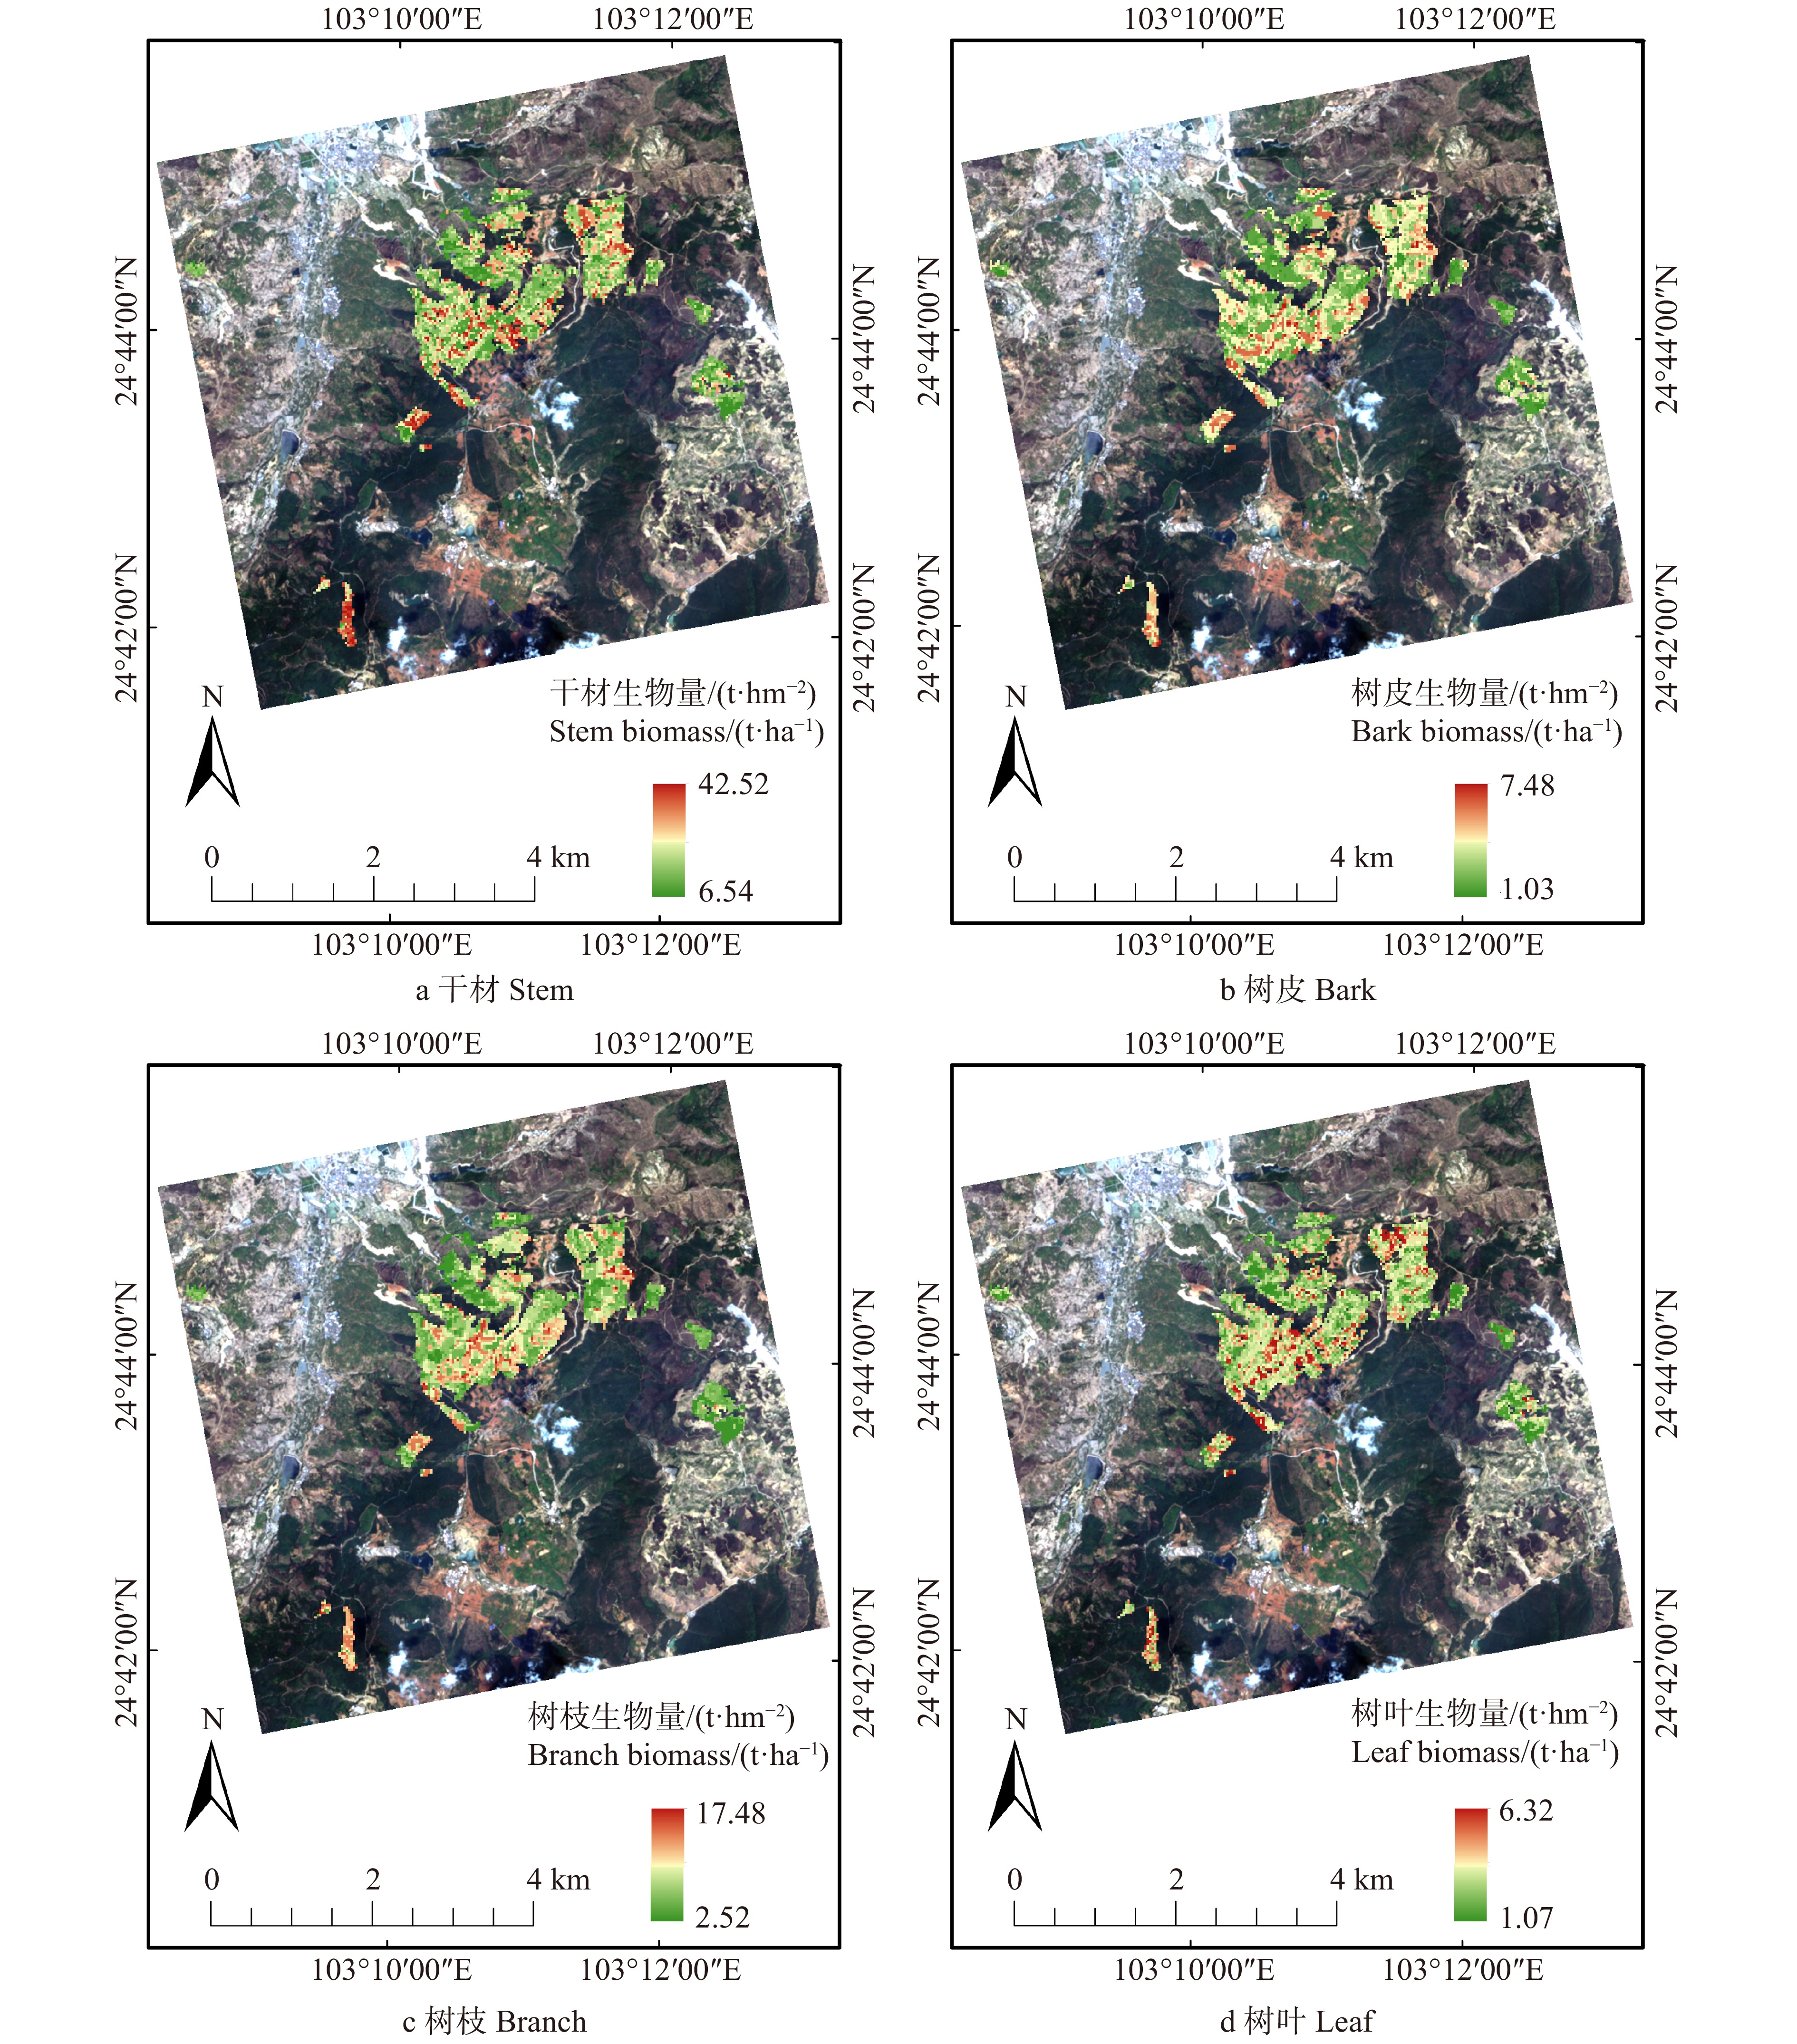
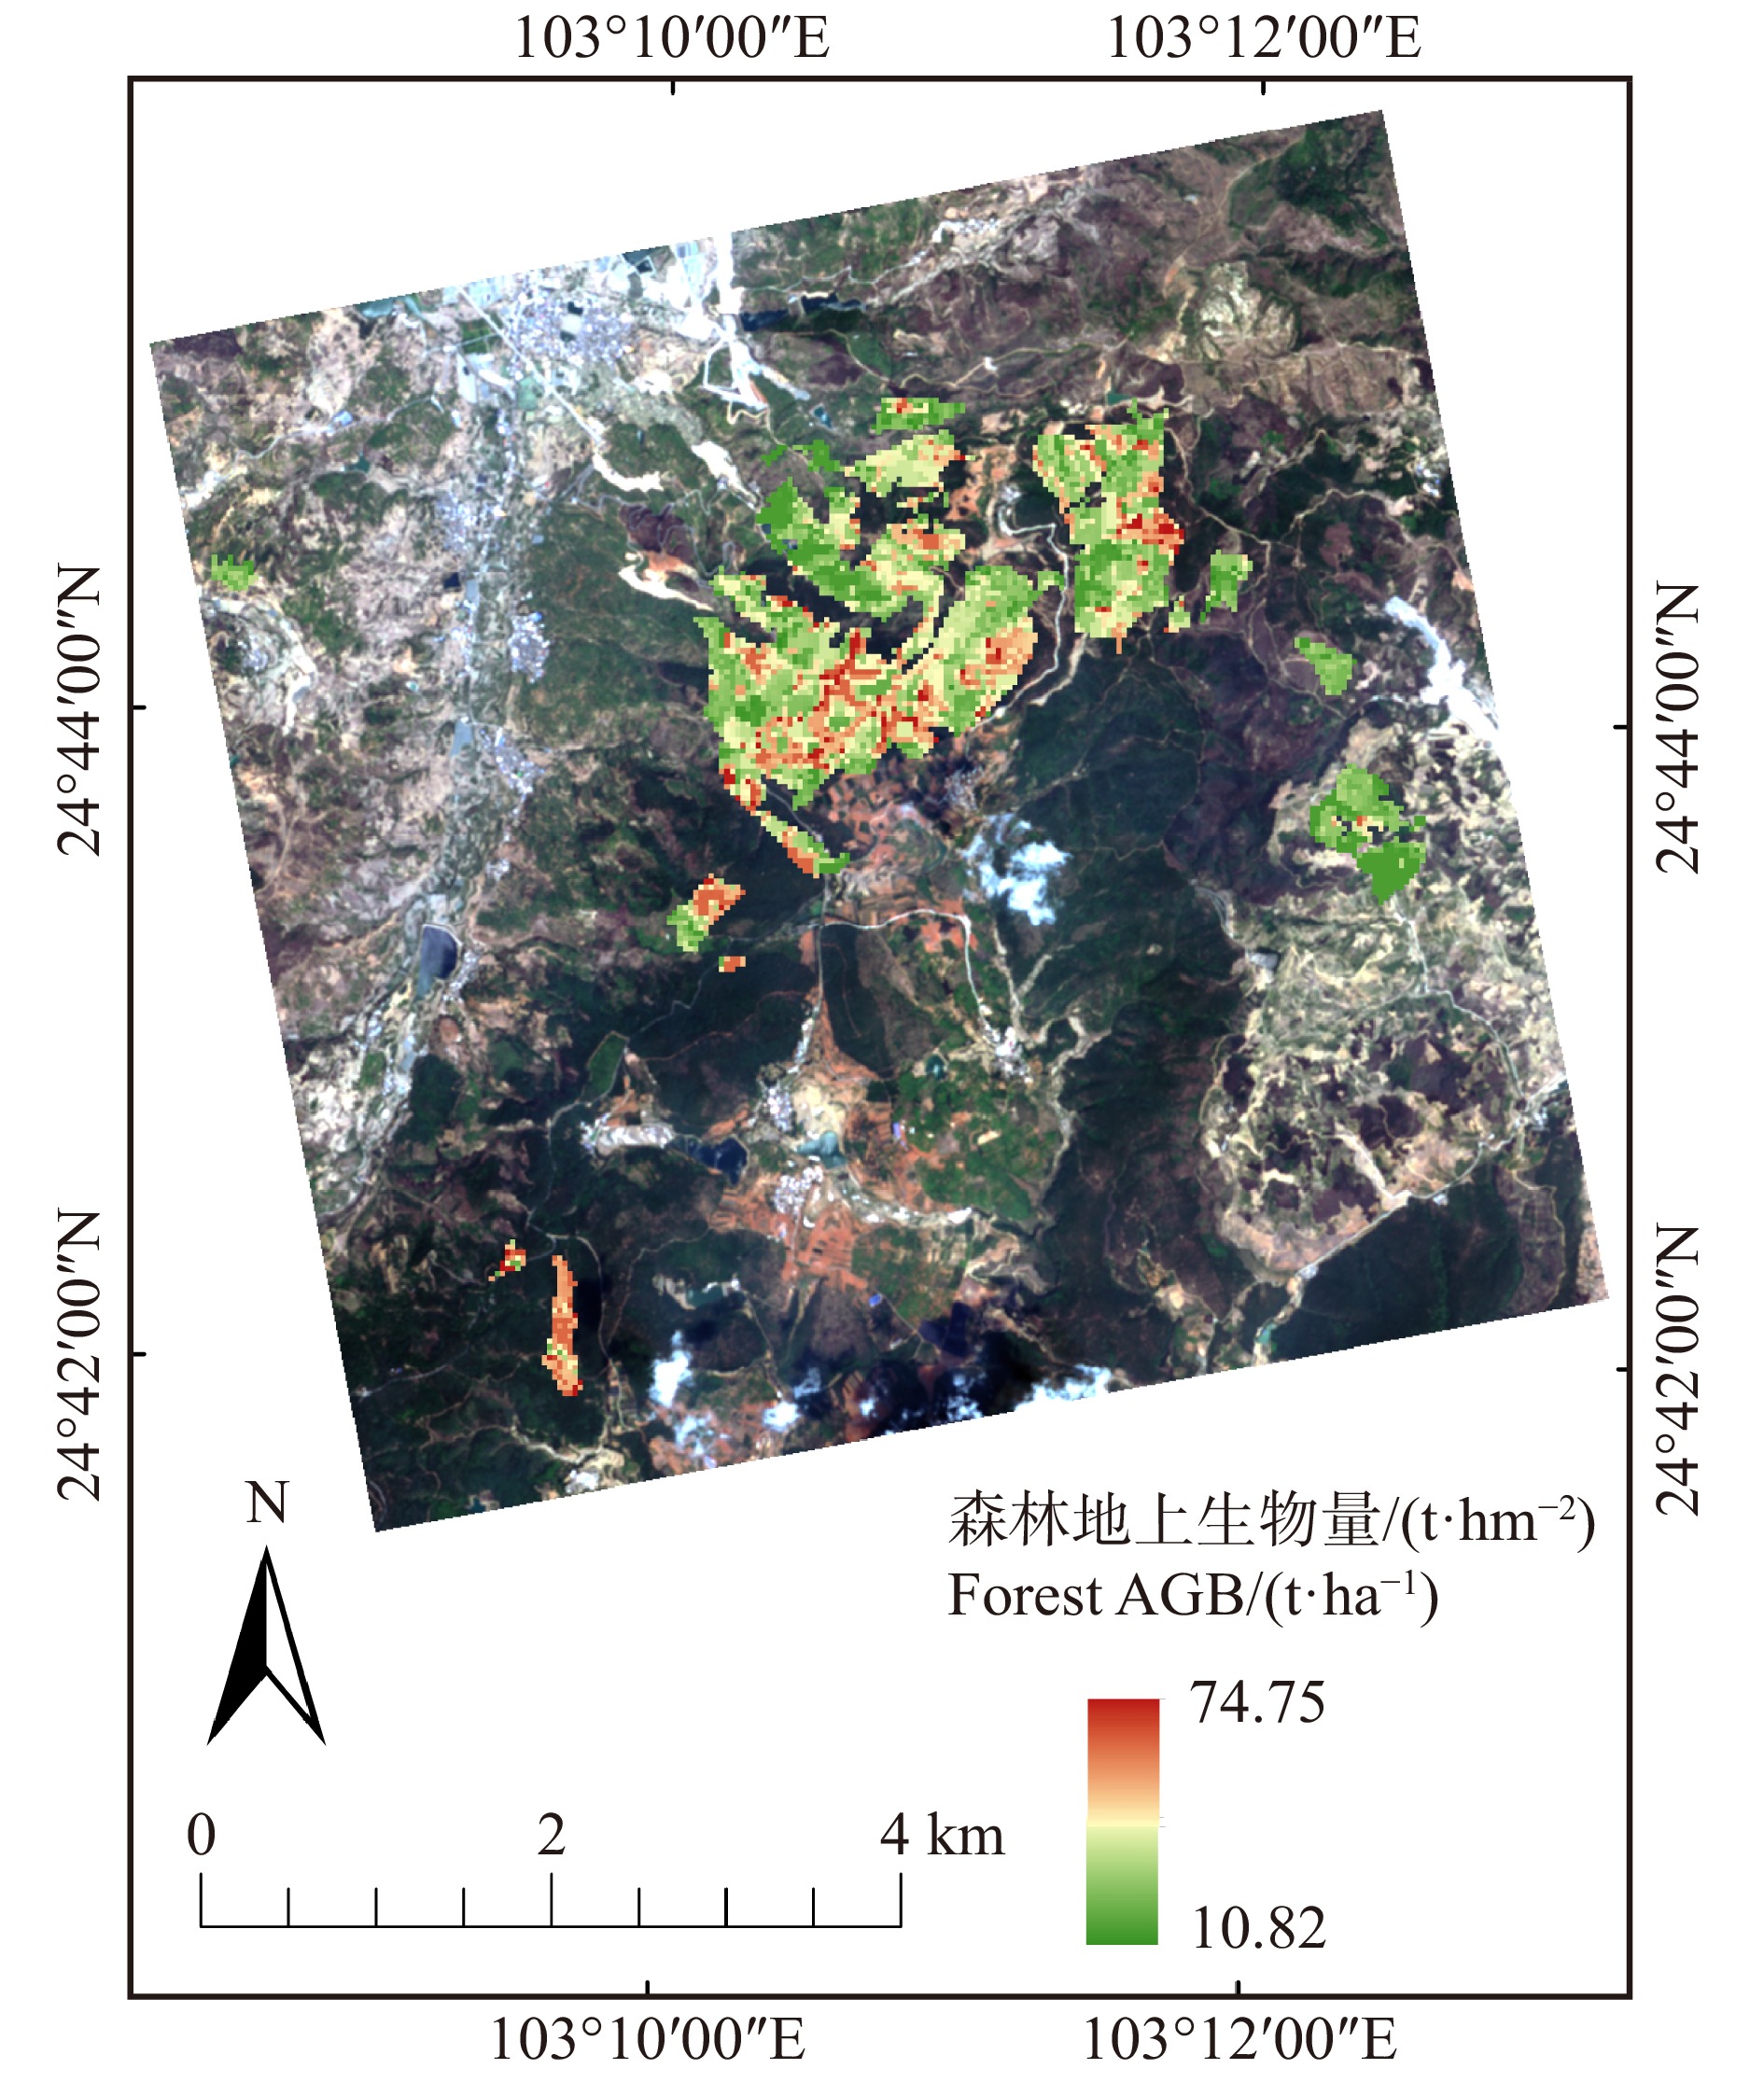
摘要:目的 探索高分(GF)光学、合成孔径雷达(SAR)数据及其联合数据在森林地上生物量(AGB)及其组成部分反演中的可行性。方法 以云南省昆明市宜良县小哨林区的云南松为研究对象,结合实地调查数据,以GF-1光学数据和GF-3 SAR数据作为数据源,提取光学数据常用的植被指数和纹理特征,SAR数据的各极化后向散射系数、纹理特征以及极化分解等参数,利用KNN-FIFS方法分别进行森林AGB及其分量的反演;然后采用留一交叉验证法对反演结果进行精度评价,并在此基础上绘制森林AGB及其分量空间分布图。结果 联合GF-1和GF-3数据反演森林AGB及其分量的精度最高,R2均超过了0.710,RMSEr的值在22% ~ 27%之间,其中树叶的反演精度最优,模型的R2为0.714,RMSE为10.270 t/hm2,RMSEr为24.58%;除树叶生物量外,森林AGB和其他分量仅采用GF-1提取的特征进行反演时,精度均优于采用GF-3特征的反演结果。结论 联合GF-1光学数据和GF-3全极化SAR可以实现一定程度的互补,提高森林AGB及其分量的反演精度,此外KNN-FIFS方法在低生物量水平的云南松纯林的AGB及其分量的反演中具有一定的鲁棒性,且KNN-FIFS优选的重要参数多为SAR和光学的纹理特征。Abstract:Objective The objective of this study was to explore the feasibility of GF-1, GF-3, and combination of GF-1 and GF-3 for total forest aboveground biomass (AGB) and its component inversion.Method In this study, the vegetation indices, texture characterizations extracted from GF-1, backscattering coefficients, texture characterizations and polarimetric decomposition features extracted from GF-3 were used independently and in combination to estimate total AGB and component AGB of a pure forest of Yunnan pine (Pinus yunnanensis), located in Xiaoshao Forest Region in Yiliang County, Yunnan Province of southwestern China. A fast iterative features selection method for k-NN method (KNN-FIFS) was applied in forest total AGB and component AGB inversion and the leave one out cross validation (LOOCV) method was used to evaluate the model and the inversion results and the results were mapped and analyzed.Result The joint GF-1 and GF-3 data had the highest accuracy for inversion of forest AGB and each component AGB, and the R2 of each exceeded 0.710, and the values of RMSEr were between 22% and 27%, among which the inversion accuracy of foliage was the best, with the model’s R2 of 0.714, RMSE of 10.270 t/ha, and RMSEr of 24.58%; except for foliage component AGB, forest AGB and other components of AGB had better accuracy than the inversion results with GF-3 features when only the features extracted from GF-1 were used for the inversion.Conclusion Combining GF-1 optical data and GF-3 fully polarized SAR data can achieve a certain degree of complementarity to improve the inversion accuracy of forest AGB and fractional AGB. In addition, the KNN-FIFS method is robust in the inversion of AGB and fractional AGB of pure Yunnan pine forests at low biomass levels, and the important parameters preferred by KNN-FIFS mostly are texture features extracted form SAR and optics data.
-
Keywords:
- GF series satellite /
- forest AGB /
- forest AGB component /
- KNN-FIFS
-
-
![]()
图 1 研究区地理位置及样地分布
Figure 1. Location of the study area and distribution of sample plots
![]()
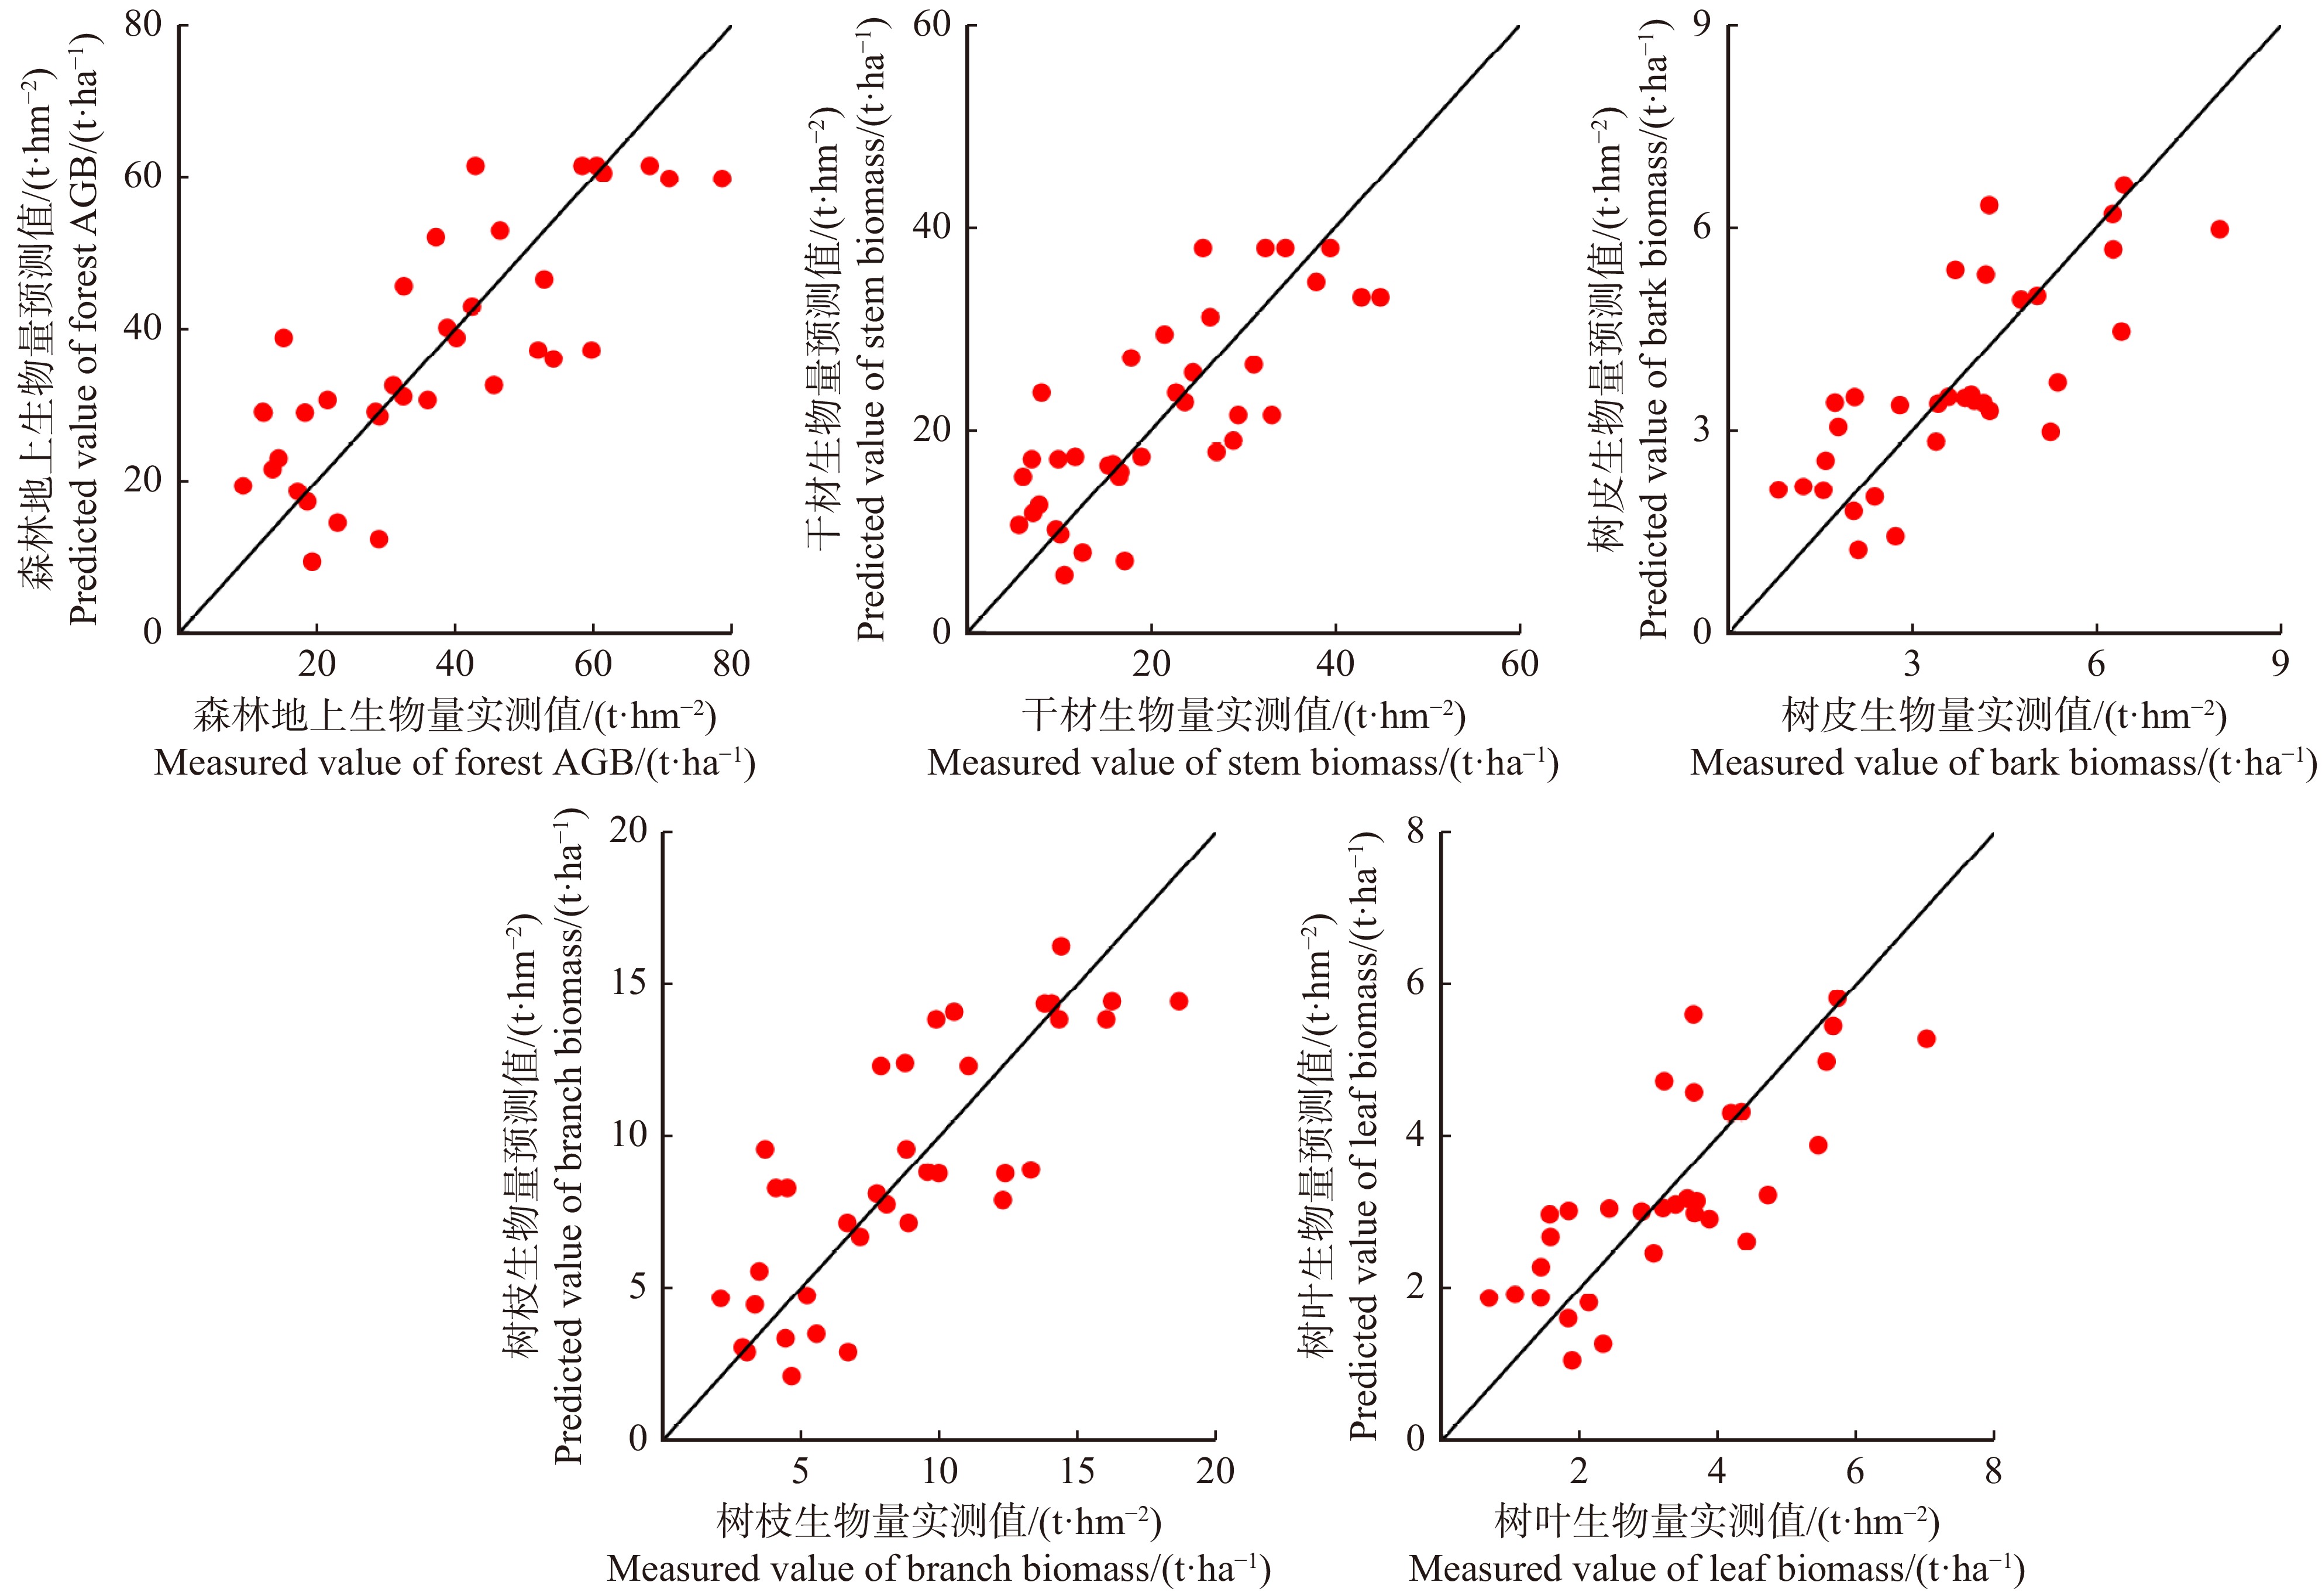
图 3 利用GF-1数据反演森林AGB与实测值对比散点图
实线为1∶1验证线。The solid line is 1∶1 verification line.
Figure 3. Scatter plots between forest AGB inversion results using GF-1 data and field collected sample values
![]()
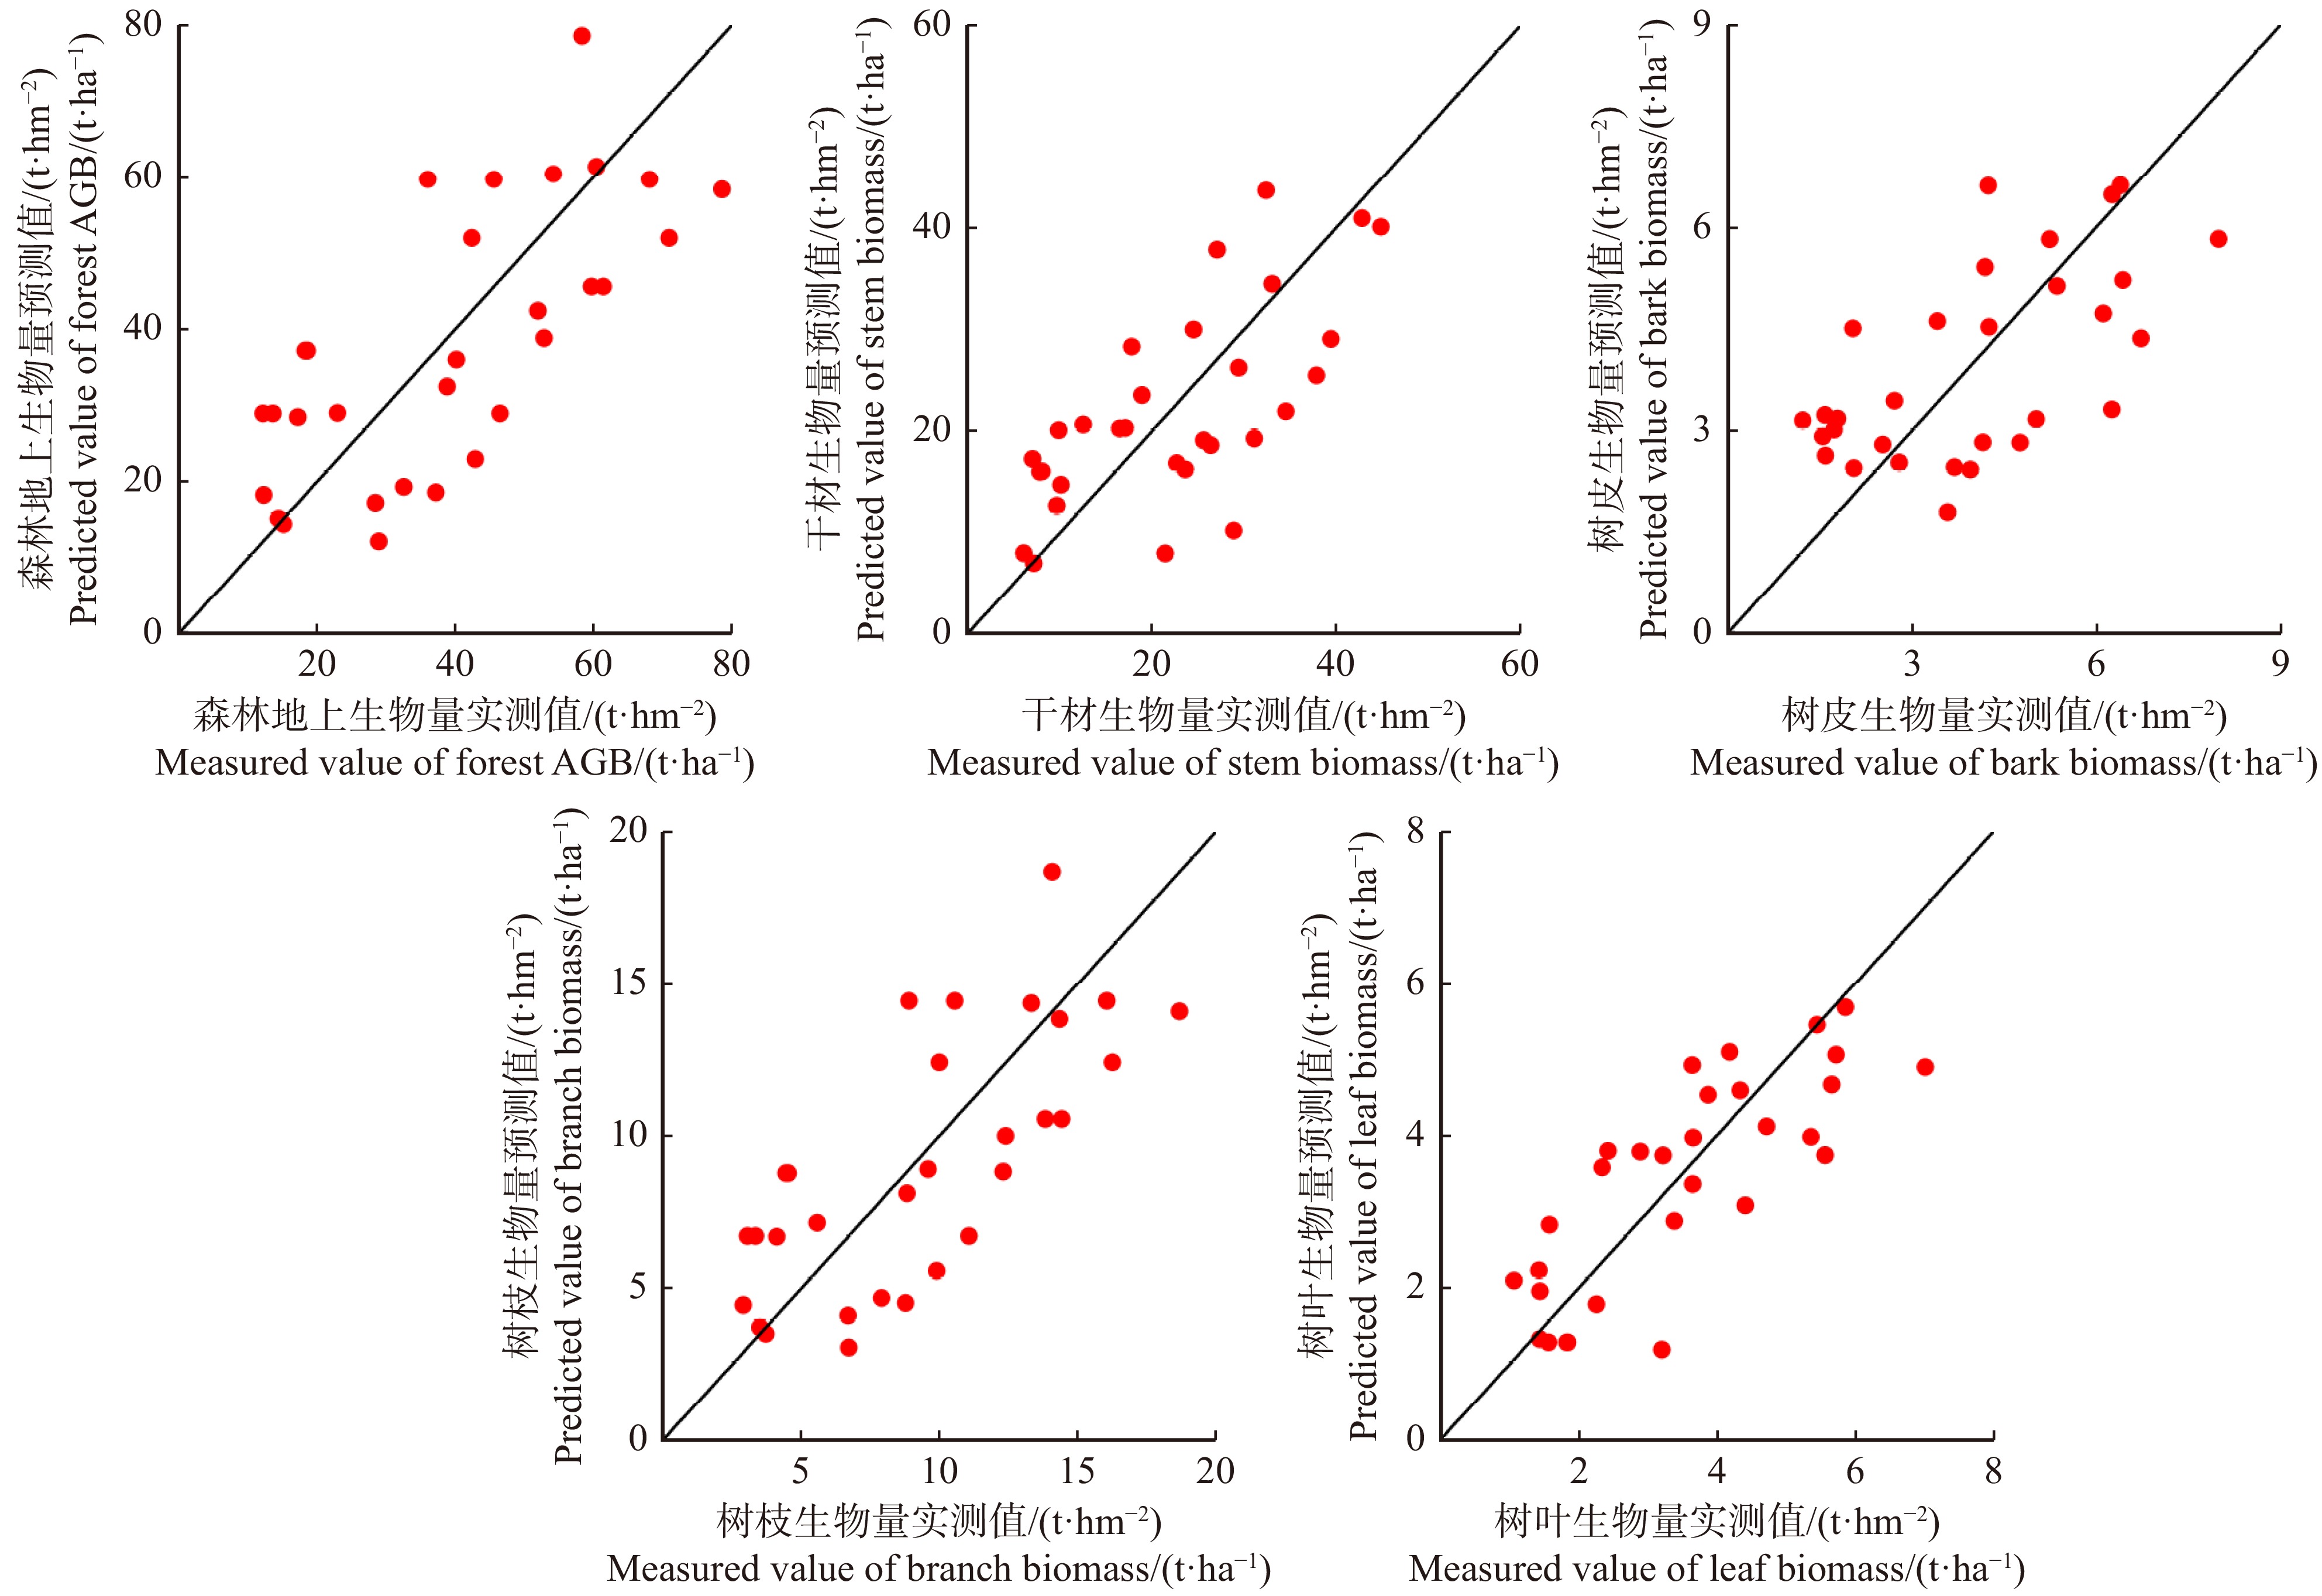
图 4 利用GF-3数据反演森林AGB与实测值对比散点图
实线为1∶1验证线。The solid line is 1∶1 verification line.
Figure 4. Scatter plots between forest AGB inversion results using GF-3 data and field collected sample values
![]()
图 5 利用GF-1、GF-3数据联合反演森林AGB与实测值对比散点图
实线为1∶1验证线。The solid line is 1∶1 verification line.
Figure 5. Scatter plots between forest AGB inversion results using combination of GF-1, GF-3 data and field collected sample values
表 1 GF-1卫星传感器参数
Table 1 GF-1 satellite sensor parameters
波段号
Band No.波段
Band频谱范围
Spectral range/μm分辨率
Spatial resolution/mPan1 Pan 0.45 ~ 0.90 2 Band1 Blue 0.45 ~ 0.52 8 Band2 Green 0.52 ~ 0.59 8 Band3 Red 0.63 ~ 0.69 8 Band4 NIR 0.77 ~ 0.89 8  下载: 导出CSV
表 2 GF-3 PolSAR数据详细参数
Table 2 Detailed information of the acquired GF-3 PolSAR data
成像时间
Acquisition time极化方式
Polarization way入射角
Incidence angle/(°)波长
Wave length/m距离向分辨率
Range resolution/m方位向分辨率
Azimuth resolution/m经纬度
Latitude & Longitude2018−05−18 HH、HV、VH、VV 39.104 0.055 5 2.248 5.12 103°01′48″E、
24°40′12″N注:HH.发射和接收的都为水平极化的电磁波;HV.发射的电磁波为水平极化,接收的电磁波为垂直极化;VH.发射的电磁波为垂直极化,接收的电磁波为水平极化;VV.发射和接收的都为垂直极化的电磁波。Notes: HH, both the transmitted and received electromagnetic waves are horizontally polarized; HV, the transmitted electromagnetic wave is horizontally polarized and the received electromagnetic wave is vertically polarized. VH, the transmitted electromagnetic wave is vertically polarized and the received electromagnetic wave is horizontally polarized. VV, transmitted and received electromagnetic waves that are vertically polarized.
下载: 导出CSV
表 3 植被指数
Table 3 Vegetation indexes
植被指数 Vegetation index 计算公式 Calculation formula 归一化植被指数
Normalized difference vegetation index (NDVI)NDVI=ρNIR−ρredρNIR+ρred 简单植被指数
Simple ratio index (SR)SR=ρred/ρNIR 可见光大气阻抗植被指数
Visible atmospherically resistant index (VARI)VARI=ρgreen−ρredρgreen+ρred−ρblue 差值植被指数
Difference vegetation index (DVI)DVI=ρNIR−ρred 垂直植被指数
Perpendicular vegetation index (PVI)PVI=0.939×ρNIR−0.344×ρred+0.09 土壤调节植被指数
Soil-adjusted vegetation index (SAVI)SAVI=1.5×(ρNIR−ρred)ρNIR+ρred+0.5 增强植被指数
Enhanced vegetation index (EVI)EVI=2.5×(ρNIR−ρred)1+ρNIR+6×ρred−7.5×ρblue 修正土壤调节植被指数
Modified soil-adjusted vegetation index (MSAVI)MSAVI=2ρNIR+1−√(2ρNIR+1)2−8(ρNIR−ρred)2 注:表中的ρNIR、ρred、ρgreen、ρblue分别为GF-3影像的近红外、红光、绿光和蓝光波段。Notes: ρNIR,ρred,ρgreen,ρblue are the near-infrared, red, green and blue bands of GF-3 images.
下载: 导出CSV
表 4 GF-1的重要参数及反演精度
Table 4 Important parameters of GF-1 and inversion accuracy
生物量
Biomass最近邻样本数量取值
Number of nearest
neighbor samples (K)窗口
Window决定系数
Coefficient of
determination (R2)均方根误差/(t·hm−2)
Root mean
square error
(RMSE)/(t·ha−1)相对均方根误差
Relative root mean
square error
(RMSEr)/%重要参数
Major parameter森林地上生物量
Forest AGB1 5 0.634 11.310 30.61 Me_b2、Con_pan、Var_b3、
Con_b1、Con_3干材生物量
Stem biomass1 5 0.609 6.971 32.76 Me_b2、Con_pan、Var_b3、
Con_b1、Con_3树皮生物量
Bark biomass4 1 0.595 1.119 30.37 Me_b1、Var_b1、Cor_b3 树枝生物量
Branch biomass1 5 0.646 2.663 30.01 Me_b2、Var_pan、Var_b1、
Con_b2树叶生物量
Leaf biomass4 1 0.598 0.976 30.01 Me_b1、Var_b1、Cor_b3 注:Con_pan、Var_pan为GF-1全色波段纹理的对比度和方差;Me_b1、Con_b1、Var_b1为GF-1蓝光波段的均值、对比度、方差;Me_b2为GF-1绿光波段的均值;Var_b3、Con_3、Cor_b3为红光波段的方差、对比度、相关性。Notes: Con_pan, Var_pan are the contrast and variance of GF-1 panchromatic band texture; Me_b1, Con_b1, Var_b1 are the mean, contrast, and variance of GF-1 blue band; Me_b2 is the mean of GF-1 green band; Var_b3, Con_3, Cor_b3 are the variance, contrast, and correlation of red band, respectively.
下载: 导出CSV
表 5 GF-3的重要参数及反演精度
Table 5 Important parameters and inversion accuracies based on GF-3
生物量 Biomass K 窗口
WindowR2 RMSE/(t·hm−2)
RMSE/(t·ha−1)RMSEr/% 重要参数
Major parameter森林地上生物量 Forest AGB 1 7 0.500 14.110 37.17 T23_im、VHDB、T13_re 干材生物量 Stem biomass 2 7 0.464 8.522 38.53 T23_im、T13_re、Fre_Vol 树皮生物量 Bark biomass 7 7 0.372 1.495 37.99 T23_im、Sp_con135 树枝生物量 Branch biomass 1 7 0.515 3.243 35.89 T23_im、VHDB、T13_re 树叶生物量 Leaf biomass 2 11 0.630 0.993 29.13 Sp_ent135、T23_re、Sp_ent0、T12_re、HHUTM、Sp_con0 注:Sp_con135和Sp_con0、Sp_ent135和Sp_ent0分别为GF-3的SPAN特征纹理的135°和0°的对比度、135°和0°的熵;VHDB为GF-3交叉极化的后向散射系数分贝化结果;HHUTM为GF-3同极化的后向散射系数;T23_im、T13_re、T23_re为相干矩阵(T)中的元素;Fre_Vol为Freeman2分解的体散射分量。Notes: Sp_con135, Sp_con0, Sp_ent135, Sp_ent0 are the 135° and 0° contrast, 135° and 0° entropy of the SPAN feature texture of GF-3; VHDB is the decibelized result of backscattering coefficient of GF-3 cross-polarization. HHUTM is the backscattering coefficient of GF-3 co-polarization; T23_im, T13_re, T23_re are the elements in the coherence matrix (T); Fre_Vol is the body scattering component of the Freeman2 decomposition.
下载: 导出CSV
表 6 联合GF-1 + GF-3的重要参数及反演精度
Table 6 Important parameters and inversion accuracies based on the combination of GF-1 + GF-3
生物量
BiomassK 窗口
WindowR2 RMSE/(t·hm−2)
RMSE/(t·ha−1)RMSEr/% 重要参数
Major parameter森林地上生物量 Forest AGB 2 3 0.714 10.270 26.61 B2、Sp_dis90、HVUTM、VHUTM、Sp_hom45、Me_b2、
Sp_con90干材生物量
Stem biomass2 1 0.713 6.285 26.53 Dis_b3、Sp_con90、Me_b2、Sp_con45、Hom_b3、
Sp_ent135、Var_b1、VH树皮生物量
Bark biomass2 3 0.757 0.931 22.54 B3、Sp_dis90、HVUTM、VHUTM、Sp_hom45、Var_b1、
Sp_hom90、Me_b3树枝生物量
Branch biomass2 3 0.711 2.419 26.58 B3、Sp_dis90、HVUTM、VHUTM、Sp_hom45、Me_b2、
Sp_con90树叶生物量
Leaf biomass3 11 0.770 0.820 24.58 Dis_b3、Sec_b2、Me_b3、T12_re、Var_b2、Var_b1 注:在GF-1光学数据中,B2、B3为绿光和红光的光谱信息;Me_b2、Sec_b2为绿光波段的均值和二阶矩;Dis_b3、Hom_b3、Me_b3为红光波段的相异性、均匀性、均值。在GF-3PolSAR数据中,HVUTM、VHUTM为交叉极化的后向散射系数;Sp_dis90、Sp_hom45和Sp_hom90、Sp_con90和Sp_con45分别为SPAN特征的90°的相异性、45°和90°的均匀性、90°和45°的对比度。Notes: in GF-1 optical data, B2 and B3 are spectral information of green and red light; Me_ b2, Sec_ B2 are the mean and second-order moment of the green band; Dis_ b3, Hom_ b3, Me_ B3 are the difference, uniformity and mean value of red light band. In gf-3polsar data, HVUTM and VHUTM are backscattering coefficients of cross polarization; Sp_ dis90, Sp_ hom45, Sp_ hom90, Sp_ con90, Sp_ Con45 are the 90° non similarity, 45° and 90° uniformity, 90° and 45° contrast of span characteristics.
下载: 导出CSV
-
[1] 菅永峰, 韩泽民, 黄光体, 等. 基于高分辨率遥感影像的北亚热带森林生物量反演[J]. 生态学报, 2021, 41(6): 2161−2169. Jian Y F, Han Z M, Huang G T, et al. Estimation of forest biomass using high spatial resolution remote sensing imagery in north subtropical forests[J]. Acta Ecologica Sinica, 2021, 41(6): 2161−2169.
[2] 胥辉, 张会儒. 林木生物量模型研究[M]. 昆明: 云南科学技术出版社, 2002. Xu H, Zhang H R. Study on forest biomass model[M]. Kunming: Yunnan Science and Technology Press, 2002.
[3] 李德仁, 王长委, 胡月明, 等. 遥感技术估算森林生物量的研究进展[J]. 武汉大学学报·信息科学版, 2012, 37(6): 631−635. doi: 10.13203/j.whugis2012.06.001 Li D R, Wang C W, Hu Y M, et al. Research progress of forest biomass inversion by remote sensing technology[J]. Geomatics and Information Science of Wuhan University, 2012, 37(6): 631−635. doi: 10.13203/j.whugis2012.06.001
[4] 魏晶昱, 范文义, 于颖, 等. GF-3全极化SAR数据极化分解估算人工林冠层生物量[J]. 林业科学, 2020, 56(9): 174−183. doi: 10.11707/j.1001-7488.20200919 Wei J Y, Fan W Y, Yu Y, et al. Polarimetric decomposition parameters for artificial forest canopy biomass inversion using GF-3 fully polarimetric SAR data[J]. Scientia Silvae Sinicae, 2020, 56(9): 174−183. doi: 10.11707/j.1001-7488.20200919
[5] 曾晶, 张晓丽. 高分一号遥感影像下崂山林场林分生物量反演估算研究[J]. 中南林业科技大学学报, 2016, 36(1): 46−51. doi: 10.14067/j.cnki.1673-923x.2016.01.008 Zeng J, Zhang X L. Laoshan forest biomass estimation based on GF-1 images with inversion algorithm[J]. Journal of Central South University of Forestry & Technology, 2016, 36(1): 46−51. doi: 10.14067/j.cnki.1673-923x.2016.01.008
[6] 丁家祺, 黄文丽, 刘迎春, 等. 基于机器学习和多源数据的湘西北森林地上生物量估测[J]. 林业科学, 2021, 57(10): 36−48. doi: 10.11707/j.1001-7488.20211004 Ding J Q, Huang W L, Liu Y C, et al. Estimation of forest aboveground biomass in northwest Hunan Province based on machine learning and multi-source data[J]. Scientia Silvae Sinicae, 2021, 57(10): 36−48. doi: 10.11707/j.1001-7488.20211004
[7] 李春梅, 张王菲, 李增元, 等. 基于多源数据的根河实验区生物量反演研究[J]. 北京林业大学学报, 2016, 38(3): 64−72. doi: 10.13332/j.1000-1522.20150209 Li C M, Zhang W F, Li Z Y, et al. Retrieval of forest above-ground biomass using multi-source data in Genhe, Inner Mongolia[J]. Journal of Beijing Forestry University, 2016, 38(3): 64−72. doi: 10.13332/j.1000-1522.20150209
[8] 李云, 张王菲, 崔鋆波, 等. 参数优选支持的光学与SAR数据森林地上生物量反演研究[J]. 北京林业大学学报, 2020, 42(10): 11−19. Li Y, Zhang W F, Cui J B, et al. Inversion exploration on forest aboveground biomass of optical and SAR data supported by parameter optimization method[J]. Journal of Beijing Forestry University, 2020, 42(10): 11−19.
[9] 潘婧靓, 邢艳秋, 黄佳鹏, 等. 联合 GF-3 PolSAR 数据与Landsat-8 OLI 数据的森林地上生物量估测[J]. 中南林业科技大学学报, 2020, 40(8): 83−90. Pan J J, Xing Y Q, Huang J P, et al. Estimation of forest above-ground biomass based on GF-3 PolSAR data and Landsat-8 OLI data[J]. Journal of Central South University of Forestry & Technology, 2020, 40(8): 83−90.
[10] 许振宇, 李盈昌, 李明阳. 基于Sentinel-1A和Landsat8数据的区域森林生物量反演[J]. 中南林业科技大学学报, 2020, 40(11): 147−155. Xu Z Y, Li Y C, Li M Y, et al. Forest biomass retrieval based on Sentinel-1A and Landsat 8 image[J]. Journal of Central South University of Forestry & Technology, 2020, 40(11): 147−155.
[11] 边瑞. 基于多源遥感数据的祁连山国家公园森林生物量估算研究[D]. 兰州: 兰州大学, 2021. Bian R. Estimation of forest aboveground biomass in the Qilian Mountain National Park based on multi-source remote sensing data[D]. Lanzhou: Lanzhou University, 2021.
[12] 韩宗涛, 江洪, 王威, 等. 基于多源遥感的森林地上生物量KNN-FIFS估测[J]. 林业科学, 2018, 54(9): 70−79. doi: 10.11707/j.1001-7488.20180909 Han Z T, Jiang H, Wang W, et al. Forest above-ground biomass estimation using KNN-FIFS method based on multi-source remote sensing data[J]. Scientia Silvae Sinicae, 2018, 54(9): 70−79. doi: 10.11707/j.1001-7488.20180909
[13] 巨一琳, 姬永杰, 黄继茂, 等. 联合LiDAR和多光谱数据森林地上生物量反演研究[J]. 南京林业大学学报(自然科学版), 2022, 46(1): 58−68. Ju Y L, Ji Y J, Huang J M, et al. Inversion of forest aboveground biomass using combination of LiDAR and multispectral data[J]. Journal of Nanjing Forestry University (Natural Science Edition), 2022, 46(1): 58−68.
[14] 黄从德, 张健, 杨万勤, 等. 四川省及重庆地区森林植被碳储量动态[J]. 生态学报, 2008, 28(3): 966−975. doi: 10.3321/j.issn:1000-0933.2008.03.008 Huang C D, Zhang J, Yang W Q, et al. Dynamics on forest carbon stock in Sichuan Province and Chongqing City[J]. Acta Ecologica Sinica, 2008, 28(3): 966−975. doi: 10.3321/j.issn:1000-0933.2008.03.008
[15] 国家林业局. 立木生物量模型及碳计量参数−云南松: LY/T 2262—2014[S]. 北京: 中国标准出版社, 2014. National Forestry Administration. Tree biomass models and related parameters to carbon accounting for Pinus yunnannensis: LY/T 2262−2014[S]. Beijing: Chinese Standard Publishing House, 2014.
[16] 张庆君. 高分三号卫星总体设计与关键技术[J]. 测绘学报, 2017, 46(3): 269−277. doi: 10.11947/j.AGCS.2017.20170049 Zhang Q J. System design and key technologies of gaogao-3 satellite[J]. Acta Geodaetica et Cartographica Sinica, 2017, 46(3): 269−277. doi: 10.11947/j.AGCS.2017.20170049
[17] Lal P, Kumar A, Saikia P, et al. Effect of vegetation structure on above ground biomass in tropical deciduous forests of Central India[J]. Geocarto International, 2022, 37(21): 6294−6310.
[18] 魏晶昱. 基于GF-3全极化SAR数据估算森林冠层生物量[D]. 哈尔滨: 东北林业大学, 2019. Wei J Y. Polarimetric decomposition parameters for artificial forest canopy biomass inversion using GF-3 fully polarimetric SAR data[D]. Harbin: Northeast Forestry University, 2019
[19] Yamaguchi Y, Moriyama T, Ishido M, et al. Four-component scattering model for polarimetric SAR image decomposition[J]. IEEE Trans. Geosci Remote Sens, 2005, 43(8): 1699−1706. doi: 10.1109/TGRS.2005.852084
[20] 苏彩霞, 胡娟, 欧卫华, 等. 基于SPAN与NDVI的全极化SAR数据喀斯特地区土地类型划分[J]. 农业工程学报, 2020, 36(24): 265−272. doi: 10.11975/j.issn.1002-6819.2020.24.031 Su C X, Hu J, Ou W H, et al. Land type classification of full polarization SAR data using SPAN and NDVI in karst areas, China[J]. Transactions of the Chinese Society of Agricultural Engineering, 2020, 36(24): 265−272. doi: 10.11975/j.issn.1002-6819.2020.24.031
[21] Tsui O W, Coops N C, Wulder M A, et al. Using multi-frequency radar and discrete-return LiDAR measurements to estimate above-ground biomass and biomass components in a coastal temperate forest[J]. ISPRS Journal of Photogrammetry and Remote Sensing, 2012, 69: 121−133. doi: 10.1016/j.isprsjprs.2012.02.009
[22] Gao Y, Lu D, Li G, et al. Comparative analysis of modeling algorithms for forest aboveground biomass inversion in a subtropical region[J]. Remote Sensing (Basel, Switzerland), 2018, 10(4): 627−649.
[23] 王昆. 基于Quickbird和极化雷达数据的森林生物量估测方法研究[D]. 北京: 北京林业大学, 2013. Wang K. Study on the estimation method of forest biomass using Quickbird and polarimetric SAR data[D]. Beijing: Beijing Forestry University, 2013.
[24] 刘龙飞, 陈云浩, 李京. 遥感影像纹理分析方法综述与展望[J]. 遥感技术与应用, 2003, 18(6): 441−447. doi: 10.3969/j.issn.1004-0323.2003.06.015 Liu L F, Chen Y H, Li J. Review and prospect of texture analysis methods of remote sensing images[J]. Remote Sensing Technology and Application, 2003, 18(6): 441−447. doi: 10.3969/j.issn.1004-0323.2003.06.015
-
期刊类型引用(6)
1. 冯林艳,周火艳,赵晓迪. 乌兰布和沙漠两种植物的分布格局及其变化. 南京林业大学学报(自然科学版). 2024(01): 155-160 .  百度学术
百度学术
2. 曾红,徐永艳,邵琳亚,闻永慧,夏小丽,汪琼. 4种植物叶片浸提液成分分析及其对珊瑚樱种子萌发的影响. 西南林业大学学报(自然科学). 2023(04): 39-46 . 百度学术
3. 马光宗,徐高峰,杨韶松,杨云海,张付斗,温丽娜,陶琼,申时才,叶敏. 甘薯提取物对3种杂草种子萌发和幼苗生长的化感作用. 西南农业学报. 2022(06): 1295-1302 . 百度学术
4. 路文杰,佛芒芒,肖毅,王永新,杜利霞,钟华,赵祥,董宽虎. 草地植物凋落物浸提液对根际微生物碳源利用的影响. 中国草地学报. 2021(06): 35-42 . 百度学术
5. 张林媚,刘姝玲,郭彩云. 立地条件对榆林沙区樟子松嫁接红松生长的影响. 林业科技通讯. 2021(11): 32-37 . 百度学术
6. 王方琳,尉秋实,柴成武,王理德,张德魁,王昱淇,王飞,胡小柯. 沙蒿(Artemisia desertorum)浸提液对自身种子萌发与幼苗生长的化感作用. 中国沙漠. 2021(06): 21-28 . 百度学术
其他类型引用(3)


计量
- 文章访问数: 887
- HTML全文浏览量: 396
- PDF下载量: 124
- 被引次数: 9
