
Potential suitable area and natural driving force of Artemisia desertorum shrub in Ulanbuh Desert of northwestern China
-
摘要:目的 研究典型荒漠物种地理分布变化及驱动因素,可为恢复荒漠植被提供科学依据。方法 本文以乌兰布和沙漠优势植物沙蒿为研究对象,通过实地调查及遥感影像识别的方法收集整理沙蒿灌丛的地理分布数据,结合29个环境变量数据,筛选得到最优物种分布模型。采用最优模型,基于NorESM1-M气候模式,预测了在两种排放情景下、不同时期乌兰布和沙漠沙蒿灌丛的潜在适宜区,分析得到其适宜分布的主要环境因子阈值范围;预测未来气候变化对沙蒿灌丛潜在地理分布的影响,并划分适宜分布区。结果 沙蒿灌丛地理分布的决定因子为年均温,适宜区间为7.4 ~ 9.0 ℃,最适值为8.4 ℃。主要自然驱动因子是坡度及最湿润季节平均温度,温度因子相对于降雨量因子更为重要。在2050s RCP2.6排放模式下,沙蒿灌丛的质心将向西南方向迁移4.55 km,随着CO2排放强度增强,将转向北迁移1.21 km,到2070s,在RCP2.6排放模式下,沙蒿灌丛的质心将向东北方向迁移2.60 km,随着CO2排放强度增强,将继续向北迁移0.83 km。随着时间推移及气候变暖,沙蒿适宜生境不断破碎化且适宜生境面积逐渐缩减,更多的适宜生境退化为低适宜或不适宜生境。结论 针对沙蒿适宜区将缩减的变化趋势,应密切关注乌兰布和沙漠气候变化对沙蒿灌丛分布区的影响,开展相应生态恢复研究。当前高、中适宜区应积极种植沙蒿,不适宜区应在经济技术可行的前提下积极发展其他本土植被,或通过改善沙地质地等方式提高其适宜性。在未来气候变暖的趋势下,应加强生态监测,根据分布区变化情况采取措施积极应对,以提高区域植被覆盖率,形成良性循环,最终达到恢复荒漠植被、提高生态系统稳定性、发挥其生态功能的目的。Abstract:Objective By studying the changes of geographical distribution of typical desert species and their driving factors, we can provide scientific basis for the restoration of desert vegetation.Method In this paper, Artemisia desertorum, the dominant plant in Ulanbuh Desert of northwestern China, was taken as the research object. The geographical distribution data of A. desertorum were collected and sorted out through field investigation and remote sensing image recognition. Combined with 29 environmental variables, the optimal species distribution model was obtained, and the optimal model was adopted. Based on the Noresm1-M climate model, the potential distribution of A. desertorum in different periods under two emission scenarios was predicted, and the threshold range of major environmental factors for its suitable distribution was analyzed, and the impact of future climate change on the potential geographical distribution of A. desertorum shrub was predicted, and it was divided into suitable distribution areas.Result The maximum entropy (MaxEnt) model was the best one to simulate the geographical distribution of A. desertorum shrub. The annual average temperature was the determining factor of the geographical distribution of A. desertorum shrub. The suitable range of annual average temperature was 7.4−9.0 ℃, and the threshold was 8.4 ℃. The main natural driving factors were slope and average temperature in the wettest season, and temperature was more important than rainfall. In the 2050s, under RCP2.6 emission mode, the centroid of A. desertorum shrub will migrate 4.55 km to the southwest, and with the increase of CO2 emission intensity, it will migrate 1.21 km northward. By the 2070s, the centroid of A. desertorum shrub will migrate 2.60 km to northeast under the RCP2.6 emission mode. With the increase of CO2 emission intensity, it will turn to migrate 0.83 km northward. With the passage of time and the warming of climate, the suitable habitat of A. desertorum was continuously fragmented and the suitable habitat area was gradually reduced, and more suitable habitat was degraded to low or unsuitable habitat.Conclusion With the shrink of A. desertorum’s most suitable area, the impact of climate change in Ulanbuh Desert on the distribution area of A. desertorum shrub should be closely observed, and the corresponding ecological restoration research should be carried out. At present, the high and moderate suitable areas should be actively planted with A. desertorum, and the unsuitable areas should actively develop other local vegetation under the premise of economic and technological feasibility, or improve their suitability by improving the sandy geology. Under the trend of future climate warming, ecological monitoring should be strengthened, and measures should be taken to actively respond to the changes in the distribution area, so as to improve the regional vegetation coverage and form a virtuous cycle, and finally achieve the goal of restoring desert vegetation, improving the stability of the ecosystem and giving full play to its ecological functions.
-
Keywords:
- Ulanbuh Desert /
- MaxEnt /
- Artemisia desertorum /
- response /
- contribution rate
-
乌兰布和沙漠为中国八大沙漠之一,位于荒漠与荒漠草原的过渡地带,属于生态脆弱区,其对气候变化异常敏感[1-2]。20世纪50年代,我国就开始对乌兰布和沙漠进行土地沙漠化防治[3],但仍有较大改善空间。沙蒿(Artemisia desertorum)为此地主要建群种,是干旱半干旱地区沙地的重要植被类型[4],一般单株或多株散生分布,其伴生植物主要有冰草(Agropyron cristatum)、沙米(Agriophyllum arenarium)等[5]。沙蒿也是我国西北干旱半干旱地区主要的防风固沙植物[6],在改善荒漠环境条件中发挥着极其重要的作用。目前,关于沙蒿的研究主要集中在根系分布特征研究[7]、根际微生物[8-9]、沙蒿病虫害[10-12]、种群分布特征[13-19]、群落多样性[20-21]、防风固沙效应[22-26]等方面。从区域尺度进行沙蒿适宜分布区的相关生态研究,有助于解决目前紧迫的区域环境及生物保护问题。因此,在气候变化条件下,研究荒漠植被优势物种沙蒿适宜区分布的变化,具有极其重要的生态学意义。
物种分布模型[27]根据物种分布与环境变量的相互关系得到物种分布适宜区。物种分布信息的精确性是影响物种分布适宜区结果的影响因素之一。国内外学者已经针对不同排放情景植物适宜分布区开展了广泛的相关研究,郑维艳等[28]研究未来气候变化对木姜子
(Litsea pungens)地理分布的影响,结果表明其适宜区面积随着气候变暖而减少。李垚等[29]研究气候变暖对栓皮栎 (Quercus variabilis)地理分布格局影响发现,栓皮栎潜在适宜分布区面积减小并有向北回缩的趋势。马松梅等[30]分析气候变化对梭梭(Haloxylon ammodendron)植物适宜分布区影响,指出未来气候情景下,适宜分布范围将显著增加,分布范围及重心可能将向西北和东北方向迁移。而研究荒漠植物沙蒿随气候变化的迁移方式,系统分析种群分布与气候要素的关系,准确预测气候变化对植物种群分布的影响,对于科学认识气候变化对荒漠建群物种的影响、制定有效应对荒漠化的对策将有重要的理论和现实意义。 关于物种分布信息,尽管本次研究基于野外观测的植物分类会更加真实和详尽,但在部分无人区如沙漠地带,由于准确获取大范围植物信息较为困难,且难以确定不同植物类型的边界[31],这为实地调查带来各种障碍。遥感影像物种识别为消除这些障碍提供了一个较为可靠的途径。因此,本文以自然生态系统为基础,采用遥感影像物种识别与实地调查相结合的方法,收集分析自然条件下乌兰布和沙漠中沙蒿的分布情况,分析沙蒿物种分布与不同环境变量的响应关系,找出沙蒿在乌兰布和沙漠的适宜分布区,为恢复和保护沙漠植被提供参考,进而为荒漠植物资源可持续利用与开发提供科学依据。
1. 研究区概况
乌兰布和沙漠地处温带半干旱到干旱气候的过渡地带,北临狼山,西临巴彦乌拉山,南临贺兰山,东临黄河,西北濒临降水量不足100 mm的欧亚大陆干旱核心区。乌兰布和沙漠属于温带大陆性荒漠气候[32],此地干旱少雨、日照充足、日温差大、蒸发量大、无霜期短、风力强盛,冬季盛行偏北风,夏季偏南风,春季风速最大,除南部平原、盆地外,每年大于等于8级的区域性大风日数为10 ~ 15 d。干燥度为0.2 ~ 6.4,年降水量为90 ~ 215 mm,蒸发量为≥2 800 mm,空间差异较大,最长连旱日数为58 ~ 180 d,年平均温度7.5 ~ 8.6 ℃,1月平均气温−15 ~ 8 ℃,7月平均气温12 ~ 26 ℃,年平均日照时数2 800 ~ 3 400 h,≥10 ℃积温3 400 ℃·d,生长期139 d,年均风速4.1 m/s[33]。区内土壤主要有风沙土、灰漠土、灰棕漠土、盐土四大类,该区域荒漠植被处于草原化荒漠和荒漠化草原过渡区,具有明显的草原化特征。沙蒿是该区域内主要优势物种,其他常见植物还包括沙生针茅(Stipa caucasica subsp. glareosa)、冷蒿(Artemisia frigida)、沙米(Agriophyllum arenarium)、白刺(Nitraria tangutorum)、梭梭(Haloxylon ammodendron)、沙冬青(Ammopiptanthus mongolicus)等。
2. 数据与方法
2.1 数据类型和来源
2.1.1 物种分布数据
本研究的物种分布数据,主要通过实地调查、标本库数据、已发表论文数据[34]及多源遥感识别得到。其中标本库的物种分布数据和现场调查的数据作为影像判读的真实值来源。
(1)标本库数据
通过世界生物多样性信息机构( Global Biodiversity Information Facility,GBIF)(www.gbif.org)、中国数字标本馆(http://www.cvh.ac.cn)、中国国家标本资源共享平台(NSII,http://www.nsii.org.cn/2017/)和中国学术期刊全文数据库的数据综合获取沙蒿分布信息。在各资源共享平台中,通过输入物种的拉丁名,查询得到的物种坐标或位置;对中国学术期刊全文数据库利用,主要是以各优势树种的中文名或拉丁名作为主题词进行检索,获取相应物种坐标或位置信息。
(2)遥感影像进行物种识别
遥感数据物种识别主要采用最大似然法[34],基于Landsat 8影像数据进行,运用高分二号影像进行物种辅助识别,实地调查数据进行验证。最大似然法进行物种识别的总体精度为88.77%,Kappa系数为0.8185。
(3)数据整理
对收集与影像识别得到的数据进行整理,主要是删除重复信息和内容不完整信息,对研究范围的数据进行地理核对,删除错误信息。如果仅有位置信息记录,则通过Google Earth获取坐标信息,并删除重复记录。通过Excel将树种经纬坐标另存为csv格式,用于物种分布模型的建立。处理后得到69个点位数据,具体点位详见图1。
2.1.2 数据收集及筛选
(1)数据来源
本研究共选取了29个环境变量。其中 BIO(bioclimatic variables)数据系列共包括19个变量,可分为气温和降水两大部分[35],气候数据主要通过世界气候数据库网站(http://www.worldclim.org)下载获得。本次研究根据数据的可达性和现实条件,结合区域环境特点选取了海拔梯度(dem)、坡度(slope)、坡向(aspect)、植被指数(NDVI)、地下水水位(underwater)、土壤有机质含量(clay)、土壤总氮含量(total N)、土壤总磷含量(total P)、土壤总钾含量(total K)等环境变量,地形因子数据来源于地理空间数据云平台(http://www.gscloud.cn/sources),土壤数据来源于国家地球系统科学数据中心(http://www.geodata.cn/index.html)。植被指数基于Landsat 8影像数据,通过波段运算得到[36]。地下水数据引用磴口县水务局于1990—2015年测得的月平均地下水埋深数据[37],同时,鉴于土壤干燥度数据直接采集条件限制,运用遥感的方法反演得到地表水分指数(land surface water index,LWSI)[36]。在ArcGIS 10.5中,将所有环境因子分辨率统一为1 km。
(2)环境变量筛选
环境变量之间通常存在共线性,影响模型结果,需要进行筛选。本研究采用方差膨胀因子(variance inflation factor,VIF)[38]进行环境变量筛选。VIF = 1/(1 − R2) ,VIF数值越大,表示变量间多重共线性越严重[39], R2为线性模型的回归系数。当0 < VIF < 10,变量间不存在多重共线性;当10 ≤ VIF < 100,变量间存在较强的多重共线性,当VIF ≥ 100变量间多重共线性严重。筛选出16个环境变量用于模型运算(表1)。
表 1 用于建模环境变量一览表Table 1. List of environment variables used for modeling序号
No.类型
Type环境因子
Environment factor方差膨胀因子
Variance inflation
factor (VIF)值范围
Range of value1 气候因子
Climate factor年均温 Annual mean temperature (bio1) 5.12 7.39 ~ 9.56 ℃ 2 最湿润季节平均温度
Mean temperature of the wettest quarter (bio8)7.55 18.88 ~ 24.60 ℃ 3 最干燥季节平均温度
Mean temperature of the driest quarter (bio9)4.58 −8.50 ~ −3.31 ℃ 4 最干燥月降雨量 Precipitation of the driest month (bio14) 7.35 0 ~ 3 mm 5 降水量季节变化
Seasonal variation of precipitation (bio15)9.04 83.22 ~ 112.55 mm 6 最冷季节平均温度
Mean temperature of the coldest quarter (bio19)2.68 0 ~ 10 ℃ 7 地形因子
Topography factor坡向 Aspect (aspect) 1.32 平地,北,东北,东,
东南,南,西南,西,西北
Flat land, north, northeast,
east, southeast, south,
southwest, west, northwest8 海拔 Elevation (dem) 5.21 968 ~ 1 711 m 9 坡度 Slope (slope) 1.06 0° ~ 71.14° 10 土壤因子
Soil factor土壤黏粒 Soil clay (clay) 1.75 77 ~ 269 g/kg 11 总氮 Total N (TN) 3.49 0 ~ 338 g/kg 12 总钾 Total K (TK) 1.74 0 ~ 2 460 g/kg 13 总磷 Total P (TP) 1.71 0 ~ 92 g/kg 14 其他立地因子
Other site factors陆表水分指数 Land surface moisture index (LSWI) 1.29 0 ~ 255 15 植被指数 Vegetation index (NDVI) 1.43 −1 ~ 1 16 地下水位 Underground water level 1.79 0 ~ 10 m 2.2 气候情景的设定
全新世中期(6 000年前)、未来 2050s (2041—2060年)、2070s(2061—2080年)的气候情景数据下载于 Worldclim网站(http://www. worldclim.org),空间分辨率为30弧秒,约1 km,坐标系统为 GCS_WGS_1984。
根据刘兆飞等[40]针对蒙古高原34个CMIP5气候模式评估的研究结果可知:NorESM1-M气候模式对气温和降水的综合评价结果最优,因此,本研究选择NorESM1-M气候模式对未来情景进行预测。同时选择不同时期的这两种相对极端的排放模式(RCP2.6和RCP8.5)。RCP2.6是积极减排CO2的情景,其辐射强度在2010—2020年间达到大约3 W/m2的峰值,温度上升约0.3 ~ 1.7 ℃;RCP8.5情景表示一直保持高强度的CO2排放,到2100年其辐射强度达到8.5 W/m2,温度上升约2.6 ~ 4.8 ℃[41]。
2.3 物种分布模型
2.3.1 供选模型
本研究采用7种模型对沙蒿灌丛的适宜分布区进行模拟,模型包括Bioclim[42]、Domain[43]、Mahalanobis[44]、随机森林(random forest,RF)、支持向量机(support vector machine,SVM)[45]、最大熵模型(maximum entropy,Maxent)、广义线性模型(generalize linear model, GLM) [46]。
2.3.2 模型筛选
物种分布模型的结果一般是值域为[0,1]的连续值,表示物种分布可能性的概率,“1”表示可以分布,“0”表示不能分布。目前主要采用误差矩阵对模型精度进行评价。定义如下:a表示实测与预测结果都分布的样点数目;b表示错误预测分布的样点数目; c表示实测与预测都不分布的样点数目;d表示预测遗漏的实际分布点位数,四者之和即为样本总数n。采用指标AUC对预测模型的精度进行评价,具体表达式如下:
AUC=1(a+c)(b+d)∑b+di=1∑a+cj=1φ(Xi,Yi) 式中:若Y > X,则
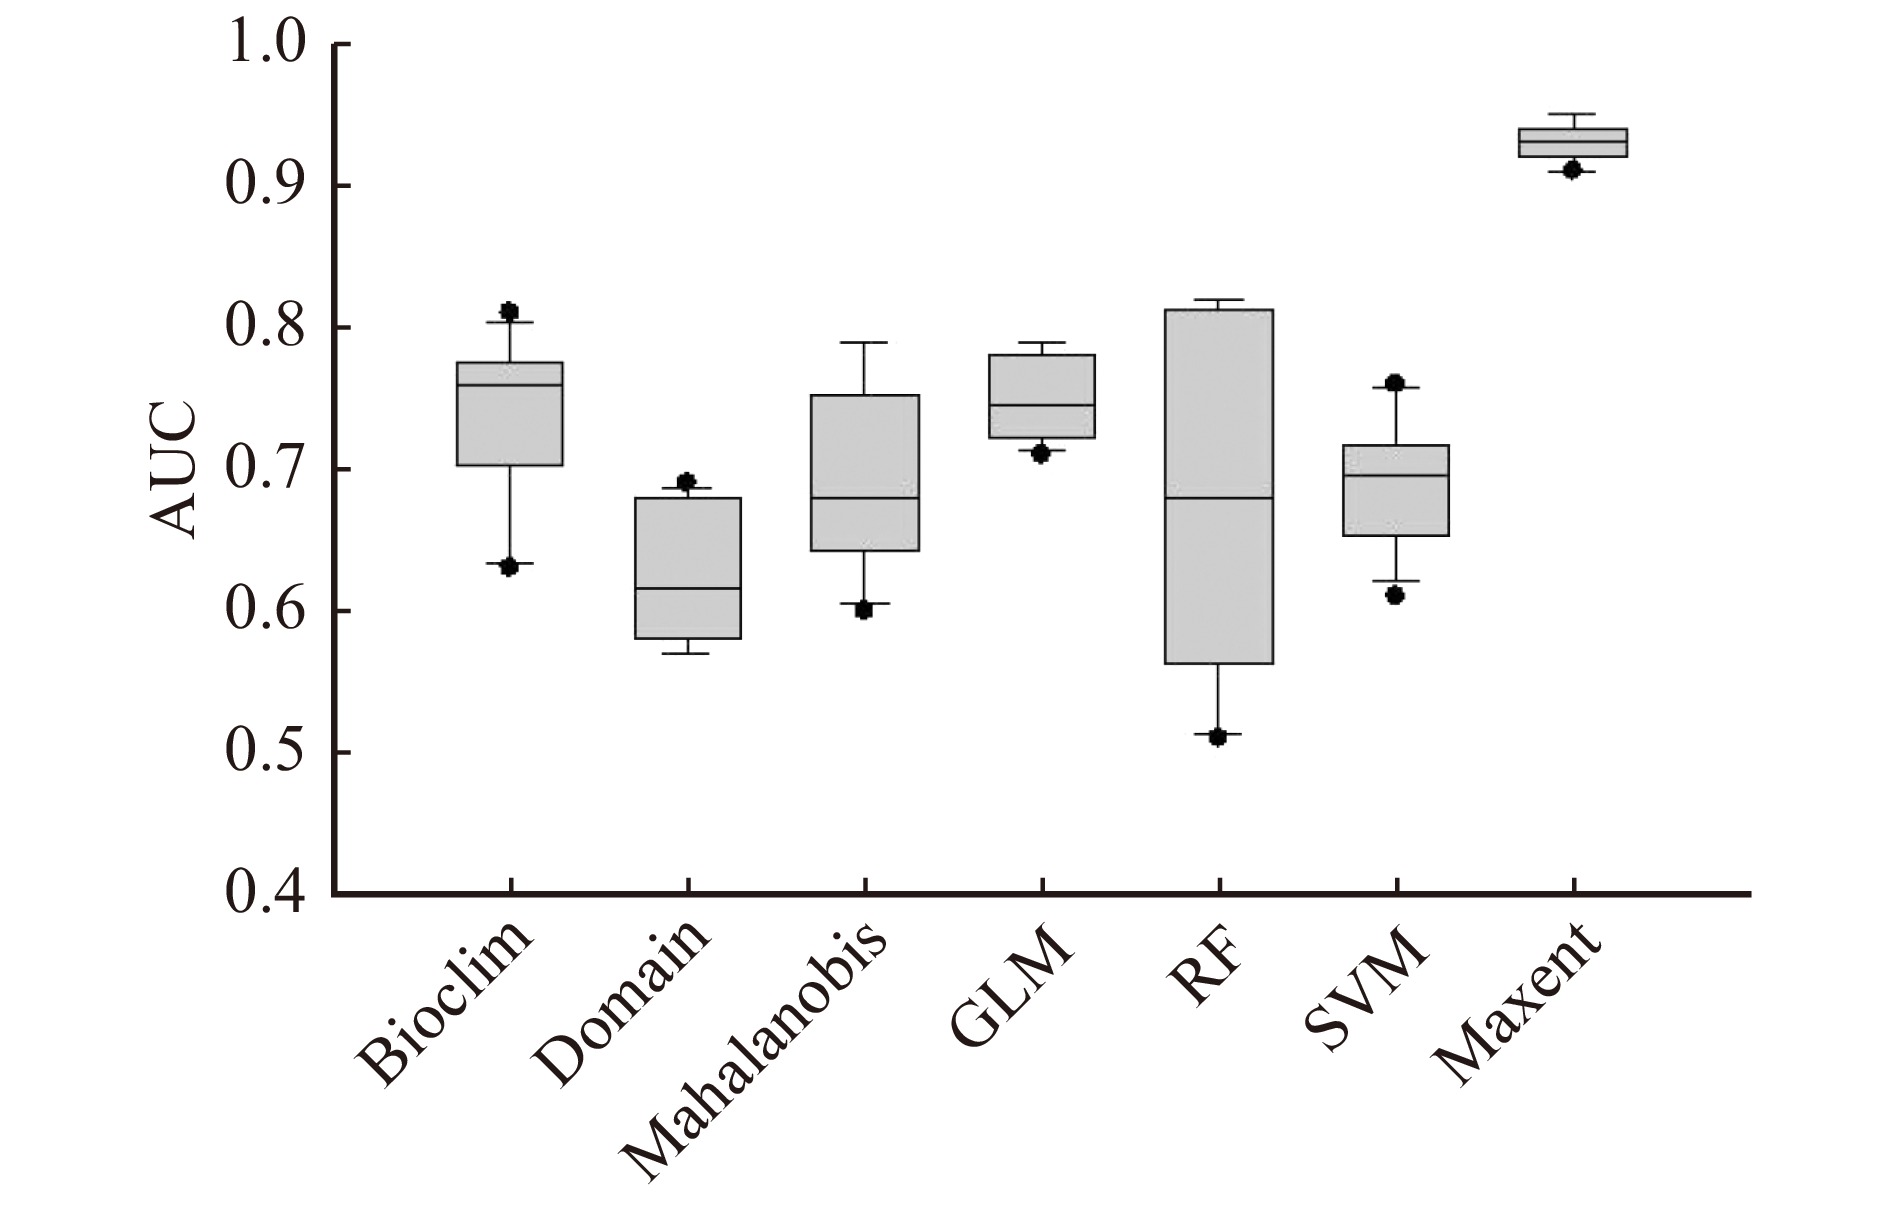
φ(X,Y)=1 ,若Y = X,则φ(X,Y)=1/2 ,否则φ(X,Y)=0 。Xi和Yi分别为实测未分布样本和实测分布样本j上的预测值。受试者操作特征曲线下面积 AUC(area under the curve)代表 ROC 曲线评价,用来评估模型对非分布和分布进行区分的能力,AUC 取值为[0,1],AUC > 0.85 表示模拟验证结果良好,AUC > 0.9则可表示模拟结果拥有很高的精确度[47]。将沙蒿分别放入7种模型中进行模拟,从模型预测结果可知,7种物种分布模型得到的模拟精度不一,其中最大熵模型精度最高,AUC值中值为0.93,且较为稳定,具体对比详见图2。
![]() 图 2 物种分布模型精度对比横坐标为模型名称。GLM.广义线性模型;RF.随机森林;SVM.支持向量机;Maxent.最大熵模型。The abscissa is the model name. GLM, generalized linear model; RF, random forest; SVM, support vector machine; Maxent, maximum entropy model.Figure 2. Accuracy comparison of species distribution models
图 2 物种分布模型精度对比横坐标为模型名称。GLM.广义线性模型;RF.随机森林;SVM.支持向量机;Maxent.最大熵模型。The abscissa is the model name. GLM, generalized linear model; RF, random forest; SVM, support vector machine; Maxent, maximum entropy model.Figure 2. Accuracy comparison of species distribution models2.4 潜在适宜分布区
依据统计学的小概率事件(P < 0.05),并结合联合国政府间气候变化专门委员会关于评估可能性的划分标准[48],进行适宜区分级,即P < 0.05为不适宜区,0.05 ~ 0.33为低适宜区,0.33 ~ 0.66为中适宜区, > 0.66为高适宜区。基于最大熵模型预测结果,计算沙蒿物种分布不同程度的适宜区,并通过比较不同情景下分布区质心的变化,来分析气候变化条件下物种分布区的迁移方向和迁移距离,其中物种分布区质心迁移通过SDMtools[49]计算得到。
3. 结果与分析
关于物种分布模型,有些学者主张将多个模型的模拟结果进行集合,以期得到更好的结果[50-51],但也有学者认为[52-53],多个模型模拟的结果将会使模型的拟合精度降低,进而降低了模拟结果的准确性。不同模型模拟精度存在差异主要是模型的机理与算法不一样引起的。本研究对7种不同模型的模拟效果进行了评估筛选,并进行多次运行模拟,以期模型稳定,并筛选出最优模型以提高模拟准确性。
关于环境变量选择,主要使用Spearman相关分析[54]、Pearson相关分析或主成分分析等相关分析的方法,选取相关性弱的环境变量用于模型模拟。Elith等[55]认为仅根据相关分析获取的变量对生物学机理的解释性较差,而本研究采用方差膨胀系数进行因子选择,以防止模拟结果过拟合,且通过最大熵模型的刀切法进行环境变量重要性排序,具有较强的生物学解释性意义。因此,在进行环境变量的选择时,应依据模拟结果而非仅仅通过环境变量的相关性分析得到。
本次研究对象为沙蒿灌丛,沙蒿多生长于沙丘上,是沙地植被演替的先锋植物之一,在乌兰布和沙漠全境均有分布,在沙漠南部地区多于北部地区,西部地区多于东部地区,一般呈小斑块状分布。
3.1 影响沙蒿地理分布的主要环境变量
分析可知(表2):对沙蒿灌丛分布格局影响最大的环境变量是年均温,其贡献率高达33.70%,排列重要性为43.80,表明年均温是影响沙蒿灌丛分布的主要因子之一。坡度对沙蒿灌丛分布格局的贡献率为28.20%,年均温与坡度对沙蒿灌丛分布的总贡献率达到61.90%,说明沙蒿灌丛的生长主要受年均温及地形因子坡度的影响。最湿润季节平均温度的贡献率为11.40%,而降雨量相关因子总贡献率不超过5.00%,说明沙蒿灌丛对温度的要求超过对降水量的要求。其余环境因子中,植被指数和陆表水分指数贡献率均不低于5.00%,而土壤养分因子总和不超过5.00%,说明沙蒿受土壤养分因子影响相对较小。因此,沙蒿灌丛分布格局的决定因子为年均温,主要因子有坡度及最湿润季节平均温度;在沙蒿灌丛分布格局的重要性方面,环境因子中温度因子相对于降雨量因子更为重要。
表 2 沙蒿灌丛环境因子贡献率及重要性Table 2. Contribution rate and importance of environmental factors of Artemisia desertorum shrub环境变量
Environment variable贡献率
Contribution rate/%重要性
Importance环境变量
Environment variable贡献率
Contribution rate/%重要性
Importancebio1 33.70 43.80 bio19 1.50 5.60 slope 28.20 7.50 aspect 1.30 1.70 bio8 11.40 2.70 dem 1.10 12.20 NDVI 5.90 5.70 TP 0.90 0 LSWI 5.00 8.90 bio9 0.90 0.50 TN 3.30 1.40 clay 0.60 2.00 地下水水位
Underground water level2.90 3.10 TK 0.40 0.80 bio15 2.70 3.10 bio14 0.20 1.00 注:重要性是指训练得到一个模型之后,不同特征变量对预测结果的影响大小。Notes: importance refers to the influence of different characteristic variables on the prediction results after the training of a model. 3.2 沙蒿地理分布的环境变量最适值
沙蒿适宜分布的海拔范围为1 014 ~ 1 070 m,最适值为1 052 m,且沙蒿灌丛的存在概率在达到最适值前基本是一样的,到达最适值后,存在概率将会急剧降低。随着坡度增加,其存在概率逐渐降低(图3b),坡向适宜区间为各个坡向,在坡向最适值为175°时出现最大存在概率,即较适宜东南向,土壤总氮含量适宜区间为20 ~ 338 g/kg,存在着两个波峰,分别为58及145 g/kg,且随着土壤氮含量增加呈现出波浪增加的趋势,达到最适值后则出现饱和,随后缓慢降低。土壤总钾含量适宜区间为1 530 ~ 2 460 g/kg,最适值为1 856 g/kg,随着磷含量的继续增加,到达最适值后会出现协同反馈效应。土壤黏粒含量适宜区间为77.58 ~ 269.74 g/kg,最适值为142.12 g/kg,沙蒿灌丛存在的概率随着土壤黏粒含量的增加而呈现缓慢降低的趋势,植被指数适宜区间为0 ~ 0.8,最适值为0.2(图3d)。陆表水分指数适宜区间为21 ~ 75,最适值为51,分布存在概率与陆表水分指数呈现负指数相关的关系。地下水埋深的适宜范围为1.1 ~ 2.7 m,最适值为1.5 m。随着地下水位埋深的增加,存在概率逐渐增加,到达1.5 m深后,存在概率开始逐渐降低,年均温适宜区间为7.19 ~ 9.00 ℃,最适值为8.36 ℃(图3a)。最干燥月降雨量适宜区间为0 ~ 1.5 mm,随着最干燥月降雨量的增加,沙蒿的存在概率会逐渐降低,各季节降雨量适宜区间为95 ~ 115 mm,最适值为99 mm。最暖季节平均温适宜区间为0 ~ 10 ℃,最适值为4.03 ℃。最湿润季节平均温度范围为18.2 ~ 24.8 ℃,最适值为21.01 ℃(图3c)。最干燥季节平均温度范围为−8.55 ~ −3.32 ℃,最适值为−7.10 ℃。
![]() 图 3 沙蒿对主要环境变量的响应曲线Figure 3. Response curves of Artemisia desertorum to main environmental variables
图 3 沙蒿对主要环境变量的响应曲线Figure 3. Response curves of Artemisia desertorum to main environmental variables3.3 沙蒿潜在地理分布格局的气候响应及迁移趋势预测
本研究基于最大熵模型进行沙蒿的潜在适宜区分析,沙蒿当前气候情景的高适宜分布区主要集中于研究区的东北部,中适宜区为高适宜区的缓冲地带,低适宜区为研究区中部,不适宜区主要为研究区西部。其中高适宜区分布面积为6.79 km2,占研究区的4.57%;中适宜区分布面积为11.80 km2,占研究区的7.93%;低适宜区分布面积为65.57 km2,占研究区的44.08%;不适宜区分布面积为64.59 km2,占研究区的43.42%,详见表3、图4。
![]() 图 4 沙蒿在不同气候情景下的适宜区分布Figure 4. Suitable distribution area of Artemisia desertorum under different climate scenarios表 3 沙蒿当前气候情景适宜分布区面积Table 3. Suitable distribution area of Artemisia desertorum under current climate scenarios
图 4 沙蒿在不同气候情景下的适宜区分布Figure 4. Suitable distribution area of Artemisia desertorum under different climate scenarios表 3 沙蒿当前气候情景适宜分布区面积Table 3. Suitable distribution area of Artemisia desertorum under current climate scenarios适宜性 Suitability 当前面积
Current area/km2比例 Ratio/% 不适宜区 Unsuitable area 64.59 43.42 低适宜区 Low-suitable area 65.57 44.08 中适宜区 Medium-suitable area 11.80 7.93 高适宜区 High-suitable area 6.79 4.57 合计 Total 148.76 100.00 相对于当前气候情景下,沙蒿在全新世中期高适宜分布区及不适宜区范围较广,分别为1.75 km2和4.75 km2,而中适宜分布及低适宜区相对较少,分别比当前少1.93 km2和4.57 km2。
未来2050s气候情景下,在RCP2.6排放模式下,不适宜区的面积将显著增加,主要位于研究区的西部及南部,增加面积为25.14 km2,高适宜区的面积有些许增加,增加面积为2.10 km2,中适宜区及低适宜分布区均呈现出不同程度的减少,分别减少2.96 和24.28 km2;在RCP8.5排放模式下,其不适宜区的面积将显著增加,增加面积为20.66 km2,高适宜分布区面积增加为1.69 km2,中适宜区及低适宜分布区均呈现出不同程度的减少,分别减少2.50和19.85 km2。
未来2070s气候情景下,在RCP2.6排放模式下,不适宜区的面积将显著增加,相对当前气候情景,将有49.26 km2演变为不适宜生境,其中高适宜分布区、中适宜区和低适宜分布区均呈现出不同程度的减少,分别减少1.98、2.91和44.37 km2;在RCP8.5排放模式下,相对于当前气候情景,将有13.99 km2演变为不适宜生境,不适宜区的面积将显著增加,中适宜区相对于当前增加0.41 km2。其中高适宜分布区和低适宜分布区均呈现出不同程度的减少,分别减少13.41和0.99 km2。
沙蒿灌丛在2050s RCP2.6排放模式下,其质心将由目前所在位置向西南方向迁移4.55 km,随着CO2排放强度增强,将转向北方向迁移1.21 km。到2070s,在RCP2.6排放模式下,其质心将向东北方向迁移2.60 km,随着CO2排放强度增强,将继续向北方向迁移0.83 km(图5)。随着时间推移及气候变暖,沙蒿适宜生境不断破碎化且适宜生境面积逐渐缩减,更多的适宜生境退化为低适宜或不适宜生境,因此,针对沙蒿的现有适宜生境应加强保护,并针对中低适宜区采取针对性措施将其恢复为较适宜生境,以提高荒漠植被覆盖率,提升荒漠生态系统功能,维护荒漠生态系统的平衡。
![]() 图 5 沙蒿灌丛在不同气候情景下迁移趋势示意图Figure 5. Schematic diagram of migration trend of Artemisia desertorum under different climate scenarios
图 5 沙蒿灌丛在不同气候情景下迁移趋势示意图Figure 5. Schematic diagram of migration trend of Artemisia desertorum under different climate scenarios4. 讨论与结论
自19世纪末 “小冰期”以后,近二十年来CO2排放量增多,气温升高明显,全球气温变暖,研究区乃至整个西北地区出现干旱的趋势[56-58]。本研究采用NorESM1-M气候模式对气温和降水进行综合模拟,在2050s和2070s时期,不同排放浓度的气候背景下,沙蒿不适宜区面积均表现为扩张,且随着排放浓度的增加,扩张趋势在缩减,说明沙蒿在一定程度上能适应气候变暖,这与沙蒿长期适应沙漠气候的生理生态特性是分不开的。同时,进一步分析可知,沙蒿灌丛分布格局决定因子为年均温,贡献率为33.70%,年均温与坡度对沙蒿灌丛分布的总贡献率达到61.90%,且温度因子相对于降雨量因子更为重要。而沙蒿天然分布区的环境特征正好与环境因子相符合,即分布区小沙丘起伏不平,气温相对适宜。沙漠地区蓄滞水能力较差,沙蒿适应沙漠区域干旱环境,避免高温伤害,形成抗旱的生理特性及形态结构,比如叶片裂成线形,面积小,而其地下部分则采取了远离高温的生长方向生长,根系发达,有垂直入土的主根和发达的侧根。沙蒿蒸腾速率高,水分利用效率低,通过对土壤干旱和高温的抗性机制保持高效利用率,并在土壤湿润时迅速提高光合能力和积累干物质来适应半干旱的沙漠环境,并且通过高蒸腾速率和水分吸收能力来抑制其他植物生长[4]。同时,沙蒿灌丛的适宜分布区随着气温升高,优先向西北或北方气温较低的方向迁移,这进一步说明在长时间尺度和气候变暖条件下,温度因子相对于降雨量因子更为重要。沙蒿灌丛最佳坡度适宜区间为0° ~ 71°,最适值为53°,而非印象中较平坦区域,这与地形变化引起下垫面太阳辐射角度发生变化,从而形成了更利于沙蒿生存的生境有关。为了适应较高温而干旱的荒漠环境,多个环境因子共同驱动沙蒿更好地适应周围环境。
本次构建物种分布模型过程中假设物种迁移能力是无限的,且没有考虑物种的实际迁移能力、种间竞争、地理阻隔等因素,未来可以尝试将物种迁移扩散能力耦合进模型,以期更准确地模拟物种迁移变化趋势,从而为物种保护管理提供科学决策依据。
本研究中采取了7种不同的物种分布模型(包括Bioclim、Domain、Mahalanobi、RF、SVM、Maxent、GLM)对沙蒿灌丛的适宜分布区进行模拟,结果表明最大熵模型是模拟沙蒿灌丛物种分布的最优模型。温度因子相对于降水因子更能主导沙蒿灌丛的分布,沙蒿的年均温适宜区间为7.39 ~ 9.12 ℃,最适值为8.36 ℃,最湿润季节平均温度范围为18.90 ~ 24.60 ℃,最适值为21.00 ℃。随着全球气候变暖,沙蒿适宜区呈缩减趋势,应在当前高中适宜区积极种植沙蒿,或者对高适宜区进行保护,减少人为干扰;而针对不适宜区,在经济及技术可行的前提下,应积极发展其他本土植物,或通过改善沙地质地等方式提高其适宜性,以提高区域植被覆盖率,发挥其生态功能。在全球气候变暖的大背景下,建议加强荒漠−绿洲过渡带等生态脆弱区的生态监测,特别是对沙蒿适宜区分布的变化的监测,以更好应对气候变化。
-
![]()
图 2 物种分布模型精度对比
横坐标为模型名称。GLM.广义线性模型;RF.随机森林;SVM.支持向量机;Maxent.最大熵模型。The abscissa is the model name. GLM, generalized linear model; RF, random forest; SVM, support vector machine; Maxent, maximum entropy model.
Figure 2. Accuracy comparison of species distribution models
![]()
图 3 沙蒿对主要环境变量的响应曲线
Figure 3. Response curves of Artemisia desertorum to main environmental variables
![]()
图 4 沙蒿在不同气候情景下的适宜区分布
Figure 4. Suitable distribution area of Artemisia desertorum under different climate scenarios
![]()
图 5 沙蒿灌丛在不同气候情景下迁移趋势示意图
Figure 5. Schematic diagram of migration trend of Artemisia desertorum under different climate scenarios
表 1 用于建模环境变量一览表
Table 1 List of environment variables used for modeling
序号
No.类型
Type环境因子
Environment factor方差膨胀因子
Variance inflation
factor (VIF)值范围
Range of value1 气候因子
Climate factor年均温 Annual mean temperature (bio1) 5.12 7.39 ~ 9.56 ℃ 2 最湿润季节平均温度
Mean temperature of the wettest quarter (bio8)7.55 18.88 ~ 24.60 ℃ 3 最干燥季节平均温度
Mean temperature of the driest quarter (bio9)4.58 −8.50 ~ −3.31 ℃ 4 最干燥月降雨量 Precipitation of the driest month (bio14) 7.35 0 ~ 3 mm 5 降水量季节变化
Seasonal variation of precipitation (bio15)9.04 83.22 ~ 112.55 mm 6 最冷季节平均温度
Mean temperature of the coldest quarter (bio19)2.68 0 ~ 10 ℃ 7 地形因子
Topography factor坡向 Aspect (aspect) 1.32 平地,北,东北,东,
东南,南,西南,西,西北
Flat land, north, northeast,
east, southeast, south,
southwest, west, northwest8 海拔 Elevation (dem) 5.21 968 ~ 1 711 m 9 坡度 Slope (slope) 1.06 0° ~ 71.14° 10 土壤因子
Soil factor土壤黏粒 Soil clay (clay) 1.75 77 ~ 269 g/kg 11 总氮 Total N (TN) 3.49 0 ~ 338 g/kg 12 总钾 Total K (TK) 1.74 0 ~ 2 460 g/kg 13 总磷 Total P (TP) 1.71 0 ~ 92 g/kg 14 其他立地因子
Other site factors陆表水分指数 Land surface moisture index (LSWI) 1.29 0 ~ 255 15 植被指数 Vegetation index (NDVI) 1.43 −1 ~ 1 16 地下水位 Underground water level 1.79 0 ~ 10 m  下载: 导出CSV
表 2 沙蒿灌丛环境因子贡献率及重要性
Table 2 Contribution rate and importance of environmental factors of Artemisia desertorum shrub
环境变量
Environment variable贡献率
Contribution rate/%重要性
Importance环境变量
Environment variable贡献率
Contribution rate/%重要性
Importancebio1 33.70 43.80 bio19 1.50 5.60 slope 28.20 7.50 aspect 1.30 1.70 bio8 11.40 2.70 dem 1.10 12.20 NDVI 5.90 5.70 TP 0.90 0 LSWI 5.00 8.90 bio9 0.90 0.50 TN 3.30 1.40 clay 0.60 2.00 地下水水位
Underground water level2.90 3.10 TK 0.40 0.80 bio15 2.70 3.10 bio14 0.20 1.00 注:重要性是指训练得到一个模型之后,不同特征变量对预测结果的影响大小。Notes: importance refers to the influence of different characteristic variables on the prediction results after the training of a model.
下载: 导出CSV
表 3 沙蒿当前气候情景适宜分布区面积
Table 3 Suitable distribution area of Artemisia desertorum under current climate scenarios
适宜性 Suitability 当前面积
Current area/km2比例 Ratio/% 不适宜区 Unsuitable area 64.59 43.42 低适宜区 Low-suitable area 65.57 44.08 中适宜区 Medium-suitable area 11.80 7.93 高适宜区 High-suitable area 6.79 4.57 合计 Total 148.76 100.00
下载: 导出CSV
-
[1] 吕妍, 王让会, 蔡子颖. 我国干旱半干旱地区气候变化及其影响[J]. 干旱区资源与环境, 2009, 23(11): 65−71. doi: 10.13448/j.cnki.jalre.2009.11.003 Lü Y, Wang R H, Cai Z Y. Climatic change and influence in arid and semi-arid area of China[J]. Journal of Arid Land Resources and Environment, 2009, 23(11): 65−71. doi: 10.13448/j.cnki.jalre.2009.11.003
[2] 孙康慧, 曾晓东, 李芳. 1980 ~ 2014年中国生态脆弱区气候变化特征分析[J]. 气候与环境研究, 2019, 24(4): 456−468. Sun K H, Zeng X D, Li F. Climate change characteristics in ecological fragile zones in China during 1980−2014[J]. Climatic and Environmental Research, 2019, 24(4): 456−468.
[3] 杨力生. 阿拉善盟沙漠治理的几点意见[J]. 中国沙漠, 1982, 3(4): 43−45. Yang L S. Some opinions on desert governance in Alxa League[J]. Journal of Desert Research, 1982, 3(4): 43−45.
[4] 崔骁勇, 杜占池, 王艳芬. 内蒙古半干旱草原区沙地植物群落光合特征的动态研究[J]. 植物生态学报, 2000, 24(5): 541−546. doi: 10.3321/j.issn:1005-264X.2000.05.006 Cui X Y, Du Z C, Wang Y F. Photosynthetic characteristic of a semi-arid sandy grassland community in Inner Mongolia[J]. Acta Phytoecologica Sinica, 2000, 24(5): 541−546. doi: 10.3321/j.issn:1005-264X.2000.05.006
[5] Li B. The vegetation of the Xilin River Basin and its utilization[J]. Research on Grassland Ecosystem, 1988, 3(3): 84−183.
[6] 赵明, 王文科, 王周锋, 等. 半干旱区沙地沙蒿生物量及根系分布特征研究[J]. 干旱区地理, 2018, 41(4): 110−116. doi: 10.12118/j.issn.1000-6060.2018.04.14 Zhao M, Wang W K, Wang Z F, et al. Biomass of Artemisia ordosica in sand land and its root system distribution characteristics in the semiarid regions[J]. Arid Land Geography, 2018, 41(4): 110−116. doi: 10.12118/j.issn.1000-6060.2018.04.14
[7] 赵岩, 周文渊, 孙保平, 等. 毛乌素沙地三种荒漠灌木根系分布特征与土壤水分研究[J]. 水土保持研究, 2010(4): 133−137. Zhao Y, Zhou W Y, Sun B P, et al. Root distribution of three desert shrubs and soil misture in Mu Us Sand Land[J]. Research of Soil and Water Conservation, 2010(4): 133−137.
[8] 贺学礼, 王银银, 赵丽莉, 等. 荒漠沙蒿根围AM真菌和DSE的空间分布[J]. 生态学报, 2011, 31(3): 812−818. He X L, Wang Y Y, Zhao L L, et al. Spatial distribution of arbuscular mycorrhizal fungi and dark septate endophytes in the rhizosphere of Artemisia sphaerocephala from Inner Mongolia desert[J]. Acta Ecologica Sinica, 2011, 31(3): 812−818.
[9] 张义凡, 陈林, 李学斌, 等. 不同荒漠草原植被根际与非根际土壤养分及碳库管理指数特征[J]. 草业学报, 2017, 26(1): 27−37. doi: 10.11686/cyxb2017077 Zhang Y F, Chen L, Li X B, et al. Soil nutrients and carbon management index in the rhizosphere versus non-rhizosphere area of different plant species in desert grassland[J]. Acta Prataculturae Sinica, 2017, 26(1): 27−37. doi: 10.11686/cyxb2017077
[10] 姚艳芳, 杨芹, 郭海岩, 等. 危害沙蒿的两种蛀干害虫调查[J]. 内蒙古林业调查设计, 2009, 32(4): 103−104. doi: 10.3969/j.issn.1006-6993.2009.04.041 Yao Y F, Yang Q, Guo H Y, et al. Investigation on two dry-eating pests of Artemisia sphaerocephala[J]. Inner Mongolia Forestry Investigation and Design, 2009, 32(4): 103−104. doi: 10.3969/j.issn.1006-6993.2009.04.041
[11] 王建伟, 李月华, 韩卫东, 等. 沙蒿尖翅吉丁生物学特性的研究[J]. 应用昆虫学报, 2011, 48(1): 141−146. doi: 10.7679/j.issn.2095-1353.2011.027 Wang J W, Li Y H, Han W D, et al. Biological characteristics of Sphenoptera sp. on Artemisia ordosoca[J]. Chinese Journal of Applied Entomology, 2011, 48(1): 141−146. doi: 10.7679/j.issn.2095-1353.2011.027
[12] 王杰, 李岳诚, 张大治. 基于标记重捕法的沙蒿金叶甲种群扩散研究[J]. 环境昆虫学报, 2016, 38(5): 912−917. Wang J, Li Y C, Zhang D Z. Population dispersion of Chrysolina aeruginosa based on mark-recapture method[J]. Journal of Environmental Entomology, 2016, 38(5): 912−917.
[13] 刘华民, 朴顺姬, 王立新, 等. 不同演替阶段褐沙蒿种群特征研究[J]. 生态学杂志, 2005, 24(5): 497−502. Liu H M, Piao S J, Wang L X, et al. Population characteristics in tramongolica at different successional stages[J ]. Chinese Journal of Ecology, 2005, 24(5): 497−502.
[14] 刘增文, 冯顺煜, 段而军, 等. 陕北半干旱风沙区人工林下植物群落数量特征研究[J]. 西北农林科技大学学报(自然科学版), 2008, 36(12): 129−134. doi: 10.13207/j.cnki.jnwafu.2008.12.002 Liu Z W, Feng S Y, Duan E J, et al. Quanitity characteristics of plant community under tree-layers of planted forests in semi-arid windy area of north Shaanxi Province[J]. Journal of Northwest A&F University (Natural Science Edition), 2008, 36(12): 129−134. doi: 10.13207/j.cnki.jnwafu.2008.12.002
[15] 卢小妹, 唐进年, 陈英, 等. 石羊河中下游沙蒿种群年龄结构与动态分析[J]. 中国农学通报, 2015, 31(1): 53−57. doi: 10.11924/j.issn.1000-6850.2014-1079 Lu X M, Tang J N, Chen Y, et al. Population age structure and dynamic analysis of Artemisia arenaria in middle and lower reaches of Shiyang River area[J]. Chinese Agricultural Science Bulletin, 2015, 31(1): 53−57. doi: 10.11924/j.issn.1000-6850.2014-1079
[16] 陶冶, 张元明. 准噶尔沙蒿群落主要物种间的关联性分析[J]. 中国沙漠, 2012, 32(5): 1308−1314. Tao Y, Zhang Y M. Interspecific associations among main species in Artemisia songarica communites in Junggar Basin[J]. Journal of Desert Research, 2012, 32(5): 1308−1314.
[17] 张德魁, 王继和, 马全林, 等. 腾格里沙漠南缘油蒿与沙蒿种群分布格局[J]. 甘肃科技, 2008, 24(3): 127−130. doi: 10.3969/j.issn.1000-0952.2008.03.052 Zhang D K, Wang J H, Ma Q L, et al. Population distribution pattern of Artemisia ordosica and Artemisia sphaerocephala in the southern margin of Tengger Desert[J]. Gansu Science and Technology, 2008, 24(3): 127−130. doi: 10.3969/j.issn.1000-0952.2008.03.052
[18] 张莹花, 刘世增, 刘虎俊, 等. 石羊河中游河岸沙蒿种群的空间格局和关联性分析[J]. 干旱区研究, 2013, 30(2): 256−263. doi: 10.13866/j.azr.2013.02.014 Zhang Y H, Liu S Z, Liu H J, et al. Spatial distribution pattern and relevance of Artemisia arenaria population along the river course of middle reaches of the Shiyang River[J]. Arid Zone Research, 2013, 30(2): 256−263. doi: 10.13866/j.azr.2013.02.014
[19] 靳虎甲, 马全林, 张德魁, 等. 乌兰布和沙漠典型灌木群落结构及数量特征[J]. 西北植物学报, 2012, 32(3): 579−588. doi: 10.3969/j.issn.1000-4025.2012.03.022 Jin H J, Ma Q L, Zhang D K, et al. Analysis on typical shrub plant community characteristics and quantitative characteristics in Ulanbuh Desert[J]. Acta Botanica Boreali-Occidentalia Sinica, 2012, 32(3): 579−588. doi: 10.3969/j.issn.1000-4025.2012.03.022
[20] 辛智鸣, 黄雅茹, 章尧想, 等. 乌兰布和沙漠白刺与沙蒿群落多样性及其对降水的响应[J]. 河南农业科学, 2015, 44(1): 117−120. Xin Z M, Huang Y R, Zhang Y X, et al. Community diversity of Nitraria tangutorum Bobr and Artemisia sphaerocephala in Ulanbuh Desert and its response to precipitation[J]. Journal of Henan Agricultural Sciences, 2015, 44(1): 117−120.
[21] 孙得祥. 民勤荒漠区白刺群落和沙蒿群落的自然更新能力[J]. 中国农学通报, 2010, 26(11): 346−349. Sun D X. Research on natural reproduction ability of Nitaria tangutorum community and Artemisia arenaria community in Minqin Desert area[J]. Chinese Agriculture Science Bulletin, 2010, 26(11): 346−349.
[22] 常兆丰, 李易珺, 张剑挥, 等. 民勤荒漠区4种植物的防风固沙功能对比分析[J]. 草业科学, 2012, 29(3): 358−363. Chang Z F, Li Y J, Zhang J H, et al. Comparison on functions of wind break and sand fixation four plant species in Minqin Desert[J]. Pratacultural Science, 2012, 29(3): 358−363.
[23] 马全林, 卢琦, 张德魁, 等. 沙蒿与油蒿灌丛的防风阻沙作用[J]. 生态学杂志, 2012, 31(7): 1639−1645. doi: 10.13292/j.1000-4890.2012.0307 Ma Q L, Lu Q, Zhang D K, et al. Wind prevention and sand resistance effects of Artemisia sphaerocephala and A. ordosica[J]. Chinese Journal of Ecology, 2012, 31(7): 1639−1645. doi: 10.13292/j.1000-4890.2012.0307
[24] 魏宝, 丁国栋, 吴斌, 等. 不同盖度沙蒿群丛防风作用研究[J]. 干旱区研究, 2012, 29(2): 213−217. doi: 10.13866/j.azr.2012.02.005 Wei B, Ding G D, Wu B, et al. Study on windbreak effect of Artemisia ordosica community over different vegetation coverage[J]. Arid Zone Research, 2012, 29(2): 213−217. doi: 10.13866/j.azr.2012.02.005
[25] 赵晓彬, 苏世平, 符亚儒. 榆林沙区低效防风固沙林更新改造技术研究[J]. 西北林学院学报, 2010, 25(1): 104−106. Zhao X B, Su S P, Fu Y R. Updating and transformation technology of inefficient wind-breaking and sand-fixing forests in Yulin Sandy Land[J]. Journal of Northwest Forestry University, 2010, 25(1): 104−106.
[26] 刘冠志, 李青丰, 贺威, 等. 毛乌素沙地3种主要植物群落的阻沙效益[J]. 水土保持通报, 2016, 36(2): 234−238. Liu G Z, Li Q F, He W, et al. Efficiency of sand resistance of three main plant communities in Mu Us Sandland[J]. Bulletin of Soil and Water Conservation, 2016, 36(2): 234−238.
[27] 许仲林, 彭焕华, 彭守璋. 物种分布模型的发展及评价方法[J]. 生态学报, 2015, 35(2): 557−567. Xu Z L, Peng H H, Peng S Z. The development and evaluation of species distribution models[J]. Acta Ecologica Sinica, 2015, 35(2): 557−567.
[28] 郑维艳, 曹坤芳. 未来气候变化对四种木姜子地理分布的影响[J]. 广西植物, 2020, 40(11): 1584−1594. doi: 10.11931/guihaia.gxzw201904020 Zheng W Y, Cao K F. Impact of future climate change on potential geographical distribution of four Litsea species in China[J]. Guihaia, 2020, 40(11): 1584−1594. doi: 10.11931/guihaia.gxzw201904020
[29] 李垚, 张兴旺, 方炎明. 气候变暖对中国栓皮栎地理分布格局影响的预测[J]. 应用生态学报, 2014, 25(12): 3381−3389. Li Y, Zhang X W, Fang Y M. Predicting the impact of global warming on the geographica distribution pattern of Quercus variablilis in China[J]. Chinese Journal of Applied Ecology, 2014, 25(12): 3381−3389.
[30] 马松梅, 魏博, 李晓辰, 等. 气候变化对梭梭植物适宜分布的影响[J]. 生态学杂志, 2017, 36(5): 1243−1250. Ma S M, Wei B, Li X C, et al. The impacts of climate change on the potential distribution of Haloxylon ammodendron[J]. Chinese Journal of Ecology, 2017, 36(5): 1243−1250.
[31] Verrelst J, Geerling G W, Sykora K V, et al. Mapping of aggregated floodplain plant communities using image fusion of CASI and LiDAR data[J]. International Journal of Applied Earth Observations & Geoinformation, 2009, 11(1): 83−94.
[32] 董光荣, 邹桂香, 李长治, 等. 巴盟河套西部防沙林带防风阻沙效益的初步观测: 以磴口县坝楞公社为例[J]. 中国沙漠, 1983(1): 13−23. Dong G R, Zou G X, Li C Z, et al. Preliminary observation on the efficiency of the wind preventing and sand resisting ofrest belt in the western part of the great of Huanghe River[J]. Journal of Desert Research, 1983(1): 13−23.
[33] 张锦春, 刘长仲, 姚拓,等, 等. 乌兰布和沙漠天然植物区系特征及地理成分分析[J]. 草原与草坪, 2013, 33(1): 29−30. Zhang J C, Liu C Z, Yao T, et al. Analysis of floristic characteristics and the geographical elements of natural plants in Ulanbuh Desert[J]. Grassland and Turf, 2013, 33(1): 29−30.
[34] Wu Z, Shen D, Huang L, et al. Study on the effect of the number of training samples on the accuracy of maximum likelihood supervision classification[J]. Forestry Exploration Design, 2018, 2: 115−117.
[35] Hijmans R J, Cameron S E, Parra J L, et al. Very high resolution interpolated climate surfaces for global land areas[J]. International Journal of Climatology, 2005, 25: 1965−1978.
[36] 刘元亮, 李艳, 吴剑亮, 基于LSWI和NDVI时间序列的水田信息提取研究[J]. 地理与地理信息科学, 2015, 31(3): 32−39. Liu Y L, Li Y, Wu J L. Study on extraction of paddy fields based on LSWI and time-series NDVI[J]. Geography and Geo-Information Science, 2015, 31(3): 32−39.
[37] 李宁, 岳德鹏, 于强, 等. 磴口县地下水埋深时空变化特征[J]. 南水北调与水利科技, 2017, 15(3): 7. Li N, Yue D P, Yu Q, et al. Temporal and spatial variation characteristics of groundwater depth in Dengkou County[J]. South to North Water Transfers and Water Science and Technology, 2017, 15(3): 7.
[38] 郑家享. 统计大辞典[M]. 北京: 中国统计出版社, 1995: 135−156. Zheng J X. A great dictionary of statistics[M]. Beijing: China Statistics Press, 1995: 135−156.
[39] Ranjitkar S, Xu J C , Shrestha K K. Ensemble forecast of climat suitability for the Trans-Himalayan Nyctaginaceae species[J]. Ecological Modeling, 2014, 282: 18−24.
[40] 刘兆飞, 王蕊, 姚治君. 蒙古高原气温与降水变化特征及CMIP5气候模式评估[J]. 资源科学, 2016, 38(5): 956−969. Liu Z F, Wang R, Yao Z J. Air temperature and precipitation over the Mongolian Plateau and assessment of CMIP5 climate models[J]. Resources Science, 2016, 38(5): 956−969.
[41] Oliver J E. Intergovernmental panel in climate change (IPCC)[J]. Encyclopedia of Energy Natural Resource & Environmental Economics, 2013, 26(2): 48−56.
[42] Booth T H, Nix H A, Busby J R, et al. Bioclim: the first species distribution modelling package, its early applications and relevance to most current MAXENT studies[J]. Diversity and Distributions, 2014, 20: 1−9. doi: 10.1111/ddi.12144
[43] Gower J C. A general coefficient of similarity and some of its properties[J]. Biometrics, 1971, 27: 57−71.
[44] Mahalanobis P C. On the generalised distance in statistics[J]. Proceedings of the National Institute of Sciences of India, 1936, 2: 49−55.
[45] 周志华, 机器学习[M]. 北京: 清华大学出版社, 2016: 121−139. Zhou Z H, Machine learning [M]. Beijing: Tsinghua University Press, 2016: 121−139.
[46] Lopatin J, Dolos K, Hernández H J, et al. Comparing generalized linear models and random forest to model vascular plant species richness using LiDAR data in a natural forest in central Chile[J]. Remote Sensing of Environment, 2016, 173: 200−210. doi: 10.1016/j.rse.2015.11.029
[47] 王运生, 谢丙炎, 万方浩, 等. ROC曲线分析在评价入侵物种分布模型中的应用[J]. 生物多样性, 2007, 15(4): 365−372. doi: 10.3321/j.issn:1005-0094.2007.04.005 Wang Y S, Xie B Y, Wan F H, et al. Application of ROC curve analysis in evaluating the performance of alien species’ potential distribution models[J]. Biodiversity Science, 2007, 15(4): 365−372. doi: 10.3321/j.issn:1005-0094.2007.04.005
[48] Parry M L, Palutikof J P, Linden P, et al. Contribution of working group Ⅱ to the fourth assessment report of the intergovernmental panel on climate change[J]. Encyclopedia of Language & Linguistics, 2007, 32(9): 171−175.
[49] Brown J L. SDMtoolbox: a python-based GIS toolkit for landscape genetic, biogeographic and species distribution model analyses[J]. Methods in Ecology and Evolution, 2014, 5(7): 694−700.
[50] 朱妮. 基于组合物种分布模型(Ensemble Model)的厚朴适宜生境分布模拟[J]. 四川农业大学学报, 2019, 37(4): 481−489. Zhu N. Modelling the suitable habitat distribution of Magnolia officinalis using Ensemble Model[J]. Journal of Sicuan Agriculture University, 2019, 37(4): 481−489.
[51] 罗玫, 王昊. 使用大熊猫数据评估Biomod2和Maxent分布预测模型的表现[J]. 应用生态学报, 2017, 28(12): 4001−4006. Luo M, Wang H. Evaluating the performance of species distribution models Biomod2 and MaxEnt using the giant panda distribution data[J]. Chinese Journal of Applied Ecology, 2017, 28(12): 4001−4006.
[52] Buisson L, Thuiller W, Casajus N, et al. Uncertainty in ensemble forecasting of species distribution[J]. Global Change Biology, 2010, 16(4): 1145−1157. doi: 10.1111/j.1365-2486.2009.02000.x
[53] Nicholas W, Synes P, Osborne E. Choice of predictor variables as a source of uncertainty in continental-scale species distribution modelling under climate change[J]. Global Ecology and Biogeography, 2011, 20(6): 904−914. doi: 10.1111/j.1466-8238.2010.00635.x
[54] 马松梅, 魏博, 李晓辰, 等. 气候变化对梭梭植物适宜分布的影响[J]. 生态学杂志, 2017, 27(5): 1243−1250. Ma S M, Wei B, Li X C, et al. The impacts of climate change on the potential distribution of Haloxylon ammodendron[J]. Chinese Journal of Ecology, 2017, 27(5): 1243−1250.
[55] Elith B. Error and uncertainty in habitat models[J]. Journal of Applied Ecology, 2006, 43(3): 413−423.
[56] 王孝安. 安西荒漠植物群落和优势种的分布与环境的关系[J]. 植物学报, 1998, 40(11): 70−75. Wang X A. Environment relations with desert plant communities and distribution of domains in Anxi[J]. Acta Botanica Sinica, 1998, 40(11): 70−75.
[57] 刘亚传. 民勤绿洲生态环境演变的初步研究[J]. 生态学杂志, 1984(3): 1−4. doi: 10.13292/j.1000-4890.1984.0021 Liu Y C. A preliminary study on the cological evolution in miqin oasis[J]. Chinese Journal of Ecology, 1984(3): 1−4. doi: 10.13292/j.1000-4890.1984.0021
[58] 姚德良, 李家春, 杜岳, 等. 沙坡头人工植被区陆气耦合模式及生物结皮与植被演变的机理研究[J]. 生态学报, 2002, 22(4): 452−460. doi: 10.3321/j.issn:1000-0933.2002.04.002 Yao D L, Li J C, Du Y, et al. A land atmosphere coupling model and mechanism of the crust layer and the evolution of canopy in artificial vegetation area of Shapotou[J]. Acta Ecologica Sinica, 2002, 22(4): 452−460. doi: 10.3321/j.issn:1000-0933.2002.04.002
-
期刊类型引用(2)
1. 宋晴,付鸿莉,王铁梅,宿逸然,梁留喜,通拉嘎,胥健,董昊野,邰塔拉. 兴安盟草原灌丛植被潜在适生区分布模拟分析. 草地学报. 2024(02): 579-587 .  百度学术
百度学术
2. 楼科尔,曲文杰,王磊,王兴,郜永贵,张波,尤万学,杨新国. 腾格里沙漠地区4种优势一年生草本植物根构型特征. 应用生态学报. 2024(11): 3015-3022 . 百度学术
其他类型引用(1)


计量
- 文章访问数: 575
- HTML全文浏览量: 178
- PDF下载量: 96
- 被引次数: 3
