
Leaf stoichiometry of two conifer species with different life forms in northern Daxing’an Mountains of northeastern China
-
摘要:目的
研究寒温带落叶树种和常绿树种针叶生态化学计量特征的差异及随龄级增加的变化规律,揭示不同生活型针叶树种生态化学计量特征与生长阶段之间的关系,为寒温带植物生长与养分供给的研究提供依据。
方法以大兴安岭北部兴安落叶松和樟子松为对象,研究5—9月针叶C、N、P含量及化学计量特征,利用内稳性指数和Pearson相关系数分析C、N、P之间及与环境因子的相关性。
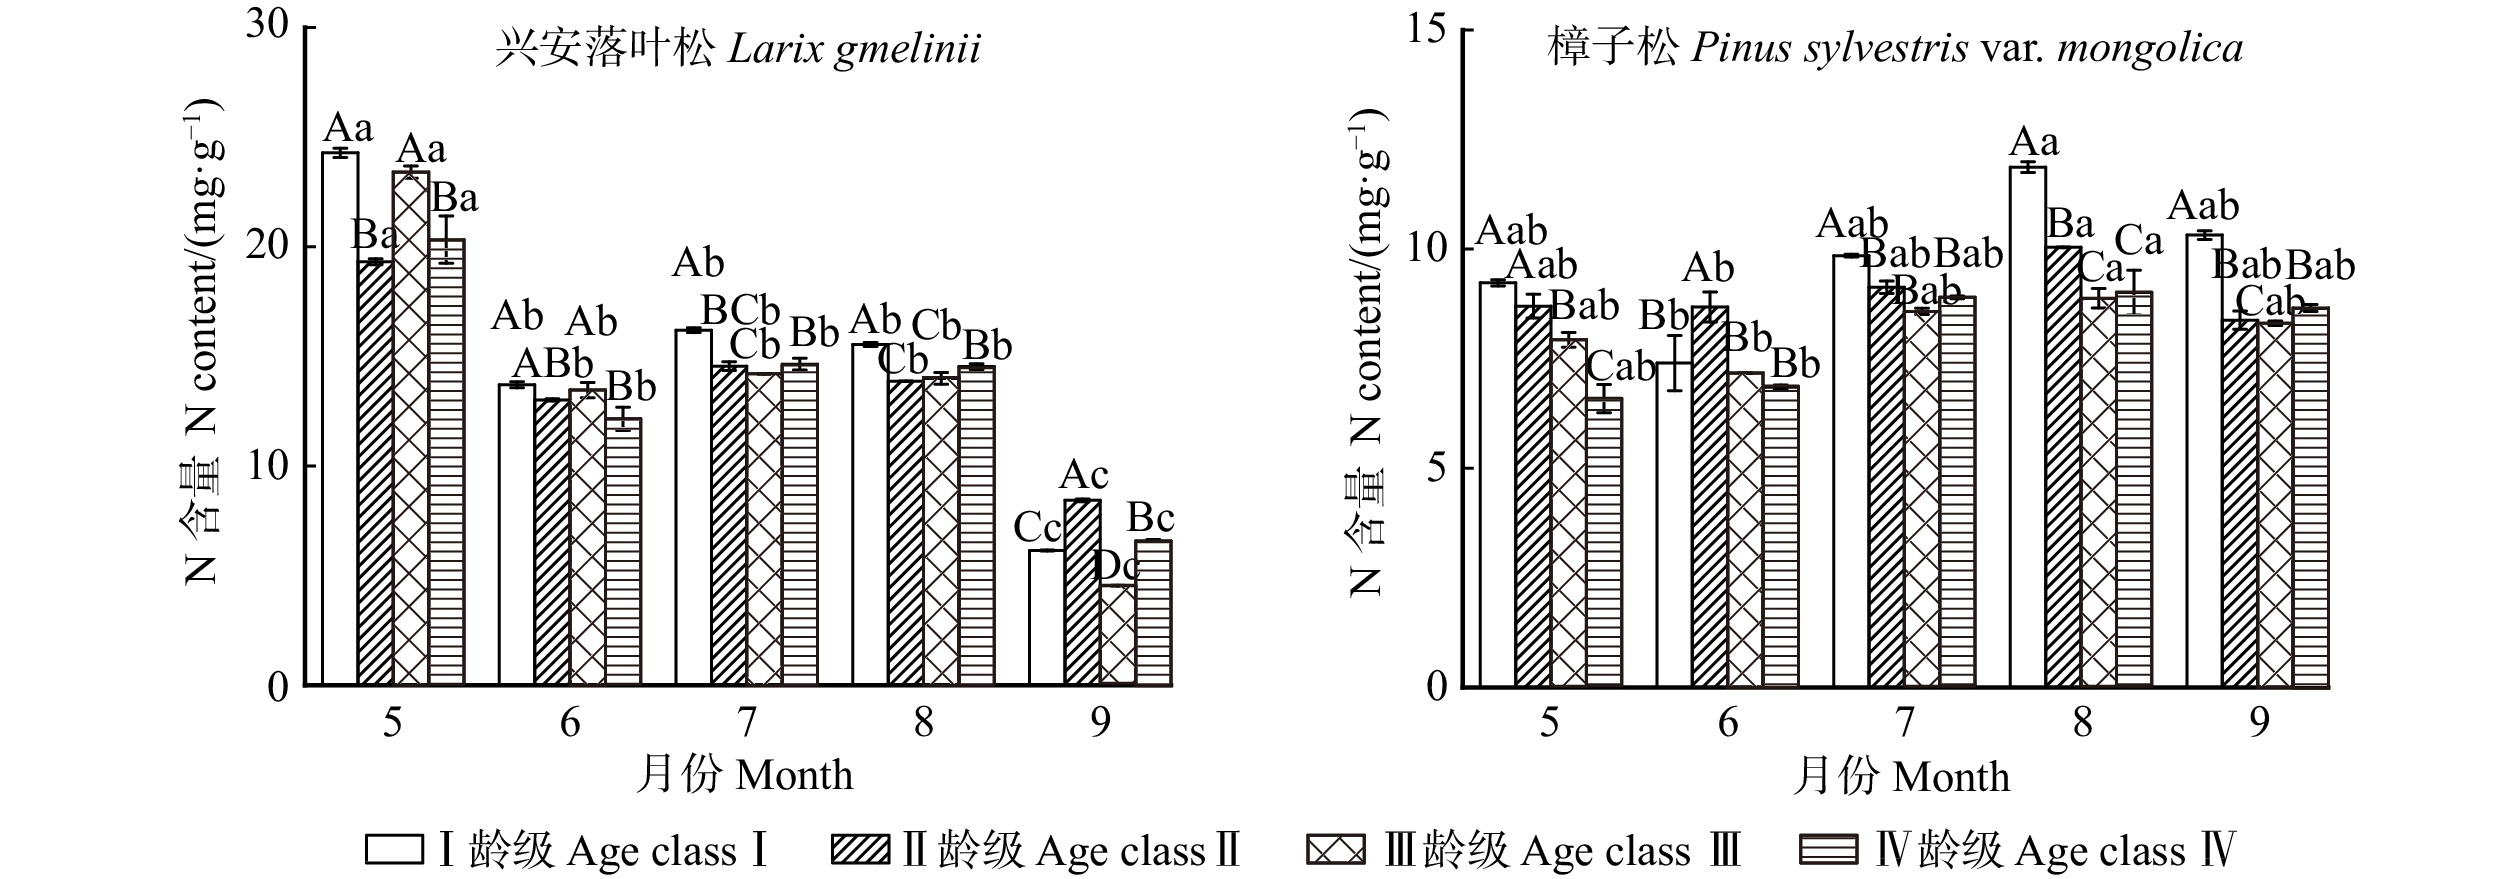
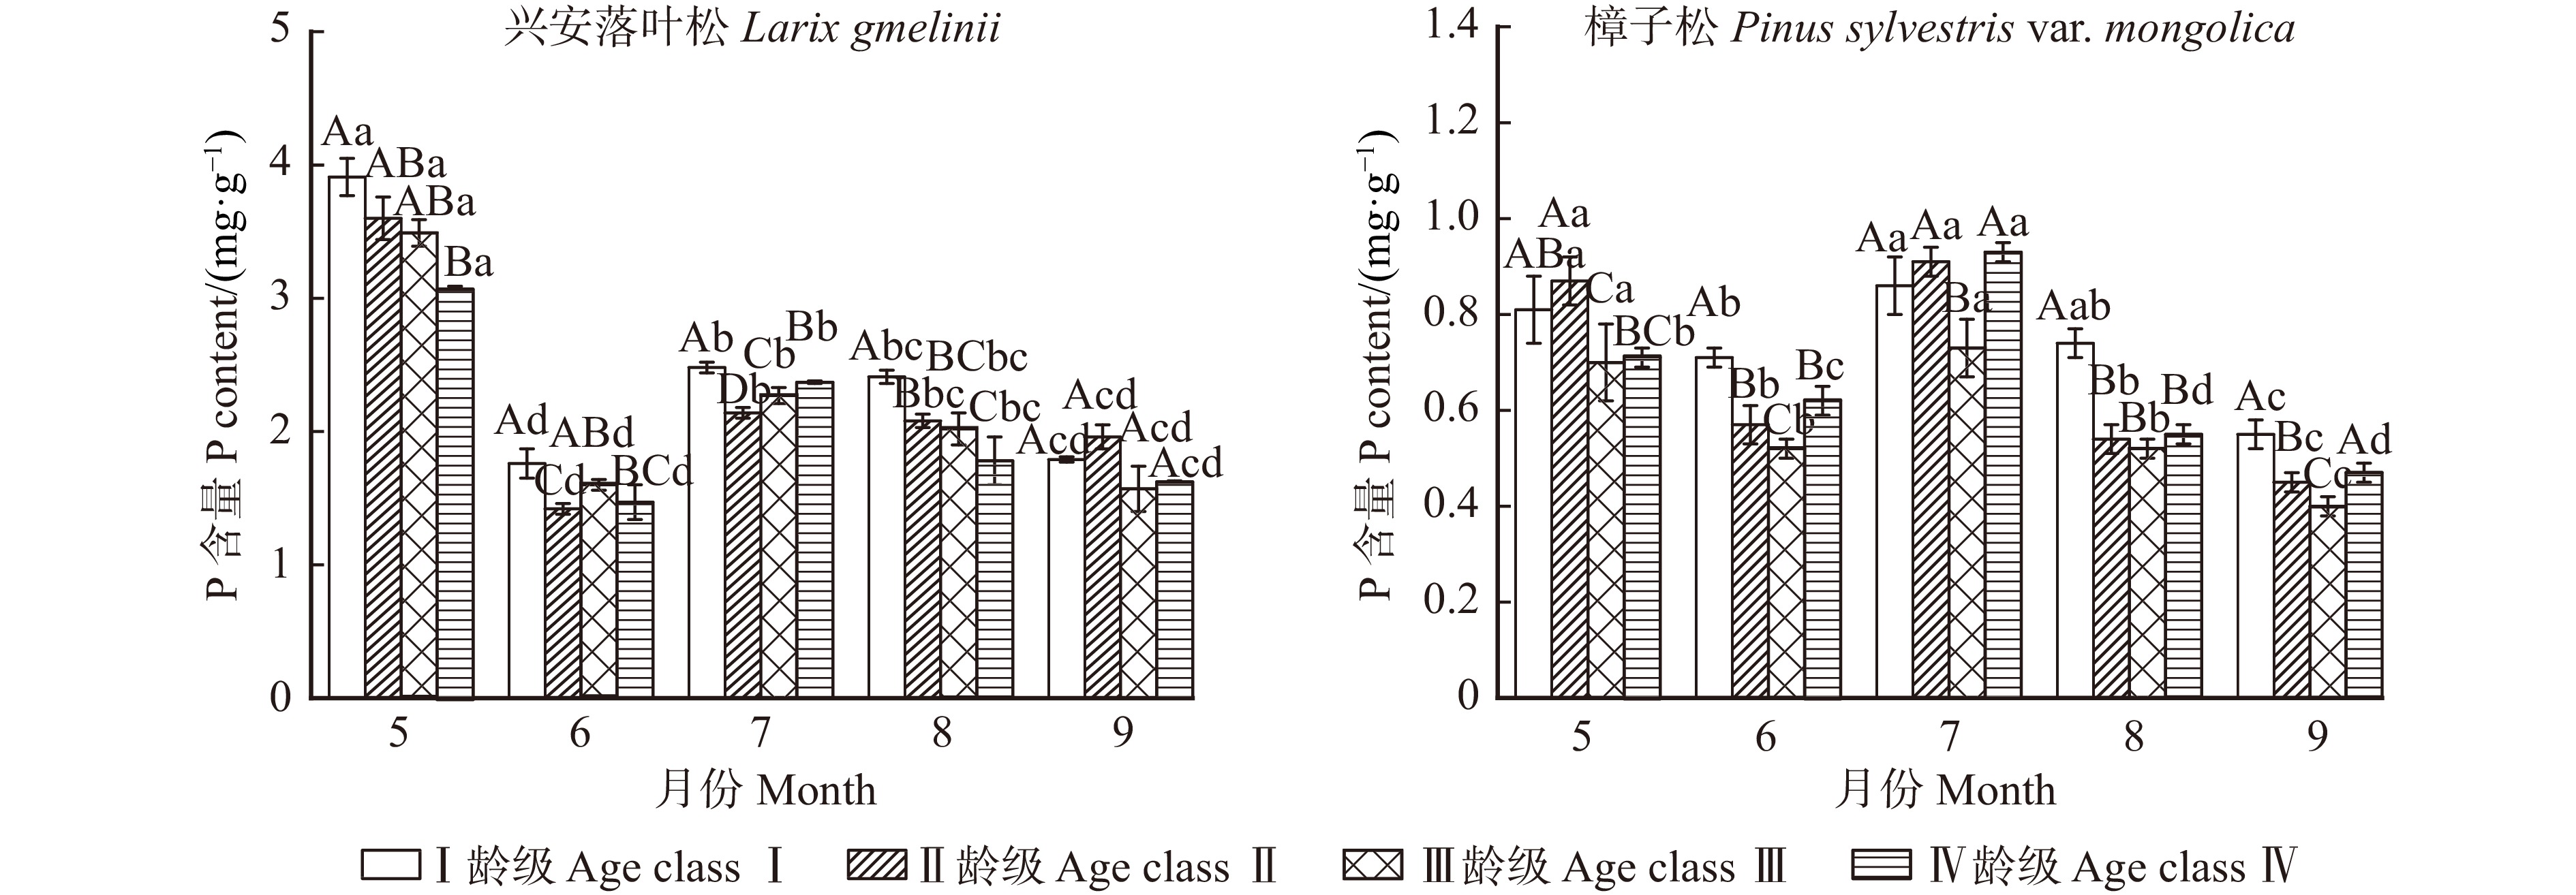
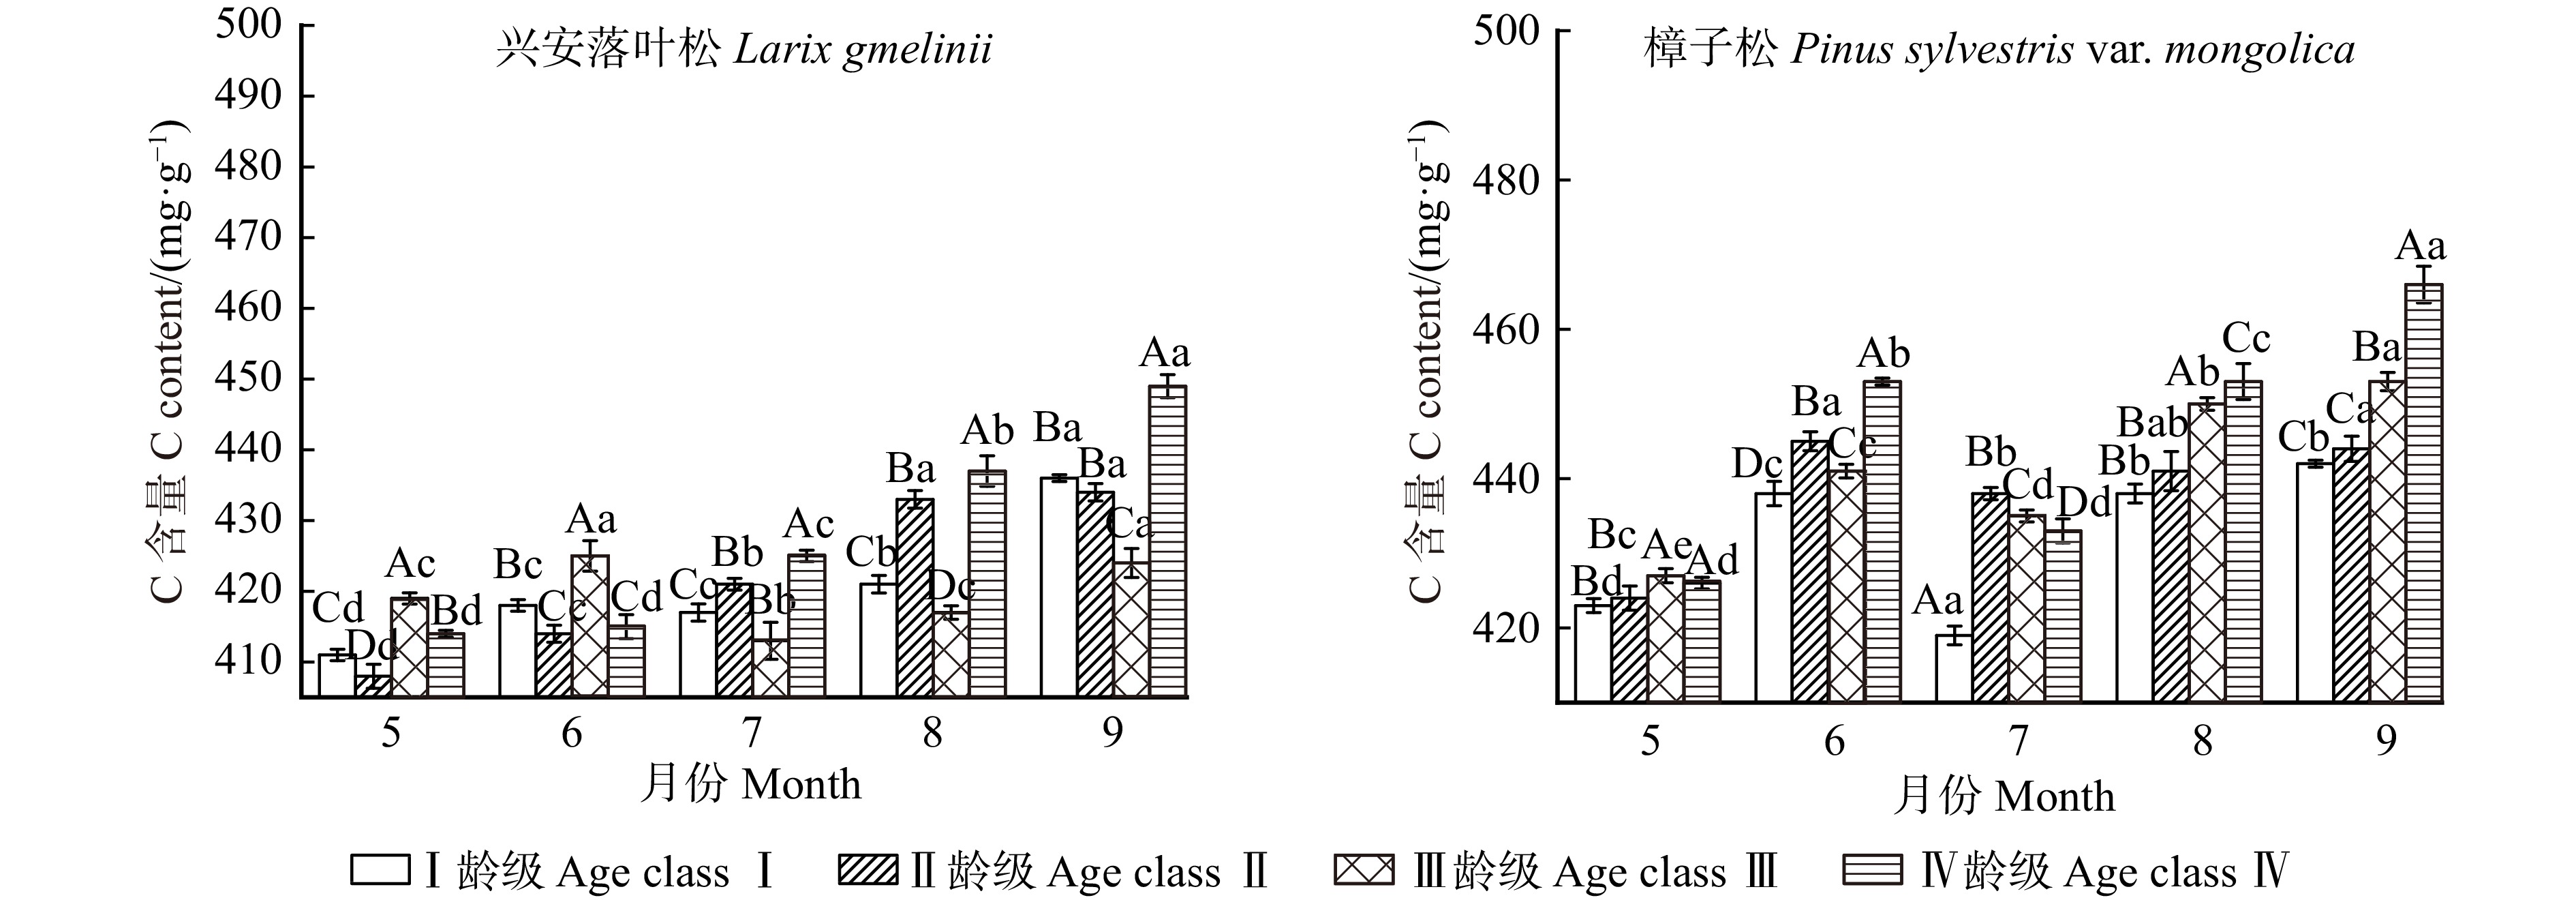
结果(1)不同生长阶段兴安落叶松和樟子松针叶N、P月平均含量表现为随龄级的增长而降低,C含量则是随龄级的增加而增加,且5—8月兴安落叶松针叶N、P含量高于樟子松,C含量则低于樟子松。(2)兴安落叶松针叶C∶N、C∶P和N∶P月平均值均高于樟子松,4个龄级兴安落叶松针叶N∶P均小于14,而樟子松在5—7月N∶P小于14,8—9月N∶P大于16。兴安落叶松针叶N、P以及N∶P稳定性大于樟子松。(3)土壤含水率与2树种针叶生态化学计量特征呈极显著相关,樟子松针叶N含量与C、N、P化学计量比呈显著相关,兴安落叶松针叶C含量与N∶P、土壤铵态氮和硝态氮显著相关。
结论大兴安岭北部不同生活型的2种针叶树种,叶片生态化学计量对寒冷气候和冻土生境的适应策略不同,兴安落叶松是本区的顶级群落优势种,但其生长受到N的限制,而樟子松生长的限制因子因季节变化而不同。
Abstract:ObjectiveThis paper studies the difference in ecological stoichiometric characteristics and their changes with increasing age of conifers of deciduous and evergreen species in the cold temperate zone to reveal the relationship between ecological stoichiometric characteristics and growth stage of two different life forms of conifers, and to provide help for the study of plant growth and nutrient supply in cold-temperate of China.
MethodThe contents and stoichiometric characteristics of C, N, P in Larix gmelinii and Pinus sylvestris var. mongolica from May to September were studied. The correlations between C, N, P and environmental factors were analyzed by homeostasis index and Pearson correlation coefficient.
Result(1) During different growth stage, monthly average N, P contents of L. gmelinii and P. sylvestris var. mongolica needles were both decreased with the increase of age class, while the C content increased with the increase of age class. The N and P contents of needles of L. gmelinii from May to August were higher than those of P. sylvestris var. mongolica, while the C content was lower than that of P. sylvestris var. mongolica. (2) The monthly mean values of C∶N, C∶P and N∶P of needles of L. gmelinii were higher than those of P. sylvestris var. mongolica. The N∶P of needles of L. gmelinii of four age classs were all less than 14, while the N∶P of needles of P. sylvestris of four age classes from May to July was less than 14, and the N∶P of needles of P. sylvestris var. mongolica of four age classes was more than 16. The homeostasis of N, P and N∶P of L. gmelinii needles was greater than that of P. sylvestris var. mongolica. (3) Soil moisture content was significantly correlated with the ecological stoichiometric characteristics of the needles of the two species. The N content of needles of P. sylvestris var. mongolica was significantly correlated with the stoichiometric ratio of C, N and P, and the C content of needles of L. gmelinii was significantly correlated with N∶P and soil ammonium and nitrate nitrogen.
ConclusionThe two coniferous tree species with different life forms in the northern Daxing’an Mountains have different adaptation strategies to cold climate and frozen soil. L. gmelinii is the dominant species in the top community, but its different growth stages are both limited by N. However, the growth limiting factors of P. sylvestris var. mongolica are different due to seasonal changes.
-
Keywords:
- cold temperate zone /
- nutrient content /
- stoichiometry /
- coniferous tree species /
- age class
-
目前全球森林面积为40.6亿hm2, 约占陆地总面积的31%[1]。近30年来, 许多学者基于地面调查、通量监测、大气监测与反演、模型模拟等手段对森林生态系统碳源汇开展了系统研究,尽管不同研究得出的碳汇大小存在差异, 但这些研究大都表明森林生态系统是显著碳汇[2-6]。例如,使用样方清查数据评估中国陆地生态系统碳储量及其变化发现:2001—2010年间年均碳汇为0.201 Pg/a(以C计),其中森林贡献了约80%的碳汇[7-8],是实现“碳中和”国家战略目标的关键。
温带森林占全球森林面积约26% [9],实际贡献全球森林碳汇的65%[6]。东亚温带森林是全球三大温带森林之一,是目前保存最完整的温带森林,主要分布在我国的东北地区,是我国“两屏三带”/“三区四带”中唯一森林带,林地面积占全国31.4%,蓄积量占32.7%。东北东部森林是东北地区、乃至东北亚地区最为典型的温带植被类型,也是我国东北部地区山地森林生态系统的主体[10],代表性温带针阔叶混交林和阔叶林所具有的碳汇能力决定了我国东北林区碳汇大小,进而影响到全国森林碳汇量。
森林中储存的大量碳主要集中在土壤碳库和生物量碳库,分别占全球森林碳库的44%和42%[6]。尽管土壤自身具有巨大的碳储量和空间变异性,由于自然状态下土壤有机碳的形成与积累是一个相对十分缓慢的过程,使得短期内难以监测到土壤碳储量的微小变化[11]。相反,森林面积和树木通过净初级生产力实现蓄积量(树木生物量)增长是实现固碳增汇的重要驱动力[12-14]。相较于小树而言,天然林中大径级个体存储着更高地上生物量碳,通过分析全球48个森林固定样地、560万株个体长期监测数据表明,大树数量仅占总数的1%,其地上生物量约占地上总生物量的一半左右[15],并且这些大树对地上生物量增加的影响大于物种多样性和群落性状特征[16-17]。能够形成群落中大径级个体的树种通常是群落中的优势种,它们一般具有胸径大、树干高、树根深、树冠宽的特征,在森林群落的竞争中占据绝对优势[18]。因此,准确确定和评估天然林中优势树种碳库现状及其固碳速率,有助于推进森林科学经营,优化树种配置,实现因地制宜、适地适树的管理目标,为森林碳汇能力维持与提升提供科学依据[19]。
本研究基于吉林长白山25 hm2阔叶红松(Pinus koraiensis)林固定样地连续15年(2004—2019年)3期监测数据,揭示优势树种对地上生物量碳库储量的贡献,分析优势种群数量和径级大小的动态变化,对比优势种群固碳速率及种间生长同步性大小,旨在碳中和背景下为本区域树种选择和造林模式提供一定的数据支持和理论参考。
1. 研究区概况与研究方法
1.1 研究区概况与样地设置
长白山自然保护区位于吉林省东南部的中朝交界处,地处41°43′ ~ 42°36′N,126°55′ ~ 128°17′E。由于特殊的自然条件、历史及社会原因,长白山成为我国乃至全球自然生态系统保存最为完整的地区之一[20]。长白山自然保护区总面积19 665 hm2,始建于1960年,于1979年被联合国教科文组织纳入“国际人与生物圈计划”保护网。本地区气候类型属于温带大陆性季风气候,由于山体较高,所以气候随海拔变化较大。山脚表现出典型的暖温带气候,而山顶呈复杂、多变的近极地气候[21]。山下(海拔740 m,下同)平均年降水为600 ~ 900 mm,多集中在夏季,6—9月份降水量占全年降水量的80%之多。气温也呈现明显的垂直变化:山下年均温约2.8 ℃,而山顶年均温只有−7.3 ℃左右[22]。
巨大的海拔差异,导致水热条件的显著不同,从而形成了长白山从下到上的明显环境梯度,也造就了长白山类型多样的自然植被,构成了独特的自然景观格局[10]。长白山复杂的生物区系,不仅拥有完整的森林生态系统和明显的植被垂直带谱,而且是欧亚大陆从中温带到寒带主要植被类型的缩影。其中,长白山北坡阔叶红松林作为地带性顶级森林生态系统,主要分布于海拔600 ~ 1 000 m的玄武岩台地上,是世界上为数不多的大面积原始针阔混交林,与同纬度其他地区森林相比,以其建群种独特、物种多样性丰富而著称[23]。
2004年,参照巴拿马Barro Colorado Island(BCI)50 hm2样地技术规范[24],在长白山阔叶红松林内建立了中国第一个大型固定监测样地,面积为 25 hm2(500 m × 500 m),平均海拔801.5 m,最高海拔809.5 m,最低海拔791.8 m,最大高差17.7 m。样方内所有胸径(DBH) ≥ 1 cm的木本植物的种名、胸径和坐标被准确测量并挂牌。根据2004年首次调查数据,样地中木本植物共52种,其中乔木28种、灌木22种、藤本2种,隶属于18科32属,涵盖了阔叶红松林中的大部分物种[25]。样地垂直结构层次明显,是典型的复层异龄林:平均树高约为26 m,树高20 m以上为主林层,主要树种有红松、紫椴(Tilia amurensis)、蒙古栎(Quercus mongolica)和水曲柳(Fraxinus mandshurica)等;次林层高约10 ~ 20 m,主要树种有色木槭(Acer mono)、青楷槭(Acer tegmentosum)、假色槭(Acer pseudo-siebodianum)和怀槐(Maackia amurensis)等。
每隔5年对样地中所有DBH ≥ 1 cm的木本植物进行复查,记录其胸径和生长状态(倾斜、倒伏、枯立等),同时标记新死亡树木,新进入起测胸径(1 cm)的树木也要测量其胸径、坐标、鉴定物种并挂牌。迄今为止,分别于2009年、2014年和2019年进行了3次复查[17, 26]。
1.2 地上生物量估算及其动态
通常认为在同一气候区域内建立的异速生长方程可以通用[27],所以本研究中地上生物量估算所使用的异速生长方程主要来自已经发表的文献[28-29],对于部分未检索到树种,本研究使用所有的阔叶树种标准木数据拟合了一个综合模型[30]。
在此基础上,分别计算种群数量、平均胸径及地上生物量的年均增长速率。以计算地上生物量年均增长速率为例,首先基于物种的异速生长方程估算每次调查时存活个体(包括分支)的地上生物量(AGB),进而加和求得每个20 m × 20 m 样方内该种群所有个体的地上生物量(Mg/hm2)。最后,再根据公式(1)确定不同种群在不同调查区间内的地上生物量年均变化速率(%),作为种群固碳能力的指标。
ΔAGBi,t=AGBi,t+T−AGBi,tAGBi,t×T (1) 式中:
ΔAGBi,t 表示第i 种树在特定调查周期T内(例如5年)的地上生物量年均净变化速率,AGBi,t 表示第i 种树在t 年的地上生物量大小,AGBi,t+T 表示第i 种树在t + T年地上生物量的大小。使用Pearson相关性分析研究主要优势树种固碳速率在3次调查周期(2004—2009年、2009—2014年、2014—2019年)内的相关性大小。当优势树种种群生产力在时间上的波动完全同步时,即相关系数较大,意味着种群动态呈完全正相关。当种群波动不完全一致时,即种群间生产力呈负相关时,称之为种群动态出现不同步性(asynchrony)或异步性[31]。
以上所有计算和分析均在R软件(3.6.2)中完成。
2. 结果与分析
长白山25 hm2阔叶红松林样地在2004、2009、2014和2019年的地上生物量分别为(267.3 ± 94.1) Mg/hm2、(275.0 ± 96.2) Mg/hm2、(278.7 ± 98.9) Mg/hm2和(282.5 ± 102.8) Mg/hm2(图1)。地上生物量在15年连续监测期内年均净增加1.0 Mg/hm2,其中2004—2009年、2009—2014年和2014—2019年3个监测周期内增加速率分别为1.54、 0.73和0.76 Mg/(hm2·a)。
![]() 图 1 长白山25 hm2样地地上生物量及其时间动态Figure 1. Aboveground biomass and its temporal dynamics of 25 ha sample plot in Changbai Mountain
图 1 长白山25 hm2样地地上生物量及其时间动态Figure 1. Aboveground biomass and its temporal dynamics of 25 ha sample plot in Changbai Mountain2019样地内调查到的52个胸径 ≥ 1 cm的树种,其中7个最重要树种的地上生物量约占整个样地总地上生物量的96.2%(图2A),紫椴(89.6 Mg/hm2)、水曲柳(60.7 Mg/hm2)和蒙古栎(57.2 Mg/hm2)(图2B)3个树种贡献了总地上生物量的73.6%。
![]() 图 2 2019年长白山样地内不同树种地上生物量的累计百分比(A)及主要优势树种地上生物量储量(B)Figure 2. Cumulative percentage of aboveground biomass of different tree species (A), and the aboveground biomass stock of dominate species (B) in 2019
图 2 2019年长白山样地内不同树种地上生物量的累计百分比(A)及主要优势树种地上生物量储量(B)Figure 2. Cumulative percentage of aboveground biomass of different tree species (A), and the aboveground biomass stock of dominate species (B) in 2019大青杨(Populus ussuriensis)在7个主要固碳树种中个体数最少,在2004年监测到36株;但该种群个体平均胸径最大,为100.8 cm(表1)。相较而言,色木槭种群的个体数最多,为6 767株;其平均胸径却最小,为7.32 cm。在2004—2019年间,紫椴、水曲柳、蒙古栎、红松、大青杨和春榆(Ulmus japonica)6个种群的个体数均表现出明显下降趋势,其中紫椴种群年均减少幅度最大,为1.58%。仅有色木槭种群个体数表现出增加趋势,年增长速率为0.1%。从种群平均胸径变化来看,15年间个体数呈下降趋势的6个种群中,它们的平均胸径均表现出明显的增长趋势,其中紫椴种群的年均增幅最大,为1.7%。水曲柳是地上生物量积累速率最快的树种,年均固碳速率为0.77%,其次是紫椴和春榆。大青杨和色木槭则表现出负的增长速率,分别为−0.97%和−0.46%。
表 1 25 hm2样地内主要优势树种种群数量、平均胸径及地上生物量年均动态变化Table 1. Annual average dynamic change of population number, average DBH and aboveground biomass of main dominant tree species in 25 ha sample plot树种
Tree species初始
个体数
Initial
individual number种群数量年变化
Annual change of population quantity/%初始平均
胸径
Initial
average DBH/cm
种群平均胸径年变化率
Annual change rate of population average DBH/%初始
地上生物量/
(Mg·hm−2)
Initial
aboveground
biomass/
(Mg·ha−1)地上生物量年均变化
Annual average change of aboveground biomass/%2004—
20092009—
20142014—
20192004—
20192004—
20092009—
20142014—
20192004—
20192004—
20092009—
20142014—
20192004—
2019紫椴
Tilia
amurensis3 288 −0.95 −2.08 −2.12 −1.58 28.00 1.1 1.9 1.7 1.7 82.28 0.75 0.49 0.50 0.60 水曲柳
Fraxinus
mandshurica702 −0.68 −0.53 −0.85 −0.66 47.43 0.8 0.4 1.0 0.8 54.42 0.81 0.49 0.93 0.77 蒙古栎
Quercus
mongolica937 −0.38 −0.57 −1.19 −0.69 41.62 0.4 0.5 0.8 0.6 54.27 0.49 0.35 0.28 0.38 红松
Pinus
koraiensis2 486 −0.69 −0.9 −1.44 −0.96 32.40 0.6 0.6 0.6 0.6 36.40 0.48 0.23 −0.48 0.09 色木槭
Acer mono6 767 0.09 0.89 −0.65 0.10 7.32 0.4 −1.0 0.1 −0.2 15.33 0.04 −0.66 −0.78 −0.46 大青杨
Populus
ussuriensis36 −1.11 −1.18 −3.13 −1.67 100.80 0.1 −0.2 1.6 0.5 7.63 −0.91 −0.81 −1.35 −0.97 春榆
Ulmus
japonica1 152 −0.38 0.71 −1.56 −0.39 13.95 0.8 −0.7 1.5 0.5 5.90 0.45 0.24 0.91 0.54 通过比较3次监测时期的种群个体动态,发现除色木槭外,其余6个树种的个体数都在2014—2019年间表现出较大的波动(表1),多数树种在2004—2009年间的变动最小。紫椴和色木槭种群的平均胸径变化较大的时期发生在2009—2014年间,而红松种群平均胸径的年增长速率在3次监测期基本保持不变。
不同种群在3个监测期内表现出不一致的固碳速率,紫椴和色木槭表现出前期下降后期持平的格局,蒙古栎和红松是持续下降趋势,水曲柳和春榆则呈现先下降后升高的格局(图3A)。从种群间相关关系图上也可以看出紫椴与色木槭,蒙古栎和红松,水曲柳和春榆之间表现出较高的正相关关系(图3B)。大青杨是唯一一个在3个监测期固碳速率均为负值的树种,其种群波动情况与春榆呈完全相反的关系(图3)。
![]() 图 3 不同调查周期内主要优势树种地上生物量年均净变化速率(A)、及其树种间生长速率在时间上的相关性(B)Figure 3. Annual average net change rate of aboveground biomass of main dominant tree species in different survey cycles (A), and the temporal correlation of their growth rates among tree species (B)
图 3 不同调查周期内主要优势树种地上生物量年均净变化速率(A)、及其树种间生长速率在时间上的相关性(B)Figure 3. Annual average net change rate of aboveground biomass of main dominant tree species in different survey cycles (A), and the temporal correlation of their growth rates among tree species (B)3. 结论与讨论
以大型森林固定监测样地为平台,利用翔实的群落组成和空间信息来估算树木地上生物量,通过连续监测获得一定时期树木个体的生长、死亡特征[32],可以准确反映群落生产力的大小、变化趋势及揭示其内在机制,也便于与全球其他类型森林进行比较[15, 33-34]。长白山阔叶红松林25 hm2样地中不足总树种14%的种群贡献了96.2%的地上生物量,古田山24 hm2样地内调查到的159个树种中,17个树种的地上生物量约占整个样地总地上生物量的90%[35],广东黑石顶50 hm2样地中217个树种的前10个种群贡献了72.13%的总地上生物量[36]。这些结果均支持生态系统中资源一般集中于群落中的少数种群的观点[15, 17]。因此,在巩固提升森林生态系统碳汇能力的背景下,必须优先保护这些主要优势种群,在使用样地清查法进行群落地上碳库和生产力估算时,在时间和精力有限的情况下,可以首先筛选出目标群落中的主要固碳树种,重点监测它们的数量、分布及动态,基本能够实现对整个群落地植被碳库动态的精准监测和预测[37]。
基于连续15年的监测数据发现阔叶红松林地上生物量年均净固碳速率约为0.50 Mg/hm2(按植物生物量含碳量为0.5),高于全球老龄林(0.34 Mg/hm2[32])和亚马逊热带雨林 (0.31 Mg/hm2[38]) 。尽管随着森林演替会增加林内的郁闭度,这将加剧林下层小径级个体对光的竞争,导致群落中总个体数持续减少,这种自然稀疏现象可能使林地资源得到充分利用,促进大径级个体的持续生长,进而提升生态系统整体碳库储量[39-40] 。多期监测数据表明长白山阔叶红松林地上生物量没有方向性的变化规律,这与全球其他地区大样地研究结果一致。例如在热带雨林地区,Chave等[41]通过分析巴拿马热带雨林50 hm2长期监测样地3次调查数据,发现该区森林在1985—1990年和1995—2000年内分别增长(0.82 ± 0.84) Mg/hm2和(0.40 ± 0.70) Mg/hm2,但在1990—1995年期间却降低了(0.69 ± 0.82) Mg/hm2,降低的主要原因是树木生长速度下降。同样地,本研究结果表明红松种群在2004—2009年和2009—2014年间地上生物量持续增加趋势,而在2014—2019则出现了降低的现象。虽然春榆表现出方向性的固碳趋势,但是不同监测周期内的固碳速率相差近3倍。因此,基于单期监测数据来评估种群固碳速率可能会存在很大的不确定性。
树种是森林的基本单元,选择合适的树种造林及建立良好的森林树种结构是提高森林资源数量、质量与功能的重要途径。本研究发现紫椴、蒙古栎和红松等多个地上生物量呈明显增长趋势的树种均属于典型的外生菌根依赖型树种。已有大量研究表明,外生菌根真菌可以通过多种方式影响树木生长,提高林木抗逆性,增加造林成活率和林木生产力,对于维持森林生态系统稳定性具有重要意义[42-43]。首先,外生菌根真菌可以改变根系形态,增加根系吸收面积,并以此提高树木对氮、磷、钾等营养元素的吸收效率,进而促进宿主植物健康生长。例如,森林生态系统中通常80%以上的氮是以有机态形式存在,而由微生物矿化作用转化成无机氮(主要为铵态氮和硝态氮)才是植物和微生物吸收的主要形式[44]。外生菌根真菌可以通过分泌多种降解酶使土壤有机质中的氮降解传递给宿主植物,也可以少量利用小分子无机氮[45]。其次,外生菌根真菌可以提高树木光合作用速率和强度,进而提高宿主植物的竞争能力和存活率[46]。此外,树木在非生物胁迫下会产生对自身健康状况有害的活性氧,外生菌根真菌可以调节活性氧、清除酶含量,进而减轻植物体氧化损害,提高林木对非生物胁迫的抵抗和适应能力。最后,外生菌根真菌与树木共生可以产生赤霉素、细胞分裂素等生长激素,有利于调控树木生长发育与分化。因此,相较于其他树种,具有外生菌根类型的树种大多能在干旱、寒冷、高温、高盐和含有高浓度有毒物质的不良环境中生存,并成为冠层优势树种[42, 45]。
本研究发现作为我国“东北三大硬阔” —水曲柳、胡桃楸(Juglus mandshurica)和黄檗(Phellodendron amurense) —之一的水曲柳具有最快的固碳速率,它们拥有的复叶特征长期以来被认为与较高的生产力有关[47-49]。例如,水曲柳较大的复叶叶片和环孔材结构二者相组合,使这些树种得以实现比其他共存树种呈现更高效的水分传输效率,从而支撑高的气孔导度和光合碳同化速率,实现高的生产力[49]。最新研究结果进一步发现复叶的水力系统在面临极端干旱时还能够发挥“保险丝”作用[50]。这是因为与叶片和叶柄相比,复叶树种的茎干能够在日间蒸腾强烈发生时仍保持较高的水势,茎中气穴化栓塞发生的风险显著低于叶片和叶柄,该机制的存在可以保证在严重干旱环境中栓塞现象优先发生在更末端的器官,通过“熔断”机制以脱落叶片为代价保护碳成本更高的茎干器官。同时,由于复叶树种每年会脱落整个复叶叶柄,额外丢失较多的碳水化合物,使得具有较低导水效率和较低潜在光合碳同化能力的树种难以收回复叶脱落带来的额外碳投入成本,因而绝大多数具有复叶和散孔材的树种在进化上会逐渐被淘汰,而保留下来的环孔材复叶树种通常具有较高的生产力[50]。但是具有环孔材树种对于冻融造成的枝条木质部气穴化栓塞非常敏感,这也使得多数温带复叶树种潜在生产力需要在条件比较优越的环境中才能得以发挥[37]。但是具有环孔材树种对于冻融造成的枝条木质部气穴化栓塞非常敏感,这也使得多数温带复叶树种潜在生产力需要在条件比较优越的环境中才能得以发挥[37]。
固碳速率的异步性一定程度上反映了同一区域内共存树种生长对气候变化响应和适应策略的差异性[31, 51-52],例如,长白山区红松径向生长主要受降水量控制,水曲柳和春榆受温度影响强于降水,蒙古栎和黄檗对气候变化响应不是十分敏感,表现出受温度和降水量的综合影响[53-55]。不同树种在生长季的生长速率及主导其气候因子也存在显著差异,基于生长环逐月监测数据表明,长白山25 hm2样地内红松、蒙古栎和紫椴生长速率也存在明显季节差异[56],三者在6、7和8月份的生长速率排序依次为:蒙古栎 > 红松 > 紫椴、蒙古栎 ≈ 紫椴 > 红松和蒙古栎 > 红松 > 紫椴,秋季平均气温被认为影响长白山水曲柳生长的关键因子,而当年6月最高温度是红松径向生长的关键限制因子[54]。通常认为,树种内在生理、生态习性特征对多变扰动响应的分异,以及树种对外部环境变化反应速度的不同将会导致植物在生长发育过程中对资源(如温度、养分)需求的差异[57-58],形成生态位分化,从而缓解对同一时间点或同一地点的资源竞争,提高资源利用效率,促进树种稳定共存[59-61]。
综上所述,少数优势树种是影响温带针阔混交林地上碳储量及动态的主要因素,并且优势树种之间在固碳速率上存在着一定的时间异步性。因此,未来研究应该针对性地关注这些“关键少数”的生理、生态习性特征及其随地形、土壤养分、干扰和经营措施等因子的分异规律,结合近年来飞速发展的近地面遥感技术,精准量化植被固碳速率和能量转化效率,提升林业碳汇能力,使森林在实现“碳中和”目标过程中更好地发挥“压舱石”“稳定器”的重大作用[62]。
-
![]()
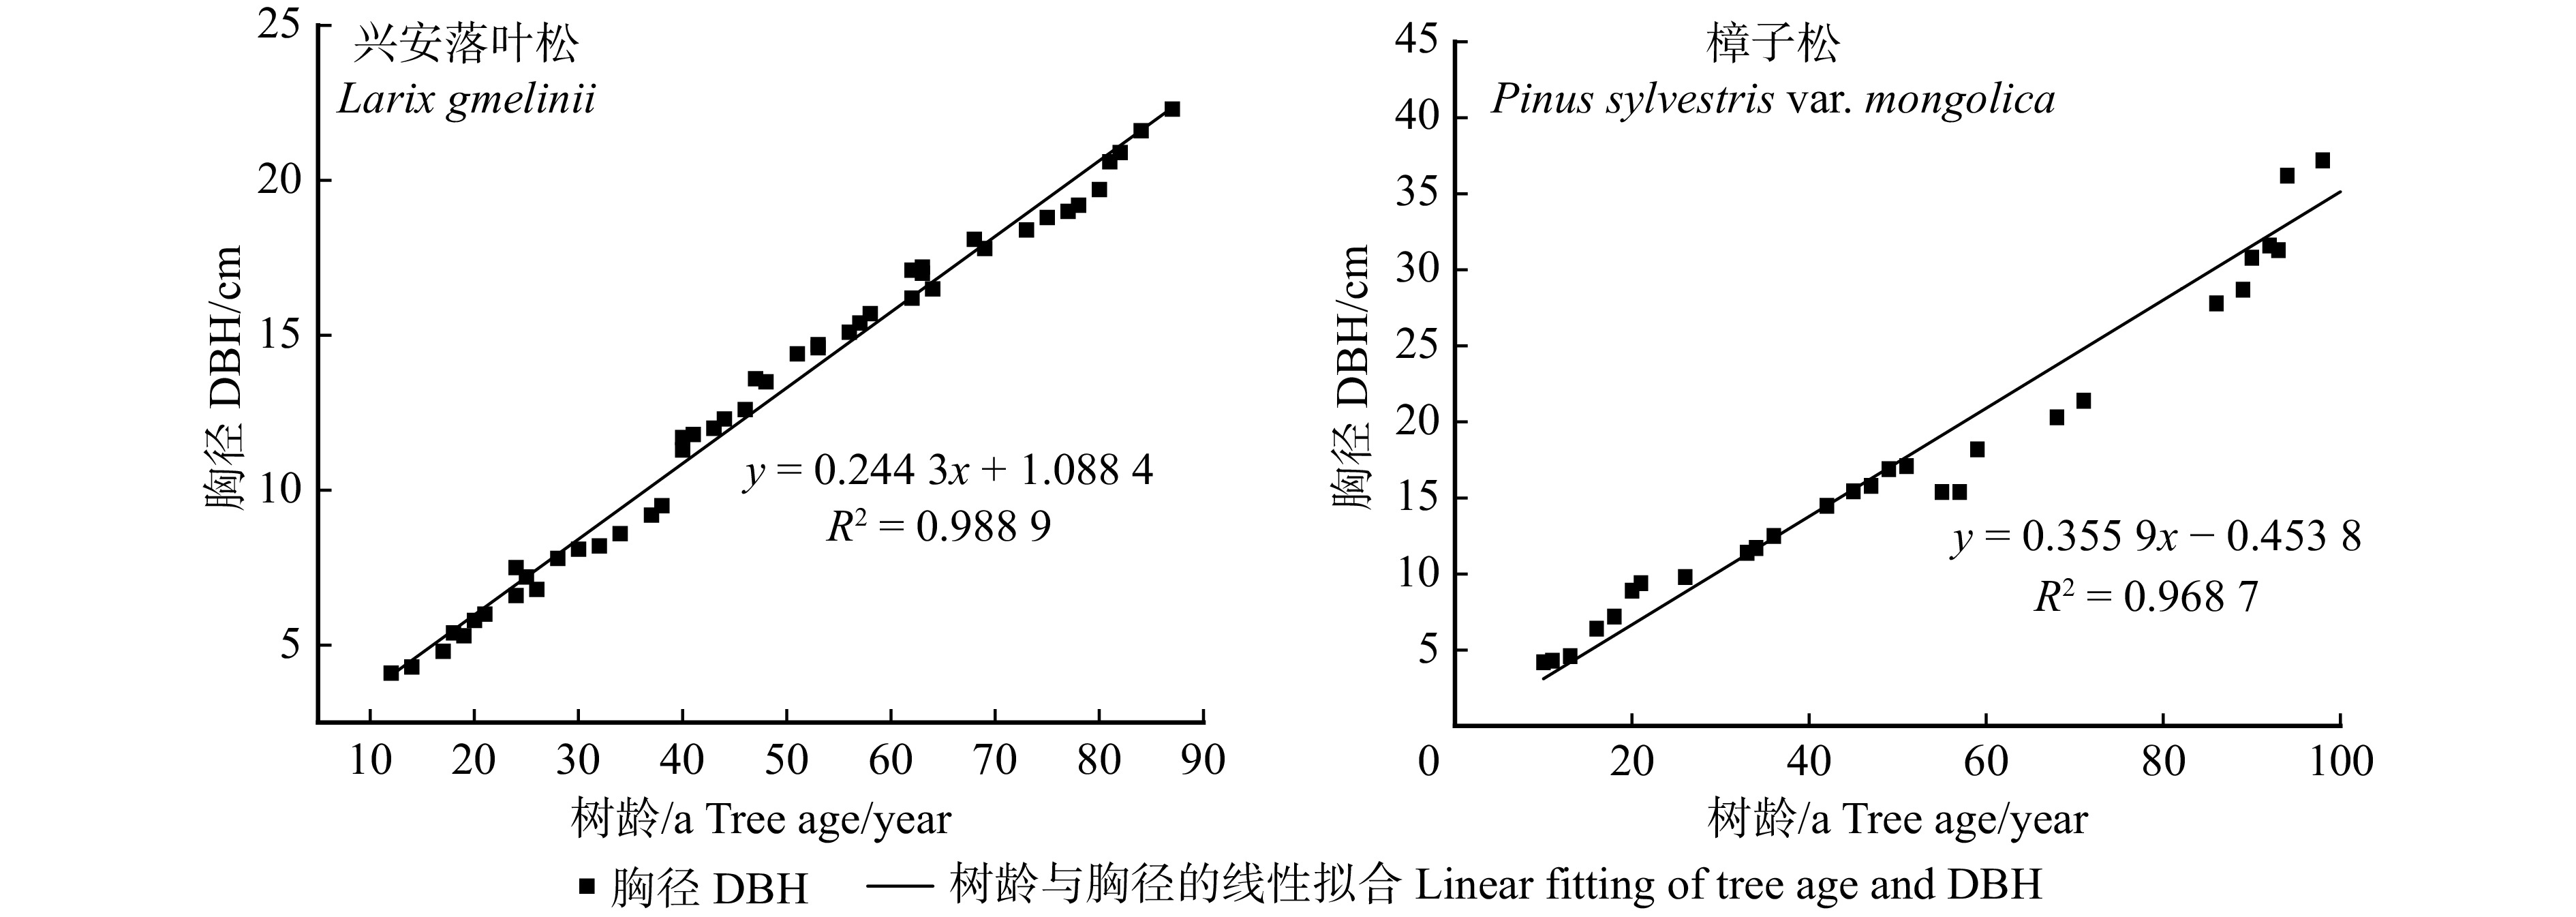
图 1 兴安落叶松林和樟子松林树龄与胸径关系图
Figure 1. Relationship between tree age and DBH of Larix gmelinii forest and Pinus sylvestris var. mongolica forest
![]()
图 2 不同龄级兴安落叶松和樟子松针叶氮含量变化特征
相同月份不同龄级间差异用不同大写字母表示;同一龄级不同月份间差异用不同小写字母表示。下同。Differences between varied age groups in the same month are represented by different capital letters. Differences among varied months in the same age class are represented by different lowercase letters. The same below.
Figure 2. Variation characteristics of nitrogen contents in needles of Larix gmelinii and Pinus sylvestris var. mongolica at different age classes
![]()
图 3 不同龄级兴安落叶松和樟子松针叶磷含量变化特征
Figure 3. Phosphorus content changes in needles of Larix gmelinii and Pinus sylvestris var. mongolica at different age classes
![]()
图 4 不同龄级兴安落叶松和樟子松针叶碳含量变化特征
Figure 4. Variation characteristics of carbon contents in needles of Larix gmelinii and Pinus sylvestris var. mongolica at different age classes
![]()
图 5 不同龄级兴安落叶松和落叶松针叶碳氮磷化学计量比变化特征
Figure 5. C, N and P stoichiometric ratios of Larix gmelinii and Pinus sylvestris var. mongolica needles at different age classes
表 1 样地基本情况
Table 1 Basic situation of the sample plots
森林植被类型
Forest vegetation type海拔
Altitude/m坡度
Slope/(°)平均胸径
Mean DBH/cm平均树高
Mean tree height/m树种组成
Tree species composition密度/(株·hm−2)
Density/(tree·ha−1)郁闭度
Canopy density兴安落叶松林
Larix gmelinii forest305 5 13.67 11.44 8L1P1B 1 300 0.8 樟子松林
Pinus sylvestris var.
mongolica forest290 10 22.90 23.18 7P2L1B 716 0.6 注:L.兴安落叶松;P.樟子松;B.白桦。Notes: L, Larix gmelinii; P, Pinus sylvestris var. mongolica; B, Betula platyphylla.  下载: 导出CSV
表 2 土壤理化性质
Table 2 Physical and chemical properties of soil
树种
Tree species月份
Month温度
Temperature/℃含水率
Moisture
content/%pH 全碳
Total C/
(mg·g−1)全氮
Total N/
(mg·g−1)全磷
Total P/
(mg·g−1)铵态氮
NH+ 4-N/
(mg·kg−1)硝态氮
NO− 3-N/
(mg·kg−1)有效磷
Available P/
(mg·kg−1)兴安落叶松林
Larix gmelinii
forest5 4.44 ± 0.15 45.86 ± 0.16 4.23 ± 0.25 31.71 ± 8.64 3.27 ± 1.05 0.73 ± 0.34 17.40 ± 0.61 1.92 ± 0.82 60.48 ± 33.05 6 10.67 ± 0.15 45.69 ± 0.13 4.27 ± 0.17 25.53 ± 8.50 3.09 ± 0.73 0.86 ± 0.50 12.45 ± 0.58 276.00 ± 0.24 42.49 ± 6.39 7 15.43 ± 0.01 40.81 ± 0.11 4.25 ± 0.15 29.03 ± 17.51 2.37 ± 0.96 0.54 ± 0.22 9.97 ± 0.43 2.63 ± 0.11 35.20 ± 13.76 8 13.43 ± 0.01 35.62 ± 0.15 4.27 ± 0.10 44.28 ± 10.81 3.69 ± 1.13 0.93 ± 0.44 24.91 ± 0.93 1.90 ± 0.70 34.61 ± 8.48 9 6.83 ± 0.17 30.57 ± 0.18 4.37 ± 0.14 37.14 ± 7.66 4.06 ± 1.23 0.89 ± 0.19 23.13 ± 0.54 1.64 ± 0.32 42.12 ± 10.42 樟子松林
Pinus sylvestris
var. mongolica
forest5 4.44 ± 0.17 13.85 ± 0.21 4.41 ± 0.35 30.24 ± 8.06 1.20 ± 0.34 0.33 ± 0.15 10.88 ± 0.31 1.67 ± 0.15 45.63 ± 16.78 6 10.67 ± 0.28 11.53 ± 0.34 4.31 ± 0.25 23.68 ± 2.76 1.19 ± 0.16 0.62 ± 0.31 9.03 ± 0.11 2.54 ± 0.14 40.76 ± 7.78 7 15.43 ± 0.23 9.84 ± 0.16 4.09 ± 0.24 29.54 ± 11.71 1.29 ± 0.49 0.30 ± 0.10 12.31 ± 0.39 2.43 ± 0.15 44.15 ± 25.39 8 13.43 ± 0.23 6.89 ± 0.14 4.27 ± 0.29 38.78 ± 18.32 1.49 ± 0.72 0.74 ± 0.22 12.37 ± 0.57 2.42 ± 0.15 51.30 ± 17.44 9 6.83 ± 0.02 6.39 ± 0.17 4.67 ± 0.18 31.61 ± 9.72 1.52 ± 0.27 0.30 ± 0.05 13.60 ± 0.35 1.76 ± 0.21 33.76 ± 12.46
下载: 导出CSV
表 3 C、N、P含量及其化学计量比的相关系数
Table 3 Correlation coefficients of C, N, P contents and their stoichiometric ratios
树种
Tree species项目
ItemC N P C∶N C∶P N∶P 兴安落叶松
Larix gmeliniiC 1 −0.547** −0.456** 0.503** 0.460** −0.274* N 1 0.837** −0.885** −0.806** 0.428** P 1 −0.579** −0.953** −0.122 C∶N 1 0.632** −0.676** C∶P 1 .115 N∶P 1 樟子松
Pinus sylvestris var. mongolicaC 1 −0.024 −0.658** 0.209 0.726** 0.619** N 1 0.125 −0.964** −0.124 0.360** P 1 −0.244 −0.952** −0.846** C∶N 1 0.234 −0.249 C∶P 1 0.874** N∶P 1 注:**表示在 0.01 水平(双侧)上显著相关,*表示在 0.05 水平(双侧)上显著相关。下同。Notes: ** means significantly correlated at 0.01 level (bilateral), * means significantly correlated at 0.05 level (bilateral). The same below.
下载: 导出CSV
表 4 C、N、P生态化学计量与土壤因子相关性分析
Table 4 Correlation analysis between C, N, P ecostoichiometry and soil factors
树种
Tree species指标
Item含水率
Water content温度
Temperature铵态氮
NH4 +-N硝态氮
NO3 −-N兴安落叶松
Larix gmeliniiC −0.765** 0.122 0.416** −0.295* N 0.729** −0.169 −0.199 0.147 P 0.436** −0.544** −0.010 −0.099 C∶N −0.744** −0.181 0.246 −0.258* C∶P −0.374** 0.400** 0.039 0.114 N∶P 0.651** 0.575** −0.318* 0.440** 樟子松
Pinus sylvestris var. mongolicaC −0.541** 0.296* 0.182 −0.071 N −0.439** 0.187 0.427** −0.124 P 0.479** −0.079 −0.159 0.159 C∶N 0.354** −0.071 −0.335** 0.087 C∶P −0.659** 0.142 0.263* −0.243 N∶P −0.827** 0.204 0.467** −0.307*
下载: 导出CSV
-
[1] Sardans J, Rivas-Ubach A, Peñuelas J. The elemental stoichiometry of aquatic and terrestrial ecosystems and its relationships with organismic lifestyle and ecosystem structure and function: a review and perspectives[J]. Biogeochemistry, 2012, 111(1−3): 1−9.
[2] Han W X, Fang J Y, Guo D L, et al. Leaf nitrogen and phosphorus stoichiometry across 753 terrestrial plant species in China[J]. New Phytologist, 2005, 168: 377−385.
[3] 白雪娟, 曾全超, 安韶山, 等. 黄土高原不同人工林叶片−凋落叶−土壤生态化学计量特征[J]. 应用生态学报, 2016, 27(12): 3823−3830. Bai X J, Zeng Q C, An S S, et al. Ecological stoichiometry characteristics of leaf-litter-soil in different plantations on the Loess Plateau, China[J]. Chinese Journal of Applied Ecology, 2016, 27(12): 3823−3830.
[4] 魏晨, 张小平, 罗子渝, 等. 兰州市南山和北山3种乔木叶片生态化学计量特征的对比研究[J]. 生态学报, 2021, 41(6): 2460−2470. Wei C, Zhang X P, Luo Z Y, et al. A comparative study on foliar stoichiometry traits of three trees in north and south mountains of Lanzhou City[J]. Acta Ecologica Sinica, 2021, 41(6): 2460−2470.
[5] 王绍强, 于贵瑞. 生态系统碳氮磷元素的生态化学计量学特征[J]. 生态学报, 2008, 28(8): 3937−3947. doi: 10.3321/j.issn:1000-0933.2008.08.054 Wang S Q, Yu G R. Ecological stoichiometry characteristics of ecosystem carbon, nitrogen and phosphorus elements[J]. Acta Ecologica Sinica, 2008, 28(8): 3937−3947. doi: 10.3321/j.issn:1000-0933.2008.08.054
[6] Koerselman W, Meuleman A F. The vegetation N: P ratio: a new tool to detect the nature of nutrient limitation[J]. Journal of Applied Ecology, 1996, 33: 1441−1450. doi: 10.2307/2404783
[7] 皮发剑, 袁丛军, 喻理飞, 等. 黔中天然次生林主要优势树种叶片生态化学计量特征[J]. 生态环境学报, 2016, 25(5): 801−807. doi: 10.16258/j.cnki.1674-5906.2016.05.011 Pi F J, Yuan C J, Yu L F, et al. Ecological stoichiometry characteristics of plant leaves from the main dominant species of natural secondary forest in the central of Guizhou[J]. Ecology and Environmental Sciences, 2016, 25(5): 801−807. doi: 10.16258/j.cnki.1674-5906.2016.05.011
[8] 侯皓, 刘慧, 贺鹏程, 等. 木兰科常绿与落叶物种叶片构建策略的差异[J]. 热带亚热带植物学报, 2019, 27(3): 272−278. Hou H, Liu H, He P C, et al. Different leaf construction strategies in evergreen and deciduous species of Magnoliaceae[J]. Journal of Tropical and Subtropical Botany, 2019, 27(3): 272−278.
[9] Sardans J, Peñuelas J. Trees increase their P: N ration with size[J]. Global Ecology and Biogeography, 2015, 24(2): 147−156. doi: 10.1111/geb.12231
[10] 何斌, 李青, 冯图, 等. 黔西北不同林龄马尾松人工林针叶−凋落物−土壤 C、N、P 化学计量特征[J]. 生态环境学报, 2019, 28(11): 2149−2157. He B, Li Q, Feng T, et al. Stoichiometry characteristics of C, N, and P in needle leaves, litter, and soil during stand development in a Pinus massoniana plantation in northwest Guizhou Province[J]. Ecology and Environmental Sciences, 2019, 28(11): 2149−2157.
[11] 王平安, 宫渊奇, 王琪武, 等. 不同林龄华北落叶松人工林针叶−凋落叶−土壤碳氮磷生态化学计量特征[J]. 西北林学院学报, 2020, 35(6): 1−9. doi: 10.3969/j.issn.1001-7461.2020.06.01 Wang P A, Gong Y Q, Wang Q W, et al. Carbon, nitrogen and phosphorus stoichiometry characteristics of needle leaf-leaf litter-soil from Larix principis-rupprechtii plantations with different stand ages[J]. Journal of Northwest Forestry University, 2020, 35(6): 1−9. doi: 10.3969/j.issn.1001-7461.2020.06.01
[12] Phillips R P, Fahey T J. The influence of soil fertility on rhizosphere effects in northern hardwood forest soils[J]. Soil Science Society of America Journal, 2008, 72(2): 453−461. doi: 10.2136/sssaj2006.0389
[13] Sterner R W, Elser J J. Ecological stoichiometry: the biology of elements form molecules to the biosphere[M]. Princeton: Princeton University Press, 2003.
[14] 杨林. 内蒙古大兴安岭兴安落叶松林植物–土壤生态化学计量特征研究[D]. 呼和浩特: 内蒙古农业大学, 2020. Yang L. Study on plant-soil eco-stoichiometry characteristics of Larix gmelinii in Daxing’an Mountains, Inner Mongolia[D]. Huhhot: Inner Mongolia Agricultural University, 2020.
[15] Reich P B, Oleksyn J. Global patterns of plant leaf N and P in relation to temperature and latitude[J]. Proceedings of the National Academy of Science of the United States of America, 2004, 101: 11001−11006. doi: 10.1073/pnas.0403588101
[16] 孙书存, 陈灵芝. 东灵山地区辽东栎叶养分的季节动态与回收效率[J]. 植物生态学报, 2001, 25(1): 76−82. doi: 10.3321/j.issn:1005-264X.2001.01.013 Sun S C, Chen L Z. Leaf nutrient dynamics and resorption efficiency of Quercus liaotungensis in the Dongling Mountain region[J]. Chinese Journal of Plant Ecology, 2001, 25(1): 76−82. doi: 10.3321/j.issn:1005-264X.2001.01.013
[17] 吴统贵, 吴明, 刘丽, 等. 杭州湾滨海湿地3种草本植物叶片N、P化学计量学的季节变化[J]. 植物生态学报, 2010, 34(1): 23−28. doi: 10.3773/j.issn.1005-264x.2010.01.005 Wu T G, Wu M, Liu L, et al. Seasonal variations of leaf nitrogen and phosphorus stoichiometry of three herbaceous species in Hangzhou Bay coastal wetlands, China[J]. Chinese Journal of Plant Ecology, 2010, 34(1): 23−28. doi: 10.3773/j.issn.1005-264x.2010.01.005
[18] 闫芊, 陆健健, 何文珊. 崇明东滩湿地高等植被演替特征[J]. 应用生态学报, 2007, 18(5): 1097−1101. doi: 10.3321/j.issn:1001-9332.2007.05.027 Yan Q, Lu J J, He W S. Succession character of salt marsh vegetation in Chongming Dongtan Wetland[J]. Chinese Journal of Applied Ecology, 2007, 18(5): 1097−1101. doi: 10.3321/j.issn:1001-9332.2007.05.027
[19] Townsend A R, Cleveland C C, Asner G P, et al. Controls over foliar N∶P ratios in tropical forests[J]. Ecology, 2007, 88: 107−118.
[20] 刘超, 王洋, 王楠, 等. 陆地生态系统植被氮磷化学计量研究进展[J]. 植物生态学报, 2012, 36(11): 1205−1216. Liu C, Wang Y, Wang N, et al. Advances research in plant nitrogen, phosphorus and their stoichiometry in terrestrial eco-systems: a review[J]. Chinese Journal of Plant Ecology, 2012, 36(11): 1205−1216.
[21] Elser J J, Bracken M E S, Cleland E E, et al. Global analysis of nitrogen and phosphorus limitation of primary producers in fresh water, marine and terrestrial eco-systems[J]. Ecology Letters, 2007, 10(12): 1135−1142. doi: 10.1111/j.1461-0248.2007.01113.x
[22] 张彤彤, 徐福利, 汪有科, 等. 施用氮磷钾对密植梨枣生长与叶片养分季节动态的影响[J]. 植物营养与肥料学报, 2012, 18(1): 241−248. doi: 10.11674/zwyf.2012.11185 Zhang T T, Xu F L, Wang Y K, et al. Effects of fertilization on growth and seasonal dynamic of leaf nutrients of close planting pear-jujube trees[J]. Plant Nutrition and Fertilizer Science, 2012, 18(1): 241−248. doi: 10.11674/zwyf.2012.11185
[23] Chapin Ⅲ F S, Johnson D A, Mckend R J D. Seasonal movement of nutrients in plants of differing growth form in an Alaskan tundra ecosystem: implications for herbivory[J]. Journal of Ecology, 1980, 68: 189−209. doi: 10.2307/2259251
[24] Elser J J, Sterner R W, Gorokhova E, et al. Biological stoichiometry from genes to ecosystems[J]. Ecology Letters, 2000, 3(6): 540−550. doi: 10.1046/j.1461-0248.2000.00185.x
[25] 刘微, 李德志, 纪倩倩, 等. 两种生境常绿和落叶树种叶片氮素分配及与光合能力的关系[J]. 生态科学, 2015, 34(1): 1−8. Liu W, Li D Z, Ji Q Q, et al. Leaf nitrogen allocation of evergreen and deciduous broad-leaved tree species and their relationships with photosynthetic capacity in the two habitats[J]. Ecological Science, 2015, 34(1): 1−8.
[26] 高三平, 李俊祥, 徐明策, 等. 天童常绿阔叶林不同演替阶段常见种叶片 N、P化学计量学特征[J]. 生态学报, 2007, 27(3): 947−952. Gao S P, Li J X, Xu M C, et al. Leaf N and P stoichiometry of common species in successional stages of the evergreen broad-leaved forest in Tiantong National Forest Park, Zhejiang Province, China[J]. Acta Ecologica Sinica, 2007, 27(3): 947−952.
[27] 刘万德, 苏建荣, 李帅锋, 等. 云南普洱季风常绿阔叶林演替系列植物和土壤C、N、P化学计量特征[J]. 生态学报, 2010, 30(23): 6581−6590. Liu W D, Su J R, Li S F, et al. Stoichiometry study of C, N and P in plant and soil at different successional stages of monsoon evergreen broad-leaved forest in Pu’er, Yunnan Province[J]. Acta Ecologica Sinica, 2010, 30(23): 6581−6590.
[28] Herbert D A, Williams M, Rastetter E B. A model analysis of N and P limitation on carbon accumulation in Amazonian secondary forest after alternate land-use abandonment[J]. Biogeochemistry, 2003, 65(1): 121−150. doi: 10.1023/A:1026020210887
[29] 武盼盼, 曾利剑, 雷平, 等. 江西武夷山南方铁杉林主要树种叶片养分含量及再吸收效率[J]. 林业科学, 2022, 58(1): 12−21. doi: 10.11707/j.1001-7488.20220102 Wu P P, Zeng L J, Lei P, et al. Content of leaf nutrients and resorption efficiency of major tree species in Tsuga chinensis forest in Wuyi Mountain, Jiangxi Province[J]. Scientia Silvae Sinicae, 2022, 58(1): 12−21. doi: 10.11707/j.1001-7488.20220102
[30] 任书杰, 于贵瑞, 陶波, 等. 中国东部南北样带654种植物叶片氮和磷的化学计量学特征研究[J]. 环境科学, 2007, 28(12): 2665−2673. doi: 10.3321/j.issn:0250-3301.2007.12.001 Ren S J, Yu G R, Tao B, et al. Leaf nitrogen and phosphorus stoichiometry across 654 terrestrial plant species in NSTEC[J]. Environmental Science, 2007, 28(12): 2665−2673. doi: 10.3321/j.issn:0250-3301.2007.12.001
[31] Hedin L O. Global organization of terrestrial plant-nutrient interactions[J]. Proceedings of the National Academy of Sciences of the United States of America, 2004, 101: 10849−10850. doi: 10.1073/pnas.0404222101
[32] Bowman W D. Accumulation and use of nitrogen and phosphorus following fertilization in two alpine tundra communities[J]. Oikos, 1994, 70(2): 261−270. doi: 10.2307/3545637
[33] Aerts R, Iii F S. The mineral nutrition of wild plants revisited: a re-evaluation of processes and patterns[J]. Advances in Ecological Research, 1997, 30: 1−67.
[34] Mcgroddy M E, Daufresne T, Hedin L O. Scaling of C∶N∶P stoichiometry in forests worldwide: implications of terrestrial red filed-type ratios[J]. Ecology, 2004, 85(9): 2390−2401. doi: 10.1890/03-0351
[35] 胡耀升, 么旭阳, 刘艳红. 长白山森林不同演替阶段植物与土壤氮磷的化学计量特征[J]. 应用生态学报, 2014, 25(3): 632−638. Hu Y S, Yao X Y, Liu Y H. N and P stoichiometric traits of plant and soil in different forest succession stages in Changbai Mountains[J]. Chinese Journal of Applied Ecology, 2014, 25(3): 632−638.
[36] Yan Z B, Li P, Chen Y H, et al. Nutrient allocation strategies of woody plants: an approach from the scaling of nitrogen and phosphorus between twig stems and leaves[J/OL]. Scientific Reports, 2016: 20099 [2022−10−09]. https://pubmed.ncbi.nlm.nih.gov/26848020/.
[37] 许雪贇, 秦燕燕, 曹建军, 等. 青藏高原火绒草叶片生态化学计量特征随海拔的变化[J]. 应用生态学报, 2018, 29(12): 3934−3940. Xu X Y, Qin Y Y, Cao J J, et al. Elevational variations of leaf stochiometry in Leontopodium leontopodioides on the Qinghai-Tibetan Plateau, China[J]. Chinese Journal of Applied Ecology, 2018, 29(12): 3934−3940.
[38] Sterner R W, Elser J J. Ecological stoichiometry: the biology of elements from molecules to the biosphere[M]. Princeton: Princeton University Press, 2002: 439.
[39] Xia C X, Yu D, Wang Z, et al. Stoichiometry patterns of leaf carbon, nitrogen and phosphorous in aquatic macrophytes in eastern China[J]. Ecological Engineering, 2014, 70: 406−413. doi: 10.1016/j.ecoleng.2014.06.018
[40] 黄菊莹, 袁志友, 李凌浩. 羊草绿叶氮、磷浓度和比叶面积沿氮、磷和水分梯度的变化[J]. 植物生态学报, 2009, 33(3): 442−448. doi: 10.3773/j.issn.1005-264x.2009.03.003 Huang J Y, Yuan Z Y, Li L H. Changes in N, P and specific leaf area of green leaves of Leymus chinensis along nitrogen, phosphorus and water gradients[J]. Chinese Journal of Plant Ecology, 2009, 33(3): 442−448. doi: 10.3773/j.issn.1005-264x.2009.03.003
[41] 陈廷廷, 史顺增, 熊德成, 等. 土壤增温对幼龄杉木细根化学计量学特征的影响[J]. 亚热带资源与环境学报, 2018, 13(2): 13−21. doi: 10.3969/j.issn.1673-7105.2018.02.004 Chen T T, Shi S Z, Xiong D C, et al. Effects of soil warming on fine root stoichiometry of young Chinese fir seedlings[J]. Journal of Subtropical Resources and Environment, 2018, 13(2): 13−21. doi: 10.3969/j.issn.1673-7105.2018.02.004
[42] 宾振钧, 张仁懿, 张文鹏, 等. 氮磷硅添加对青藏高原高寒草甸垂穗披碱草叶片碳氮磷的影响[J]. 生态学报, 2015, 35(14): 4699−4706. Bin Z J, Zhang R Y, Zhang W P, et al. Effects of nitrogen, phosphorus and silicon addition on leaf carbon, nitrogen, and phosphorus concentration of Elymus nutans of alpine meadow on Qinghai-Tibetan Plateau, China[J]. Acta Ecologica Sinica, 2015, 35(14): 4699−4706.
[43] 蒋婧, 宋明华. 植物与土壤微生物在调控生态系统养分循环中的作用[J]. 植物生态学报, 2010, 34(8): 979−988. doi: 10.3773/j.issn.1005-264x.2010.08.011 Jiang J, Song M H. Review of the roles of plants and soil microorganisms in regulating ecosystem nutrient cycling[J]. Chinese Journal of Plant Ecology, 2010, 34(8): 979−988. doi: 10.3773/j.issn.1005-264x.2010.08.011
[44] 丁凡, 廉培勇, 曾德慧. 松嫩平原草甸三种植物叶片N、P化学计量特征及其与土壤N、P浓度的关系[J]. 生态学杂志, 2011, 30(1): 77−81. Ding F, Lian P Y, Zeng D H. Chararacteristics of plant leaf nitrogen and phosphorus stoichiometry in relation to soil nitrogen and phosphorus concentrations in Songnen Plain meadow[J]. Chinese Journal of Ecology, 2011, 30(1): 77−81.
[45] Jonas P, Patrick F, Akira G, et al. To be or not to be what you eat: regulation of stoichiometric homeostasis among autotrophs and heterotrophs[J]. Oikos, 2010, 119: 741−751. doi: 10.1111/j.1600-0706.2009.18545.x
[46] 赵君, 张仁彭, 李新娥, 等. 甘南亚高寒草甸金露梅叶片氮磷化学计量学动态[J]. 兰州大学学报(自然科学版), 2011, 47(2): 88−92. Zhao J, Zhang R P, Li X E, et al. Leaf nitrogen andphosphorus stoichiometry in Potentilla fruticosa L. affected byinternal and external factors in the subalpine in Gannan[J]. Journal of Lanzhou University (Natural Sciences), 2011, 47(2): 88−92.
-
期刊类型引用(1)
1. 米湘成,王绪高,沈国春,刘徐兵,宋晓阳,乔秀娟,冯刚,杨洁,毛子昆,徐学红,马克平. 中国森林生物多样性监测网络:二十年群落构建机制探索的回顾与展望. 生物多样性. 2022(10): 211-233 .  百度学术
百度学术
其他类型引用(3)


计量
- 文章访问数: 382
- HTML全文浏览量: 113
- PDF下载量: 60
- 被引次数: 4
