Comparison and evaluation of several methods for estimating the average density of total forest volume in forest farm
-
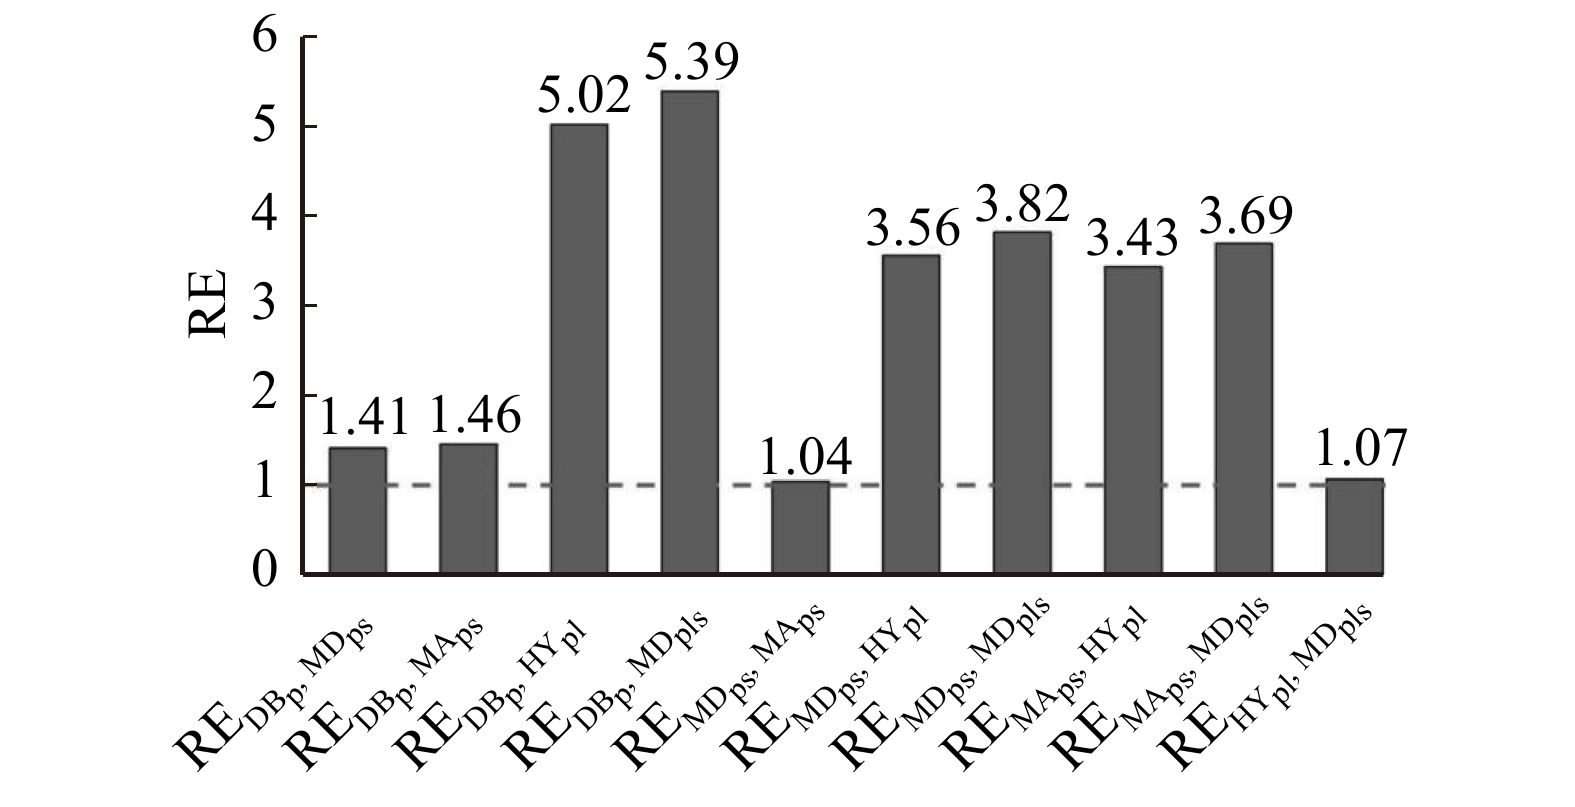
摘要:目的 以林场或县森林资源总体为调查对象,及时、准确地调查监测总体平均每公顷蓄积量,对上级(如市、省)部门开展森林资源宏观管理、生态保护价值评价、森林碳储量计量、领导干部任期绩效考核等工作都有重要支撑作用。将卫星、无人机等多源遥感数据作为辅助数据,采用较少抽样调查样地数据,实现总体参数有效估测的新方法,已成为国内外重要的研究方向,但目前,国内尚无多种现有估计方法的比较评价研究。为了促进新一代遥感技术在森林资源调查业务中的应用,提高我国森林资源天空地一体化调查监测技术水平,亟需对现有林场或县总体参数估测方法进行比较评价研究。方法 以内蒙古旺业甸实验林场主要人工林树种为总体,基于2019年在林场获取的无人机激光雷达(LiDAR)抽样数据、Sentinel-2A多光谱数据(全覆盖)和少量样地数据,针对样地(p)、样地−卫星(ps)、样地−抽样无人机LiDAR(pl)以及样地−抽样无人机LiDAR-卫星(pls)4种模式,利用适合这4种模式的概率抽样法(DB)、模型辅助法(MA)、模型法(MD)和混合法(HY)4类共5种估测方法(DBp、MDps、MAps、HYpl以及MDpls)对总体森林蓄积量密度均值(MSVD)进行估计与对比分析。结果 (1)DBp、MDps、MAps、HYpl、MDpls 5种方法估测的MSVD分别为212.54、202.09、202.38、210.07以及208.96 m3/hm2,精度分别为90.44%、91.54%、91.69%、96.35%和96.45%,方差依次减小。(2)其他4种方法相对于MDpls方法的估计效率(RE)均大于1(REDBp,MDpls = 5.39,REMDps,MDpls = 3.82,REMAps,MDpls = 3.69,REHYpl,MDpls = 1.07);HYpl相对于MDpls的RE略大于1,但几倍于其他3种方法(REDBp,HYpl = 5.02,REMAps,HYpl = 3.43,REMDps,HYpl = 3.56)。(3)包含LiDAR数据的HYpl与MDpls方法相对于包含Sentinel-2A数据的MDps与MAps方法均为正效率(REMAps,HYpl = 3.43,REMDps,HYpl = 3.56,REMDps,MDpls = 3.82,REMAps,MDpls = 3.69);MDps与MAps方法之间的RE接近1,但MAps的效率微高于MDps(REMDps,MAps = 1.04)。结论 和只利用样地数据的估计方法相比,将遥感数据作为辅助变量建立估测模型,无论是采用对蓄积量不够敏感的林场全覆盖Sentinel-2A多光谱遥感数据,还是采用对蓄积量很敏感的抽样式获取的LiDAR数据,都可有效提高林场总体MSVD的估测精度。涉及遥感数据应用的4种方法,估计精度最高的为MDpls,其次为HYpl,这2种方法都包含了LiDAR遥感抽样观测数据的应用,都是适应于林场总体MSVD估计的年度监测方法。可实现天空地3种观测数据协同应用的MDpls估测精度和相对效率最高,可作为林场森林蓄积量年度监测的首选方法。Abstract:Objective Taking the overall forest resources of forest farms or counties as the object of investigation, timely and accurately investigating and monitoring of the mean stock volume density(MSVD)will play an important supporting role in the macro management of forest resources, the evaluation of ecological protection value, the measurement of forest carbon reserves, and the performance evaluation of the tenure of leading cadres by the superior departments (such as cities and provinces). It has become an important research direction at home and abroad using remote sensing data, such as satellites and unmanned aerial vehicles, combining with less sampling plot to effectively estimate the overall parameters. At present, there is no comparative validation of several estimation methods for mean stock volume based on multi-source data in domestic. In order to promote the application of remote sensing technology in the forest resource survey, there is an urgent need to compare and evaluate the methods for estimating overall parameters of forest farms or counties.Method The main plantation tree species of Wangyedian Forest Farm in Inner Mongolia of northern China were taken as the research object. Based on the sampling UAV LiDAR (herringbone system distribution), Sentinel-2A data (full coverage) and a small amount of sample plot data obtained in 2019, four patterns of sample plot (p), sample plot-satellite (ps), sample plot-sampling LiDAR (pl), and sample plot-sampling LiDAR-full coverage satellite (pls) were estimated and compared with five methods, including DBp, MDps, MDpls, HYpl and MAps, which were suitable for these four patterns and belong to design-based method (DB), model-assisted method (MA), model-dependent method (MD) and mixed or hybrid method (HY).Result (1)The mean stock volume densities of DBp, MDps, MAps, HYpl, and MDpls were 212.54, 202.09, 202.38, 210.07 and 208.96 m3/ha, respectively. The accuracy (P) was 90.44%, 91.54%, 91.69%, 96.35%, and 96.45%, respectively, with variances decreasing in turn. (2) The relative efficiency (RE) of other methods compared with MDpls was greater than 1 (REDBp,MDpls = 5.39, REMDps,MDpls = 3.82, REMAps,MDpls = 3.69, REHYpl,MDpls = 1.07), and the RE of HYpl compared with MDpls method was greater than 1, but close to 1. Compared with the other three methods, HYpl was more efficient (REDBp,HYpl = 5.02, REMAps,HYpl = 3.43, REMDps,HYpl = 3.56). (3) Both HYpl and MDpls methods containing LiDAR data had positive efficiency compared with MDps and MAps methods containing Sentinel-2A data (REMAps,HYpl = 3.43, REMDps,HYpl = 3.56, REMDps,MDpls = 3.82, REMAps,MDpls = 3.69). The RE of MDps and MAps was close to 1, but the efficiency of MAps was slightly higher than that of MDps (REMDps,MAps = 1.04).Conclusion Compared with the estimation method that only used the sample plot data, when the remote sensing data was used as an auxiliary variable to establish the estimation model, it can effectively improve the estimation accuracy of the MSVD of the forest farm, whether the Sentinel-2A multispectral remote sensing data, which is fully covered the forest farm but not sensitive enough to the stock volume, or the sampling LiDAR data which are sensitive to stock volume. Among four methods involving the application of remote sensing data, MDpls has the highest estimation accuracy, followed by HYpl. Both of these two methods including the application of LiDAR remote sensing sampling observation data are suitable for the MSVD estimation of forest farms. The MDpls method has the highest estimation accuracy and relative efficiency, which can realize the synergistic application of the Space-Air-Earth multi-source observation data, and can be used as the preferred method for annual monitoring of forest stock in forest farms.
-
-
表 1 S-2A卫星数据特征
Table 1 S-2A satellite data characteristics
特征名称
Feature name特征符号
Feature symbol计算公式
Calculation formula特征名称
Feature name特征符号
Feature symbol计算公式
Calculation formula光谱特征
Spectral featureB2、B3、B4、B5、B6、B7、B8a、B11、B12 角二阶矩
Angular second momentAN k∑i,j=1P2i,j 差值植被指数
Difference vegetation indexDVI B8−B4 熵
EntropyEN k∑i,j=1Pi,j(−lnPi,j) 增强植被指数
Enhanced vegetation indexEVI 2.5 × (B8 − B4)/(B8 + 6 × B4 − 7.5 × B2 + 1) 对比度
ContrastCON k∑i,j=1(i−j)2×Pi,j 归一化植被指数
Normalized difference vegetation indexNDVI (B8−B4)/(B8+B4) 均值
MeanME 1k2k∑i,j=1Pi,j 比值植被指数
Ratio vegetation indexSR B8/B4 方差
VarianceVAR k∑i,j=1Pi,j(i,j−ME) 转换归一化植被指数
Transformed normalized difference vegetation indexTNDVI √(B8−B4)/(B8+B4)+0.5 同质性
HomogeneityHOM k∑i,j=1Pi,j1+(i−j)2 叶绿素指数
Chlorophyll indexCIg B8/B3−1 相关性
CorrelationCOR k∑i,j=1P2i,j[(i−ui)−(j−uj)√σ2iσ2j] 反向红边叶绿素指数
Inverted red edge chlorophyll indexIRECI (B7−B4)/(B5/B6) 相异性
DissimilarityDIS k∑i,j=1Pi,j|i−j| 色素简单比值指数
Pigment specific simple ratioPSSRA B7/B4 修正叶绿素吸收反射指数
Modified chlorophyll absorption in reflectance indexMCARI [(B5 − B4) − 0.2 × (B5 − B3)] × (B5/B4) S-2A 红边位置指数
S-2A red edge positionS2REP 705 + 35 × [(B4 + B7)/2 − B5]/(B6 − B5) 修正窄边红边简单比值指数
Modified simple ratio red edge narrowMSRren [(B8a/B5)−1]/√(B8a/B5)+1 红边叶绿素指数
Red edge chlorophyll indexCIgre1 B5/B3−1 红边植被指数
Red edge vegetation indexNDVIre1 (B8−B5)/(B8+B5) CIgre2 B5/B3−1 NDVIre2 (B8−B6)/(B8+B6) CIgre3 B7/B3−1 NDVIre3 (B8−B7)/(B8+B7) 注:B2、B3、B4、B5、B6、B7、B8、B8a、B11、B12代表S-2A数据对应的波段,Pi,j=Di,j/∑ki,j=1Di,j,Di,j为i行j列对应的像元值,k代表计算纹理时窗口大小。Notes: B2, B3, B4, B5, B6, B7, B8, B8a, B11 and B12 represent the bands corresponding to S-2A data; Pi,j=Di,j/∑ki,j=1Di,j, Di,j is the pixel value corresponding to the i row and j column, k represents the window size when calculating the texture. 表 2 LiDAR数据特征
Table 2 Feature of LiDAR data
特征名称
Feature name特征符号
Feature symbol均值
MeanHmean, Imean 方差和标准差
Variance and standard deviationHvar, Ivar, Hsd, Isd 最大值和最小值
Maximum value and minimum valueHmax, Imax, Hmin, Imin 变异系数
Coefficient of variationHcv, Icv 四分距差
Interquartile distanceHiq, Iiq 偏斜度
SkewnessHsk, Isk 百分位数
PercentileHp05, Hp10, Hp20, Hp25, ···, Hp95, Hp99
Ip05, Ip10, Ip20, Ip25,···, Ip95, Ip99最小高度以上返回点
Count of return point above the minimum heightR1H, R2H,···, R8H, R9H 注:H代表高度,I代表强度,var代表方差,sd代表标准差,max与min分别代表最大值与最小值,cv、iq以及sk分别代表变异系数、四分距差以及偏斜度,p05—p99代表对应的百分位数。Notes: H represents height, I represents intensity, var represents variance, sd represents standard deviation, max and min represent maximum value and minimum value, respectively; cv, iq and sk represent coefficient of variation, interquartile distance and skewness, respectively; p05−p99 represent the corresponding percentiles. 表 3 材积计算公式
Table 3 Formula for volume calculation
树种 Tree species 材积计算公式 Formula for volume calculation 白桦
Betula platyphyllaV=100.000397507075980248×d2×h+3.8121380807356×10⁻⁶×d3×h−0.000843446660194932×d2−0.000290088083727618×d2×h×lgd 黑桦
Betula davuricaV=0.0199215193890509+0.00038814516708027×d2−2.05059660776977×10⁻⁵×d2×h−
0.000870310875746131×h2+8.05362136949543×10⁻⁵×d×h2落叶松
Larix gmeliniiV=10−3.49890390728004+2.75504846502564×lgd−0.394050839410844×lgd2−1.37915356404294×lgh+1.14586681477751×lgh2 樟子松
Pinus sylvestrisV=0.000445504541007861×d1.66316523786429×exp(0.0989929357004981×h−1.66681646056217/h) 油松
Pinus tabuliformisV=2.53309290763168×10⁻⁵×d2×h−8.57378841160325×10⁻⁷×d3×h−6.00033429201054×10⁻⁵×d2+
2.93720677218884×10⁻⁵×d2×h×lgd注:引自文献[40]。V代表单木材积;d代表单木胸径;h代表单木树高。Notes: cited from reference [40]. V represents single tree stock volume, d represents single tree DBH, h represents single tree height. 表 4 遥感特征优选后保留的特征
Table 4 Remotes sensing features selected after optimum feature selection
数据源
Data source特征选择结果
Result of feature selectionS-2A B2,MCARI,B2ME,B12COR LiDAR Hmean,Ip99,R2H 表 5 5种方法的总体均值估计结果和精度
Table 5 Results and accuracy of total mean estimation of the five methods
方法
Method总体均值/(m3·hm−2)
Total mean/(m3·ha−1)均值方差/(m3·hm−2)
Mean variance/(m3·ha−1)标准误/(m3·hm−2)
Standard error/(m3·ha−1)估测精度
Estimation accuracyDBp 212.54 107.51 10.37 90.44% MDps 202.09 76.18 8.72 91.54% MAps 202.38 73.55 8.58 91.69% HYpl 210.07 21.42 4.63 96.35% MDpls 208.96 19.95 4.47 96.45% -
[1] 宋进春. 省级森林资源面积年度出数研究:以广西壮族自治区为例[J]. 中南林业调查规划, 2021, 40(2): 9−14, 26. Song J C. Research on annual results for provincial forest resource area: a case study in Guangxi Zhuang Autonomous Region[J]. Central South Forest Inventory and Planning, 2021, 40(2): 9−14, 26.
[2] 张晓丽, 游先祥. 应用“3S”技术进行北京市森林立地分类和立地质量评价的研究[J]. 遥感学报, 1998, 2(4): 292−295. doi: 10.11834/jrs.19980411 Zhang X L, You X X. Application of 3S technology to forest site type classification and site quality evaluation in Beijing[J]. Journal of Remote Sensing, 1998, 2(4): 292−295. doi: 10.11834/jrs.19980411
[3] 黄国胜, 马炜, 王雪军, 等. 基于一类清查数据的福建省立地质量评价技术[J]. 北京林业大学学报, 2014, 36(3): 1−8. Huang G S, Ma W, Wang X J, et al. Forestland site quality evaluation of Fujian Province based on continuous forest inventory data[J]. Journal of Beijing Forestry University, 2014, 36(3): 1−8.
[4] 王雪军, 张煜星, 黄国胜, 等. 全国森林面积和森林蓄积年度出数方法探讨[J]. 江西农业大学学报, 2016, 38(1): 9−18. Wang X J, Zhang Y X, Huang G S, et al. Discussion on methods for annual national producing estimates of forest area and forest stock in China[J]. Acta Agriculturae Universitatis Jiangxiensis, 2016, 38(1): 9−18.
[5] 聂祥永, 姚顺彬, 张敏, 等. 国家森林资源连续清查数据处理统计规范(LY/T 1957—2011)[S]. 北京: 中国标准出版社, 2011. Nie X Y , Yao S B, Zhang M, et al. Specification for data processing and statistic in national forest inventory(LY/T 1957−2011)[S]. Beijing: China Standard Press, 2011.
[6] 唐小平, 翁国庆, 陈雪峰, 等. 森林资源规划设计调查技术规程(GB/T26424—2010)[S]. 北京: 中国标准出版社, 2010. Tang X P, Weng G Q, Chen X F, et al. Technical regulations for inventory for forest management planning and design (GB/T26424−2010)[S]. Beijing: China Standard Press, 2010.
[7] Saarela S, Holm S, Grafström A, et al. Hierarchical model-based inference for forest inventory using three sources of information[J]. Annals of Forest Science, 2016, 73: 895−910. doi: 10.1007/s13595-016-0590-1
[8] Ståhl G, Saarela S, Schnell S, et al. Use of models in large-area forest surveys: comparing model-assisted, model-based and hybrid estimation[J]. Forest Ecosystems, 2016, 3: 1−11. doi: 10.1186/s40663-016-0060-0
[9] Ene L T, Næsset E, Gobakken T, et al. Assessing the accuracy of regional LiDAR-based biomass estimation using a simulation approach[J]. Remote Sensing of Environment, 2012, 123: 579−592. doi: 10.1016/j.rse.2012.04.017
[10] Graubard B I, Korn E L. Inference for superpopulation parameters using sample surveys[J]. Statistical Science, 2002, 17(1): 73−96.
[11] Ståhl G, Holm S, Gregoire T G, et al. Model-based inference for biomass estimation in a LiDAR sample survey in Hedmark County, Norway[J]. Canadian Journal of Forest Research, 2011, 41(1): 96−107. doi: 10.1139/X10-161
[12] Corona P, Fattorini L, Franceschi S, et al. Estimation of standing wood volume in forest compartments by exploiting airborne laser scanning information: model-based, design-based, and hybrid perspectives[J]. Canadian Journal of Forest Research, 2014, 44(11): 1303−1311. doi: 10.1139/cjfr-2014-0203
[13] McRoberts R E, Westfall J A. The effects of uncertainty in model predictions of individual tree volume on large area volume estimates[J]. Forest Science, 2014, 60: 34−43. doi: 10.5849/forsci.12-141
[14] Puliti S, Ene L T, Gobakken T, et al. Use of partial coverage UAV data in sampling for large scale forest inventories[J]. Remote Sensing of Environment, 2017, 194: 115−126. doi: 10.1016/j.rse.2017.03.019
[15] Puliti S, Saarela S, Gobakken T, et al. Combining UAV and Sentinel-2 auxiliary data for forest growing stock volume estimation through hierarchical model-based inference[J]. Remote Sensing of Environment, 2018, 204: 485−497. doi: 10.1016/j.rse.2017.10.007
[16] Condés S, McRoberts R E. Updating national forest inventory estimates of growing stock volume using hybrid inference[J]. Forest Ecology and Management, 2017, 400: 48−57. doi: 10.1016/j.foreco.2017.04.046
[17] Saarela S, Holm S, Healey S P, et al. Generalized hierarchical model-based estimation for aboveground biomass assessment using GEDI and landsat data[J]. Remote Sensing, 2018, 10: 1832. doi: 10.3390/rs10111832
[18] Saarela S, Wästlund A, Holmström E, et al. Mapping aboveground biomass and its prediction uncertainty using LiDAR and field data, accounting for tree-level allometric and LiDAR model errors[J]. Forest Ecosystems, 2020, 7(1): 1−17. doi: 10.1186/s40663-019-0212-0
[19] Richard W Guldin. A systematic review of small domain estimation research in forestry during the twenty-first century from outside the United States[J/OL]. Frontiers in Forests and Global Change, 2021, 4: 695929[2022−01−05]. https://doi.org/10.3389/ffgc.2021.695929.
[20] 肖兴威. 中国森林资源清查[M]. 北京: 中国林业出版社, 2005. Xiao X W. National forest inventory of China[M]. Beijing: China Forestry Publishing House, 2005.
[21] 曾伟生, 骆期邦, 彭长清. 两阶群团抽样在森林调查中的估计效率研究[J]. 林业科学研究, 1995, 8(5): 483−488. doi: 10.13275/j.cnki.lykxyj.1995.05.003 Zeng W S, Luo Q B, Peng C Q. Study on efficiency of two-stage cluster sampling in forest inventory[J]. Forest Research, 1995, 8(5): 483−488. doi: 10.13275/j.cnki.lykxyj.1995.05.003
[22] 李春干, 陈琦, 谭必增. 基于卫星遥感数据空中抽样的大尺度森林资源动态监测[J]. 林业资源管理, 2009, 2: 106−110,127. doi: 10.3969/j.issn.1002-6622.2009.02.020 Li C G, Chen Q, Tan B Z. Large-scale forest resources monitoring by means of spatial sampling of Hi-resolution remote sensing images[J]. Forest Resources Management, 2009, 2: 106−110,127. doi: 10.3969/j.issn.1002-6622.2009.02.020
[23] 郑冬梅, 智长贵, 黄国胜, 等. 遥感大样地点面判读方法在森林资源宏观监测中的应用分析[J]. 林业资源管理, 2017, 6(6): 137−142. Zheng D M, Zhi C G, Huang G S, et al. Analysis of forest resources monitoring by zoning interpretation and point interpretation of remote sensing large plot[J]. Forest Resources Management, 2017, 6(6): 137−142.
[24] 唐守正. 关于两相抽样面积蓄积统计的原则[J]. 林业资源管理, 1996, 4: 18−22. Tang S Z. The principles of two-phase sampling area accumulation statistics[J]. Forest Resources Management, 1996, 4: 18−22.
[25] 张宗秀, 高天雷, 张文. 双重二阶抽样提高森林资源抽样精度的研究[J]. 四川林业科技, 2013, 34(5): 8−12. Zhang Z X, Gao T L, Zhang W. Study on improving sampling accuracy of forest resources by double two-stage sampling[J]. Journal of Sichuan Forestry Science and Technology, 2013, 34(5): 8−12.
[26] 李增元, 赵磊, 李堃, 等. 合成孔径雷达森林资源监测技术研究综述[J]. 南京信息工程大学学报(自然科学版), 2020, 12(2): 150−158. Li Z Y, Zhao L, Li K, et al. A survey of developments on forest resources monitoring technology of synthetic aperture radar[J]. Journal of Nanjing University of Information Science and Technology (Natural Science Edition), 2020, 12(2): 150−158.
[27] 庞勇, 李增元, 陈博伟, 等. 星载激光雷达森林探测进展及趋势[J]. 上海航天, 2019, 36(3): 20−28. Pang Y, Li Z Y, Chen B W, et al. Status and development of spaceborne lidar applications in forestry[J]. Aerospace Shanghai, 2019, 36(3): 20−28.
[28] 黄华国. 林业定量遥感研究进展和展望[J]. 北京林业大学学报, 2019, 41(12): 1−14. Huang H G. Progress and perspective of quantitative remote sensing of forestry[J]. Journal of Beijing Forestry University, 2019, 41(12): 1−14.
[29] 张王菲, 陈尔学, 李增元, 等. 干涉、极化干涉SAR技术森林高度估测算法研究进展[J]. 遥感技术与应用, 2017, 32(6): 983−997. Zhang W F, Chen E X, Li Z Y, et al. Development of forest height estimation using InSAR/PolInSAR technology[J]. Remote Sensing Technology and Aplication, 2017, 32(6): 983−997.
[30] Zhao J P, Zhao L, Chen E X, et al. An improved generalized hierarchical estimation framework with geo statistics for mapping forest parameters and its uncertainty: a case study of forest canopy height[J/OL]. Remote Sensing, 2022, 14: 568[2022−10−22]. https://doi.org/10.3390/rs14030568.
[31] 宋新民. 抽样调查技术(第2版)[M]. 北京: 中国林业出版社, 2007. Song X M. Sampling survey techniques[M]. Beijing: China Forestry Publishing House, 2007.
[32] 赵凯峰. 双重回归估计法测算森林生长量的探讨[J]. 林业资源管理, 1996, 5: 48−52. Zhao K F. Study on estimating forest growth by double regression estimation method[J]. Forest Resources Management, 1996, 5: 48−52.
[33] 鲁赛尼·阿特马维扎扎, 劳可遒. 用航空照片双重抽样进行森林资源清查[J]. 中南林业调查规划, 1982, 1: 53−55, 43. Lusaini A, Lao K Q. Double sampling using aerial photo for forest resource inventory[J]. Central South Forest Inventory and Planning, 1982, 1: 53−55, 43.
[34] 张秋江, 袁亚东, 丛修宝. 用遥感及实测回归估计森林蓄积量[J]. 东北林业大学学报, 1997, 25(2): 18−23. Zhang Q J, Yuan Y D, Cong X B. The method for estimating forest volume by remote sensing and regression of practical measurement[J]. Journal of Northeast Forestry University, 1997, 25(2): 18−23.
[35] 陈振雄, 熊智平, 曾伟生, 等. 基于大样地双重抽样方法的广东省森林资源监测研究[J]. 中南林业调查规划, 2014, 33(3): 28−33. doi: 10.3969/j.issn.1003-6075.2014.03.009 Chen Z X, Xiong Z P, Zeng W S, et al. Forest resources monitoring based on double sampling with large plot in Guangdong[J]. Central South Forest Inventory and Planning, 2014, 33(3): 28−33. doi: 10.3969/j.issn.1003-6075.2014.03.009
[36] 陈中超, 刘清旺, 李春干, 等. 基于无人机激光雷达的人工林碳储量线性与非线性估测模型比较[J]. 北京林业大学学报, 2021, 43(12): 9−16. doi: 10.12171/j.1000-1522.20200417 Chen Z C, Liu Q W, Li C G, et al. Comparison in linear and nonlinear estimation models of carbon storage of plantations based on UAV LiDAR[J]. Journal of Beijing Forestry University, 2021, 43(12): 9−16. doi: 10.12171/j.1000-1522.20200417
[37] Donoghue D N M, Watt P J, Cox N J, et al. Remote sensing of species mixtures in conifer plantations using LiDAR height and intensity data[J]. Remote Sensing of Environment, 2007, 110(4): 509−522. doi: 10.1016/j.rse.2007.02.032
[38] McGaughey R J. FUSION/LDV: Software for LiDAR data analysis and visualization, January 2021-FUSION Version 4.20[Z/OL]. Washington D C: United Stated of Department of Agriculture, 2021. http://forsys.cfr.washington.edu/software/fusion/FUSION_manual.pdf.
[39] 曹林, 徐婷, 申鑫, 等. 集成Landsat OLI和机载LiDAR条带数据的亚热带森林生物量制图[J]. 遥感学报, 2016, 20(4): 665−678. doi: 10.11834/jrs.20165091 Cao L, Xu T, Shen X, et al. Mapping biomass by integrating Landsat OLI and airborne LiDAR transect data in subtropical forests[J]. Journal of Remote Sensing, 2016, 20(4): 665−678. doi: 10.11834/jrs.20165091
[40] 何诚. 森林精准计测关键技术研究[D]. 北京: 北京林业大学, 2013. He C. The key technology fore precision measurement in forest surveying[D]. Beijing: Beijing Forestry University, 2013.
[41] Davidson R, MacKinnon J G. Estimation and Inference in Econometrics[M]. New York: Oxford University Press, 1993.
[42] McConville K S, Moisen G G, Frescino T S. A tutorial on model-assisted estimation with application to forest inventory[J]. Forests, 2020, 11: 244. doi: 10.3390/f11020244
[43] Ståhl G, Heikkinen J, Petersson H, et al. Sample-based estimation of greenhouse gas emissions from forests-a new approach to account for both sampling and model errors[J]. Forest Science, 2014, 60: 3−13. doi: 10.5849/forsci.13-005
[44] Genuer R, Poggi J M, Tuleau-Malot C. VSURF: an R package for variable selection using random forests[J]. R Journal, 2015, 7(2): 19−33. doi: 10.32614/RJ-2015-018
[45] Næsset E, Ørka H O, Solberg S, et al. Mapping and estimating forest area and aboveground biomass in Miombo woodlands in Tanzania using data from airborne laser scanning, tandem-X, Rapideye, and global forest maps: a comparison of estimated precision[J]. Remote Sensing of Environment, 2016, 175: 282−300. doi: 10.1016/j.rse.2016.01.006
[46] Lu D, Chen Q, Wang G, et al. Aboveground forest biomass estimation with Landsat and LiDAR data and uncertainty analysis of the estimates[J]. International Journal of Forestry Research, 2012, 2012: 1−16.
[47] Chen L, Wang Y Q, Ren C Y, et al. Assessment of multiwavelength SAR and multispectral instrument data for forest aboveground biomass mapping using random forest kriging[J]. Forest Ecology and Management, 2019, 447: 12−25. doi: 10.1016/j.foreco.2019.05.057
[48] 赵峰, 李增元, 王韵晟, 等. 机载激光雷达(LiDAR)数据在森林资源调查中的应用综述[J]. 遥感信息, 2008, 1: 106−110, 53. doi: 10.3969/j.issn.1000-3177.2008.01.021 Zhao F, Li Z Y, Wang Y S, et al. The application of LiDAR data in forest[J]. Remote Sensing Information, 2008, 1: 106−110, 53. doi: 10.3969/j.issn.1000-3177.2008.01.021
[49] 韩婷婷. 激光雷达数据在森林垂直结构参数反演中的应用综述[J]. 北京测绘, 2020, 34(8): 1061−1065. Han T T. Summarization of the application of LiDAR data in forest vertical structure parameters inversion[J]. Beijing Surveying and Maping, 2020, 34(8): 1061−1065.
[50] 赵俊鹏, 赵磊, 陈尔学, 等. ZY3立体像对和机载LiDAR抽样数据协同估测森林平均高[J]. 林业科学, 2020, 57(9): 66−75. Zhao J P, Zhao L, Chen E X, et al. Synergy application of ZY3 stereo imaging pairs and airborne LiDAR sampling data for estimating mean height of forest[J]. Scientia Silvae Sinicae, 2020, 57(9): 66−75.
[51] 张煜星, 闫宏伟, 黄国胜, 等. 森林资源连续清查技术规程(GB/T 38590—2020)[S]. 北京: 中国标准出版社, 2020. Zhang Y X, Yan H W, Huang G S, et al. Technical regulations for continuous forest inventory(GB/T 38590−2020)[S]. Beijing: China Standard Press, 2020.
[52] Chen Q, Mcroberts R E, Wang C W, et al. Forest aboveground biomass mapping and estimation across multiple spatial scales using model-based inference[J]. Remote Sensing of Environment, 2016, 184: 350−360. doi: 10.1016/j.rse.2016.07.023


 下载:
下载:


