
Remote sensing estimation and change analysis of fractional vegetation coverage in Natural Forest Resource Protection Project area
-
摘要:目的 天然林资源保护工程(简称“天保工程”)实施20多年来有效保护和恢复了工程区的森林资源。工程实施成效除了森林覆盖面积增加,更多的表现为森林资源质量持续提升。为了更好地评估天保工程建设成效,利用植被覆盖度作为定量评价指标,分析天保一期(2000—2010年)、天保二期(2011—2020年)工程实施期间的森林质量变化。方法 综合年度植被指数合成策略、优化纯植被像元和纯裸土像元值域的动态确定方法,构建改进的像元二分模型,生产天保工程区时间序列的植被覆盖度产品。基于森林资源一类清查郁闭度数据、森林生态系统定位研究网络郁闭度数据、机载高光谱植被覆盖度数据,验证该植被覆盖度产品的精度。在此基础上,分析天保工程林区植被覆盖度的时空变化趋势。结果 天保一期植被覆盖度均值为0.68,天保二期植被覆盖度均值为0.71,增加了4.41%;工程区植被覆盖度呈现增加趋势的面积占林区总面积的78.22%,而呈减小趋势的面积仅占林区总面积的9.56%。结论 在中国天保工程森林地区,基于MODIS 植被指数产品和改进的像元二分模型生产的植被覆盖度产品的精度高于MODIS产品的精度。自天保工程实施以来,林区植被覆盖度总体上呈现出明显的增加趋势,说明天保工程实施效果显著,森林资源质量持续提升。Abstract:Objective The forest resources have been effectively protected and restored with the implement of Natural Forest Resource Protection Project (NFPP) in recent twenty years. In addition to a slight increase in forest coverage, effects of the project are mainly the continuous improvement of forest resource quality. To quantitatively assess the effects of NFPP, the fractional vegetation coverage (FVC) was used as the indicator to demonstrate the forest quality during the first stage (2000−2010) and second stage (2011−2020) of NFPP.Method A modified dimidiate pixel model was proposed based on the new vegetation index composition strategy and the dynamically determination method of the pure vegetation and soil pixels, and time series FVC was generated in the project area. FVC was then validated by forest resource inventory data, Chinese forest ecosystem research network data and airborne hyperspectral data. At last, the spatial and temporal variation of FVC was analyzed in NFPP area of China.Result FVC increased from 0.68 to 0.71 since the implement of the project. Area with increased FVC trend was about 78.22% of the total forest area, while area with decreased FVC trend only accounted for 9.56% of the total forest area.Conclusion Accuracy of the estimated FVC was higher than that of MODIS product. An obviously increasing trend of FVC could be found in the NFPP area, which indicates that the quality of forest is increasing since the implement of NFPP.
-
黄栌(Cotinus coggygria)属漆树科(Anacardia-ceae)黄栌属落叶灌木或小乔木,喜光,耐寒。原产于中国西南、华北和浙江,南欧、叙利亚、伊朗、巴基斯坦及印度北部也有分布[1]。树姿优美,秋冬时叶片颜色变红,是中国重要的观赏树种,同时叶片含有芳香油[2],可做调香原料。木材还是制作家具或用于雕刻的原料,也可从中提取黄色的工业染料。另外,黄栌的枝叶具有清湿热、镇痛疼、活血化瘀和降压等功效[3],有着重要的生态和经济价值。
光合作用的变化是植物对环境条件变化产生的适应性应答机制,可直接反映出植物能量吸收固定的能力[4-5],它为植物能量物质产生奠定基础,是决定植株生长状况的主要因素。合理的施肥用量不仅能使植物体内养分利用率最大化,还能有效增强光合能力,提高植物抗逆能力。已有研究表明,氮磷钾是植物生长和生理代谢的重要基础物质,合理施肥能提高植物叶片蛋白质合成以及碳水化合物转移,还能通过调节气孔开闭及酶活性影响光合作用[6]。熊靓等[7]研究表明,配方施肥能提高竹叶花椒(Zanthoxylum armatum)叶片净光合速率(Pn)和光能利用效率(LUE),且氮磷钾三因素配施条件下叶片Pn和 LUE日平均值均比氮磷、氮钾和磷钾两因素配施条件下的高,进一步表明氮磷钾配施能使植物叶片更均衡地吸收营养元素。另外,氮磷钾配施还能提高叶片叶绿素含量,延长绿叶功能期,而叶绿素含量能够通过影响植株叶片组织衰老进程和酶分解程度[8],引起叶片光合特性和光合产物累积量的变化,从而对植株的物质累积及生长发育产生影响。王虎兵等[9]研究表明,合理施肥对番茄(Lycopersicum esculentum)植株Pn、气孔导度(Gs)、蒸腾速率(Tr)影响显著,同时发现叶片氮磷钾含量与叶绿素含量和Pn呈显著正相关关系,最终改善植株对养分的吸收、累积和分配,更有利于后期产量的形成。因此,研究植物光合特性对不同施肥配比的响应特征,对于探讨氮磷钾配比对植物生长发育的影响及指导栽培管理具有重要意义。
关于黄栌叶片光合特性在干旱胁迫[10-11]、不同光环境[12]和不同温湿度[13] 等方面的响应已有报道,而土壤是植物生长的基础,土壤肥力质量直接影响植物光合能力,其中矿质元素氮磷钾是植物生长的三要素,而合理的氮磷钾肥比例和用量配施,能满足植物养分需求,保持较高的叶片生理活性,提高光合效能,达到维持植株长势强健的目的。目前关于土壤养分对黄栌叶片光合作用的影响了解很少。为此,本研究开展氮磷钾三因素三水平正交试验,采用盆栽法初步探讨不同氮磷钾肥配施方案对黄栌叶片光合作用的调控效应,以期为黄栌的养分管理提供理论依据。
1. 研究区概况与研究方法
1.1 研究区概况
研究地位于西南大学后山试验园(106°25′54″ E、29°47′56″ N),海拔227 m。属亚热带季风性湿润气候,雨量充沛,年平均气温18.2 ℃,8月最高气温44.3 ℃,1月最低气温−3.1 ℃。年均日照时数1 368 h,无霜期336 d,年均降水量1 345 mm,土壤类型为紫色土。土壤理化性质为有机质11.40 g/kg,pH值7.65,全氮0.10 g/kg,全磷0.93 g/kg,全钾4.19 g/kg,碱解氮76.55 mg/kg,有效磷16.67 mg/kg,速效钾84.79 mg/kg。
1.2 试验设计
本试验采用露天盆栽方式(栽培土壤选自试验园),2017年10月将3年生黄栌实生苗植于规格为30 cm × 40 cm(直径 × 高)的控根容器。2018年3月选择长势基本相同的黄栌,根据植物生长发育需肥规律按照单位面积进行折算,采用氮磷钾三因素三水平正交设计,以不施肥为空白对照,共10个处理,每个处理重复8次,具体施肥量见表1。采用穴施的方式,分别于2018年3、5和7月按总施肥量的37.5%、25%和37.5%比例施入。
表 1 黄栌施肥处理的试验方案Table 1. Test scheme of fertilization treatment for Cotinus coggygria处理
Treatment配施组合
Combined fertilizer
application全年施肥量/(g·株−1)
Annual fertilizer amount/(g·plant−1)N P2O5 K2O T1 N1P1K1 0 0 4 T2 N1P2K2 0 10 8 T3 N1P3K3 0 20 12 T4 N2P1K2 6 0 8 T5 N2P2K3 6 10 12 T6 N2P3K1 6 20 4 T7 N3P1K3 12 0 8 T8 N3P2K1 12 10 4 T9 N3P3K2 12 20 8 T10 N0P0K0 0 0 0 1.3 测定指标及方法
1.3.1 光合参数日变化测定
于2018年8月中旬,选择连续的晴朗无云天气,采用Li-6800便携式光合作用测量仪进行黄栌叶片光合日变化的测定。每个处理选择5株长势基本一致、生长健壮的黄栌,选取无病斑的3 ~ 5片成熟叶进行连续3 d的测定,并做好标记。测定Pn、Tr、Gs,同时记录光合有效辐射(PAR)、大气温度(Ta)、CO2浓度(Ca)和相对湿度(RH)等环境因子,测定时间为07:00—19:00,每2 h测定1次,每次测定记录6组数值。LUE采用叶片Pn与PAR的比值[14]。
1.3.2 光响应曲线测定
于2018年8月中旬,选择连续的晴朗无云天气,选取光合参数日变化标记的叶片,采用Li-6800便携式光合测量仪在09:00—11:00进行光响应曲线测定。光合仪的红蓝光源设定叶室中光合有效辐射强度分别为1 800、1 500、1 200、1 000、800、600、400、200、150、100、50、0 μmol/(m2·s),测定过程中,将叶室温度控制在25 ℃,相对湿度控制在60%,CO2浓度为400 μmol/mol。光响应曲线采用叶子飘[15]提出的非直角双曲线模型进行拟合并得到表观量子效率(AQY)、最大净光合速率(Pnmax)、光饱和点(LSP)、光补偿点(LCP)和暗呼吸速率(Rd)。
1.3.3 光合色素含量测定
光合参数测定完成后,立即摘下叶片带回实验室,采用V(丙酮)∶V(乙醇) = 2∶1的混合液浸提比色法测定叶绿素a(Chl a)、叶绿素b(Chl b)、总叶绿素(Chl s)和类胡萝卜素(Car)含量[16]。
1.3.4 叶面积的测定
使用YMJ-C型号智能叶面积测量系统(浙江托普云农科技股份有限公司)测定叶面积。
1.4 数据处理
采用Excel 2010 软件进行数据统计,SPSS 22.0 软件进行显著性差异分析(Duncan法进行多重比较),冗余分析(RDA)反映氮磷钾肥与黄栌叶片光合特性的关系。运用 Origin 2018 进行图表制作,Canoco 5.0 进行冗余分析。
2. 结果与分析
2.1 环境因子日变化
测定光合参数日变化时的环境因子日变化结果如图1所示。从07:00左右开始,Ta和PAR逐渐上升,在11:00左右达到最大值,分别是41.3 ℃和1 127.79 μmol/(m2·s),之后逐渐下降。Ca日变化幅度不明显,在11:00左右达最低值(385.69 μmol/mol)。RH从07:00—11:00逐渐下降,11:00—13:00基本稳定,13:00—15:00急速下降,在15:00左右达最低值(48.78%),之后维持在相对稳定水平。
2.2 氮磷钾配施对黄栌叶片光合色素和叶面积的影响
各处理Chl a、Chl b、Chl s和Car含量存在一定差异(见图2)。除T1、T2和T7外,其余处理的Chl s含量显著高于对照(P < 0.05),其中T5、T6和T8较高,分别是对照的1.67、1.67和1.84倍。T5、T6和T8的Car含量分别是对照的1.88、2.09和1.83倍。各处理叶面积大小如图3所示,T5和T7的叶面积显著高于T10(P < 0.05),分别是对照的2.10和2.29倍。
![]() 图 2 不同氮磷钾配施处理对黄栌光合色素含量的影响不同字母表示差异显著(P < 0.05)。下同。Different letters mean significant differences (P < 0.05). The same below.Figure 2. Effects of combined application of N, P and K on photosynthetic pigment content of C. coggygria
图 2 不同氮磷钾配施处理对黄栌光合色素含量的影响不同字母表示差异显著(P < 0.05)。下同。Different letters mean significant differences (P < 0.05). The same below.Figure 2. Effects of combined application of N, P and K on photosynthetic pigment content of C. coggygria![]() 图 3 不同氮磷钾配施处理对黄栌叶面积的影响Figure 3. Effects of combined application of N, P and K on leaf area of C. coggygria
图 3 不同氮磷钾配施处理对黄栌叶面积的影响Figure 3. Effects of combined application of N, P and K on leaf area of C. coggygria2.3 氮磷钾配施对黄栌叶片光合参数日变化的影响
2.3.1 氮磷钾配施对黄栌叶片Pn日变化的影响
不同氮磷钾配施下黄栌叶片Pn日变化的趋势大致相同。由图4可知,各处理均呈双峰型曲线,分别在09:00左右和13:00左右出现了峰值,两峰值的平均值分别为14.439和17.198 μmol/(m2·s);在11:00左右出现了光合午休现象,平均值为11.987 μmol/(m2·s)。除T2外,其余处理的Pn日平均值显著高于对照(P < 0.05)(表2),其中T5、T6和T9较高,分别比对照提高了28.44%、28.89%和31.45%。
![]() 图 4 不同氮磷钾配施处理对黄栌叶片光合参数日变化的影响Figure 4. Effects of combined application of N,P,K on diurnal variations of photosynthetic parameters in leaves of C. coggygria表 2 不同氮磷钾配施下黄栌叶片光合参数日平均值Table 2. Daily average values of photosynthetic parameters of C. coggygria under different combined applications of N, P and K
图 4 不同氮磷钾配施处理对黄栌叶片光合参数日变化的影响Figure 4. Effects of combined application of N,P,K on diurnal variations of photosynthetic parameters in leaves of C. coggygria表 2 不同氮磷钾配施下黄栌叶片光合参数日平均值Table 2. Daily average values of photosynthetic parameters of C. coggygria under different combined applications of N, P and K处理 Treatment Pn/(μmol·m−2·s−1) Tr/(mmol·m−2·s−1) Gs/(mol·m−2·s−1) LUE/% T1 7.654 ± 0.202b 2.776 ± 0.169c 0.114 ± 0.010d 2.314 ± 0.161c T2 6.949 ± 0.202c 3.132 ± 0.091b 0.134 ± 0.007cd 3.048 ± 0.079a T3 7.794 ± 0.150b 3.092 ± 0.833b 0.121 ± 0.014d 2.385 ± 0.040c T4 7.602 ± 0.225b 3.290 ± 0.147b 0.143 ± 0.007bc 2.688 ± 0.072b T5 8.802 ± 0.225a 3.497 ± 0.148a 0.151 ± 0.012b 2.735 ± 0.131b T6 8.833 ± 0.196a 3.606 ± 0.125a 0.129 ± 0.004d 2.323 ± 0.161c T7 7.476 ± 0.151b 3.069 ± 0.109b 0.141 ± 0.009c 3.177 ± 0.047a T8 7.943 ± 0.186b 3.385 ± 0.833b 0.147 ± 0.010b 2.597 ± 0.115b T9 9.008 ± 0.177a 3.644 ± 0.103a 0.158 ± 0.005a 3.218 ± 0.072a T10 6.853 ± 0.614c 3.319 ± 0.183b 0.148 ± 0.008b 2.002 ± 0.160d 2.3.2 氮磷钾配施对黄栌叶片Tr日变化的影响
不同氮磷钾配施下黄栌叶片Tr日变化的趋势大致相同(图4),呈现出单峰型曲线变化,从07:00—11:00随时间延长逐渐上升,在11:00左右达峰值(平均值为7.006 mmol/(m2·s))后,11:00—19:00随时间延长逐渐下降。T5、T6和T9的Tr日平均值显著高于对照(P < 0.05)(表2),分别提高了5.36%、8.65%和9.79%;T1显著低于对照(P < 0.05),降低了16.36%。
2.3.3 氮磷钾配施对黄栌叶片Gs日变化的影响
Gs的日变化曲线与Pn相似(图4)。各处理均呈双峰型曲线,分别在09:00左右和13:00左右出现了峰值,两峰值的总平均值分别为0.237和0.251 mol/(m2·s)。在11:00左右出现了谷值(平均值为0.209 mol/(m2·s))。T9的Gs日平均值最高,显著高于对照(P < 0.05)(表2),提高了4.05%;T1、T2、T3、T6和T7显著低于对照(P < 0.05),分别降低了22.97%、9.46%、18.24%、12.84%和4.73%。
2.3.4 氮磷钾配施对黄栌叶片LUE日变化的影响
不同氮磷钾配施下黄栌叶片LUE日变化的变化趋势大致相同(图4)。07:00—11:00左右呈逐渐下降趋势,在11:00左右降至谷值(平均值为1.071%),除T3、T4和T7外,其余处理在11:00—13:00的LUE值逐渐上升,之后至15:00左右略微下降,15:00—17:00又小幅提升,而T3、T4和T7在11:00—17:00随时间延长LUE值逐渐上升,在17:00—19:00,所有处理的LUE值变化缓慢,与17:00左右相比几乎持平;所有施肥处理均显著高于对照(P < 0.05)(表2),其中T2、T7和T9的LUE日平均值较高;分别提高了52.25%、58.69%和60.74%。
2.4 氮磷钾配施对黄栌叶片光合−光响应的影响
本研究采用叶子飘[15]推荐的方法绘制光响应曲线(图5),随着光照强度(PAR)的增加Pn也随之升高。尤其在PAR < 200 μmol/(m2·s)时,各配施处理的黄栌叶片Pn随PAR呈近似直线增加趋势,达到600 μmol/(m2·s)后,Pn升高幅度明显减小,逐渐趋于平缓,符合植物对PAR变化的相应规律。由表3可知,除T2和T4 外,其余处理的AQY显著低于对照(P < 0.05);除T1、T2和T7外,其余处理的Pnmax与对照差异显著(P < 0.05);T3、T8和T9的LSP显著高于对照(P < 0.05),除T1外,其余处理的LCP与对照差异显著(P < 0.05);T2、T5和T9的Rd显著高于对照(P < 0.05),T1显著低于对照(P < 0.05)。
![]() 图 5 不同氮磷钾配施处理下的黄栌叶片的光合-光响应曲线Figure 5. Photosynthesis-light response curves of C. coggygria leaves under different combined applications of N,P and K表 3 不同氮磷钾配施下黄栌叶片光合-光响应参数Table 3. Phtosynthesis-light response parameters of C. coggygria leaves under different combined applications of N, P and K
图 5 不同氮磷钾配施处理下的黄栌叶片的光合-光响应曲线Figure 5. Photosynthesis-light response curves of C. coggygria leaves under different combined applications of N,P and K表 3 不同氮磷钾配施下黄栌叶片光合-光响应参数Table 3. Phtosynthesis-light response parameters of C. coggygria leaves under different combined applications of N, P and K处理 Treatment AQY/(μmol·m−2·s−1) Pnmax/(μmol·m−2·s−1) LSP/(μmol·m−2·s−1) LCP/(μmol·m−2·s−1) Rd/(μmol·m−2·s−1) T1 0.047 ± 0.003d 6.515 ± 0.251d 1 110.258 ± 60.836c 14.325 ± 0.800d 0.634 ± 0.191d T2 0.069 ± 0.003ab 6.705 ± 0.212d 1 166.762 ± 28.746c 28.196 ± 2.212b 1.643 ± 0.211ab T3 0.063 ± 0.003bc 7.604 ± 0.407c 1 208.546 ± 73.310b 26.258 ± 1.986b 1.514 ± 0.171bc T4 0.069 ± 0.003ab 7.624 ± 0.202c 1 038.744 ± 44.339d 20.807 ± 1.600b 1.262 ± 0.191c T5 0.062 ± 0.003bc 9.285 ± 0.295b 1 045.167 ± 19.850d 27.366 ± 1.975b 1.523 ± 0.206b T6 0.059 ± 0.003c 10.846 ± 0.113a 1 142.211 ± 41.416c 28.954 ± 2.165b 1.507 ± 0.207bc T7 0.067 ± 0.003b 6.866 ± 0.215d 1 028.514 ± 19.836d 21.514 ± 1.643c 1.257 ± 0.203c T8 0.050 ± 0.003d 8.018 ± 0.216c 1 232.757 ± 60.396b 25.881 ± 0.851b 1.179 ± 0.149c T9 0.065 ± 0.003bc 11.206 ± 0.277a 1 596.117 ± 22.237a 33.284 ± 2.582a 1.817 ± 0.160a T10 0.074 ± 0.003a 6.412 ± 0.197d 1 072.515 ± 11.667cd 15.419 ± 0.949d 1.010 ± 0.085c 2.5 氮磷钾与光合特征参数的冗余分析
由表4可知,前两个排序轴解释了2组变量特征的71.84%,它们的累计解释量达96.33%,说明排序结果可信,能较好地解释2组变量的关系。由图6可知,氮磷钾对黄栌叶片光合特征参数具有重要影响,其中肥料贡献率大小依次为磷肥 > 氮肥 > 钾肥,其中磷对光合色素(Chl s和Car)的影响大,同时与Pn、Pnmax和LSP正相关程度大。氮钾对LUE的影响大,同时LUE与LCP、Tr和Gs正相关程度大。
表 4 氮磷钾与黄栌光合特征参数的RDA分析Table 4. RDA analysis of photosynthetic characteristic parameters of C. coggygria with N, P and K统计
Statistic特征值
Eigenvalue累计解释变量
Cumulative explaviation
variable/%解释拟合累积变量
Explaining the fitting
cumulative variable/%轴1 Axis 1 0.571 2 57.12 71.60 轴2 Axis 2 0.147 1 71.84 90.05 轴3 Axis 3 0.079 4 79.78 100.00 轴4 Axis 4 0.165 6 96.33 ![]() 图 6 氮磷钾与黄栌叶片光合特性参数的 RDA 排序图Figure 6. RDA diagram of photosynthetic parameters of C. coggygria with N, P and K
图 6 氮磷钾与黄栌叶片光合特性参数的 RDA 排序图Figure 6. RDA diagram of photosynthetic parameters of C. coggygria with N, P and K2.6 氮磷钾对黄栌叶片光合日变化的综合分析
利用隶属函数分析法,对不同氮磷钾下黄栌叶片光合日变化进行综合分析。由表5可知,综合值排序最高的3个处理依次是T9(N3P3K2)、T7(N3P1K3)和T8(N3P2K1),其中T9的 Pn、Tr、Gs和LUE隶属度均显著高于对照(P < 0.05),分别是对照的1.79、2.02、3.10和2.49倍。
表 5 氮磷钾配施下黄栌光合日变化的模糊综合质量评价与排序Table 5. Evaluation and sequencing of diurnal variations of photosynthesis of C. coggygria to combined fertilization of N, P and K处理 Treatment Pn Tr Gs LUE 综合值 Comprehensive value 排序 Sort T1 0.46 ± 0.05b 0.60 ± 0.07cde 0.68 ± 0.07abc 0.60 ± 0.03b 2.34 5 T2 0.20 ± 0.12c 0.62 ± 0.09cd 0.77 ± 0.08ab 0.12 ± 0.06d 1.71 8 T3 0.23 ± 0.04c 0.46 ± 0.04de 0.52 ± 0.07bcd 0.85 ± 0.03a 2.06 7 T4 0.89 ± 0.04a 0.41 ± 0.05de 0.43 ± 0.04cde 0.35 ± 0.06c 2.08 6 T5 0.58 ± 0.04b 0.68 ± 0.04bc 0.75 ± 0.09ab 0.54 ± 0.05b 2.55 4 T6 0.87 ± 0.04a 0.16 ± 0.08e 0.18 ± 0.10e 0.34 ± 0.06c 1.55 10 T7 0.42 ± 0.03b 0.90 ± 0.05a 0.65 ± 0.09abc 0.94 ± 0.02a 2.91 2 T8 0.48 ± 0.04b 0.78 ± 0.07abc 0.81 ± 0.12ab 0.63 ± 0.05b 2.7 3 T9 0.95 ± 0.04a 0.87 ± 0.06ab 0.93 ± 0.05a 0.97 ± 0.03a 3.72 1 T10 0.53 ± 0.03b 0.43 ± 0.04de 0.30 ± 0.14de 0.39 ± 0.02c 1.65 9 3. 讨 论
本研究发现不同氮磷钾配施下的黄栌叶片Pn和Gs均呈双峰型曲线,分别在09:00左右和13:00左右出现了峰值,在11:00左右出现了午休现象(图4),说明黄栌叶片光合因子日变化趋势的主导因子是基因型,而土壤中的氮磷钾营养因子对其无明显影响。一般认为,植物叶片Pn日变化出现午休现象的原因与气孔导度降低和叶片光合作用能力有关,前者是因为Gs下降或关闭阻碍了CO2的供应,后者是因为叶片中光合色素含量少致使Pn降低[17],本研究中Gs在11:00左右降低,阻止了大气中CO2的供应。环境因子中的PAR和Ta在11:00左右达最大值(图1),可能是强光和高温的共同作用使光合关键酶−Rubisco酶活性受抑制,导致光合速率减小[18]。本研究还发现Tr呈单峰型曲线,在11:00左右达到峰值(图4),而Pn和Gs却在 11:00左右出现峰值,表明其Pn日变化除受气孔限制外,更主要的是受非气孔限制[19]。气孔蒸腾是主要的水分散失形式,调节着植物体内的水分平衡,可能是在外界环境Ta过高、PAR强度过大时,叶片通过增大蒸腾速率降低叶片温度,刺激了气孔,为避免过量失水Gs降低,此时可能以角质层蒸腾的方式进行蒸腾作用,使光合速率明显下降[19-20]。
叶绿素和类胡萝卜素可以捕获光能并将能量传递到光反应中心产生化学能[21],通过合理配施氮磷钾肥对增加黄栌叶片光合色素含量、提高叶片Pn具有重要作用。氮是叶绿素的主要成分,施氮可直接影响植物体内叶绿素和光合酶类的合成与活性,通过合成叶绿素和增加酶数量提高植物Pn[22];磷和钾能促进植物叶绿素合成,影响植物体内多种光合酶活性,并参与电子传递和植物能量代谢,在ATP反应中起关键作用,影响着光合产物的合成、运输及转化[23]。邱佳妹等[24]的研究发现,氮肥和钾肥是影响麦冬(Ophiopogon japonicas)幼苗叶片光合色素含量的主要因素,磷肥对麦冬幼苗叶片的光合色素含量无显著影响,与本研究结果不一致。本研究发现,氮磷钾肥对黄栌叶片中叶绿素和类胡萝卜素含量的贡献率表现为磷肥 > 氮肥 > 钾肥(图6),其中,T5(N2P2K3)、T6(N2P3K1)和T8(N3P1K1)显著提高了黄栌叶片叶绿素和类胡萝卜素含量(图2),进而使黄栌叶片光合能力显著提高(如表2中Pn和表3中Pnmax明显高于其他处理)。这是由于土壤养分条件和研究对象对养分的吸收、转化和利用能力不同造成的,邱佳妹等[24]的研究栽培基质为蛭石和珍珠岩,主要营养物质是磷、钙和钾,麦冬为多年生草本植物,其幼苗在开始生长时对氮肥的需求量大,秋冬时需施磷肥,而蛭石中的磷素能为其生长提供必要养分,造成后期施用磷肥对光合色素含量的影响不显著。而本研究中黄栌为落叶灌木,对土壤的养分需求量大于草本植物,本研究盆栽土壤中有效磷含量较低(16.67 mg/kg),所以施加磷肥产生的效应会较大。另外,T3(N1P3K3)中磷施加量为最高水平(20 g/株),而光合能力却提高不明显,可能是因为在氮磷钾肥配施情况下,在氮肥处于低水平时,阻碍了黄栌植株体内叶绿素的合成,减弱了叶片的光合能力[25]。
氮磷钾配施对叶片光合特征参数也具有显著影响。罗凡等[26]研究发现单施磷肥可显著提高春季茶树新梢叶片Tr,氮磷钾配施可显著增加叶片Tr和Gs。杨腾等[27]研究发现,氮肥能显著提高文冠果(Xanthoceras sorbifolia)幼苗的Pnmax、AQY和LSP,进而增强光能转化效率和利用范围,促进幼苗生长。本研究发现磷对Pn、Pnmax和LSP影响大,可能是磷肥提高了黄栌叶片中Rubisco酶活性,让其在高光照条件下仍能继续光合作用,促使光饱和点升高,光反应时间更长,积累更多光合产物[28]。氮钾对LUE的影响大,一方面是氮和钾配施量大的处理T5(N2P2K3)和T7(N3P1K3)(见图3)叶面积显著高于对照,说明氮肥和钾肥能增加叶面积,接收更多太阳能供植物利用[29]。另一方面,钾不仅促进植株对氮元素的吸收和转运,还提高植物叶片对光能的利用能力[30]。此外,LUE与LCP、Tr和Gs正相关程度大,是因为植物通过调节叶片气孔导度提高叶肉细胞的光合活性,而LCP反映了植物对弱光的利用能力,LCP越低,说明黄栌对07:00和19:00时的弱光利用能力越强[31]。因此,通过合理施肥来调节植物养分供应状况也是促进黄栌叶片Pn、Pnmax、LSP和LUE的关键。
4. 结 论
本试验范围内,氮磷钾配施能有效促进黄栌叶片光合色素合成,进而显著促进黄栌的光合能力。其中,肥料贡献率表现为磷肥 > 氮肥 > 钾肥,T9的光合日变化参数值(Pn、Tr、Gs和LUE)和光响应参数值(Pnmax、LSP、LCP和Rd)较高。综合分析结果表明T9(氮肥施用量12 g/株,磷肥施用量20 g/株,钾肥施用量8 g/株)是本试验最优处理,进一步说明磷肥对提高黄栌叶片光合色素含量起重要作用,进而显著提高其光合能力,该结论可为黄栌的栽培管理提供科学参考。
-
![]()
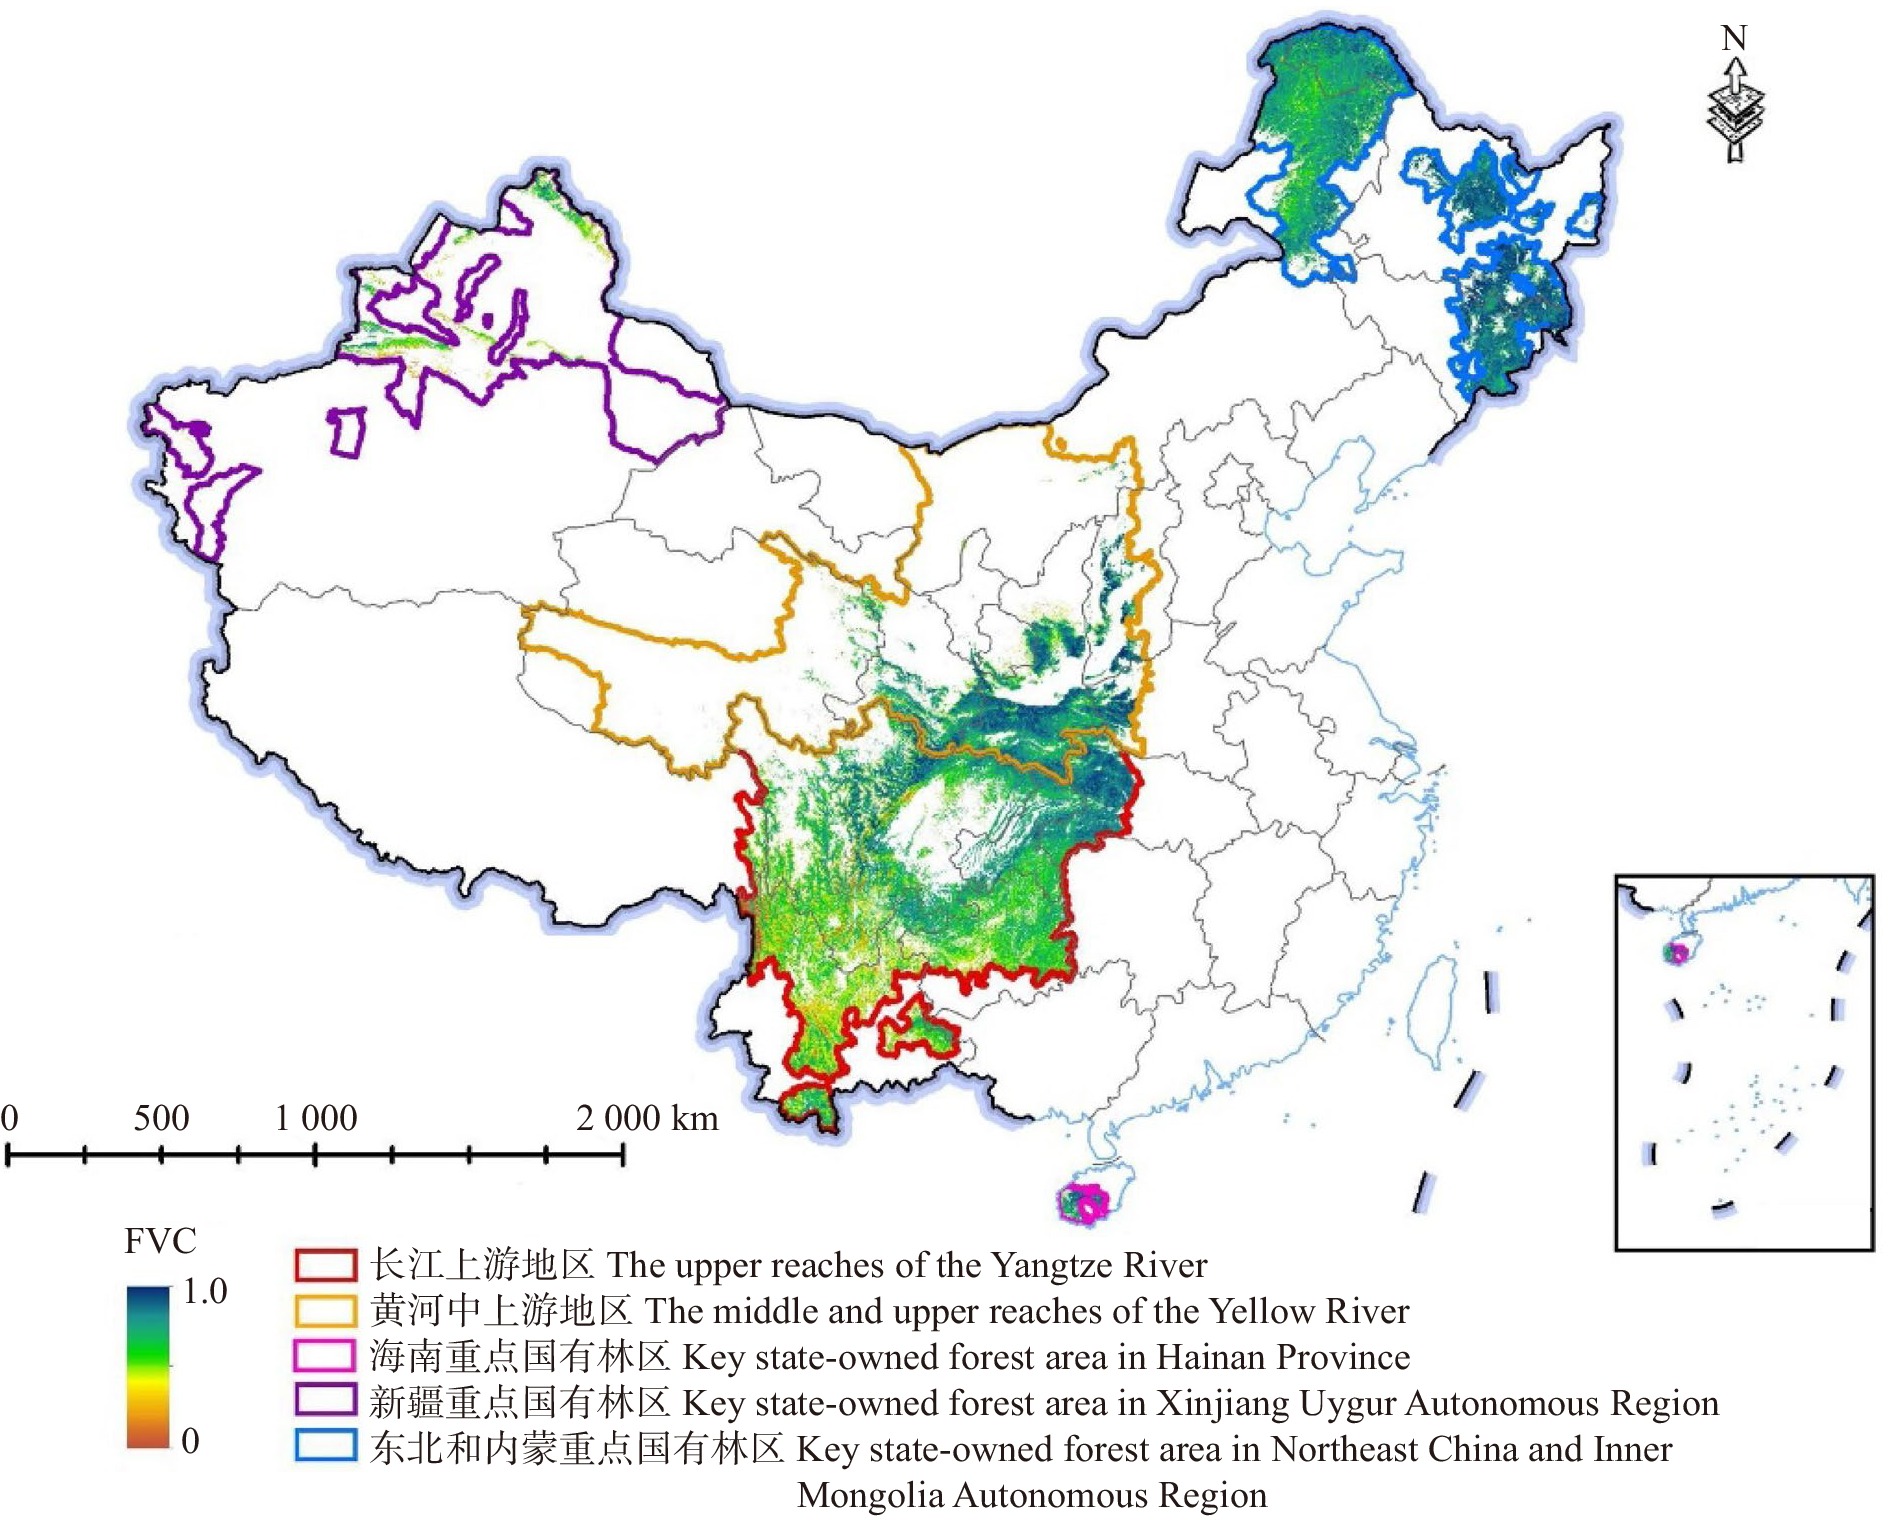
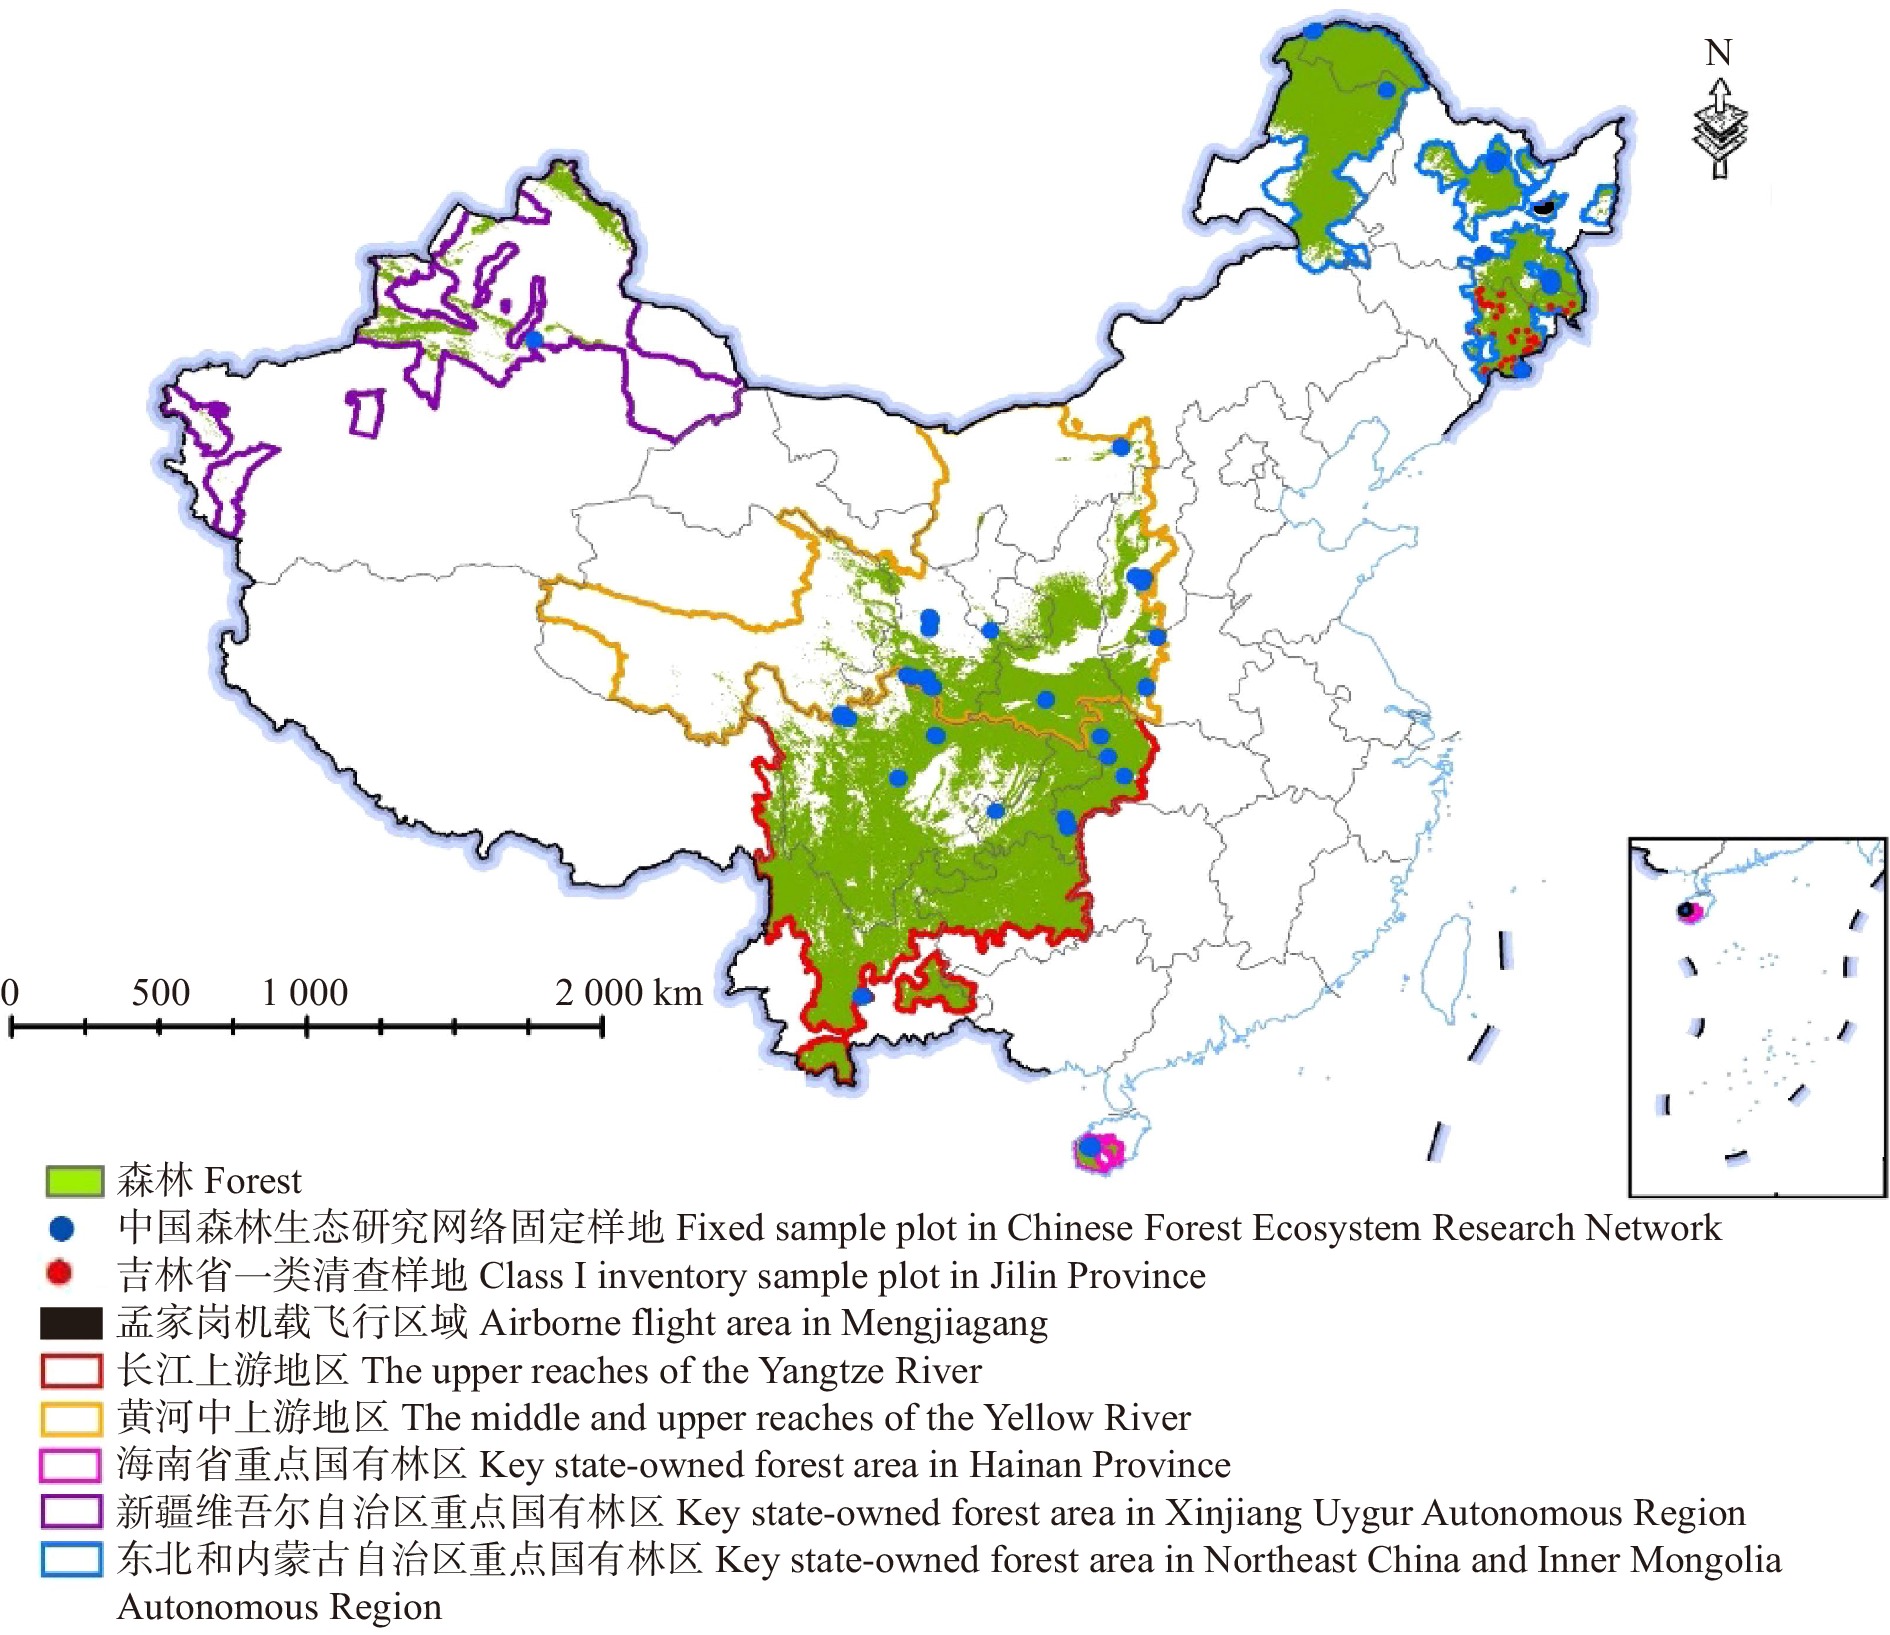
图 1 天保工程(NFPP)区森林分布图及验证样点
底图审图号:GS(2019)1823。下同。 Drawing review No. of base map: GS(2019)1823. Same as below.
Figure 1. Forest distribution map and verification sample points in the Natural Forest Resource Protection Project (NFPP) area
![]()
图 2 孟家岗林场机载高光谱植被覆盖度(FVC)
Figure 2. Fractional vegetation coverage (FVC) in Mengjiagang Forest Farm from airborne hyperspectral image
![]()
图 3 2000—2020年天保工程区FVC估算值
Figure 3. Estimated FVC values in the NFPP area from 2000 to 2020
![]()
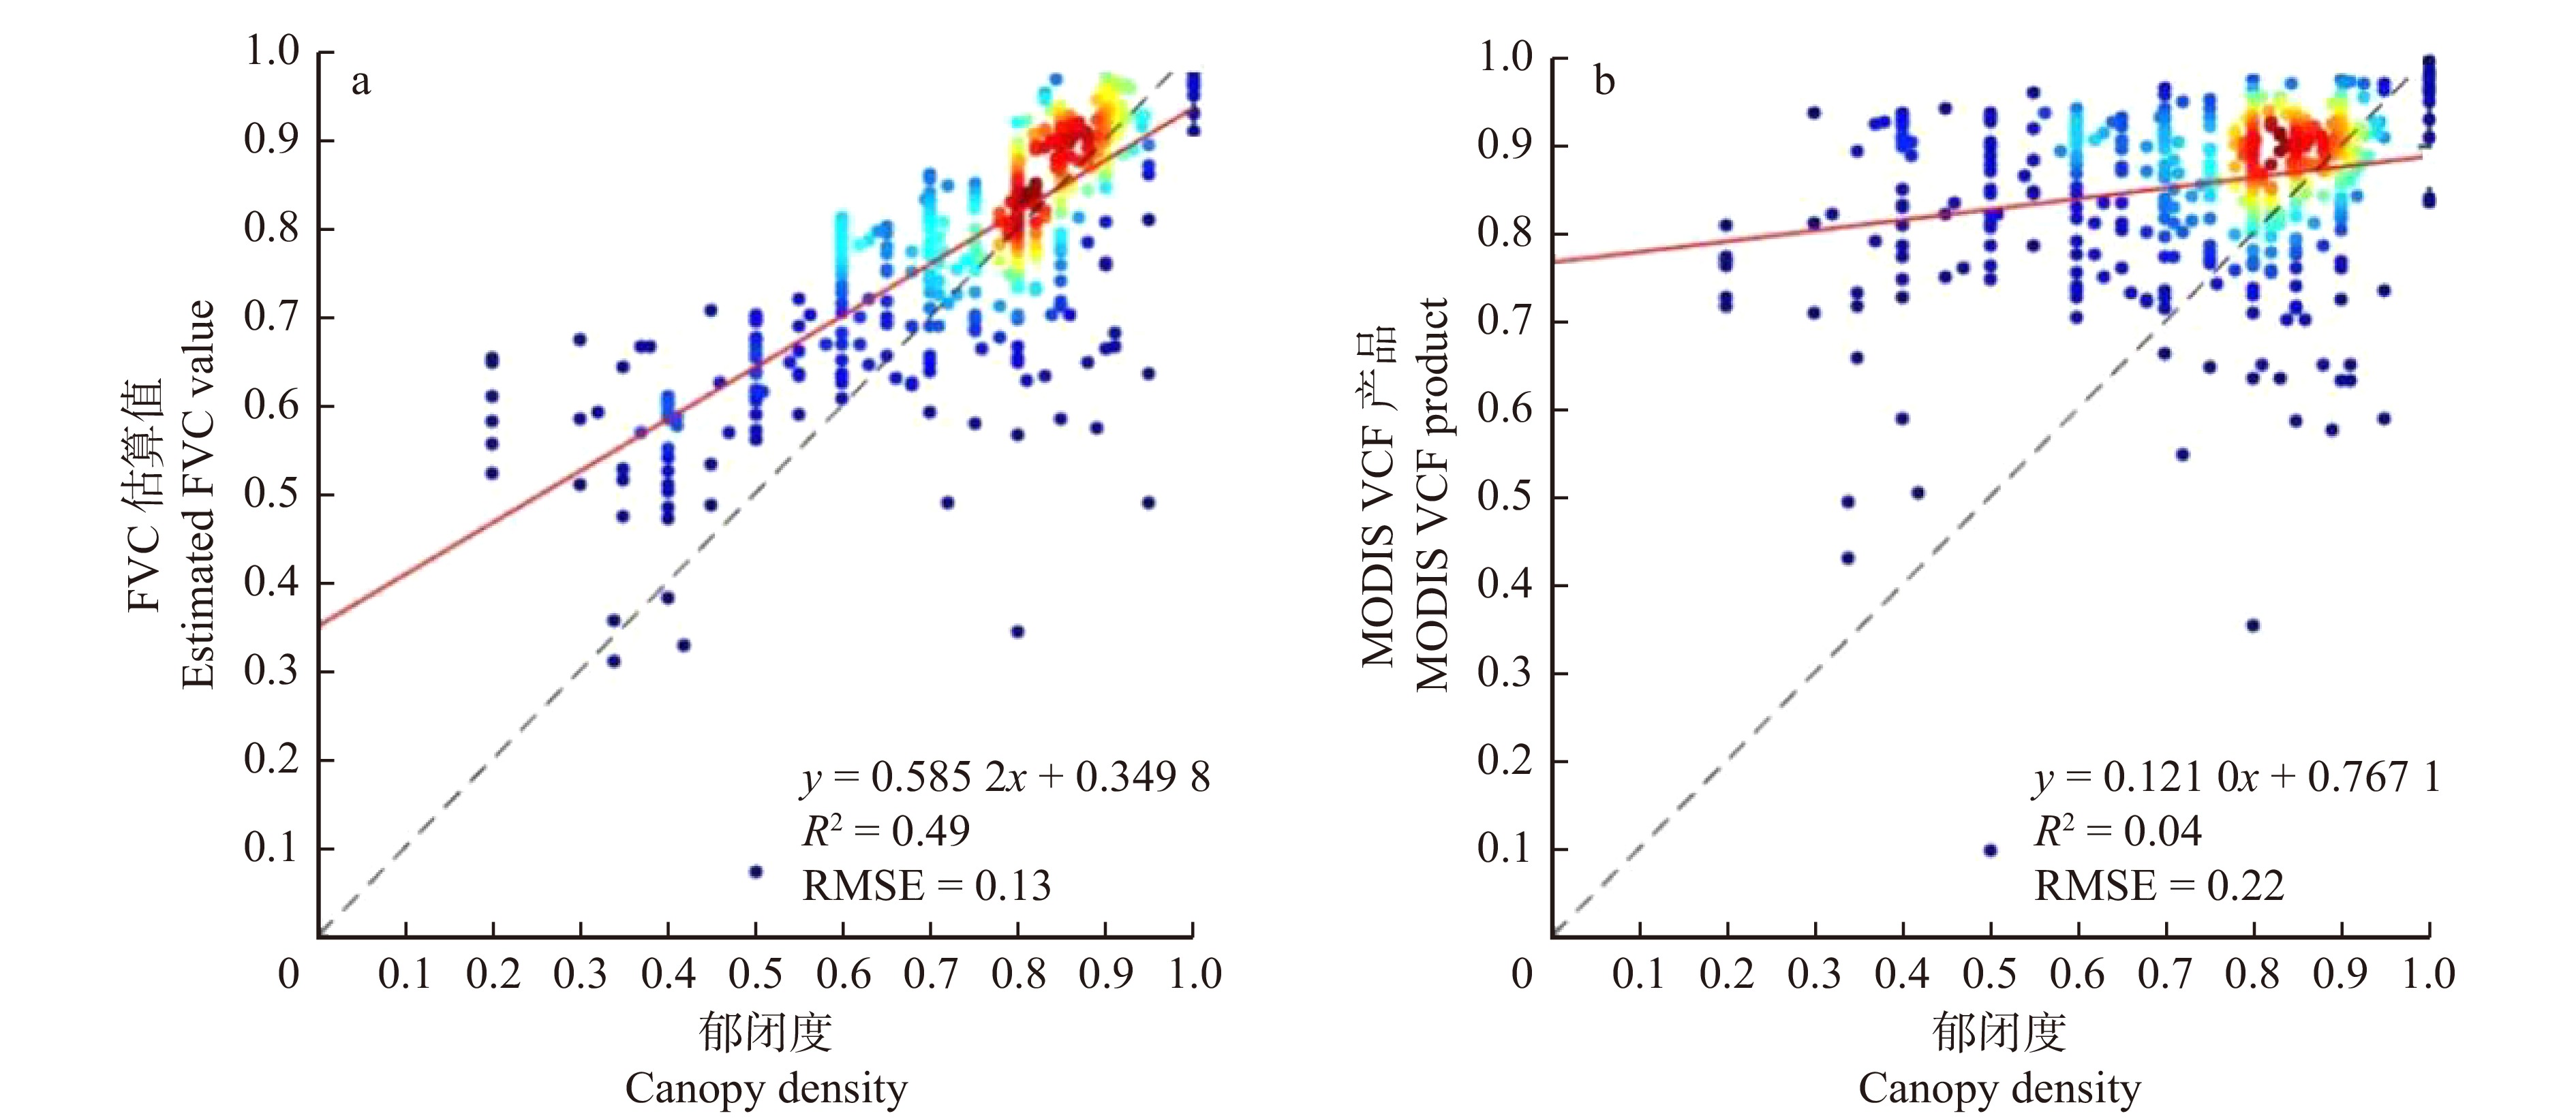
图 4 基于森林资源清查数据验证FVC估算值、MODIS连续植被覆盖产品精度
Figure 4. Verifying the estimated FVC values and the accuracy of MODIS continuous vegetation coverage products based on forest resource inventory data
![]()
图 5 基于森林生态站数据验证估算FVC、MODIS VCF产品精度
Figure 5. Verifying the estimated FVC values and the accuracy of MODIS VCF products based on Chinese Forest Ecosystem Research Network data
![]()
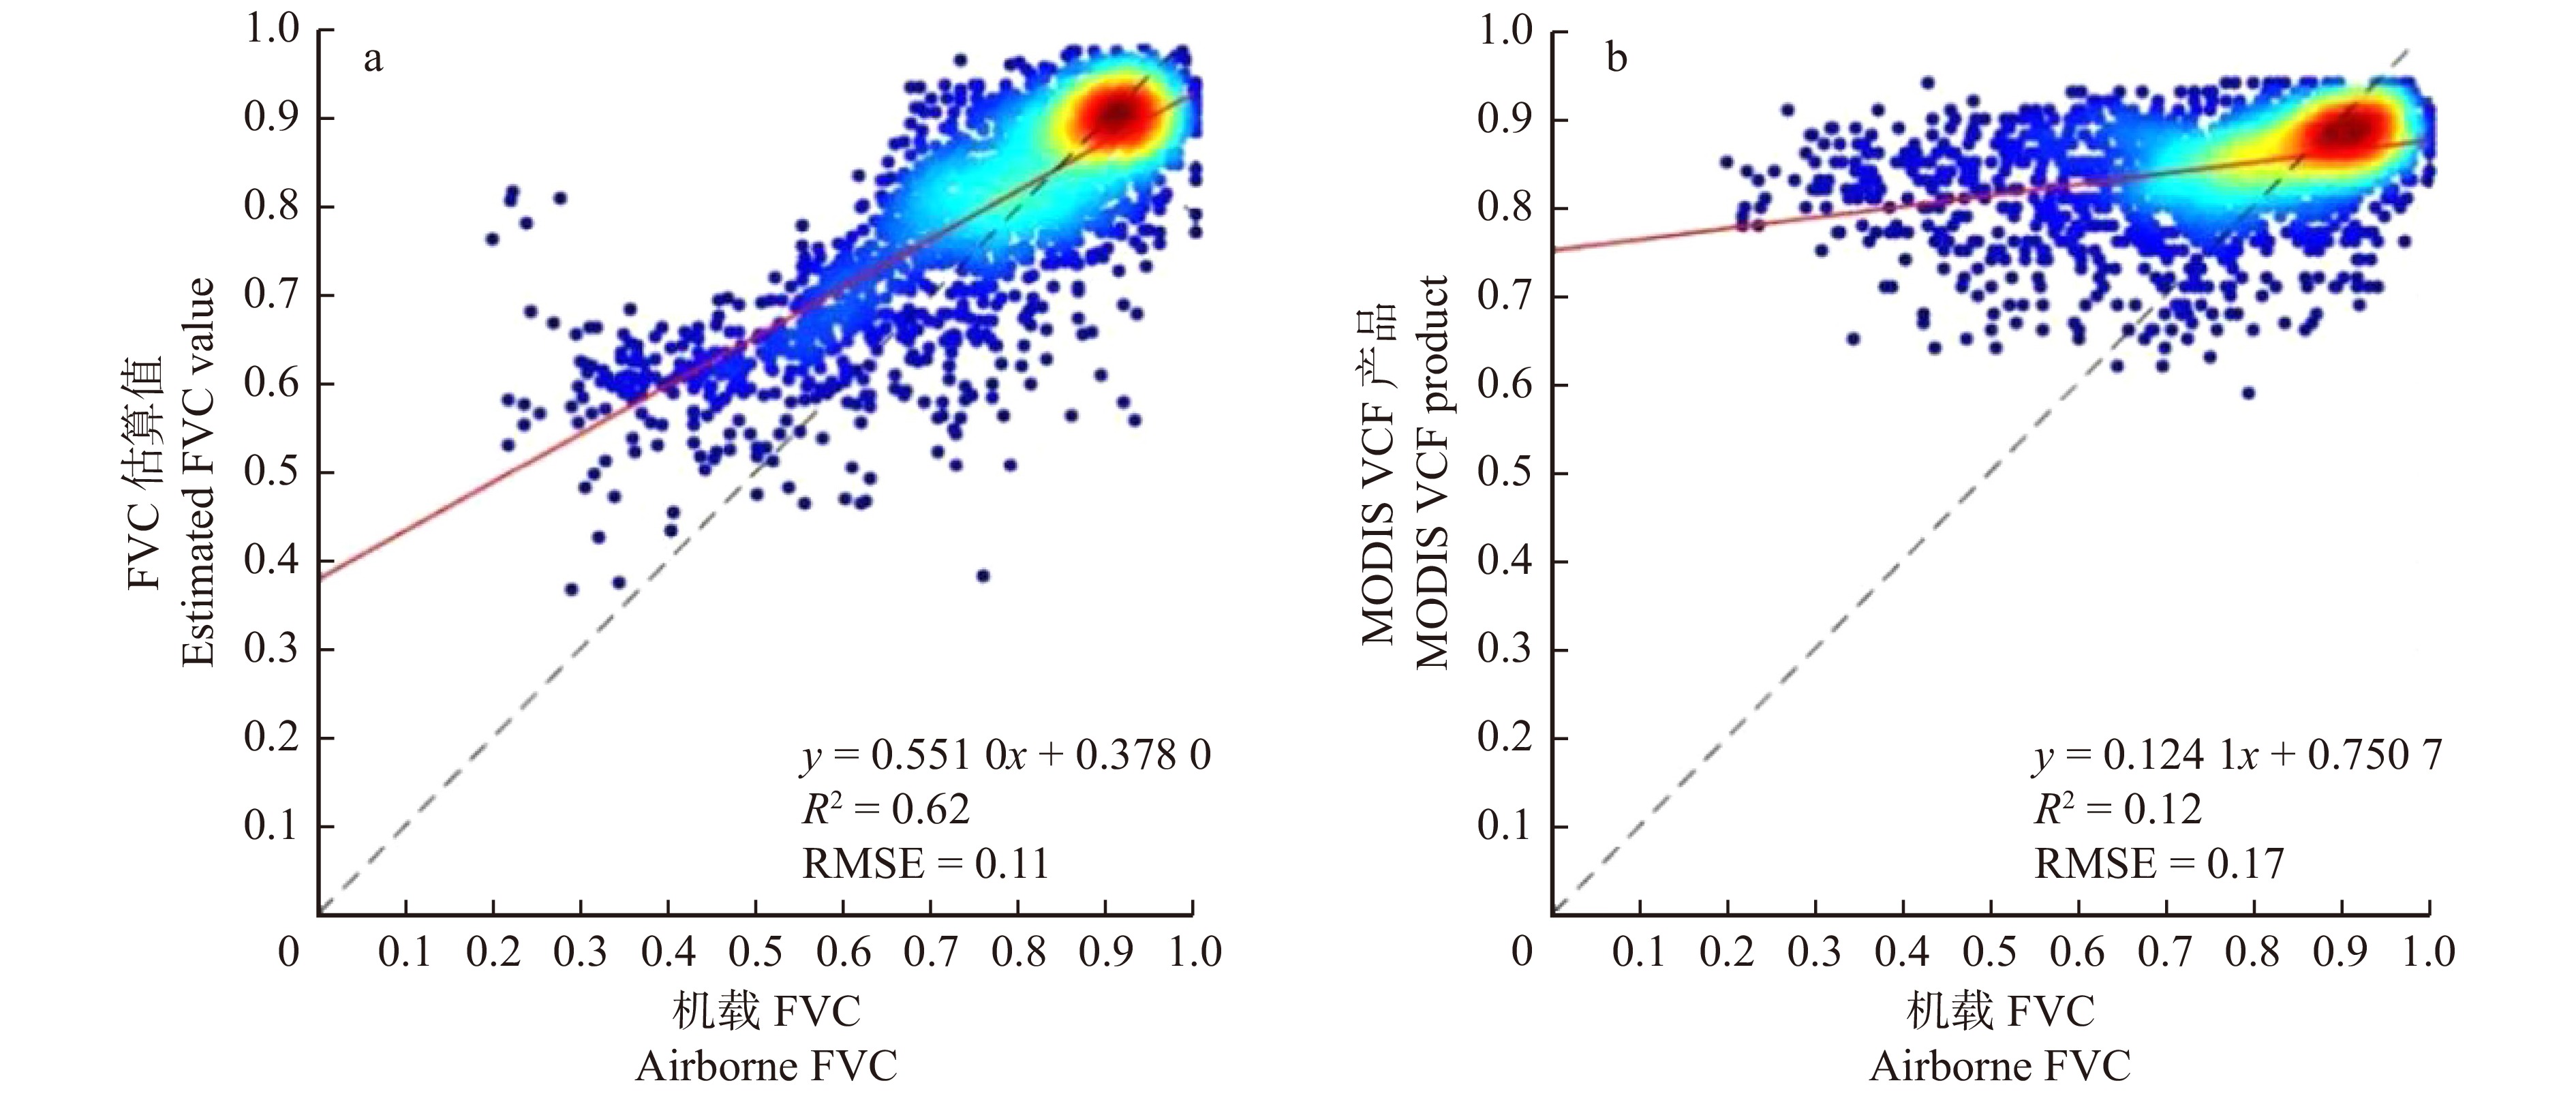
图 6 基于机载FVC数据验证估算FVC、MODIS VCF精度
Figure 6. Verifying the estimated FVC values and the accuracy of MODIS VCF products based on airborne FVC data
![]()
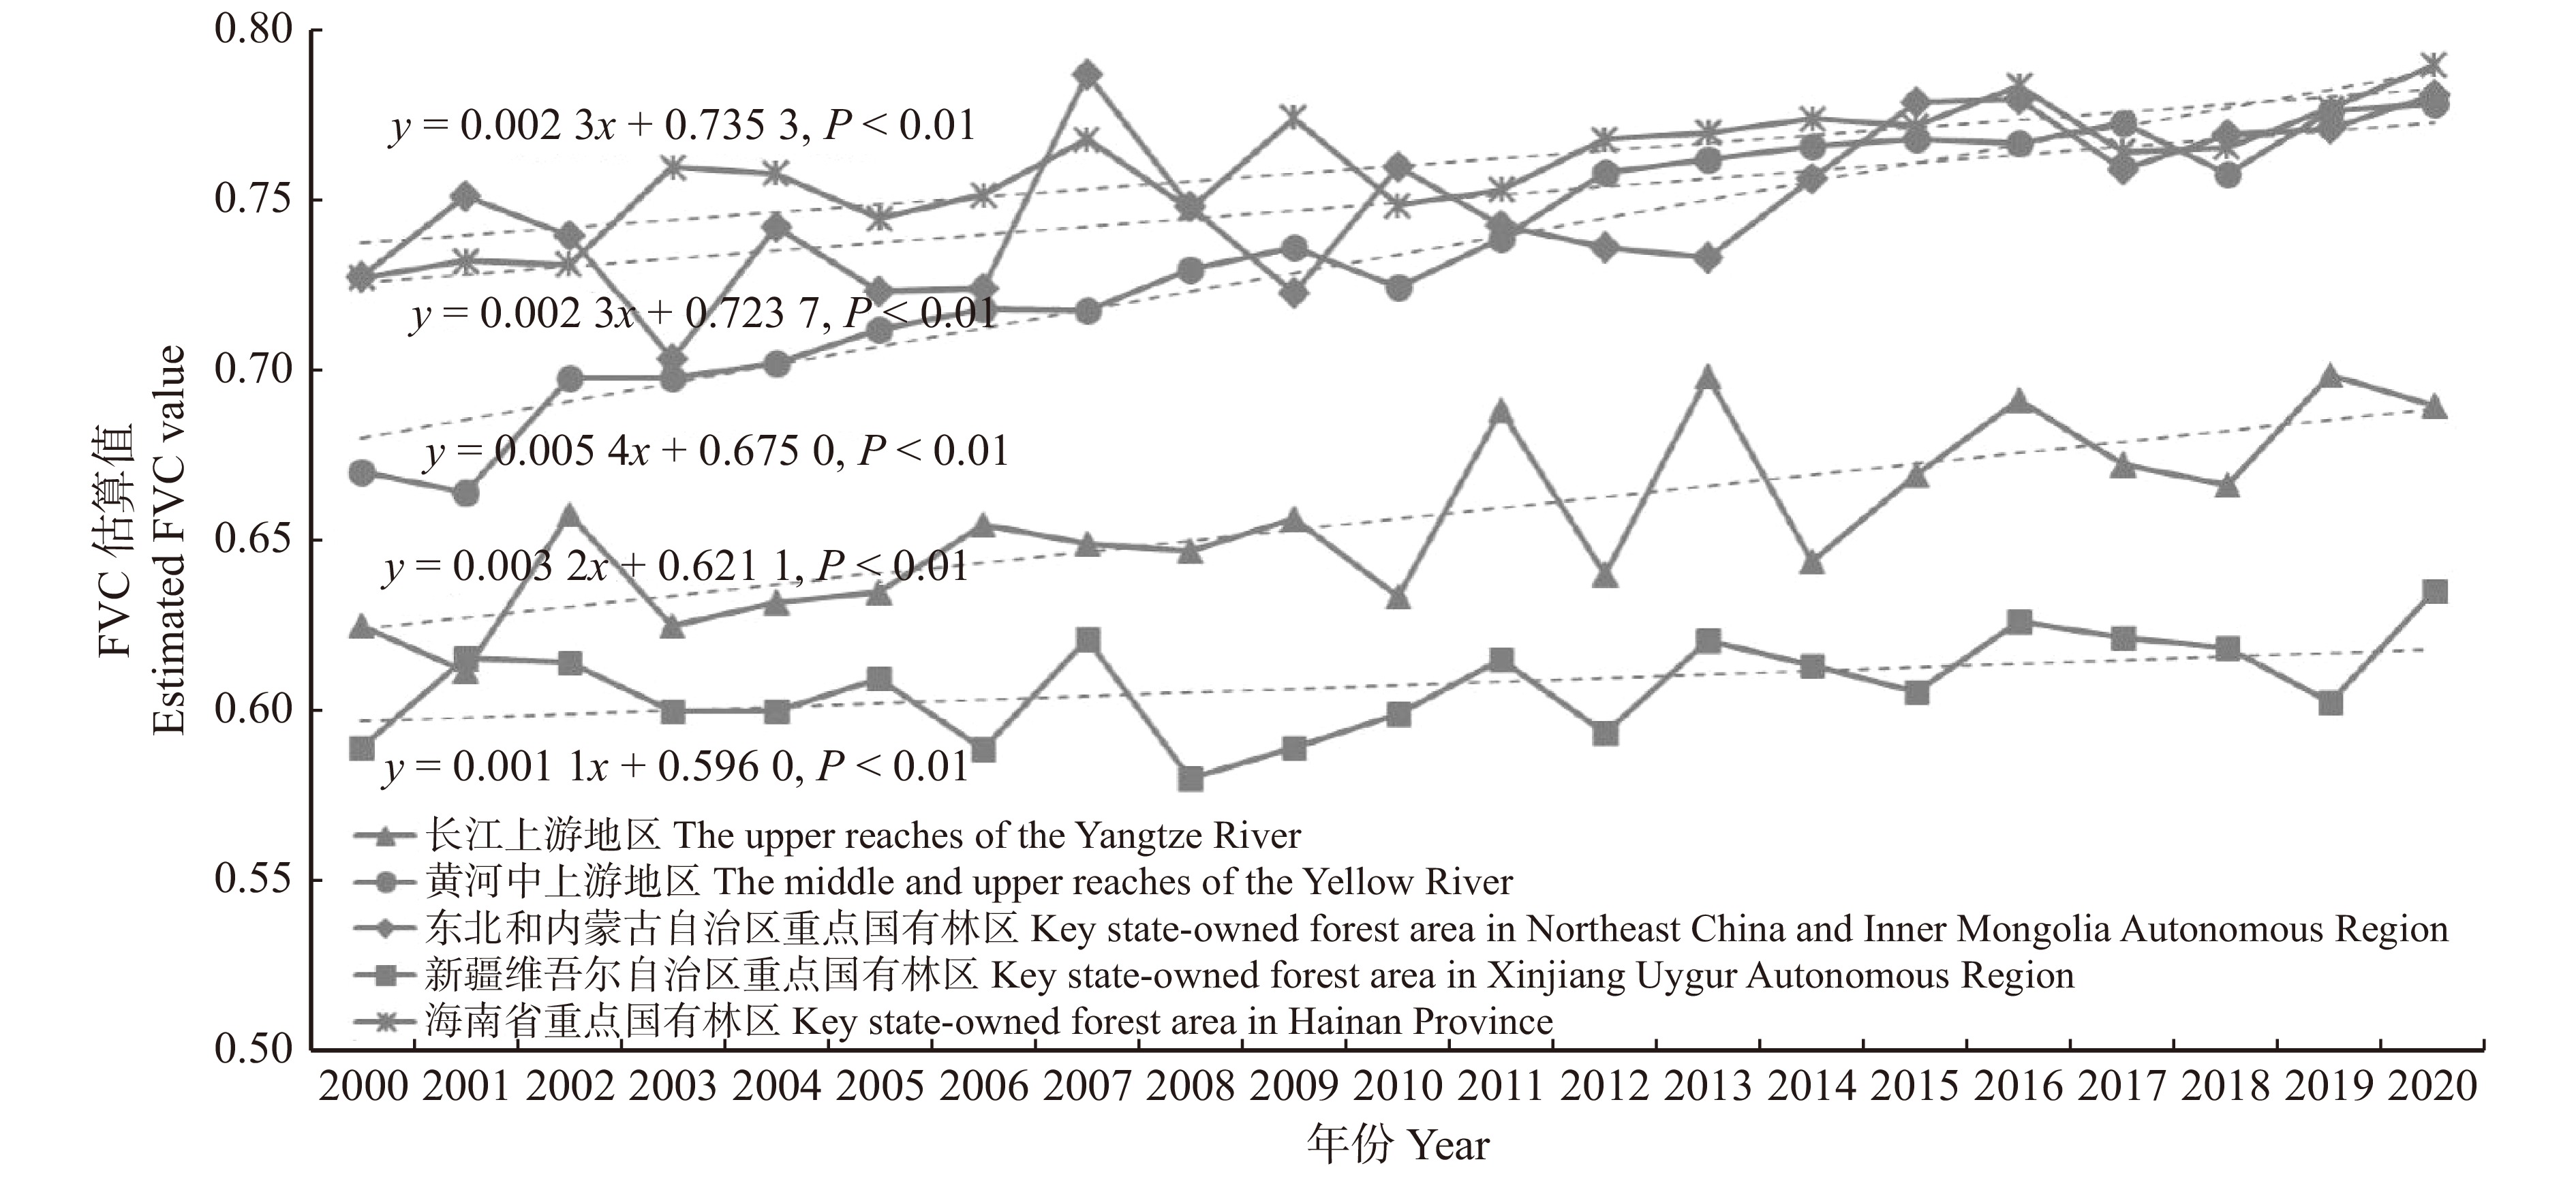
图 7 天保工程区估算FVC时间变化曲线
Figure 7. Time variation curves of estimated FVC values in the NFPP area
![]()
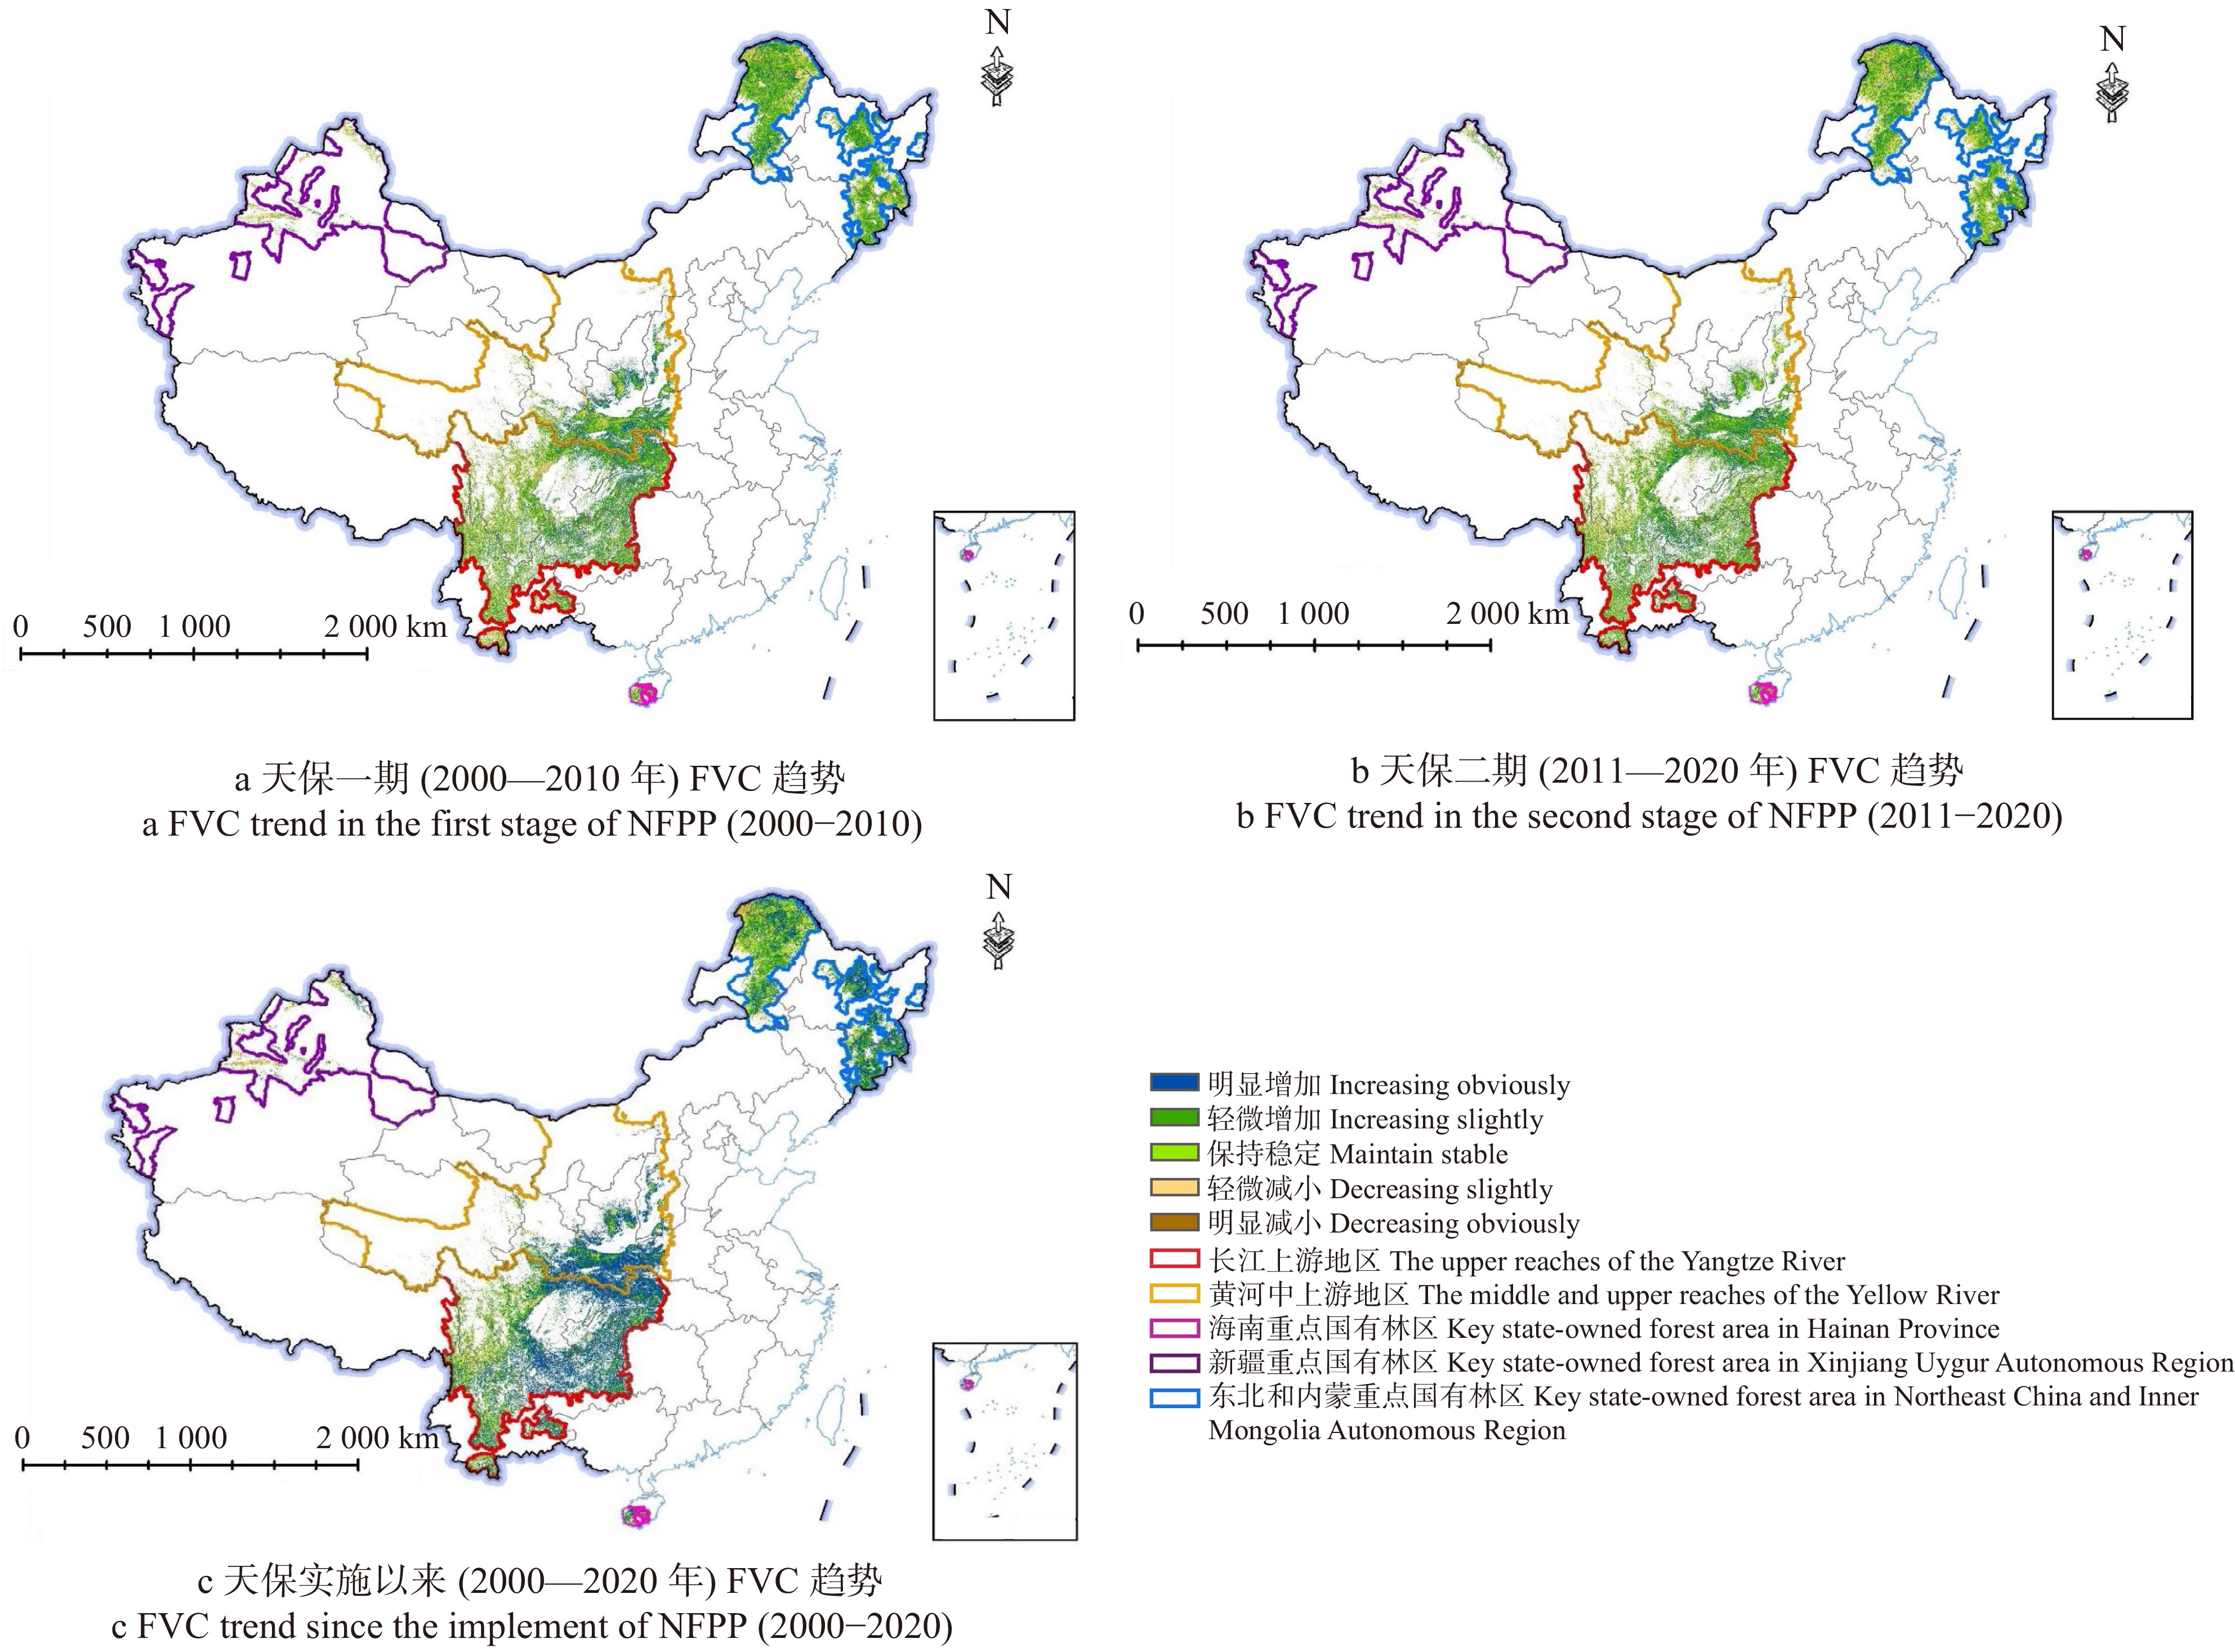
图 8 2000—2020年天保工程区估算FVC变化趋势
审图号:GS(2019)1823 Drawing review No.: GS(2019)1823
Figure 8. Trend of estimated FVC in the NFPP area from 2000 to 2020
![]()
图 10 高森林覆盖区、中森林覆盖区和低森林覆盖区的INDVIv和INDVIs
Figure 10. Analysis of INDVIv and INDVIs in high FVC area, medium FVC area and low FVC area
表 1 FVC趋势变化分级
Table 1 FVC trend change grading
Theil-Sen median趋势
Theil-Sen median trendMann-Kendall显著性检验Z值
Z value of Mann-Kendall significance test分类
Classification≥ 0.0005 ≥ 1.96 明显增加 Increasing obviously ≥ 0.0005 ≤ 1.96 轻微增加 Increasing slightly −0.0005 ~ 0.0005 ≤ 1.96 保持稳定 Maintain stable ≤ −0.0005 ≤ 1.96 轻微减小 Decreasing slightly ≤ −0.0005 ≥ 1.96 明显减小 Decreasing obviously 注:引自文献[33-34]。Note: Cited form reference [33-34].  下载: 导出CSV
表 2 天保工程实施以来重点区域FVC变化趋势面积比率
Table 2 FVC trend area ratio in key areas since the implementation of NFPP
% 时间 Time 区域 Area 明显减小
Deceasing obviously轻微减小
Decreasing
slightly保持稳定
Maintain stable轻微增加
Increasing slightly明显增加
Increasing obviously天保一期(2000—2010年)
The first stage of NFPP (2000−2010)长江上游地区
The upper reaches of the Yangtze River0.97 20.90 7.50 56.47 14.17 黄河中上游地区
The upper and middle reaches of the Yellow River0.69 14.14 7.51 50.06 27.61 东北和内蒙古自治区重点国有林区
Key state-owned forest area in Northeast China
and Inner Mongolia Autonomous Region0.70 20.41 13.17 57.66 8.06 新疆维吾尔自治区重点国有林区
Key state-owned forest area in Xinjiang Uygur Autonomous Region7.73 17.10 27.96 44.74 2.47 海南省重点国有林区
Key state-owned forest area in Hainan Province1.58 22.36 10.26 52.18 13.63 天保工程区 NFPP area 1.03 20.35 9.31 55.10 14.21 天保二期
(2011—2020年)
The second stage of
NFPP (2011−2020)长江上游地区
The upper reaches of the Yangtze River0.92 20.54 8.48 56.61 13.45 黄河中上游地区
The upper and middle reaches of the Yellow River0.59 15.38 8.86 56.96 18.22 东北和内蒙古自治区重点国有林区
Key state-owned forest area in Northeast China
and Inner Mongolia Autonomous Region0.97 23.56 17.15 51.27 7.05 新疆维吾尔自治区重点国有林区
Key state-owned forest area in Xinjiang Uygur Autonomous Region3.22 15.66 29.57 46.74 4.81 海南省重点国有林区
Key state-owned forest area in Hainan Province3.09 24.93 10.22 50.52 11.25 天保工程区 NFPP area 0.96 21.07 11.30 54.66 12.00 天保实施以来(2000—2020年)
Since the implement of
NFPP (2000−2020)长江上游地区
The upper reaches of the Yangtze River0.90 7.88 9.12 32.92 49.19 黄河中上游地区
The upper and middle reaches of the Yellow River0.45 3.27 6.34 21.08 68.87 东北和内蒙古自治区重点国有林区
Key state-owned forest area in Northeast China
and Inner Mongolia Autonomous Region1.58 9.38 20.00 37.62 31.43 新疆维吾尔自治区重点国有林区
Key state-owned forest area in Xinjiang Uygur Autonomous Region3.91 7.27 34.31 40.68 13.84 海南省重点国有林区
Key state-owned forest area in Hainan Province3.86 9.98 12.05 32.34 41.77 天保工程区 NFPP area 1.43 8.13 12.22 32.31 45.91
下载: 导出CSV
-
[1] 庞勇, 蒙诗栎, 史锴源, 等. 中国天然林保护工程区森林覆盖遥感监测[J]. 生态学报, 2021, 41(13): 5080−5092. Pang Y, Meng S L, Shi K Y, et al. Forest coverage monitoring in the Natural Forest Protection Project area of China[J]. Acta Ecologica Sinica, 2021, 41(13): 5080−5092.
[2] Liu J, Coomes D A, Gibson L, et al. Forest fragmentation in China and its effect on biodiversity[J]. Biological Reviews, 2019, 94(5): 1636−1657. doi: 10.1111/brv.12519
[3] 李依璇, 朱清科, 石若莹, 等. 2000—2018年黄土高原植被覆盖时空变化及影响因素[J]. 中国水土保持科学, 2021, 19(4): 60−68. doi: 10.16843/j.sswc.2021.04.007 Li Y X, Zhu Q K, Shi R Y, et al. Spatial and temporal changes of vegetation cover and its influencing factors in the Loess Plateau from 2000 to 2018[J]. Science of Soil and Water Conservation, 2021, 19(4): 60−68. doi: 10.16843/j.sswc.2021.04.007
[4] 李美丽, 尹礼昌, 张园, 等. 基于MODIS-EVI的西南地区植被覆盖时空变化及驱动因素研究[J]. 生态学报, 2021, 41(3): 1138−1147. Li M L, Yin L C, Zhang Y, et al. Spatio-temporal dynamics of fractional vegetation coverage based on MODIS-EVI and its driving factors in Southwest China[J]. Acta Ecologica Sinica, 2021, 41(3): 1138−1147.
[5] 李超, 罗栋梁, 李雪梅, 等. 2000—2018年天山植被生态质量综合评价[J]. 兰州大学学报 (自然科学版), 2021, 57(4): 528−536. Li C, Luo D L, Li X M, et al. A comprehensive evaluation of the vegetation ecology quality from 2000 to 2018 in the Tianshan Mountains[J]. Journal of Lanzhou University (Natural Sciences), 2021, 57(4): 528−536.
[6] 刘世荣, 庞勇, 张会儒, 等. 中国天然林资源保护工程综合评价指标体系与评估方法[J]. 生态学报, 2021, 41(13): 5067−5079. Liu S R, Pang Y, Zhang H R, et al. Evaluation indicator system and method designed for Natural Forest Protection Program of China[J]. Acta Ecologica Sinica, 2021, 41(13): 5067−5079.
[7] 闫敏, 李增元, 陈尔学, 等. 内蒙古大兴安岭根河森林保护区植被覆盖度变化[J]. 生态学杂志, 2016, 35(2): 236−243. doi: 10.13292/j.1000-4890.201602.033 Yan M, Li Z Y, Chen E X, et al. Vegetation fractional coverage change in Daxinganling Genhe Forest Reserve of Inner Mongolia[J]. Chinese Journal of Ecology, 2016, 35(2): 236−243. doi: 10.13292/j.1000-4890.201602.033
[8] 李钰溦, 贾坤, 魏香琴, 等. 中国北方地区植被覆盖度遥感估算及其变化分析[J]. 国土资源遥感, 2015, 27(2): 112−117. Li Y W, Jia K, Wei X Q, et al. Fractional vegetation cover estimation in northern China and its change analysis[J]. Remote Sensing for Land & Resources, 2015, 27(2): 112−117.
[9] 郑树峰, 王丽萍, 臧淑英. 大兴安岭天保工程区生态系统服务变化研究[J]. 地理科学, 2021, 41(7): 1295−1302. doi: 10.13249/j.cnki.sgs.2021.07.020 Zheng S F, Wang L P, Zang S Y, et al. The change of ecosystem services of natural forest protection project regions in the Da Hinggan Mountains[J]. Scientia Geographica Sinica, 2021, 41(7): 1295−1302. doi: 10.13249/j.cnki.sgs.2021.07.020
[10] Amarnath G, Babar S, Murthy M S R. Evaluating MODIS-vegetation continuous field products to assess tree cover change and forest fragmentation in India: a multi-scale satellite remote sensing approach[J]. The Egyptian Journal of Remote Sensing and Space Science, 2017, 20(2): 157−168. doi: 10.1016/j.ejrs.2017.05.004
[11] DiMiceli C, Townshend J, Carroll M, et al. Evolution of the representation of global vegetation by vegetation continuous fields[J/OL]. Remote Sensing of Environment, 2021, 254: 112271[2022−08−02]. https://doi.org/10.1016/j.rse.2020.112271.
[12] Majasalmi T, Rautiainen M. Representation of tree cover in global land cover products: Finland as a case study area[J]. Environmental Monitoring and Assessment, 2021, 193(3): 1−19.
[13] Gao Y, Ghilardi A, Paneque-Galvez J, et al. Validation of MODIS vegetation continuous fields for monitoring deforestation and forest degradation: two cases in Mexico[J]. Geocarto International, 2016, 31(9): 1019−1031. doi: 10.1080/10106049.2015.1110205
[14] Adzhar R, Kelley D I, Dong N, et al. MODIS vegetation continuous fields tree cover needs calibrating in tropical savannas[J]. Biogeosciences, 2022, 19(5): 1377−1394. doi: 10.5194/bg-19-1377-2022
[15] Adzhar R, Kelley D I, Dong N, et al. Assessing MODIS vegetation continuous fields tree cover product (collection 6): performance and applicability in tropical forests and savannas[J]. Biogeosciences Discussions, 2021, 1: 1−20.
[16] Yang X, Crews K. Applicability analysis of MODIS tree cover product in Texas savanna[J]. International Journal of Applied Earth Observation and Geoinformation, 2019, 81: 186−194. doi: 10.1016/j.jag.2019.05.003
[17] Tang H, Armston J, Hancock S, et al. Characterizing global forest canopy cover distribution using spaceborne lidar [J/OL]. Remote Sensing of Environment, 2019, 231: 111262 [2022−08−02]. https://doi.org/10.1016/j.rse.2019.111262.
[18] Fagan M E. A lesson unlearned? Underestimating tree cover in drylands biases global restoration maps[J]. Global Change Biology, 2020, 26(9): 4679−4690. doi: 10.1111/gcb.15187
[19] Yu T, Ni W, Zhang Z, et al. Regional sampling of forest canopy covers using UAV visible sereoscopic imagery for assessment of satellite-based products in Northeast China[J/OL]. Journal of Remote Sensing, 2022, 1−14[2022−12−02]. https://spj.science.org/doi/pdf/10.34133/2022/9806802.
[20] Gross D, Achard F, Dubois G, et al. Uncertainties in tree cover maps of Sub-Saharan Africa and their implications for measuring progress towards CBD Aichi Targets[J]. Remote Sensing in Ecology and Conservation, 2018, 4(2): 94−112. doi: 10.1002/rse2.52
[21] Gutman G, Ignatov A. The derivation of the green vegetation fraction from NOAA/AVHRR data for use in numerical weather prediction models[J]. International Journal of Remote Sensing, 1998, 19(8): 1533−1543. doi: 10.1080/014311698215333
[22] 贾坤, 姚云军, 魏香琴, 等. 植被覆盖度遥感估算研究进展[J]. 地球科学进展, 2013, 28(7): 774−782. doi: 10.11867/j.issn.1001-8166.2013.07.0774 Jia K, Yao Y J, Wei X Q, et al. A review on fractional vegetation cover estimation using remote sensing[J]. Advance in Earth Science, 2013, 28(7): 774−782. doi: 10.11867/j.issn.1001-8166.2013.07.0774
[23] Yang Y, Wu T, Zeng Y, et al. An adaptive-parameter pixel unmixing method for mapping evergreen forest fractions based on time-series NDVI: a case study of Southern China[J/OL]. Remote Sensing, 2021, 13(22): 4678[2022−08−02]. https://doi.org/10.3390/rs13224678.
[24] Jia K, Yang L, Liang S, et al. Long-term global land surface satellite (GLASS) fractional vegetation cover product derived from MODIS and AVHRR data[J]. IEEE Journal of Selected Topics in Applied Earth Observations and Remote Sensing, 2018, 12(2): 508−518.
[25] Ramon S R, Didan K, Jacobson A, et al. Modis vegetation index user’s guide[R/OL]. Tucson: 2010[2022−08−02]. https://lpdaac.usgs.gov/products/mod13q1v006/.
[26] Townshend J, Hansen M, Carroll M, et al. User guide for the MODIS vegetation continuous fields product collection 5 version 1[R/OL]. Maryland: 2011[2022−08−02]. https://modis.gsfc.nasa.gov/data/dataprod/mod44.php.
[27] Pang Y, Li Z, Ju H, et al. LiCHy: the CAF’s LiDAR, CCD and hyperspectral integrated airborne observation system[J/OL]. Remote Sensing, 2016, 8(5): 398[2022−08−02]. https://doi.org/10.3390/rs8050398.
[28] 庞勇, 梁晓军, 荚文, 等. 塞罕坝林场机载综合遥感实验[J]. 遥感学报, 2021, 25(4): 904−917. doi: 10.11834/jrs.20210222 Pang Y, Liang X J, Jia W, et al. The comprehensive airborne remote sensing experiment in Saihanba Forest Farm[J]. National Remote Sensing Bulletin, 2021, 25(4): 904−917. doi: 10.11834/jrs.20210222
[29] Jia W, Pang Y, Tortini R, et al. A kernel-driven BRDF approach to correct airborne hyperspectral imagery over forested areas with rugged topography[J/OL]. Remote Sensing, 2020, 12(3): 432[2022−08−02]. https://doi.org/10.3390/rs12030432.
[30] Rahman A F, Cordova V D, Gamon J A, et al. Potential of MODIS ocean bands for estimating CO2 flux from terrestrial vegetation: a novel approach[J]. Geophysical Research Letters, 2004, 31(10): 1−4.
[31] Gholamnia M, Khandan R, Bonafoni S, et al. Spatiotemporal analysis of MODIS NDVI in the semi-arid region of Kurdistan (Iran)[J/OL]. Remote Sensing, 2019, 11(14): 1723[2022−08−02]. https://doi.org/10.3390/rs11141723.
[32] Vanella D, Consoli S, Ramírez-Cuesta J M, et al. Suitability of the MODIS-NDVI time-series for a posteriori evaluation of the Citrus tristeza virus epidemic[J/OL]. Remote Sensing, 2020, 12(12): 1965[2022−08−02]. https://doi.org/10.3390/rs12121965.
[33] Shi P, Hou P, Gao J, et al. Spatial-temporal variation characteristics and influencing factors of vegetation in the Yellow River Basin from 2000 to 2019[J/OL]. Atmosphere, 2021, 12(12): 1576[2022−08−02]. https://doi.org/10.3390/atmos13060962.
[34] 方利, 王文杰, 蒋卫国, 等. 2000 ~ 2014 年黑龙江流域 (中国) 植被覆盖时空变化及其对气候变化的响应[J]. 地理科学, 2017, 37(11): 1745−1754. Fang L, Wang W J, Jiang W G, et al. Spatio-temporal variations of vegetation cover and its responses to climate change in the Heilongjiang Basin of China from 2000 to 2014[J]. Scientia Geographica Sinica, 2017, 37(11): 1745−1754.
[35] 相恒星, 王宗明, 毛德华. 东北地区天然林资源保护工程生态保护成效分析[J]. 中国科学院大学学报, 2021, 38(3): 314−322. doi: 10.7523/j.issn.2095-6134.2021.03.004 Xiang H X, Wang Z M, Mao D H. Ecological effect of Natural Forest Protection Project in Northeast China[J]. Journal of University of Chinese Academy of Sciences, 2021, 38(3): 314−322. doi: 10.7523/j.issn.2095-6134.2021.03.004
[36] 钱琛, 陈海滨, 侯现慧. 生态建设背景下陕西省植被覆盖时空变化及其影响因素研究[J]. 干旱区地区, 2020, 43(2): 425−433. Qian C, Chen H B, Hou X H. Temporal and spatial variation of vegetation cover and its influencing factors in Shaanxi Province in the context of ecological construction[J]. Arid Land Geography, 2020, 43(2): 425−433.
[37] 陈巧, 陈永富, 鞠洪波. 基于3S技术的天保区植被变化监测方法研究[J]. 林业科学研究, 2013, 26(6): 736−743. doi: 10.13275/j.cnki.lykxyj.2013.06.011 Chen Q, Chen Y H, Ju H B. Vegetation change monitoring for the natural forest protection based on spatial analysis techniques[J]. Forest Research, 2013, 26(6): 736−743. doi: 10.13275/j.cnki.lykxyj.2013.06.011
[38] 郑朝菊, 曾源, 赵玉金, 等. 近15年中国西南地区植被覆盖度动态变化[J]. 国土资源遥感, 2017, 29(3): 128−136. Zheng C J, Zeng Y, Zhao Y J, et al. Monitoring and dynamic analysis of fractional vegetation cover in southwestern China over the past 15 years based on MODIS data[J]. Remote Sensing for Land & Resources, 2017, 29(3): 128−136.
[39] 陶蕴之, 吕一河, 李凤全, 等. 西南天然林保护工程区生态成效评估[J]. 生态与农村环境学报, 2016, 32(5): 716−723. doi: 10.11934/j.issn.1673-4831.2016.05.005 Tao Y Z, Lü Y H, Li F Q, et al. Assessment of ecological effect on the natural forest protection project in southwest China[J]. Jouranl of Ecology and Rural Environment, 2016, 32(5): 716−723. doi: 10.11934/j.issn.1673-4831.2016.05.005
[40] Gitelson A A, Kaufman Y J, Stark R, et al. Novel algorithms for remote estimation of vegetation fraction[J]. Remote Sensing of Environment, 2002, 80: 76−87. doi: 10.1016/S0034-4257(01)00289-9
[41] 陈晋, 陈云浩, 何春阳, 等. 基于土地覆盖分类的植被覆盖率估算亚像元模型与应用[J]. 遥感学报, 2001, 5(6): 416−422. doi: 10.11834/jrs.20010603 Chen J, Chen Y H, He C Y, et al. Sub-pixel model for vegetation fraction estimation based on land cover classification[J]. Journal of Remote Sensing, 2001, 5(6): 416−422. doi: 10.11834/jrs.20010603
[42] Xiao J, Moody A. A comparison of methods for estimating fractional green vegetation cover within a desert-to-upland transition zone in central New Mexico, USA[J]. Remote Sensing of Environment, 2005, 98(2−3): 237−250.
[43] Kimes D S, Knyazikhin Y, Privette J L, et al. Inversion methods for physically-based models[J]. Remote Sensing Reviews, 2000, 18: 381−439. doi: 10.1080/02757250009532396
[44] Bacour C, Baret F, Béal D, et al. Neural network estimation of LAI, fAPAR, fCover and LAI Cab, from top of canopy MERIS reflectance data: principles and validation[J]. Remote Sensing of Environment, 2006, 105: 313−325. doi: 10.1016/j.rse.2006.07.014
[45] Xiao Z, Wang T, Liang S, et al. Estimating the fractional vegetation cover from GLASS leaf area index product[J/OL]. Remote Sensing, 2016, 8(4): 337[2022−08−02]. https://doi.org/10.3390/rs8040337.
[46] 李攀, 胡德勇, 赵文吉. 北方农牧交错带植被覆盖变化遥感监测研究−以河北省沽源县为例[J]. 国土资源遥感, 2010, 22(2): 113−117. Li P, Hu D Y, Zhao W J. The monitoring of changes of land vegetation covers by remote sensing in farming-pastoral mixedzones of North China: a case study in Guyuan County, Hebei Province[J]. Remote Sensing for Natural Resources, 2010, 22(2): 113−117.
[47] 张成才, 娄洋, 李颖, 等. 基于像元二分模型的伏牛山地区植被覆盖度变化[J]. 水土保持研究, 2020, 27(3): 301−307. doi: 10.13869/j.cnki.rswc.2020.03.043 Zhang C C, Lou Y, Li Y, et al. Change of vegetation coverage in Funiu Mountain Regions based on the dimidiate pixel model[J]. Research of Soil and Water Conservation, 2020, 27(3): 301−307. doi: 10.13869/j.cnki.rswc.2020.03.043
[48] 廖春华, 张显峰, 孙权, 等. 基于HJ-1高光谱数据的植被覆盖度估测方法研究[J]. 遥感信息, 2011(5): 65−70. doi: 10.3969/j.issn.1000-3177.2011.01.013 Liao C H, Zhang X F, Sun Q, et al. Fractional vegetation cover estimation using HJ-1 spaceborne hyperspectral data[J]. Remote Sensing Information, 2011(5): 65−70. doi: 10.3969/j.issn.1000-3177.2011.01.013
[49] 江淼, 张显峰, 孙权, 等. 不同分辨率影像反演植被覆盖度的参数确定与尺度效应分析[J]. 武汉大学学报(信息科学版), 2011, 36(3): 311−315. Jiang M, Zhang X F, Sun Q, et al. Vegetation coverage retrieval scale effect analysis using multi-sensor data[J]. Geomatics and Information Science of Wuhan University, 2011, 36(3): 311−315.
[50] 孟浩斌, 周启刚, 李明慧, 等. 基于MODIS像元尺度的三峡库区植被覆盖度变化的地形分布特征[J]. 长江流域资源与环境, 2020, 29(8): 1790−1799. Meng H B, Zhou Q G, Li M H, et al. Topographic distribution characteristics of vegetation cover change in the Three Gorges Reservoir Area based on MODIS pixel scale[J]. Resources and Environment in the Yangtze Basin, 2020, 29(8): 1790−1799.
[51] 赵威成, 马福义, 吕利娜, 等. 基于DVI的像元二分模型反演植被覆盖度研究[J]. 黑龙江科技大学学报, 2020, 30(2): 125−128. doi: 10.3969/j.issn.2095-7262.2020.02.002 Zhao W C, Ma F Y, Lü L N, et al. Study on inversion of FVC based on DVI pixel dichotomous model[J]. Journal of Heilongjiang University of Science and Technology, 2020, 30(2): 125−128. doi: 10.3969/j.issn.2095-7262.2020.02.002
[52] 庞国伟, 杨勤科, 王春梅, 等. 像元二分模型参数确定方法对高分一号 PMS 数据估算植被覆盖度精度的影响[J]. 地理与地理信息科学, 2019, 35(4): 27−33. doi: 10.3969/j.issn.1672-0504.2019.04.005 Pang G W, Yang Q K, Wang C M, et al. Influence of parameter determination methods of the pixel dichotomy model on the estimation accuracy of fractional vegetation cover by GF-1 PMS data[J]. Geography and Geo-Information Science, 2019, 35(4): 27−33. doi: 10.3969/j.issn.1672-0504.2019.04.005
[53] 丹宇卓, 石晶明, 李心怡, 等. 基于改进的像元二分模型估测郁闭度[J]. 北京林业大学学报, 2019, 41(6): 35−43. doi: 10.13332/j.1000-1522.20180263 Dan Y Z, Shi J M, Li X Y, et al. Estimation of canopy closure based on improved dimidiate pixel model[J]. Journal of Beijing Forestry University, 2019, 41(6): 35−43. doi: 10.13332/j.1000-1522.20180263
[54] Yan K, Gao S, Chi H, et al. Evaluation of the vegetation-index-based dimidiate pixel model for fractional vegetation cover estimation[J]. IEEE Transactions on Geoscience and Remote Sensing, 2021, 60: 1−14.
[55] Guo B, Han F, Jiang L. An improved dimidiated pixel model for vegetation fraction in the Yarlung Zangbo River Basin of Qinghai-Tibet Plateau[J]. Journal of the Indian Society of Remote Sensing, 2018, 46(2): 219−231. doi: 10.1007/s12524-017-0692-8
-
期刊类型引用(10)
1. 袁玉虹,何天友. 氮磷钾配比施肥对短葶山麦冬生长及有效成分的影响. 九江学院学报(自然科学版). 2024(01): 123-128 .  百度学术
百度学术
2. 王晓荣,胡兴宜,龚苗,付甜,庞宏东,杨佳伟. 长江中下游地区28个常见乡土树种幼苗光合固碳能力比较. 湖北农业科学. 2023(01): 112-117 . 百度学术
3. 汤靖文,李晨晞,彭政淋,苏嘉熙,卫星. 氮磷钾肥对水曲柳雌雄株叶片光合生理及化学计量特征的影响. 森林工程. 2023(02): 30-38+46 . 百度学术
4. 景娜,高玉红,张巧霞,文明,徐鹏,崔政军,吴兵,剡斌,王一帆. 氮肥运筹对旱地胡麻同化物形成及籽粒产量的调控效应. 生态学杂志. 2023(07): 1644-1652 . 百度学术
5. 李川,王玉书,黄小辉. 钙、镁缺乏对核桃生长和光合特性的影响. 福建林业. 2023(04): 38-41 . 百度学术
6. 黄小辉,吴焦焦,魏立本,王玉书,冯大兰,张宏. 不同缺素条件下核桃幼苗的生长和生理变化. 北京林业大学学报. 2023(09): 33-41 . 本站查看
7. 尹梦雅,李志辉,杨艳,李昌珠,汤玉喜,唐洁,秦平书,吴兴华. 施肥对黄栀子幼苗生长与光合特性的影响. 东北林业大学学报. 2022(05): 32-36 . 百度学术
8. 唐新瑶,亢亚超,梁喜献,马道承,王凌晖. 氮磷钾配比施肥对观光木幼苗生理与光合特性的影响. 西北林学院学报. 2022(04): 37-42 . 百度学术
9. 李林珂,王一诺,薛潇,张文,吴焦焦,高岚,谭星,荣星宇,段儒蓉,刘芸. 黄栌光合和呈色特性对重庆阴雨天气的响应. 南京林业大学学报(自然科学版). 2022(05): 95-103 . 百度学术
10. 高恩婷,曾庆扬,谷战英,卢雨析,李扬,冯楠可,熊荟璇,张春来,曾乐景. 不同间作模式对山苍子光合特性及其栽培土壤水分和养分的影响. 经济林研究. 2022(04): 61-71 . 百度学术
其他类型引用(16)


计量
- 文章访问数: 423
- HTML全文浏览量: 135
- PDF下载量: 139
- 被引次数: 26
