
Mixed effect model of stem density of Populus nigra × P. simonii based on beta regression
-
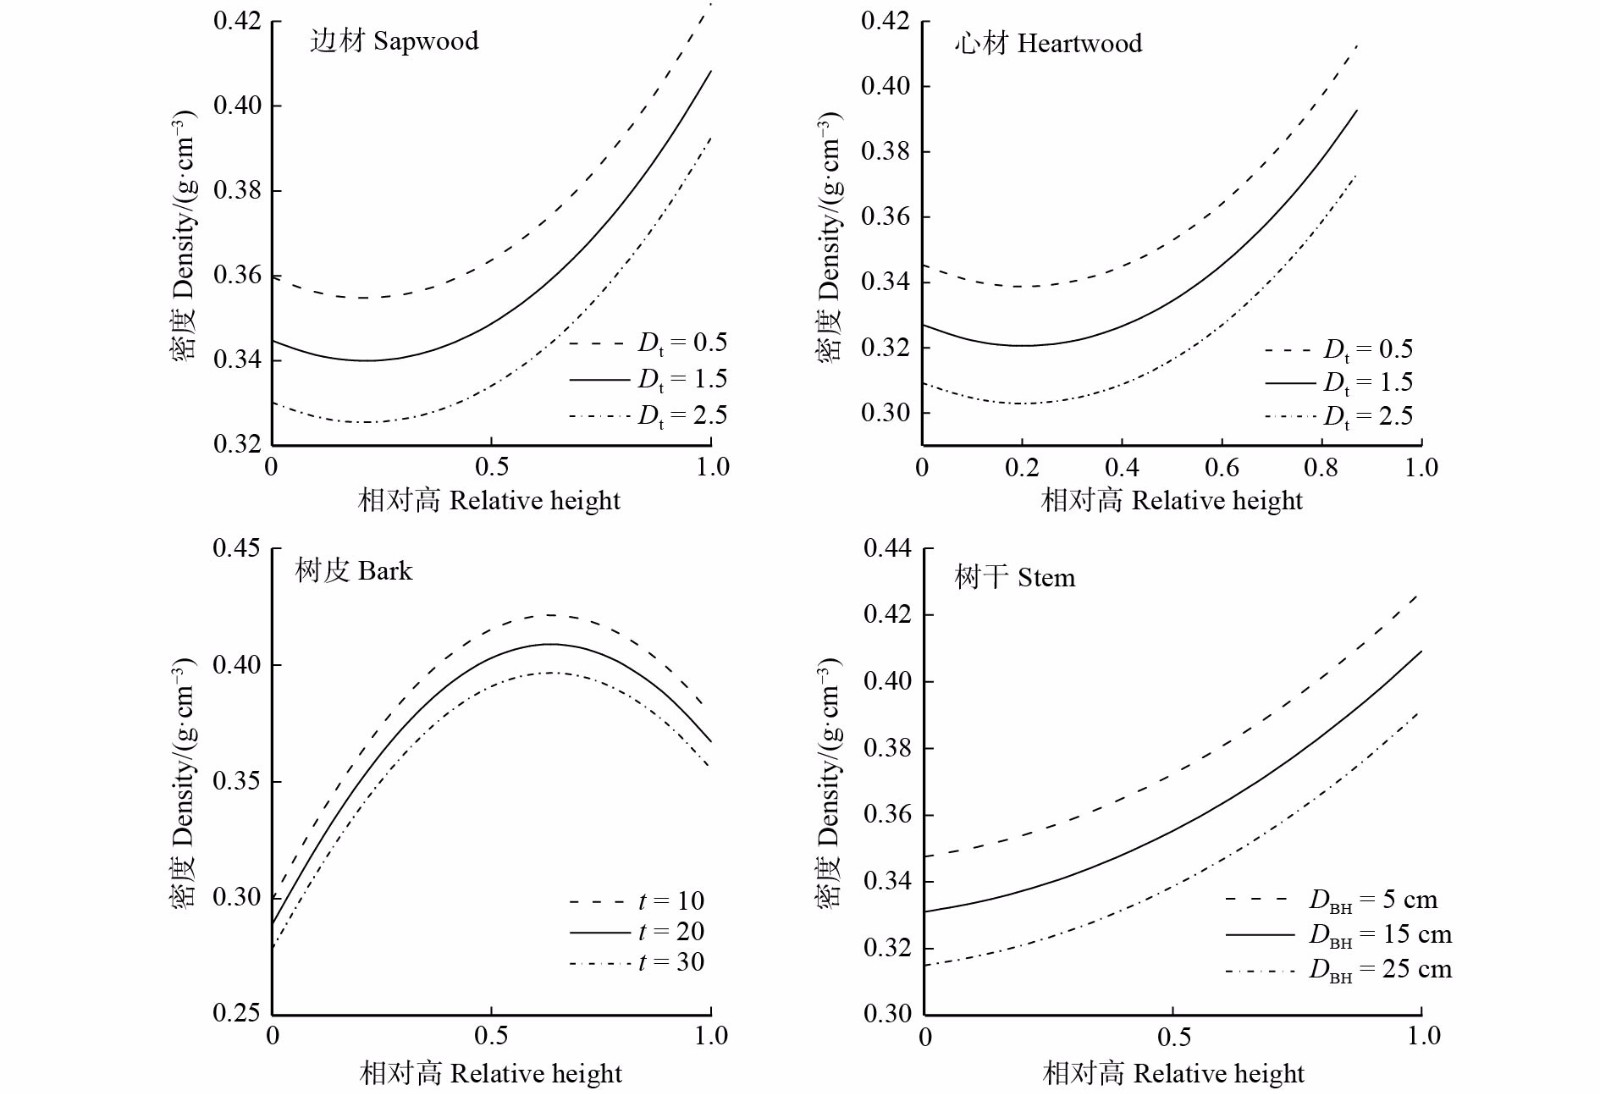
摘要:目的 探究迎春5号杨树在树干纵向上的木材密度影响因子和变异规律,构建迎春5号杨树边材、心材、树皮和树干密度混合效应beta回归模型,为树干生物量预测和木材材性研究提供参考。方法 以黑龙江省尚志市90株迎春5号杨树解析木数据为基础,构建迎春5号杨树边材、心材、树皮和树干密度的混合效应beta回归模型。采用相关性分析和最优子集法筛选beta回归基础模型的变量;利用负二倍的对数似然值、赤池信息准则、贝叶斯信息准则、调整确定系数(Ra 2)、似然比检验对收敛模型进行拟合优度的评价,利用留一交叉验证法对模型进行检验,指标为平均绝对误差(MAE)和平均绝对百分比误差;结合两种抽样方式(方案Ⅰ:不限定相对高;方案Ⅱ:限定相对高在0.1以下)对模型进行校正。结果 边材、心材、树皮和树干密度不仅受到相对高的影响,还分别与胸径平均生长量、年龄、胸径密切相关,基于林木因子建立的混合效应beta回归模型的Ra 2分别为0.53、0.52、0.52、0.63,MAE < 0.05 g/cm3,与基础模型相比均提高了预测精度。边材和心材密度从树干基部往上先减小后增大,在相对高0.2处有拐点;树皮密度从树干基部到树梢先增大后减小,在相对高0.6处有拐点;树干密度沿着树干向上逐渐增大。固定相对高时,边材、心材密度都与胸径平均生长量呈负相关,树皮、树干密度分别与年龄、胸径呈负相关。在不限定相对高的情况下,沿着树干随机抽取4个圆盘的密度测量值来校准模型得到稳定的预测精度;限定取样高度在相对高0.1(2.0 m)以下时,对边材、心材、树皮和树干分别抽取一个圆盘(对应高度为1.0、1.3、2.0、1.0 m)的密度测量值,得到与最优抽样组合相似的预测精度。相对高、胸径平均生长量、年龄和胸径是迎春5号杨树木材密度的显著影响因子。结论 beta回归模型可对(0,1)区间的迎春5号杨树树干密度直接模拟,引入随机效应可提高模型的预测精度。边材、心材、树皮和树干密度在树干纵向上的变化规律不同,构建的混合效应beta回归模型可为迎春5号杨树树干生物量估算和木材性质研究奠定基础。Abstract:Objective This paper aims to explore the influencing factors and variation rules of wood density in the longitudinal stem of Populus nigra × P. simonii, so beta regression models with mixed effect of sapwood, heartwood, bark and stem density of the poplar were constructed, which was used as a reference for stem biomass prediction and wood timber properties.Method Mixed effect beta regression models for sapwood, heartwood, bark and stem density of P. nigra × P. simonii were established, which based on the analytical data of 90 trees of P. nigrax × P. simonii plantation in Shangzhi City, Heilongjiang Province of northeastern China. Using correlation analysis and optimal subset methods to screen the variables of the beta regression base model, and the goodness of fit of the convergence model was evaluated by −2log-likehood value, akaike information criterion, bayesian information criterion, adjusted certainty coefficient (Ra 2) and likelihood ratio test. The leave-one-out-cross-validation was used to test the model, the indexes were mean absolute error (MAE) and mean absolute error percentage. Two sampling methods were combined (scheme Ⅰ: no relative height; scheme Ⅱ: limit relative height below 0.1) to correct the model.Result The densities of sapwood, heartwood, bark and stem were not only affected by relative height, but also closely related to the average growth of DBH, age and DBH, respectively. Ra 2 of the mixed-effect beta regression model based on tree factors was 0.53, 0.52, 0.52, 0.63, respectively, and the MAE < 0.05 g/cm3. Sapwood density and heartwood density decreased first and then increased from the base to the top of the stem, with an inflection point at a relative height of 0.2. Bark density first increased and then decreased from the base of the stem to the top of the tree, and there was an inflection point at the relative height of 0.6. The stem density increased gradually along the stem. When fixed relative height, the densities of sapwood and heartwood were both negatively correlated with the average growth of DBH. The densities of bark and stem were negatively correlated with age and DBH, respectively. Without limiting the relative height, the wood density value corresponding to the height of 4 discs randomly sampled along the stem was calibrated to obtain stable prediction accuracy. When the sampling height was limited to 0.1 (2.0 m) or less, there was little difference in the prediction accuracy between the optimal sampling combination and the density values (1.0, 1.3, 2.0, 1.0 m, respectively) of sapwood, heartwood, bark and stem at a disc height. Relative height, average growth of DBH, age and DBH were significant influencing factors of wood density of P. nigra × P. simonii.Conclusion The beta regression model can directly simulate the stem density of P. nigra × P. simonii in the (0, 1) interval, and the random effect can improve the prediction accuracy of the model. The longitudinal variations of sapwood, heartwood, bark and stem density are different. The constructed mixed-effect beta regression model can lay a foundation for biomass estimation and wood property study of P. nigra × P. simonii.
-
白桦(Betula platyphylla)为桦木科(Betulaceae)桦木属植物,是我国东北地区常见树种,富含多种次生代谢物,具有很高的经济和药用价值[1]。如以白桦脂酸、齐墩果酸等为代表的三萜类物质具有抗病毒、抗肿瘤、抗氧化等多种药用活性[2-3]。类黄酮作为抗癌制剂对治疗肺癌、乳腺癌、成胶质细胞瘤等多种恶性肿瘤有显著作用[4]。桦树汁营养丰富、药食兼用,在保健、食品、医药、日化行业均具有价值[5]。近年来,白桦资源被广泛研究和利用,白桦的需求量也日益加大。
传统的树木种植和栽培方法,如种子发芽、扦插、嫁接等具有耗时长,发芽率低、高质量材料短缺等弊端[6]。细胞培养虽耗时短,但也常出现褐化,细胞生长及次生代谢产物合成不稳定等缺点。而丛生苗具有较高的成苗率、次生代谢物产量稳定等优点,更适合于试验研究和规模化发酵培养。王思瑶等[7]以柽柳(Tamarix chinensis)丛生芽为材料,探究培养基与总三萜、总黄酮、总酚产量之间的关系。杨帆等[8]以金线莲(Anoectochilus roxburghii)丛生芽为材料生产较多的多糖、黄酮和酚类物质。李球红等[9]利用桂花(Osmanthus fragrans)丛生苗培养桂花,为桂花的快速繁殖和新品种的培育提供了新的途径和方法。目前,关于白桦丛生苗诱导及其次生代谢产物合成与生产报道较少。
温度(高温和低温)逆境下,具有毒性和高反应性的活性氧(reactive oxygen species,ROS)被过度产生,引起植物发生防御应答反应,最终导致细胞出现过度氧化应激并死亡;而植物自身可在胁迫条件下积累具有抗病、抗虫、抗环境胁迫等生态学功能的次生代谢产物以提高抗逆性[10-12]。这可能是由于H2O2在信号传递过程中激活了由抗坏血酸过氧化物酶(ascorbate peroxidase,APX)、超氧化物歧化酶(superoxide dismutase,SOD)、过氧化氢酶(catalase,CAT)等防御酶组成的抗氧化酶保护系统[13-14]。当植物处于胁迫环境时,防御酶系会做出一系列反应[15]。防御酶活性与活性氧的清洁能力及抵抗胁迫的能力成正比。防御酶活性的变化也导致次级代谢产物的积累。Jumrani等[16]研究发现,温度从22 ℃升高到28 ℃,SOD、APX、POD的活性显著增加。常志凯等[17]通过研究指出高温胁迫诱导白桦悬浮细胞总三萜物质的合成与积累。有研究人员利用低温诱导的方法提高了拟南芥(Arabidopsis thaliana)类黄酮积累量和人参(Panax ginseng)须根总皂苷的积累量[18-19]。乌凤章等[20]通过研究发现,低温(4 ℃)导致白桦高生长基本停止,叶绿素含量逐渐降低。高温(45 ℃)处理可使白桦幼苗部分生长点、叶片边缘变褐[21]。可见,高温和低温胁迫均会对白桦生长和生理产生不利影响,但它对白桦丛生苗次生产物合成及抗逆酶积累有何影响尚不明确。
因此,本研究通过比较不同浓度6-BA作用下白桦丛生苗的生长状况,探究白桦丛生苗最佳培养条件。同时通过4种处理探究温度对白桦三萜、黄酮含量及防御酶活性的影响,以期为提高白桦次生代谢产物以及工厂化生产奠定基础。
1. 材料与方法
1.1 植物材料与培养
试验材料来源于东北林业大学森林生物工程学科培养的白桦愈伤组织。设4种处理,将生长状态良好的愈伤组织转移至附加0.5(T1)、1.0(T2)、2.0(T3)和5.0(T4) mg/L 6-苄氨基腺嘌呤(6-benzylaminopurine,6-BA)的NT固体基本培养基中诱导丛生苗。液体培养基为不加琼脂粉的T1培养基。培养条件为温度25 ℃,光照强度2 000 lx,光照时间16 h/d,湿度40% ~ 50%,摇床转速116 r/min。
白桦愈伤组织在不同激素浓度的NT培养基中被诱导,以4周为1个培养周期,经过两代的转接,建立稳定的丛生苗生长体系。接种5.0 g丛生苗在100 mL液体培养基中悬浮培养,以15 d为1个继代周期,转接6代以上,建立稳定的悬浮培养丛生苗体系。
1.2 不同温度胁迫处理
设置45 ℃ 1 h、45 ℃ 4 h、4 ℃ 1 h、4 ℃ 4 h和对照处理(25 ℃)5个水平处理,丛生苗悬浮培养第7天进行温度胁迫处理,分别在温度胁迫处理后0、6、12、24、48、72和96 h取样收获白桦丛生苗,每个处理重复3次。收获的丛生苗测定鲜质量后,一部分放在−80 ℃冰箱中进行保存,用于抗逆酶活性分析,一部分于烘箱中65 ℃进行烘干,用于测定齐墩果酸含量。
1.3 白桦丛生苗总三萜的提取及含量测定
总三萜的提取及含量测定参考王博等[22]的方法。取2 mL 95%乙醇加入0.05 g丛生苗干样浸泡24 h,70 ℃水浴1 h,超声40 min。吸取上清液100 µL,水浴蒸干。加200 µL 5 %香草醛-冰乙酸溶液、800 µL HCLO4,70 ℃水浴15 min后置于冰上迅速冷却。加乙酸乙酯定容至5 mL。利用分光光度计测定其在551 nm处的吸光值。
1.4 齐墩果酸的提取及含量测定
齐墩果酸的提取方法参照谭朝阳等[23]的方法。丛生苗干样研磨成粉,称取0.50 g,加入25 mL盐酸−乙醇溶液(2∶8),加热回流3 h,放冷,摇匀并过滤,取滤液15 mL,加蒸馏水15 mL,80 ℃水浴蒸去乙醇,然后用乙醚萃取3次,每次20 mL,合并乙醚萃取液并于40 ℃低温蒸干,加1 mL甲醇溶解残渣,利用高效液相色谱检测210 nm处的吸光峰,并计算含量。
1.5 黄酮的提取及含量测定
丛生苗干样研磨成粉,称取0.20 g,加入20 mL 50%乙醇,超声90 min,过滤并定容至25 mL。取4 mL,置于250 mL容量瓶中,加5%亚硝酸钠溶液1 mL,摇匀静置6 min,再加入10%硝酸铝溶液1 mL,摇匀静置6 min,加10%氢氧化钠10 mL,并用50%乙醇定容至刻度,摇匀静置15 min。利用分光光度仪测定551 nm的吸光值,并计算含量。
1.6 防御酶活性测定
酶液A:称取0.20 g丛生苗鲜样置于研钵后,加4.0 mL提酶缓冲液在冰上进行研磨,研磨充分后12 000 r/min离心10 min。酶液B:取0.30 g植物组织鲜样,加入3 mL提酶液,冰浴中充分研磨后,离心。使用酶液A,分别根据施特尔马赫·B[24],李合生[25]的方法测定CAT、SOD的活性。参照赵微[26]方法,使用酶液B测定APX的活性。
1.7 统计分析与关联分析
所得数据均使用office 2010 Excel软件及DPS统计软件进行数据处理和分析。
2. 结果与分析
2.1 丛生苗诱导
将白桦愈伤组织分别转接至T2、T3、T4培养基中诱导丛生苗(图1)。通过观察,诱导培养基T3诱导丛生苗的效率最高,不仅生长速度快、长势好,不定芽诱导率、每块平均不定芽数显著优于其他诱导培养基(表1)。
![]() 图 1 白桦丛生苗诱导进程A. 愈伤组织细胞开始分化出芽(T2处理);B. 分化出芽的愈伤组织(T1处理);C. 丛生苗的悬浮培养。A, callus cells that begin to differentiate and bud (T2 treatment); B, differentiated callus (T1 treatment); C, suspension culture of cluster seedlings.Figure 1. Induction process of multiple shoots of birch表 1 白桦愈伤组织不定芽分化Table 1. Differentiation of adventitiousbuds from birch callus
图 1 白桦丛生苗诱导进程A. 愈伤组织细胞开始分化出芽(T2处理);B. 分化出芽的愈伤组织(T1处理);C. 丛生苗的悬浮培养。A, callus cells that begin to differentiate and bud (T2 treatment); B, differentiated callus (T1 treatment); C, suspension culture of cluster seedlings.Figure 1. Induction process of multiple shoots of birch表 1 白桦愈伤组织不定芽分化Table 1. Differentiation of adventitiousbuds from birch callus处理
Treatment6-BA质量浓度
6-BA mass
concentration/
(mg·L−1)不定芽诱导率
Adventitious
bud induction
rate/%每块平均不定芽数
Average number
of adventitious
buds per pieceT2 1.0 46.67 3 T3 2.0 63.33 6 T4 5.0 53.33 4 2.2 白桦丛生苗悬浮培养体系生长曲线
将白桦愈伤组织接种于诱导培养基T3中诱导,产生白桦丛生苗,继代两次后转移至固体培养基T1中扩繁,将上述丛生苗接种于液体培养基中,培养35 d,每隔5 d取样1次。在5 ~ 25 d其干物质的积累呈线性增加,且第25天达到峰值,5 ~ 15 d增长速率最快,25 ~ 35 d因培养液中营养物质消耗殆尽,白桦丛生苗干物质积累也逐渐降低(图2)。
![]() 图 2 悬浮培养的白桦丛生苗的生长曲线Figure 2. Growth curve of birch multiple shoots in suspension culture
图 2 悬浮培养的白桦丛生苗的生长曲线Figure 2. Growth curve of birch multiple shoots in suspension culture2.3 白桦丛生苗的三萜、齐墩果酸含量的积累
白桦丛生苗悬浮培养至第10天总三萜含量达到最高76.41 mg/g,其次继代30 d时总三萜含量到达第2个峰值73.95 mg/g。5 ~ 10 d积累速率最大,从整体上看总三萜积累比较稳定,且积累量较高(图3A)。
![]() 图 3 悬浮培养的白桦丛生苗总三萜、齐墩果酸含量变化不同小写字母表示不同组织部位的基因表达差异显著性(P < 0.05)。Different lowercase letters indicate significant differences in gene expression at varied tissue sites (P < 0.05).Figure 3. Contents of total triterpenoids and oleanolic acid in suspension cultured multiple shoots of birch
图 3 悬浮培养的白桦丛生苗总三萜、齐墩果酸含量变化不同小写字母表示不同组织部位的基因表达差异显著性(P < 0.05)。Different lowercase letters indicate significant differences in gene expression at varied tissue sites (P < 0.05).Figure 3. Contents of total triterpenoids and oleanolic acid in suspension cultured multiple shoots of birch齐墩果酸含量的积累在悬浮培养5 ~ 15 d、25 ~ 30 d呈上升趋势,5 ~ 15 d积累速率最大,且第15天齐墩果酸的积累量最高,15 ~ 25 d齐墩果酸含量逐渐下降,分析原因可能是5 ~ 15 d碳源充足有利于次生产物合成,培养15 d后因碳源消耗而有所降低,20 d后因营养缺乏导致胁迫造成了初生生长降低而刺激次生产物再次合成(图3B)。
2.4 温度胁迫对白桦丛生苗三萜和黄酮物质积累的调节效应
为进一步刺激次生代谢产物合成,对上述的白桦丛生苗在悬浮培养至第7天施加4种不同温度胁迫处理,同时测定胁迫后细胞的抗逆酶SOD、CAT和APX活性的变化。结果表明,热刺激比冷胁迫对于总三萜含量的提高更有利。45 ℃处理白桦丛生苗4 h后恢复培养6 h取样,发现总三萜含量增幅最大,比对照(CK)提高5.03倍,在恢复培养24 h时达到峰值,且相比CK提高了23.42%。4种处理下总三萜含量在恢复培养96 h,均高于CK。45 ℃处理1 h的白桦组培苗在恢复培养48 h总三萜含量达到最高,比CK提高34.89%(图4A)。
![]() 图 4 温度胁迫下白桦丛生苗三萜和黄酮积累Figure 4. Accumulation of triterpenoids and flavonoids in birch multiple shoots under temperature stress
图 4 温度胁迫下白桦丛生苗三萜和黄酮积累Figure 4. Accumulation of triterpenoids and flavonoids in birch multiple shoots under temperature stress温度胁迫后12 ~ 24 h齐墩果酸含量显著均高于CK。4 ℃处理白桦丛生苗1 h后,在恢复培养24 h取样齐墩果酸含量比CK提高14.52倍。齐墩果酸含量最高的是45 ℃热处理白桦丛生苗1 h,在恢复培养72 h时,其含量为2.33 mg/g,比CK提高10.56倍。4 ℃胁迫1 h较4 h处理测得的齐墩果酸含量增加显著(图4B)。上述分析显示,两种温度胁迫处理总三萜含量比对照提高0.017 4 ~ 5.03倍,其含量最高可达62.25 mg/g;齐墩果酸含量较对照提高0.007 5 ~ 14.52倍,最高含量达2.33 mg/g。
温度胁迫处理白桦组培苗在恢复培养6 h和48 h时黄酮含量均超过CK。其中45 ℃处理白桦丛生苗4 h后,恢复培养6 h时黄酮含量最高,达到3.99 mg/g,比CK高32.14%。4 ℃处理白桦丛生苗4 h,在恢复培养48 h时,白桦丛生苗中的黄酮含量比CK提高38.37%。无论何种处理在恢复培养48 ~ 96 h,黄酮含量均呈下降趋势(图4C)。可见,不同温度胁迫下早期(6 ~ 48 h)对悬浮培养白桦丛生苗总黄酮积累最有利。
2.5 温度胁迫对白桦丛生苗抗逆酶活性的调节效应
在恢复培养后0 ~ 24 h无论何种处理SOD活性与CK相比均无显著变化,24 h后SOD活性显著增强,除4 ℃胁迫白桦丛生苗1 h外,其余3种胁迫下在24 ~ 48 h SOD活性均比CK显著提高,而4 ℃胁迫4 h的白桦丛生苗在72 h活性最高,比CK提高69.77%。在恢复培养后期SOD活性均有降低(图5A)。
![]() 图 5 温度胁迫下白桦丛生苗SOD、CAT、APX活性的变化APX. 抗坏血酸过氧化物酶;SOD. 超氧化物歧化酶;CAT. 过氧化氢酶。APX, ascorbate peroxidase; SOD, superoxide dismutase; CAT, catalase.Figure 5. Activity of SOD, CAT, APX of birch multiple shoots under temperature stress
图 5 温度胁迫下白桦丛生苗SOD、CAT、APX活性的变化APX. 抗坏血酸过氧化物酶;SOD. 超氧化物歧化酶;CAT. 过氧化氢酶。APX, ascorbate peroxidase; SOD, superoxide dismutase; CAT, catalase.Figure 5. Activity of SOD, CAT, APX of birch multiple shoots under temperature stress温度胁迫下白桦丛生苗CAT活性较稳定,在恢复培养0 ~ 12 h CAT活性均低于CK,48 h各处理较CK均有提高,但不显著。在恢复培养96 h,仅低温胁迫下处理的白桦丛生苗CAT活性高于CK,经低温处理1 h的丛生苗在96 h CAT活性达到最高峰,是CK的1.81倍。低温胁迫更有利于提高CAT活性(图5B)。
白桦组培苗热处理1 h后恢复培养0 h APX活性比CK高35.22%,其他处理活性均低于CK。在12、48 h各胁迫处理下APX活性均受抑制。仅在恢复培养96 h时各温度胁迫均有不同程度提高。上述分析结果表明,温度胁迫处理1 h更有利于APX活性的提高(图5C)。
温度胁迫对白桦丛生苗次生代谢产物含量与抗逆酶活性相关分析结果表明,温度胁迫处理1 h,白桦丛生苗总三萜、黄酮、齐墩果酸之间及其与抗逆酶活性的相关性不显著。分析可能是胁迫时间较短导致胁迫强度较低,无法使次生代谢物积累显著,防御酶活性显著增加。而在温度胁迫4 h后再恢复正常温度处理时各指标之间相关性显著提高,如45 ℃处理4 h下黄酮含量与APX酶、SOD与齐墩果酸含量均呈显著负相关(P < 0.05)(表2)。白桦丛生苗4 ℃处理4 h后恢复培养,总三萜与APX(P < 0.01)、CAT(P < 0.05)之间分别呈极显著正相关和显著正相关;黄酮与SOD活性呈显著负相关(P < 0.05);CAT与APX(P < 0.01)、SOD(P < 0.05)相关性达极显著和显著水平(表3),也说明3种防御酶协同发挥作用。
表 2 45 ℃胁迫4 h下白桦丛生苗次生产物含量与抗逆酶活性相关分析Table 2. Correlation analysis of secondary production content and anti-stress enzymeactivity of birch multiple shoots under 45 ℃ for 4 h项目
Item总三萜
Total triterpenoids齐墩果酸
Oleanolic acid黄酮
FlavonoidAPX SOD CAT 总三萜 Total triterpenoids 1.00 −0.55 0.25 −0.54 0.26 −0.02 齐墩果酸 Oleanolic acid 1.00 0.30 −0.10 −0.84* −0.41 黄酮 Flavonoid 1.00 −0.79* −0.24 −0.69 APX 1.00 0.30 0.08 SOD 1.00 0.43 CAT 1.00 注:*表示处理间显著相关(P < 0.05)。下同。Notes: * means significant correlation between treatments (P < 0.05). Same as below. 表 3 4 ℃胁迫4 h处理下白桦丛生苗次生产物含量与抗逆酶活性相关分析Table 3. Correlation analysis of secondary production content and anti-stress enzyme activity of birch multiple shoots at 4 ℃ for 4 h项目
Item总三萜
Total triterpenoids齐墩果酸
Oleanolic acid黄酮
FlavonoidAPX SOD CAT 总三萜 Total triterpenoids 1.00 0.57 −0.27 0.89** 0.49 0.81* 齐墩果酸 Oleanolic acid 1.00 0.21 0.35 0.17 0.51 黄酮 Flavonoid 1.00 −0.37 −0.80* −0.46 APX 1.00 0.69 0.96** SOD 1.00 0.77* CAT 1.00 注:**表示处理间极显著相关(P < 0.01)。Notes: ** means extremely significant correlation between treatments (P < 0.01). 3. 讨 论
丛生苗具有再生频率高、耗时短等优点,而广泛用于各种研究中。本研究确定附加2.0 mg/L 6-BA的NT固体培养基为白桦愈伤组织诱导形成丛生苗最佳培养基。此外,明确了1个培养周期中三萜积累动态,总三萜、齐墩果酸、黄酮分别在第10、15、20 天积累量最高。
本实验室前期完成了关于利用白桦细胞、植株进行三萜合成调控的大量研究,并取得一定进展[27-28]。马泓思等[27]利用MeJA处理白桦悬浮细胞,总三萜含量最高可达46.90 mg/g。本次研究利用白桦丛生苗悬浮培养,总三萜含量达到最高76.41 mg/g(10 d)。可见,以白桦丛生苗为试材相比白桦细胞悬浮培养能够获得更高含量的总三萜。苏欣等[28]以3年生白桦为试材,对白桦枝皮和叶进行检测,结果显示总三萜含量最高达168.17 mg/g,齐墩果酸含量最高达37.51 mg/g,明显高于本研究中丛生苗中三萜含量,但白桦丛生苗再生体系具有培养耗时短,再生频率高,产生的次生代谢产物稳定,不受季节、地域及虫害影响等优点,而白桦树木需要培育多年,才能获得较高含量的三萜物质。因此,白桦丛生苗的诱导及悬浮培养体系的建立无疑是有更广阔的应用前景。
温度胁迫诱导后植物细胞会在基因、酶和次生代谢水平上发生变化[29]。有研究发现,胡萝卜根中的萜类化合物含量随温度升高而升高。姜艳等[30]研究表明,低温可以通过诱导参与黄酮合成的酶的活性来增加植物中类黄酮的含量。人参三萜类皂苷生物合成途径中的关键酶达玛烯二醇合酶(dammarenediol synthase,DDS)使经过低温处理后其表达量迅速增加,进而提高人参皂苷产量[31-32]。
当植物面临胁迫时会产生过量的活性氧,对正常的细胞代谢造成干扰,同时激活植物体内的抗氧化系统,使得SOD、CAT、APX等抗氧化酶活性发生变化,进一步清除植物体内活性氧,从而抵御活性氧带来的损伤。抗氧化酶活性的提高可以增强植物体抵抗温度胁迫的能力[33-34]。SOD是能够将超氧阴离子自由基歧化生成H2O2的一种极其重要的抗氧化酶[35]。H2O2继续被CAT和APX催化,生成分子氧和水[36]。有研究表明SOD、APX、CAT等抗逆酶与次生代谢产物的产生有关。抗逆酶能够诱导植物激素及活性物质的生成,使植物体内源激素水平发生变化,进一步激活相关酶基因的表达,使关键酶被合成,进而调节次生代谢物积累[37]。同时,也有研究指出,在逆境胁迫下植物体内产生ROS,当植物体内含有较低的ROS时抗逆酶发挥作用。当植物体内的ROS含量过高,植物体内就会产生多种次生代谢产物对抗逆境胁迫[38]。
刘文盈[39]研究表明黑果枸杞(Lycium ruthenicum)愈伤组织通过CAT和APX活性变化迅速抵御低温伤害。Li等[40]将菠菜(Spinacia oleracea)进行热处理,发现APX活性增强。高慧如等[41]研究发现,黄酮类化合物与甘草抗氧化酶保护系统通过清除活性氧起到保护植物的作用。本研究通过不同温度胁迫处理白桦丛生苗,结果显示,温度胁迫可有效促进次生代谢产物合成。45 ℃处理白桦丛生苗1 h后,恢复培养48 h总三萜含量最高,为62.25 mg/g,比CK提高34.89%。45 ℃处理1 h的白桦丛生苗,在恢复培养72 h齐墩果酸含量最高,达2.33 mg/g,比对照高10.56倍。黄酮含量在45 ℃处理白桦丛生苗4 h后恢复培养6 h可达最高,为3.99 mg/g,比对照提高32.14%。同时发现,不同温度胁迫下白桦丛生苗3种抗逆酶活性高峰与变化趋势不同,说明SOD、CAT、APX 3种防御酶在抵御温度胁迫时相互协调共同发挥作用。防御酶活性与次生代谢产物含量相关分析表明:胁迫时间越长,防御酶活性与次生代谢物含量存在的相关性越显著。例如,45 ℃胁迫4 h,黄酮与APX呈显著负相关。4 ℃胁迫处理4 h总三萜含量与APX、CAT呈极显著或显著正相关。而两种温度胁迫1 h处理下相关性不显著。分析原因可能是胁迫时间过短,抗逆酶及次生产物合成没被充分激活,导致相关性不显著。
4. 结 论
本研究通过比较不同激素处理,确定从白桦愈伤组织到丛生苗最佳诱导培养基是附加2 mg/L 6-BA的NT固体培养基。提出了使用温度处理提高白桦丛生苗中总三萜、齐墩果酸和黄酮含量的方法。同时明确温度胁迫下SOD、CAT、APX 3种抗逆酶协调发挥作用共同参与次生产物合成。该研究方法无污染、低成本、可操作性强,效率高,为解决天然植物药物来源紧缺和工业化大规模生产白桦活性物质提供了一种新途径。
-
![]()
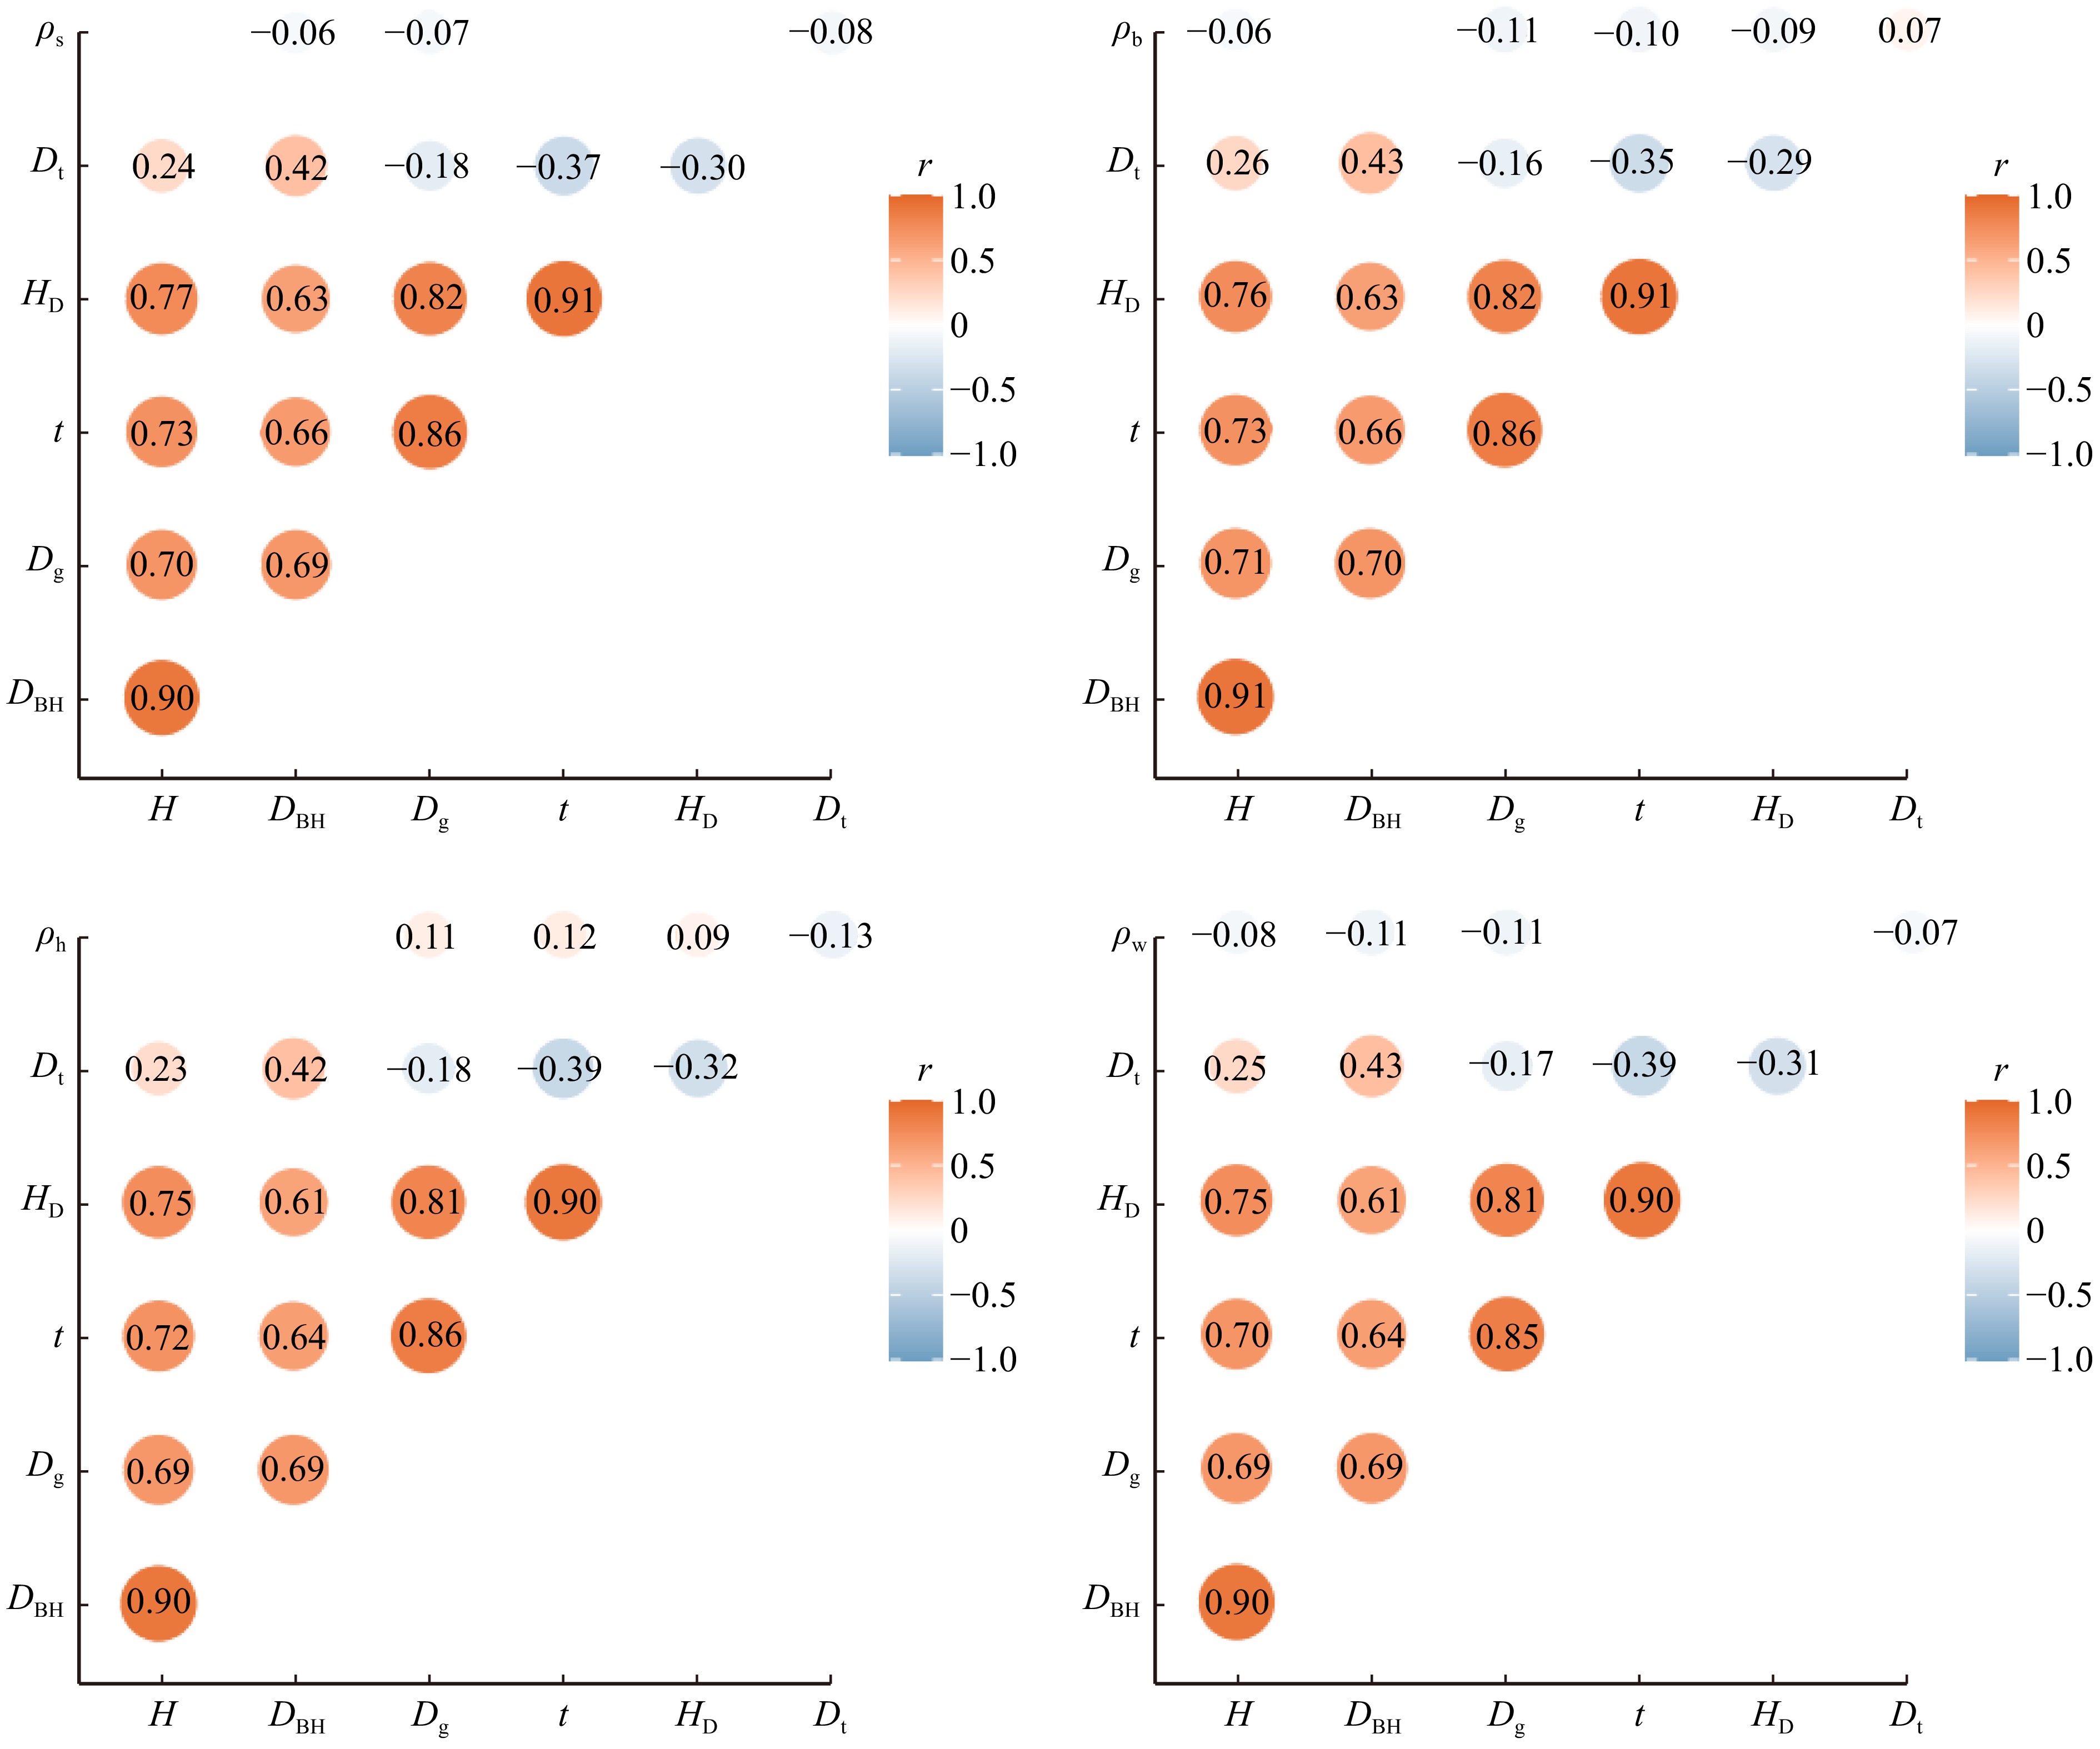
图 1 变量间的相关关系
ρs为边材密度,ρh为心材密度,ρb为树皮密度,ρw为树干密度,t为树龄,H为树高,Dt为胸径平均生长量,Dg为林分平均胸径,DBH为胸径,HD为林分平均高。蓝色代表负相关,红色代表正相关,P < 0.05。ρs is sapwood density, ρh is heartwood density, ρb is bark density, ρw is stem density, t is tree age, H is tree height, Dt is the average growth of DBH, Dg is the average DBH of stand, DBH is the diameter at breast height, and HD is the average height of stand. Blue represents negative correlation, and red represents positive correlation, P < 0.05.
Figure 1. Correlations among variables
![]()
图 2 边材、心材、树皮和树干密度与变量间的关系
横坐标0和1.0分别代表树干基部和树梢。Dt和t的单位分别为cm/a和a;The abscissa numbers 0 and 1.0 stand for the base of stem and the treetop, respectively. The units of Dt and t are cm/year and year.
Figure 2. Relationship of sapwood, heartwood, bark and stem density with variables
![]()
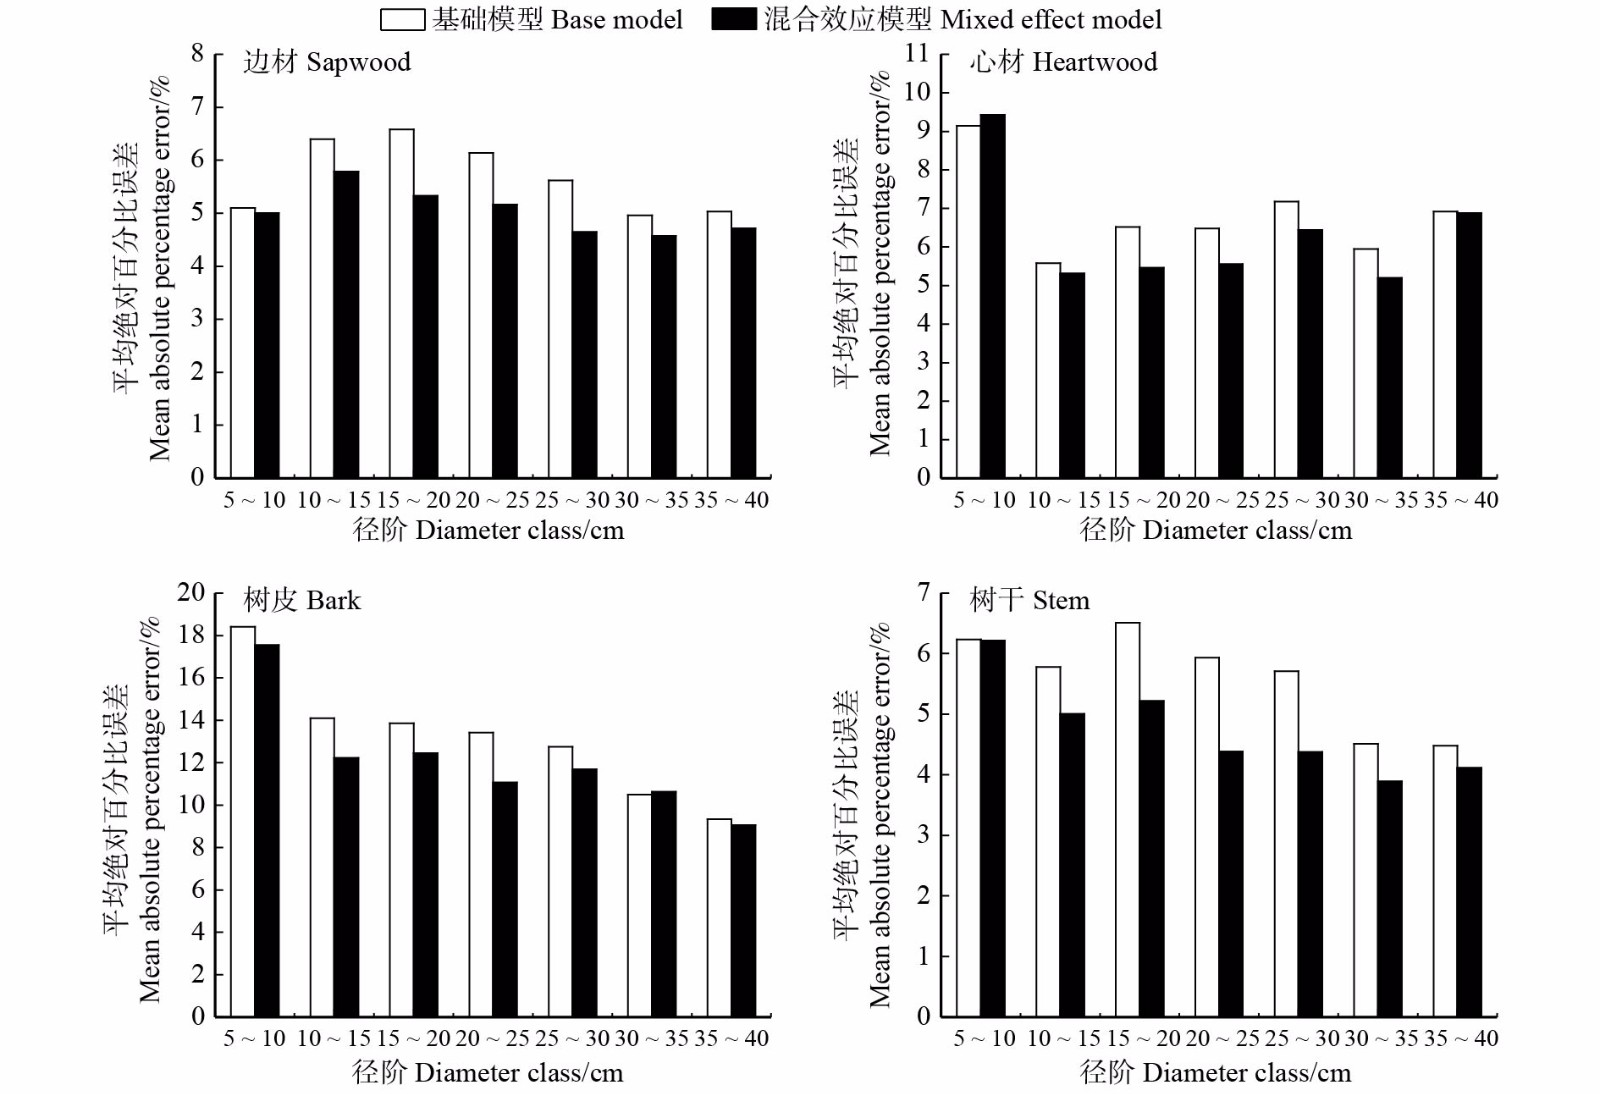
图 3 不同径阶的边材、心材、树皮和树干密度的平均绝对百分比误差
Figure 3. Mean absolute percentage error of sapwood, heartwood, bark and stem density of different diameter classes
表 1 各林场相关的立地因子
Table 1 Site factors related to each forest farm
林场 Forest farm 地形 Terrain 海拔 Altitude/m 坡度 Slope 坡向 Aspect 坡位 Slope position 尚志林场 Shangzhi Forest Farm 山坡 Hillside 201 ~ 319 0° ~ 5°、5° ~ 15° 阳、阴 Sunny, shady 中下 Lower-middle 元宝林场 Yuanbao Forest Farm 平地 Flat 206 ~ 245 0° ~ 5° 平 Flat 老街基林场 Laojieji Forest Farm 平地 Flat 300 0° ~ 5° 平 Flat 苇河林场 Weihe Forest Farm 山坡 Hillside 260 ~ 324 0° ~ 5°、5° ~ 10° 阳、阴 Sunny, shady 中下 Lower-middle  下载: 导出CSV
表 2 林分因子和解析木因子基本信息统计表
Table 2 Statistical table for basic information of stand factors and analytical wood factors
因子 Factor 最小值 Min. value 最大值 Max. value 平均值 Mean SD 林分因子
Stand factor林分年龄/a Stand age/year 10 26 18 5 平均胸径 Average DBH/cm 13.3 30.6 20.6 5.3 平均树高 Average tree height/m 11.9 26.2 20.3 4.1 林分密度/(株·hm−2) Stand density/(tree·ha−1) 183 933 572 267 树木因子
Tree factor树木年龄/a Tree age/year 10 26 18 5 胸径 DBH/cm 6.2 37.5 21.6 6.4 树高 Tree height/m 8.9 28.9 21.1 4.2 边材密度 Sapwood density/(g·cm−3) 0.27 0.53 0.36 0.03 心材密度 Heartwood density/(g·cm−3) 0.26 0.50 0.33 0.03 树皮密度 Bark density/(g·cm−3) 0.20 0.55 0.37 0.07 树干密度 Stem density/(g·cm−3) 0.27 0.51 0.36 0.03
下载: 导出CSV
表 3 边材、心材、树皮和树干密度混合效应beta回归模型的拟合优度比较
Table 3 Goodness of fit comparison of beta regression models for mixed effects of sapwood, heartwood, bark and stem density
部位 Part 模型编号
Model No.随机效应 Random effect 评价指标 Evaluation index Hr Hr 2 Dt t DBH −2ln L AIC BIC Ra 2 RL P 边材
Sapwood0 − − − −7 988.27 −7 978.27 −7 950.60 0.31 1 − −△ − −8 316.71 −8 304.71 −8 289.71 0.50 2 −△ − − −8 417.79 −8 405.79 −8 390.79 0.53 心材
Heartwood0 − − − −6 012.41 −6 002.41 −5 976.12 0.19 1 − −△ − −6 237.85 −6 225.85 −6 210.85 0.41 2 − − −△ −6 324.63 −6 312.63 −6 297.63 0.46 3 −△ − − −6 291.24 −6 279.24 −6 264.24 0.44 4 −△ − −△ −6 383.05 −6 367.05 −6 347.05 0.52 58.42 < 0.001 树皮
Bark0 − − − −4 887.39 −4 877.39 −4 850.11 0.29 1 −△ − − −5 069.36 −5 057.36 −5 042.36 0.44 2 − − −△ −5 106.94 −5 094.94 −5 079.94 0.46 3 − −△ − −5 030.85 −5 018.85 −5 003.85 0.42 4 −△ −△ − −5 163.77 −5 147.77 −5 127.77 0.52 56.83 < 0.001 树干
Stem0 − − − −7 377.79 −7 367.79 −7 340.53 0.36 1 − −△ − −7 566.35 −7 554.35 −7 539.35 0.50 2 − − −△ −7 736.63 −7 724.63 −7 709.63 0.56 3 −△ − − −7 651.70 −7 639.70 −7 624.70 0.53 4 − −△ −△ −7 840.39 −7 824.39 −7 804.39 0.63 5 −△ − −△ −7 822.19 −7 806.19 −7 786.19 0.62 103.76 < 0.001 注:△代表在该变量上添加随机效应,−代表模型固定效应的自变量。Hr代表相对高,Hr 2代表相对高的平方,Dt代表胸径平均生长量,t代表树龄,DBH代表胸径,−2ln L代表负二倍的对数似然值,AIC代表赤池信息准则,BIC代表贝叶斯信息准则,Ra 2代表调整确定系数,RL代表似然比。Notes: △ stands for adding random effects to this variable, − stands for the independent variables of the model fixed effect, Hr stands for the relative height, Hr 2 stands for the square of relative height, Dt stands for the average growth of DBH, t stands for the tree age, DBH stands for diameter at breast height, −2ln L stands for the −2 log likelihood value, AIC stands for the akaike information criterion, BIC stands for the Bayesian information criterion, Ra 2 stands for the adjusted determination coefficient, RL stands for the likelihood ratio.
下载: 导出CSV
表 4 边材、心材、树皮和树干密度最优混合效应模型的固定效应参数估计值、随机效应方差协方差结构
Table 4 Estimated values of fixed effect parameters, random effect variance covariance structure for optimal mixed-effects model of sapwood, heartwood, bark and stem density
参数 Parameter 边材 Sapwood 心材 Heartwood 树皮 Bark 树干 Stem 固定效应参数估计值
Estimated value of fixed effect parameterβ0 −0.543 9***(0.016 3) −0.598 3***(0.028 9) −0.800 0***(0.039 6) −0.611 5***(0.025 9) β1 0.471 8***(0.032 1) 0.709 0***(0.059 2) 1.678 4***(0.099 3) 0.241 6***(0.037 6) β2 −0.201 2***(0.034 2) −0.082 1**(0.026 1) −1.320 6***(0.111 3) −0.003 6***(0.000 1) β3 −0.065 3***(0.012 8) −0.288 7***(0.046 9) −0.005 1*(0.001 9) 0.094 4**(0.031 7) 随机效应方差协方差结构
Random effect variance covariance structureσ21 0.016 1 0.423 4 0.003 3 0.020 7 σ22 0.601 8 0.018 8 0.000 0 σ21 −0.478 6 −0.002 1 −0.000 3 模型方差 Model variance 0.010 4 0.010 0 0.044 3 0.008 8 注:β0代表模型固定效应通式(式(13))中的截距,β1、β2和β3代表模型固定效应通式中自变量前的系数,σ21和σ22代表模型随机效应的残差方差,σ21代表模型随机效应的残差协方差,***代表P < 0.001,**代表P < 0.01,*代表P < 0.05。Notes: β0 stands for the intercept in the general formula of the fixed effect of the model (equation (13)); β1, β2 and β3 represent the coefficients before the independent variables in the fixed effects general formula of the model; σ21andσ22 stand for residual variance of model random effect, σ21 stands for residual covariance of model random effects. *** stands for P < 0.001, ** stands for P < 0.01, * stands for P < 0.05.
下载: 导出CSV
表 5 基础模型与混合效应模型检验指标的比较
Table 5 Comparison of test indexes between base models and mixed effect models
部位 Part 基础模型 Base model 混合效应模型 Mixed effect model MAE/(g·cm−3) MAPE/% MAE/(g·cm−3) MAPE/% 边材 Sapwood 0.022 1 6.069 1 0.018 8 5.155 1 心材 Heartwood 0.022 3 6.584 6 0.019 6 5.728 1 树皮 Bark 0.046 7 13.271 2 0.041 0 11.751 0 树干 Stem 0.021 5 5.953 3 0.017 0 4.692 0 注:MAE为平均绝对误差,MAPE为平均绝对百分比误差。Notes:MAE is mean absolute error, and MAPE is mean absolute percentage error.
下载: 导出CSV
表 6 混合效应模型抽样方案的MAPE检验指标统计
Table 6 MAPE test index statistics of sampling plans for mixed-effect model
% 方案−抽样数量
Plan-sampling size边材 Sapwood 心材 Heartwood 树皮 Bark 树干 Stem Ⅰ-0 6.069 1 6.582 3 13.275 2 5.949 2 Ⅰ-1 6.056 2 6.599 8 13.345 3 5.964 5 Ⅰ-2 6.055 2 6.563 9 13.303 0 5.946 1 Ⅰ-3 6.050 6 6.547 5 13.288 3 5.937 7 Ⅰ-4 6.046 6 6.536 1 13.272 3 5.933 4 Ⅰ-5 6.045 6 6.534 1 13.272 2 5.930 8 Ⅰ-6 6.045 4 6.530 6 13.266 7 5.930 1 Ⅱ-1 5.968 7(1.0) 6.517 3(1.3) 13.232 9(2.0) 5.918 2(1.0) Ⅱ-2 5.966 0(0, 1.0) 6.474 1(0, 1.3) 13.232 4(0, 2.0) 5.926 1(1.0, 1.3) Ⅱ-3 5.968 7(0, 1.0, 1.3) 6.400 0(0, 1.0, 1.3) 13.238 9(0, 2.0, 1.3) 5.949 1(1.0, 1.3, 2.0) Ⅱ-4 6.040 4(0, 1.0, 1.3, 2.0) 6.670 0(0, 1.0, 1.3, 2.0) 13.249 7(0, 1.0, 1.3, 2.0) 5.950 8(0, 1.0, 1.3, 2.0) 注:表内括号中的内容代表取样圆盘高度(m)。Note: content in parenth stands for the height of the sampling disc (m).
下载: 导出CSV
-
[1] Nelson R A, Francis E J, Berry J A, et al. The role of climate niche, geofloristic history, habitat preference, and allometry on wood density within a California plant community[J]. Forests, 2020, 11(1): 105. doi: 10.3390/f11010105
[2] Krajnc L, Hafner P, Gricar J. The effect of bedrock and species mixture on wood density and radial wood increment in pubescent oak and black pine[J]. Forest Ecology and Management, 2021, 481: 118753. doi: 10.1016/j.foreco.2020.118753
[3] Vanninen P, Makela A. Needle and stem wood production in Scots pine (Pinus sylvestris) trees of different age, size and competitive status[J]. Tree Physiology, 2000, 20(8): 527−533. doi: 10.1093/treephys/20.8.527
[4] Francis E J, Muller-Landau H C, Wright S J, et al. Quantifying the role of wood density in explaining interspecific variation in growth of tropical trees[J]. Global Ecology and Biogeography, 2017, 26(10): 1078−1087. doi: 10.1111/geb.12604
[5] Sarmiento C, Patino S, Paine C E T, et al. Within-individual variation of trunk and branch xylem density in tropical trees[J]. American Journal of Botany, 2011, 98(1): 140−149. doi: 10.3732/ajb.1000034
[6] Vieilledent G, Fischer F J, Chave J, et al. New formula and conversion factor to compute basic wood density of tree species using a global wood technology database[J]. American Journal of Botany, 2018, 105(10): 1653−1661. doi: 10.1002/ajb2.1175
[7] Wright S J, Kitajima K, Kraft N J B, et al. Functional traits and the growth-mortality trade-off in tropical trees[J]. Ecology, 2010, 91(12): 3664−3674. doi: 10.1890/09-2335.1
[8] Santiago L S, Goldstein G, Meinzer F C, et al. Leaf photosynthetic traits scale with hydraulic conductivity and wood density in Panamanian forest canopy trees[J]. Oecologia, 2004, 140(4): 543−550. doi: 10.1007/s00442-004-1624-1
[9] Meinzer F C, Campanello P I, Domec J C, et al. Constraints on physiological function associated with branch architecture and wood density in tropical forest trees[J]. Tree Physiology, 2008, 28(11): 1609−1617. doi: 10.1093/treephys/28.11.1609
[10] Zimprich D. Modeling change in skewed variables using mixed beta regression models[J]. Research in Human Development, 2010, 7(1): 9−26. doi: 10.1080/15427600903578136
[11] Fayolle A, Doucet J L, Gillet J F, et al. Tree allometry in Central Africa: testing the validity of pantropical multi-species allometric equations for estimating biomass and carbon stocks[J]. Forest Ecology and Management, 2013, 305: 29−37. doi: 10.1016/j.foreco.2013.05.036
[12] Jacobsen A L, Agenbag L, Esler K J, et al. Xylem density, biomechanics and anatomical traits correlate with water stress in 17 evergreen shrub species of the Mediterranean-type climate region of South Africa[J]. Journal of Ecology, 2007, 95(1): 171−183. doi: 10.1111/j.1365-2745.2006.01186.x
[13] 罗云建. 华北落叶松人工林生物量碳计量参数研究[D]. 北京: 中国林业科学研究院, 2007. Luo Y J. Study on biomass carbon accounting factors of Larix principis-rupprechtii plantation[D]. Beijing: Chinese Academy of Forestry, 2007.
[14] Guilley E, Hervé J C, Huber F, et al. Modelling variability of within-ring density components in Quercus petraea Liebl. with mixed-effect models and simulating the influence of contrasting silvicultures on wood density[J]. Annals of Forest Science, 1999, 56: 449−458.
[15] Poorter L, Wright S J, Paz H, et al. Are functional traits good predictors of demographic rates? Evidence from five neotropical forests[J]. Ecology, 2008, 89(7): 1908−1920. doi: 10.1890/07-0207.1
[16] Virgulino P C C, Gardunho D C L, Silva D N C, et al. Wood density in mangrove forests on the Brazilian Amazon coast[J]. Trees-Structure and Function, 2020, 34(1): 51−60. doi: 10.1007/s00468-019-01896-5
[17] Kimberley M O, Mckinley R B, Cown D J, et al. Modelling the variation in wood density of New Zealand-grown douglas-fir[J]. New Zealand Journal of Forestry Science, 2017, 47(1): 15. doi: 10.1186/s40490-017-0096-0
[18] 方升佐, 杨文忠. 杨树无性系木材基本密度和纤维素含量株内变异[J]. 植物资源与环境学报, 2004, 13(1): 19−23. doi: 10.3969/j.issn.1674-7895.2004.01.005 Fang S Z, Yang W Z. Within tree variation in wood basic density and cellulose content of poplar clones[J]. Journal of Plant Resources and Environment, 2004, 13(1): 19−23. doi: 10.3969/j.issn.1674-7895.2004.01.005
[19] 彭雨欣, 李凤日, 刘福, 等. 人工长白落叶松树干边材、心材和树皮密度预测模型[J]. 应用生态学报, 2020, 31(4): 1113−1120. doi: 10.13287/j.1001-9332.202004.007 Peng Y X, Li F R, Liu F, et al. Prediction models of sapwood density, heartwood density, and bark density in Larix olgensis plantation[J]. Chinese Journal of Applied Ecology, 2020, 31(4): 1113−1120. doi: 10.13287/j.1001-9332.202004.007
[20] 姜立春, 刘铭宇, 刘银帮. 落叶松和樟子松木材基本密度的变异及早期选择[J]. 北京林业大学学报, 2013, 35(1): 1−6. doi: 10.13332/j.1000-1522.2013.01.014 Jiang L C, Liu M Y, Liu Y B. Variation of wood basic density and early selection of dahurian larch and Mongolian pine[J]. Journal of Beijing Forestry University, 2013, 35(1): 1−6. doi: 10.13332/j.1000-1522.2013.01.014
[21] Iida Y, Poorter L, Sterck F J, et al. Wood density explains architectural differentiation across 145 co-occurring tropical tree species[J]. Functional Ecology, 2012, 26(1): 274−282. doi: 10.1111/j.1365-2435.2011.01921.x
[22] Zhang S Y, Owoundi R E, Nepveu G, et al. Modelling wood density in European oak (Quercus petraea and Quercus robur) and simulating the silvicultural influence[J]. Canadian Journal of Forest Research, 1993, 23: 2587−2593. doi: 10.1139/x93-320
[23] Vaughan D, Auty D, Kolb T E, et al. Climate has a larger effect than stand basal area on wood density in Pinus ponderosa var. scopulorum in the southwestern USA[J]. Annals of Forest Science, 2019, 76(3): 85. doi: 10.1007/s13595-019-0869-0
[24] Wassenberg M, Chiu H S, Guo W F, et al. Analysis of wood density profiles of tree stems: incorporating vertical variations to optimize wood sampling strategies for density and biomass estimations[J]. Trees-Structure and Function, 2015, 29(2): 551−561. doi: 10.1007/s00468-014-1134-7
[25] Krajnc L, Farrelly N, Harte A M. The influence of crown and stem characteristics on timber quality in softwoods[J]. Forest Ecology and Management, 2019, 435: 8−17. doi: 10.1016/j.foreco.2018.12.043
[26] Deng X, Zhang L, Lei P F, et al. Variations of wood basic density with tree age and social classes in the axial direction within Pinus massoniana stems in Southern China[J]. Annals of Forest Science, 2013, 71(4): 505−516.
[27] 徐有明, 林汉, 江泽慧, 等. 橡胶树生长轮宽度、木材密度变异及其预测模型的研究[J]. 林业科学, 2002, 38(1): 95−102. doi: 10.3321/j.issn:1001-7488.2002.01.015 Xu Y M, Lin H, Jiang Z H, et al. Variation of growth ring width and wood basic density of rubber tree and their modelling equations[J]. Scientia Silvae Sinicae, 2002, 38(1): 95−102. doi: 10.3321/j.issn:1001-7488.2002.01.015
[28] Ferrari S L P, Cribari-Neto F. Beta regression for modelling rates and proportions[J]. Journal of Applied Statistics, 2004, 31(7): 799−815. doi: 10.1080/0266476042000214501
[29] Eskelson B N I, Madsen L, Hagar J C, et al. Estimating riparian understory vegetation cover with beta regression and copula models[J]. Forest Science, 2011, 57(3): 212−221.
[30] Kimura J, Fujimoto T. Modeling the effects of growth rate on the intra-tree variation in basic density in hinoki cypress (Chamaecyparis obtusa)[J]. Journal Wood Science, 2014, 60(5): 305−312. doi: 10.1007/s10086-014-1416-0
[31] Repola J. Models for vertical wood density of Scots pine, Norway spruce and birch stems, and their application to determine average wood density[J]. Silva Fennica, 2006, 40(4): 673−685.
[32] Mutz R, Guilley E, Sauter U H, et al. Modelling juvenile-mature wood transition in Scots pine (Pinus sylvestris L.) using nonlinear mixed-effects models[J]. Annals of Forest Science, 2004, 61(8): 831−841. doi: 10.1051/forest:2004084
[33] Molteberg D, Hoibo A. Modelling of wood density and fibre dimensions in mature Norway spruce[J]. Canadian Journal of Forest Research, 2007, 37(8): 1373−1389. doi: 10.1139/X06-296
[34] Mohsenkhani Z F, Mohhamadzadeh M, Baghfalaki T. Augmented mixed beta regression models with skew-normal independent distributions: Bayesian analysis of labor force data[J]. Communications in Statistics-Simulation and Computation, 2019, 48(7): 2147−2164. doi: 10.1080/03610918.2018.1435802
[35] Rogers J A, Polhamus D, Gillespie W R, et al. Combining patient-level and summary-level data for Alzheimer’s disease modeling and simulation: a beta regression meta-analysis[J]. Journal of Pharmacokinetics and Pharmacodynamics, 2012, 39(5): 479−498. doi: 10.1007/s10928-012-9263-3
[36] Verkuilen J, Smithson M. Mixed and mixture regression models for continuous bounded responses using the beta distribution[J]. Journal of Educational and Behavioral Statistics, 2012, 37(1): 82−113. doi: 10.3102/1076998610396895
[37] Ni C, Nigh G D. An analysis and comparison of predictors of random parameters demonstrated on planted loblolly pine diameter growth prediction[J]. Forestry: an International Journal of Forest Research, 2012, 85(2): 271−280. doi: 10.1093/forestry/cps001
[38] 谢龙飞, 董利虎, 李凤日. 人工长白落叶松立木叶面积预估模型[J]. 应用生态学报, 2018, 29(9): 2843−2851. doi: 10.13287/j.1001-9332.201809.011 Xie L F, Dong L H, Li F R. Predicting models of leaf area for trees in Larix olgensis plantation[J]. Journal of Applied Ecology, 2018, 29(9): 2843−2851. doi: 10.13287/j.1001-9332.201809.011
[39] Calama R, Montero G. Multilevel linear mixed model for tree diameter increment in stone pine (Pinus pinea): a calibrating approach[J]. Silva Fennica, 2005, 39(1): 37−54.
[40] 马丽娜, 付孝德, 张明, 等. 人工林杨树木材密度变异规律的研究[J]. 安徽农业大学学报, 2003, 30(4): 410−413. doi: 10.3969/j.issn.1672-352X.2003.04.014 Ma L N, Fu X D, Zhang M, et al. Variation patterns of wood density in plantation poplar[J]. Journal of Anhui Agricultural University, 2003, 30(4): 410−413. doi: 10.3969/j.issn.1672-352X.2003.04.014
[41] 张倩, 周亚菲, 刘珊杉, 等. 速生杨清林材基本密度与含水率特性分析[J]. 林业科技, 2017, 42(3): 25−27. Zhang Q, Zhou Y F, Liu S S, et al. Study on basic density and moisture content of fast-growing clear poplar[J]. Forestry Science & Technology, 2017, 42(3): 25−27.
[42] Fukatsu E, Nakada R. The timing of latewood formation determines the genetic variation of wood density in Larix kaempferi[J]. Trees, 2018, 32(5): 1233−1245. doi: 10.1007/s00468-018-1705-0
[43] Kunstler G, Lavergne S, Courbaud B, et al. Competitive interactions between forest trees are driven by species’ trait hierarchy, not phylogenetic or functional similarity: implications for forest community assembly[J]. Ecology Letters, 2012, 15(8): 831−840. doi: 10.1111/j.1461-0248.2012.01803.x
[44] Dias D, Marenco R. Tree growth, wood and bark water content of 28 Amazonian tree species in response to variations in rainfall and wood density[J]. iForest-Biogeosciences and Forestry, 2016, 9(3): 445−451. doi: 10.3832/ifor1676-008
[45] 曾辉, 刘晓玲, 符韵林, 等. 顶果木树皮率、心材率及木材密度研究[J]. 西北林学院学报, 2014, 29(1): 161−164,173. doi: 10.3969/j.issn.1001-7461.2014.01.00 Zeng H, Liu X L, Fu Y L, et al. Bark percentage, heartwood percentage and density of Acrocarpus fraxinifolius[J]. Journal of Northwest Forestry University, 2014, 29(1): 161−164,173. doi: 10.3969/j.issn.1001-7461.2014.01.00
[46] Fajardo A. Insights into intraspecific wood density variation and its relationship to growth, height and elevation in a treeline species[J]. Plant Biology, 2018, 20(3): 456−464. doi: 10.1111/plb.12701
[47] 祖勃荪. 国外对杨树湿心材的研究[J]. 林业科学, 2000, 36(5): 85−91. doi: 10.3321/j.issn:1001-7488.2000.05.015 Zu B S. Foreign studies on wet heart wood of poplars[J]. Scientia Silvae Sinicae, 2000, 36(5): 85−91. doi: 10.3321/j.issn:1001-7488.2000.05.015
[48] Hietz P, Valencia R, Wright S J. Strong radial variation in wood density follows a uniform pattern in two neotropical rain forests[J]. Functional Ecology, 2013, 27(3): 684−692. doi: 10.1111/1365-2435.12085
[49] Fajardo A. Wood density is a poor predictor of competitive ability among individuals of the same species[J]. Forest Ecology and Management, 2016, 372: 217−225. doi: 10.1016/j.foreco.2016.04.022
-
期刊类型引用(10)
1. 袁玉虹,何天友. 氮磷钾配比施肥对短葶山麦冬生长及有效成分的影响. 九江学院学报(自然科学版). 2024(01): 123-128 .  百度学术
百度学术
2. 王晓荣,胡兴宜,龚苗,付甜,庞宏东,杨佳伟. 长江中下游地区28个常见乡土树种幼苗光合固碳能力比较. 湖北农业科学. 2023(01): 112-117 . 百度学术
3. 汤靖文,李晨晞,彭政淋,苏嘉熙,卫星. 氮磷钾肥对水曲柳雌雄株叶片光合生理及化学计量特征的影响. 森林工程. 2023(02): 30-38+46 . 百度学术
4. 景娜,高玉红,张巧霞,文明,徐鹏,崔政军,吴兵,剡斌,王一帆. 氮肥运筹对旱地胡麻同化物形成及籽粒产量的调控效应. 生态学杂志. 2023(07): 1644-1652 . 百度学术
5. 李川,王玉书,黄小辉. 钙、镁缺乏对核桃生长和光合特性的影响. 福建林业. 2023(04): 38-41 . 百度学术
6. 黄小辉,吴焦焦,魏立本,王玉书,冯大兰,张宏. 不同缺素条件下核桃幼苗的生长和生理变化. 北京林业大学学报. 2023(09): 33-41 . 本站查看
7. 尹梦雅,李志辉,杨艳,李昌珠,汤玉喜,唐洁,秦平书,吴兴华. 施肥对黄栀子幼苗生长与光合特性的影响. 东北林业大学学报. 2022(05): 32-36 . 百度学术
8. 唐新瑶,亢亚超,梁喜献,马道承,王凌晖. 氮磷钾配比施肥对观光木幼苗生理与光合特性的影响. 西北林学院学报. 2022(04): 37-42 . 百度学术
9. 李林珂,王一诺,薛潇,张文,吴焦焦,高岚,谭星,荣星宇,段儒蓉,刘芸. 黄栌光合和呈色特性对重庆阴雨天气的响应. 南京林业大学学报(自然科学版). 2022(05): 95-103 . 百度学术
10. 高恩婷,曾庆扬,谷战英,卢雨析,李扬,冯楠可,熊荟璇,张春来,曾乐景. 不同间作模式对山苍子光合特性及其栽培土壤水分和养分的影响. 经济林研究. 2022(04): 61-71 . 百度学术
其他类型引用(16)


计量
- 文章访问数: 560
- HTML全文浏览量: 120
- PDF下载量: 71
- 被引次数: 26
