
Remote sensing recognition of pine wilt disease in Pinus massoniana forest combined with microwave and optical time-series images
-
摘要:目的
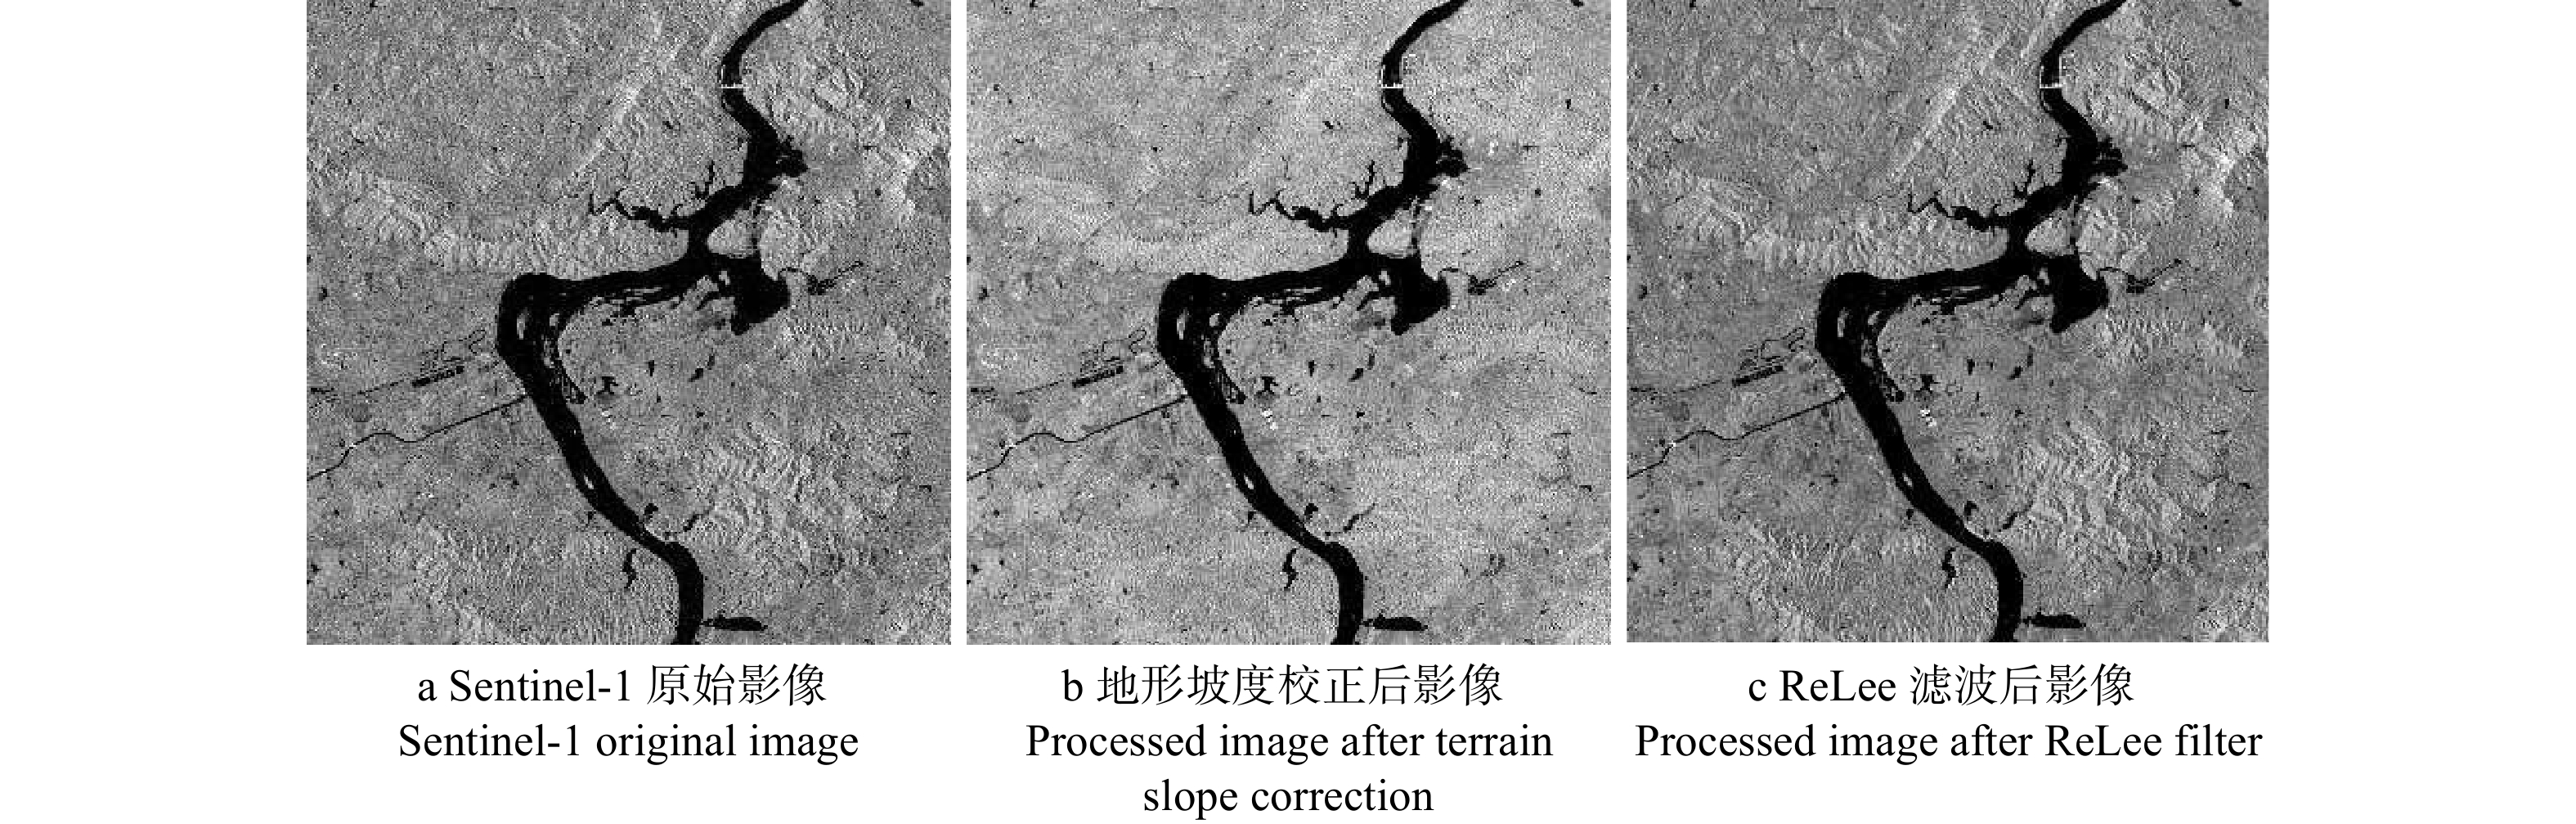
大范围准确监测林区松材线虫病感染情况对森林疫情防治和经营管理具有重要作用。现有研究往往采用单时相或少量时相数据,松材线虫病遥感监测易受森林背景和非寄主树木影响,导致监测精度存在较大的不确定性。此外,单一数据源往往对病害特征刻画不足,例如被动光学数据侧重描述森林冠层水平结构信息,但易受云雨影响造成数据缺失,而主动微波数据对森林垂直结构和水分含量敏感,但存在噪声高、色素敏感性低以及地形影响大等问题。因此,联合主动微波与被动光学时间序列遥感影像数据,有望在降低环境因素影响的同时追踪同一林分的时序变化特征,进而提升松材线虫病探测的准确性与鲁棒性。
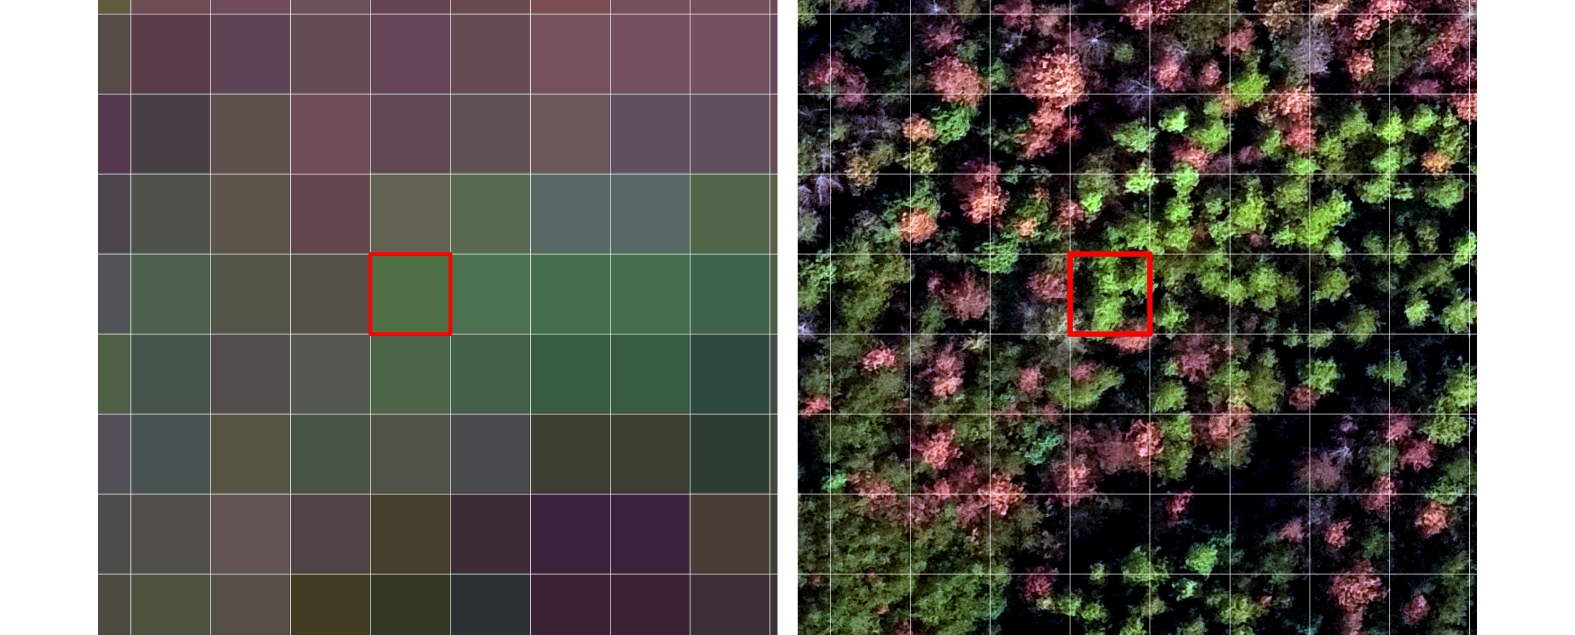
方法利用厘米级分辨率无人机影像标记样本,联合Sentinel-1 C波段微波和Sentinel-2光学时间序列数据,构建基于极端梯度提升算法的松材线虫病害监测模型。分别评估微波模型、光学模型和微波与光学联合模型在松材线虫病监测方面的性能,以及最优模型在不同环境因子下的表现。
结果(1)联合了微波和光学的模型精度(总体精度为80.62%,Kappa 系数为0.61)略高于单一光学模型的精度(总体精度为79.58%,Kappa系数为0.59),并明显高于单一微波模型的精度(总体精度为68.87%,Kappa系数为0.36),说明了微波与光学时间序列联合数据在松材线虫病害监测中具有优势;(2)模型通常在缓坡、阳坡、低海拔、高覆盖度条件下展现出更高精度。
结论本研究充分利用多源遥感卫星数据,为松材线虫病大范围准确监测提供了新的技术支撑。
Abstract:ObjectiveLarge-scale and accurate monitoring of pine wilt disease (PWD) plays an important role in forest epidemic prevention and management. Existing studies often use single-phase data, resulting in greater uncertainty in the accuracy of monitoring PWD, which is easily affected by forest background and non-host trees. In addition, single data have the limitation of insufficient characterization of disease characteristics. For example, passive optical data focus on describing the horizontal structure of forest canopy, and are easily affected by cloud and rain, resulting in missing data; Active microwave data are sensitive to forest vertical structure and moisture content, but there are problems such as high noise, low pigment sensitivity and large terrain impact. Therefore, the combination of active microwave and passive optical time-series images is expected to reduce the impact of environmental factors while tracking the time-series change characteristics of the same forest stand, which helps to improve the accuracy and robustness of PWD monitoring.
MethodFirst, using centimeter-level resolution drone images to obtain samples. Based on extreme gradient boosting algorithm, PWD monitoring models were constructed by combining Sentinel-1 C-band microwave and Sentinel-2 optical time-series images. The performance of microwave model, optical model, combined microwave and optical model in the monitoring of PWD was evaluated respectively. At the same time, compare the performance of the optimal model under different environment conditions.
Result(1) The accuracy of combined microwave and optical model (overall accuracy = 80.62%, Kappa coefficient = 0.61) was slightly higher than that of the single optical model (overall accuracy = 79.58%, Kappa coefficient = 0.59), but significantly higher than that of the single microwave model (overall accuracy = 68.87%, Kappa coefficient = 0.36), and its showed the value of combined microwave and optical time-series data in the monitoring of PWD. (2) The analysis of different environment conditions showed that the model generally exhibited higher accuracy under gentle slope, sunny slope, low altitude, and high coverage conditions.
ConclusionThis study makes full use of multi-source remote sensing satellite data and provides new technical support for large-scale accurate monitoring of PWD.
-
-
![]()
图 3 联合Sentinel-1和Sentinel-2时间序列数据的松材线虫病害遥感识别技术路线
Figure 3. Workflow of monitoring pine wilt disease through the integration of Sentinel-1 and Sentinel-2 time-series data
![]()
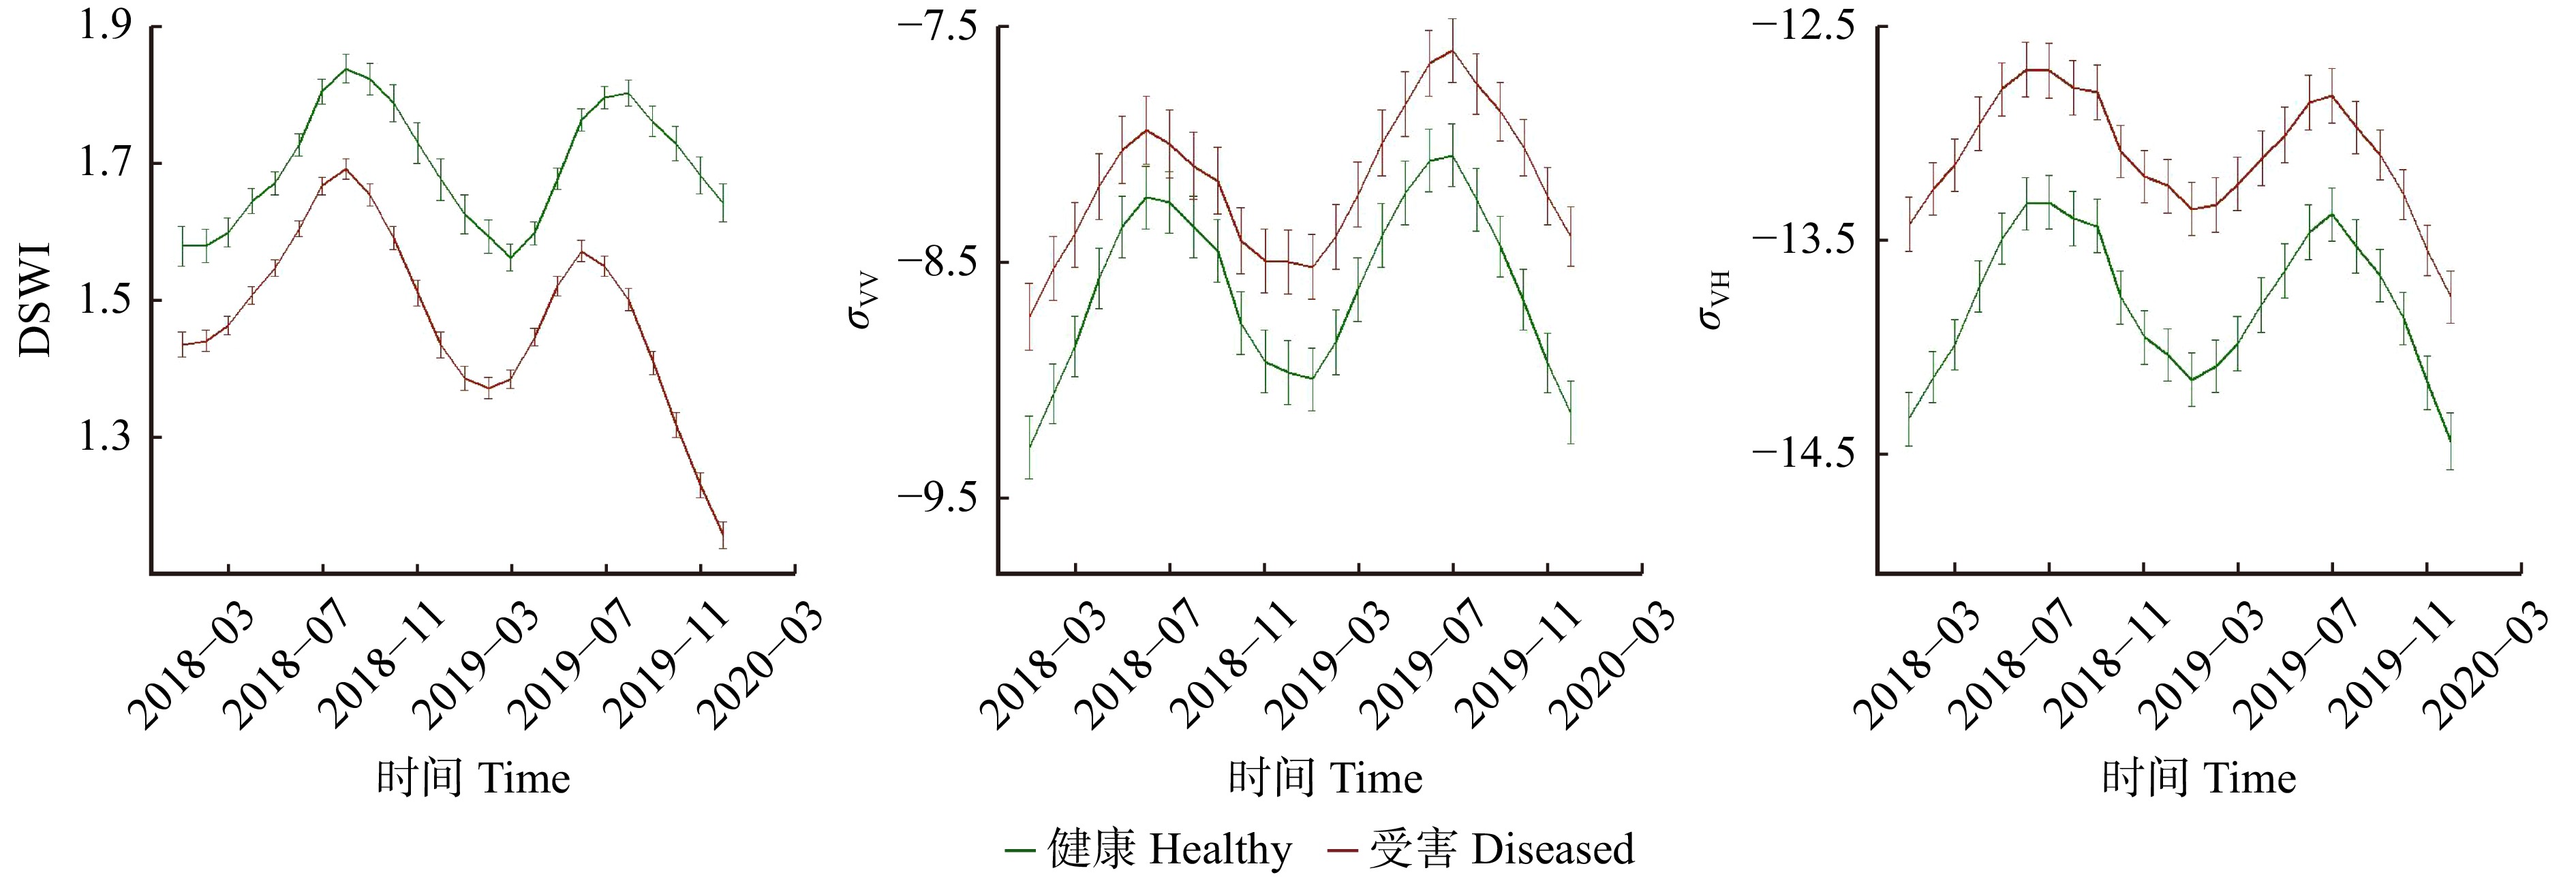
图 5 健康林分和受害林分的特征时序曲线
Figure 5. Characteristic time-series curves extracted from healthy and diseased stands
![]()
图 6 不同光学植被指数组合条件下的时序监测模型总体精度与Kappa系数比较
[OPT]指全部光学植被指数组合,[OPT2]指由GARI、NDMI、RDVI和DSWI组成的光学植被指数组合,“−”表示从指数组合中移除单个指数。[OPT] represents all optical vegetation index group, [OPT2] represents the optical vegetation index group composed of GARI, NDMI, RDVI and DSWI, “−” represents removing a single index from the index group.
Figure 6. Comparison of overall accuracy and Kappa coefficient of time-series monitoring models based on different optical vegetation index group
![]()
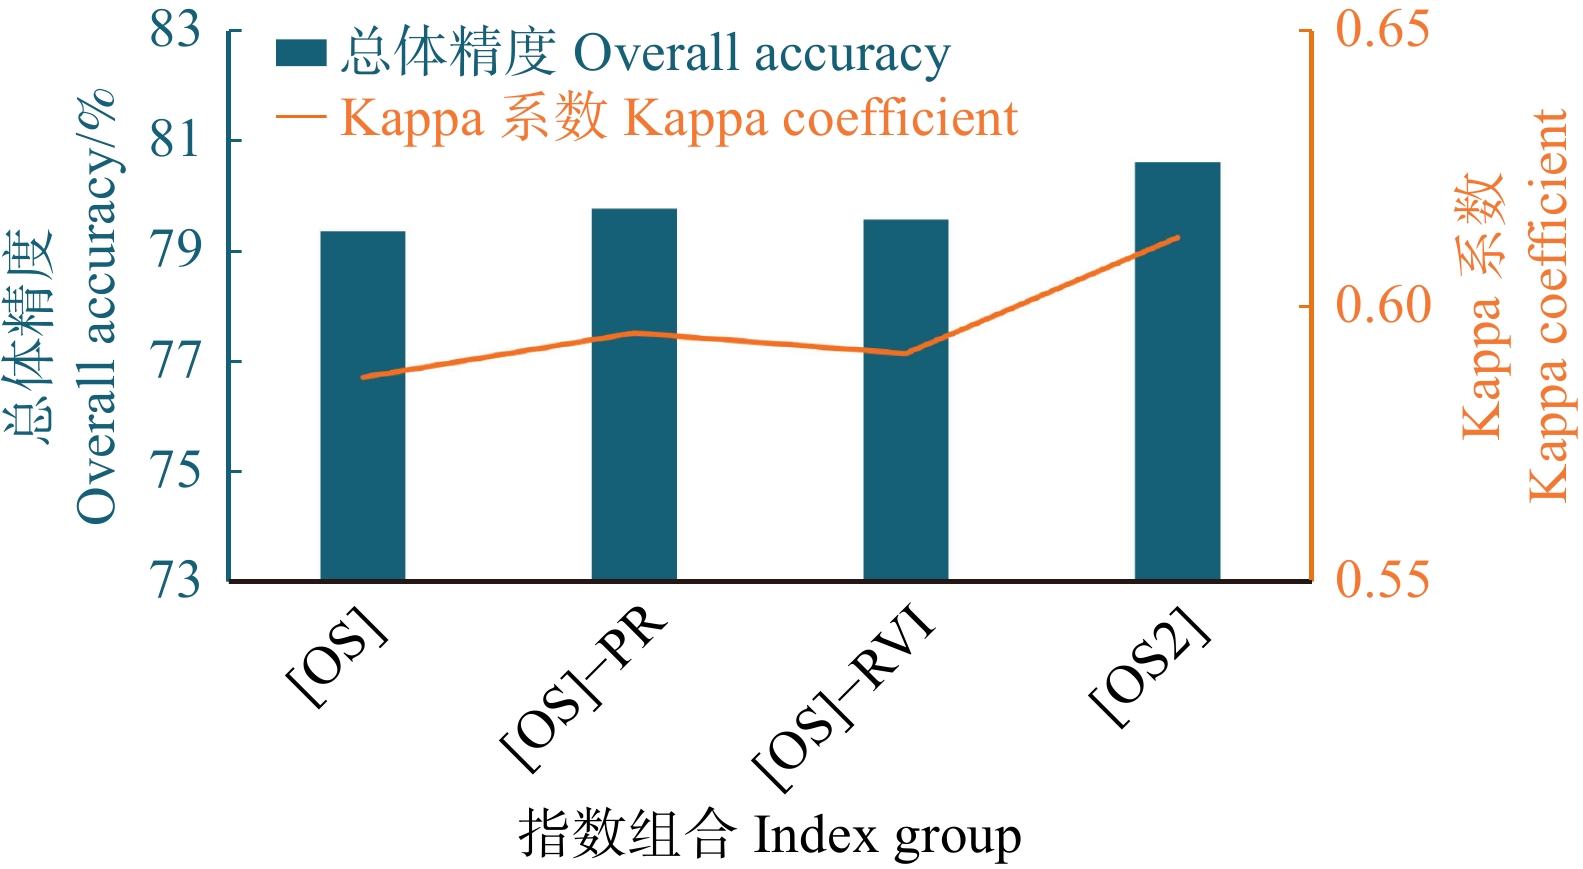
图 7 不同微波与光学植被指数组合条件下的时序监测模型总体精度与Kappa系数比较
[OS]指全部微波和光学植被指数组合,[OS2]指由DSWI、σVV和σVH组成的植被指数组合,“−”表示从指数组合中移除单个指数。[OS] represents all microwave and optical vegetation index group, [OS2] represents the vegetation index group composed of DSWI,σVV and σVH, “−” represents removing a single index from the index group.
Figure 7. Comparison of overall accuracy and Kappa coefficient of time-series monitoring models based on different microwave and optical vegetation indices group
![]()
图 8 联合时序监测模型提取松材线虫病受害区分布图
Figure 8. Maps of PWD infestation area classified by combined time-series monitoring model
![]()
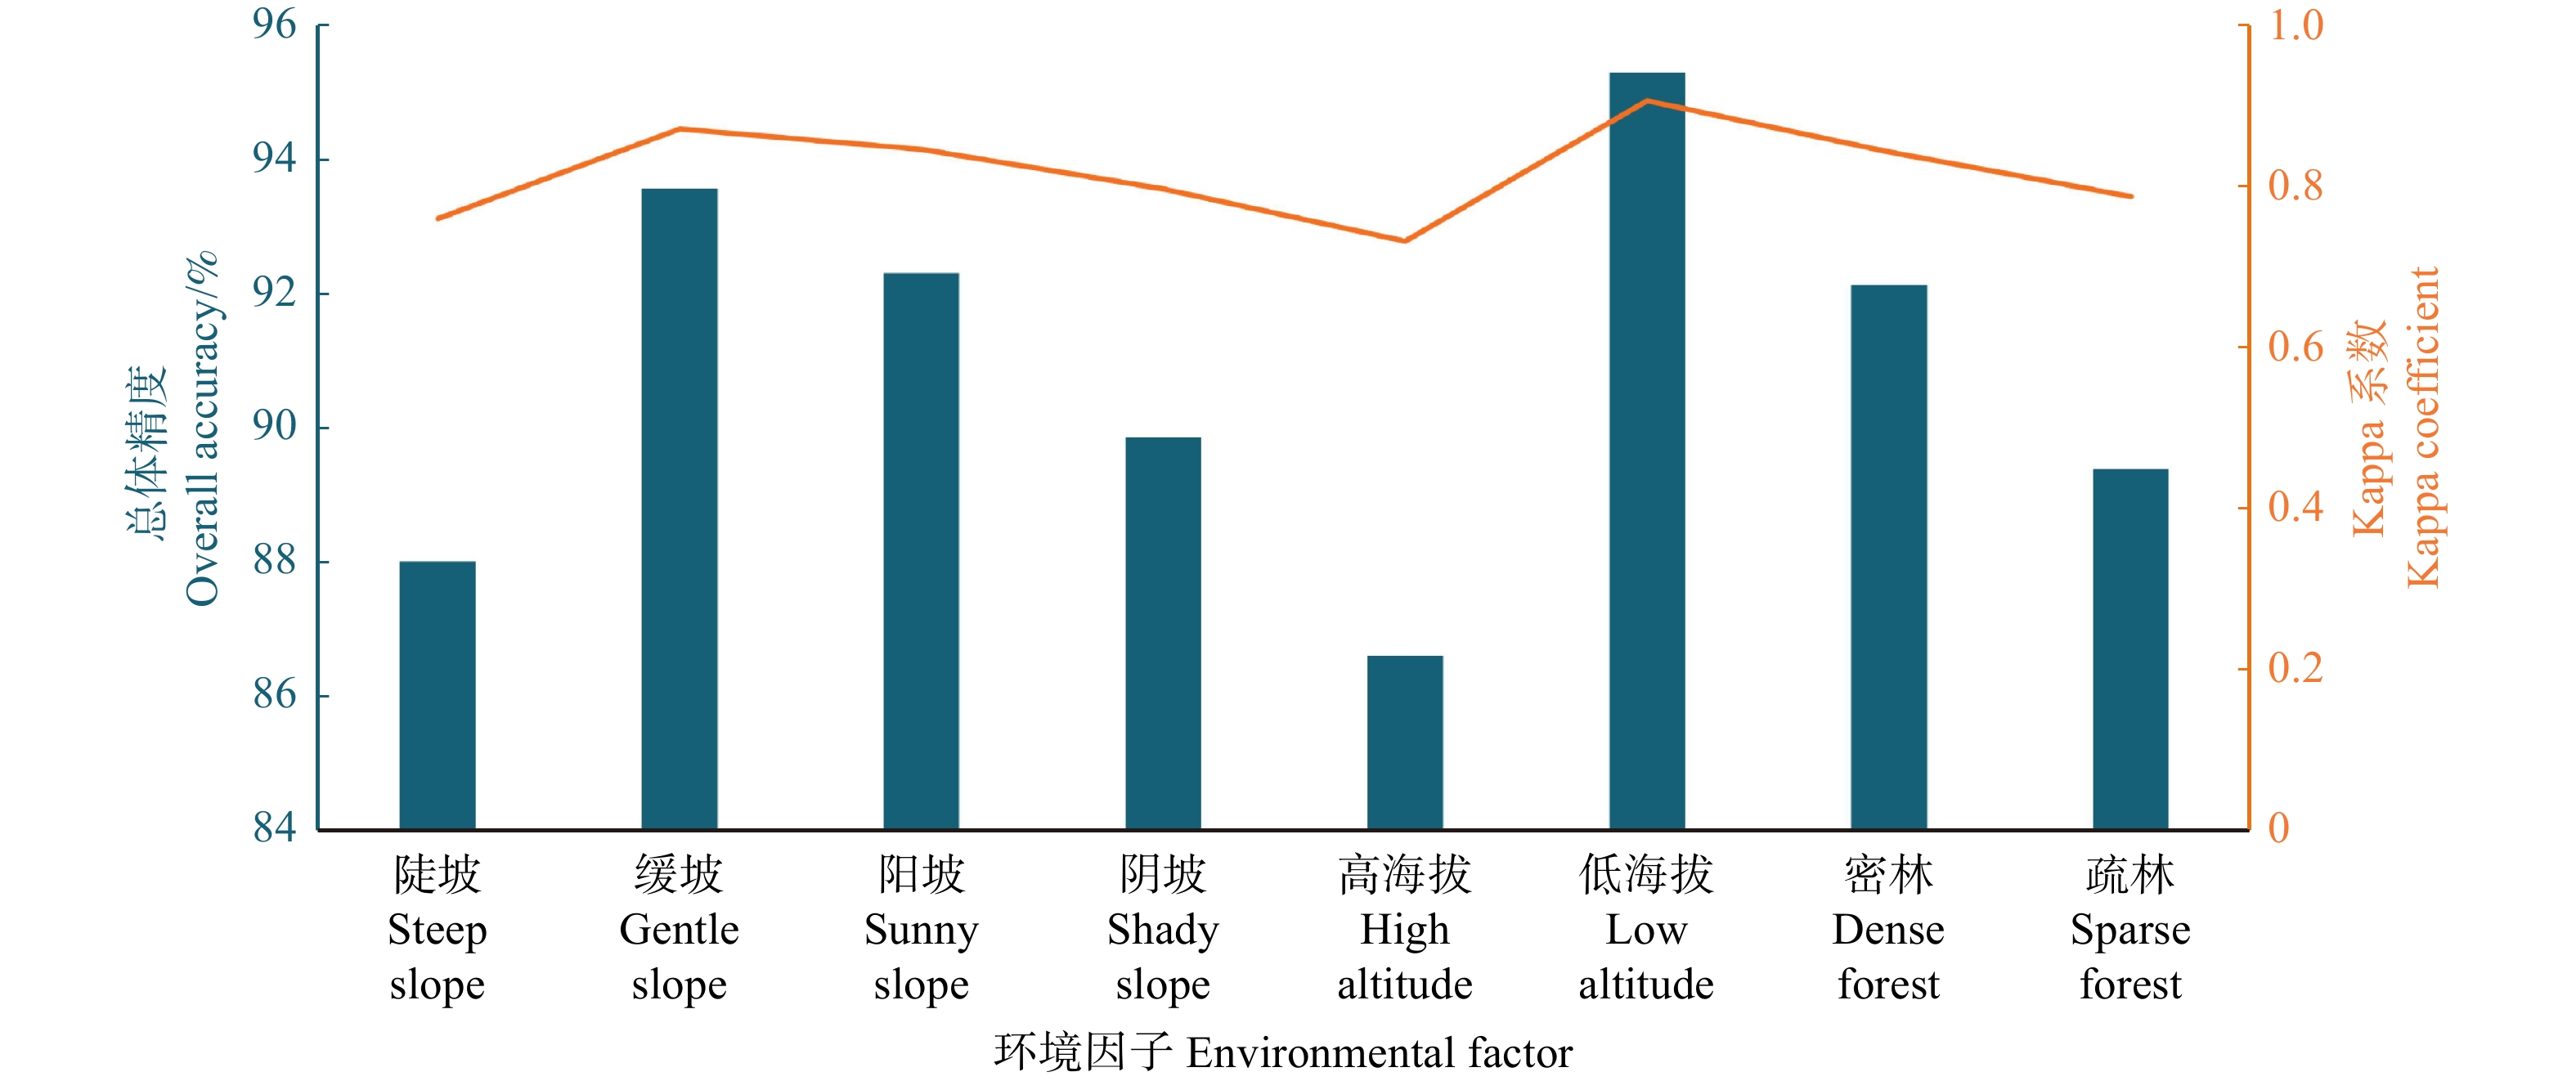
图 9 不同环境因子条件下的时序监测模型的总体精度与Kappa系数比较
Figure 9. Comparison of overall accuracy and Kappa coefficient of time-series monitoring models under different environment conditions
![]()
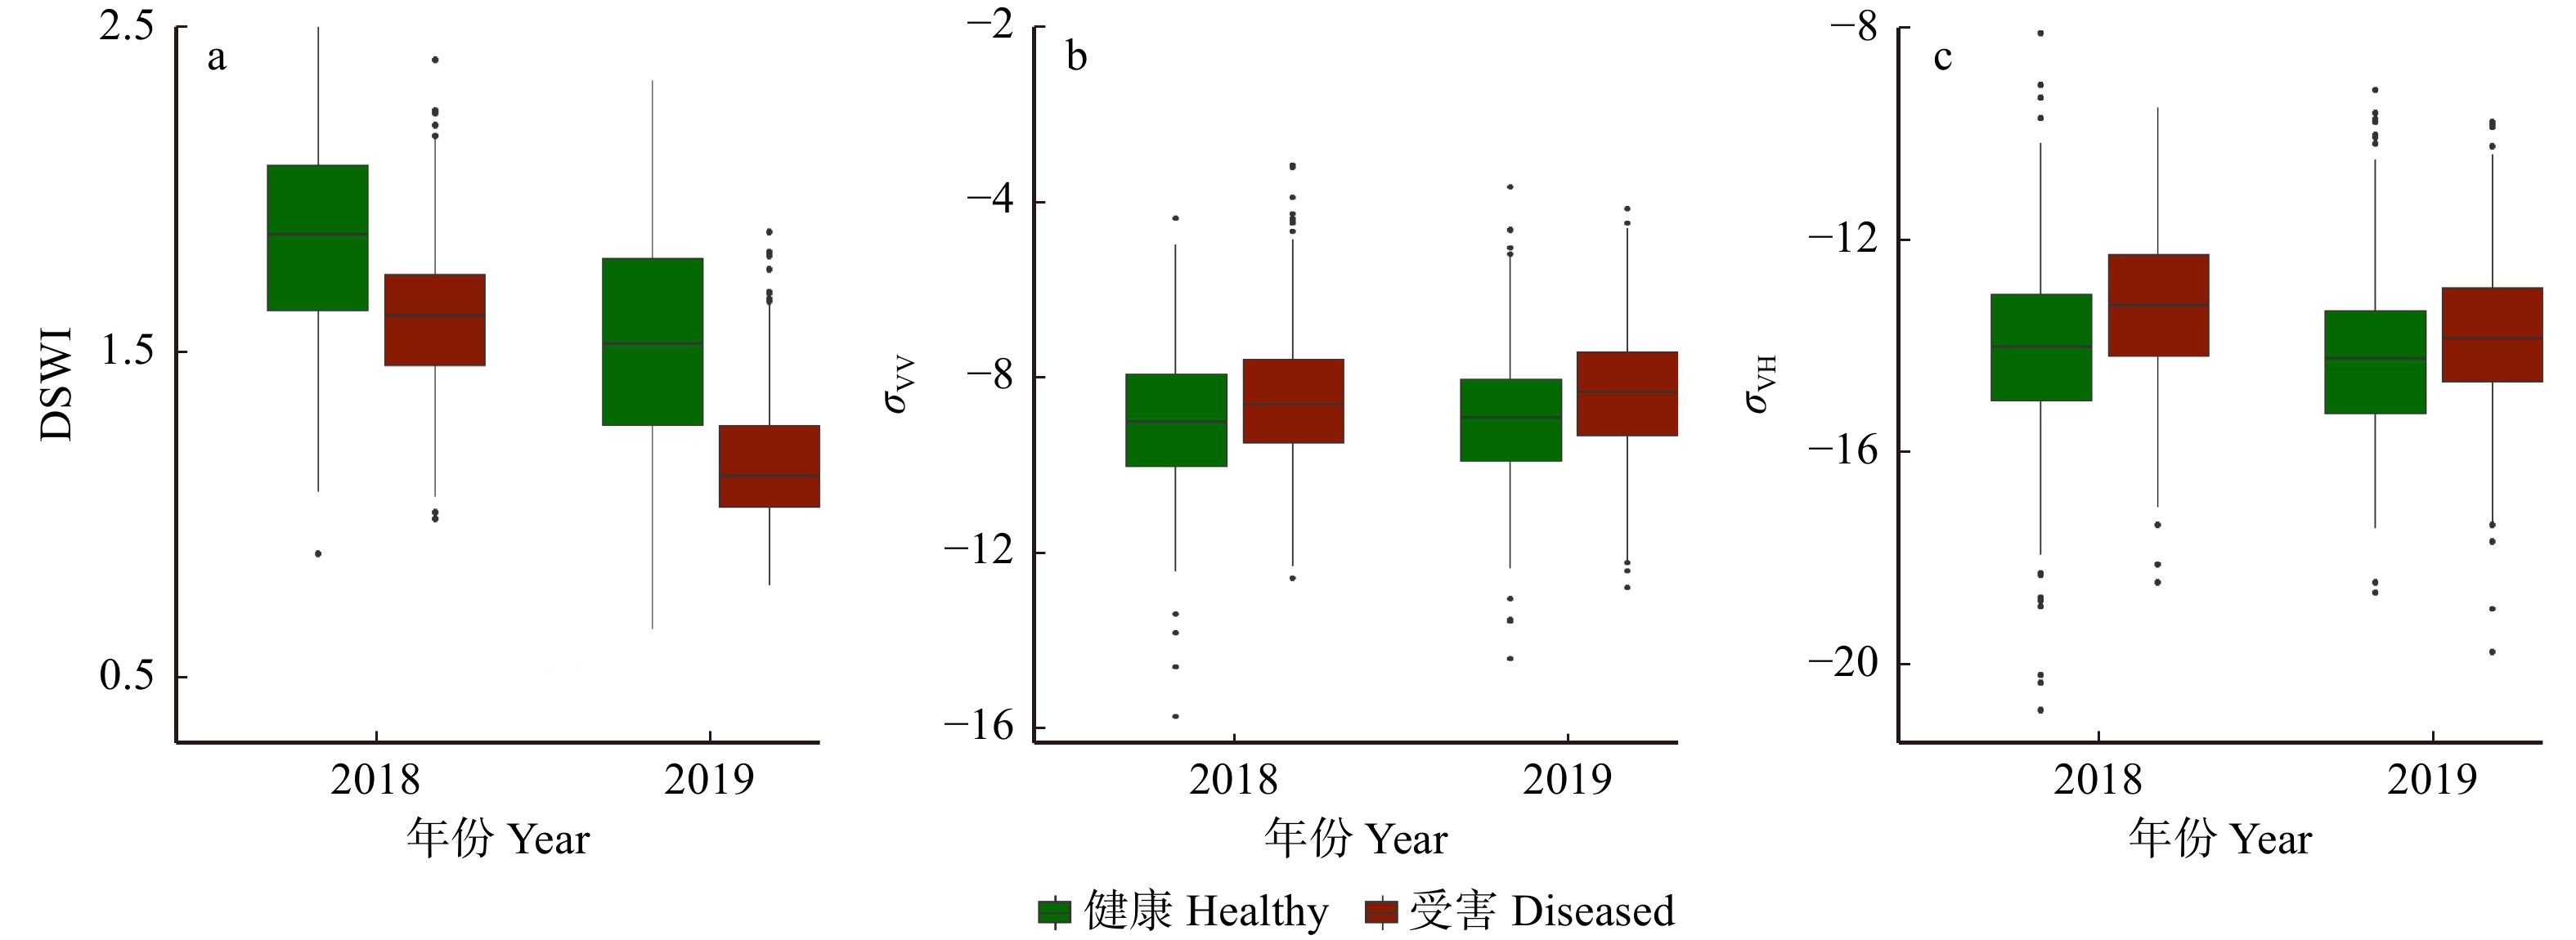
图 10 健康样本和受害样本的特征参数在灾前灾后的箱式图
Figure 10. Characteristic boxplots extracted from healthy and diseased samples before and after disaster
表 1 本研究所使用的微波与光学植被指数及其计算公式
Table 1 Microwave and optical vegetation indices used in this study and their formula
植被指数 Vegetation index 计算公式 Formula 参考文献 Reference 病害水分胁迫指数 Disease-water stress index (DSWI) B8+B3B11+B4 [31] 绿度大气阻抗植被指数 Green atmospherically resistant index (GARI) B8−(B3−1.7×(B2−B4))B8+(B3−1.7×(B2−B4)) [32] 修改型归一化差异水体指数 Modified normalized difference water index (MNDWI) B3−B11B3+B11 [33] 归一化燃烧比 Normalized burn ratio (NBR) B8−B12B8+B12 [34] 归一化差异湿度指数 Normalized difference moisture index (NDMI) B8−B11B8+B11 [35] 归一化差异植被指数 Normalized difference vegetation index (NDVI) B8−B4B8+B4 [36] 重整化差异植被指数 Renormalized difference vegetation index (RDVI) B8−B4√B8+B4 [37] 极化比 Polarization ratio (PR) σVV−σVH [38] 雷达植被指数 Radar vegetation index (RVI) 4/(10σVV−σVH10+1) [39] 注:B2、B3、B4、B8、B11和B12分别代表蓝、绿、红、近红、短波红外1和短波红外2波段反射率;σVV和σVH分别为同极化和交叉极化下后向散射系数。Notes: B2, B3, B4, B8, B11 and B12 represent the reflection values of the blue band, the green band, the red band, the near infrared band, the short-wave infrared band 1, and the short-wave infrared band 2, respectively. σVV and σVH represent the co-polarized and cross-polarized backscattering coefficient.  下载: 导出CSV
表 2 单一微波数据的时序模型分类精度
Table 2 Classification accuracy of time-series monitoring model using individual microwave data
指数组合
Index group总体精度
Overall accuracy/%Kappa系数
Kappa coefficient制图精度 Producer’s accuracy/% 用户精度 User’s accuracy/% 健康类 Healthy 受害类 Diseased 健康类 Healthy 受害类 Diseased [SAR] 68.87 0.36 54.71 80.92 70.93 67.73 注:[SAR]指全部微波植被指数组合。Note: [SAR] represents all microwave vegetation index group.
下载: 导出CSV
表 4 不同微波与光学植被指数组合条件下的时序监测模型制图精度与用户精度比较
Table 4 Comparison of producer accuracy and user accuracy of time-series monitoring models based on different microwave and optical vegetation index group
% 指数组合
Index group制图精度
Producer accuracy用户精度
User accuracy健康类
Healthy受害类
Diseased健康类
Healthy受害类
Diseased[OS] 81.61 77.48 75.52 83.20 [OS]−PR 81.61 78.24 76.15 83.33 [OS]−RVI 82.06 77.48 75.62 83.54 [OS2] 83.86 77.86 76.33 85.00
下载: 导出CSV
表 5 不同环境因子条件下的时序监测模型的制图精度与用户精度比较
Table 5 Comparison of producer accuracy and user accuracy of time-series monitoring models under different environment conditions
% 环境因子
Environment factor制图精度
Producer accuracy用户精度
User accuracy健康类
Healthy受害类
Diseased健康类
Healthy受害类
Diseased陡坡 Steep slope 87.25 88.75 87.84 88.20 缓坡 Gentle slope 93.59 93.56 93.86 93.27 阳坡 Sunny slope 93.71 91.09 90.11 94.36 阴坡 Shady slope 89.48 91.22 91.45 89.21 高海拔 High altitude 87.50 85.71 86.19 97.07 低海拔 Low altitude 93.93 96.60 96.39 94.28 密林 Dense forest 92.07 92.17 91.79 92.44 疏林 Sparse forest 89.07 89.73 90.23 88.51
下载: 导出CSV
表 3 不同光学植被指数组合条件下的时序监测模型制图精度与用户精度比较
Table 3 Comparison of producer accuracy and user accuracy of time-series monitoring models based on different optical vegetation index group
% 指数组合
Index group制图精度
Producer’s accuracy用户精度
User’s accuracy健康类
Healthy受害类
Diseased健康类
Healthy受害类
Diseased[OPT] 73.99 75.95 72.37 77.43 [OPT]−MNDWI 80.27 75.57 73.66 81.82 [OPT]−NBR 76.68 77.10 74.03 79.53 [OPT]−NDVI 74.44 80.15 76.15 78.65 [OPT2] 78.03 78.24 75.32 80.71 [OPT2]−GARI 78.92 77.86 75.21 81.27 [OPT2]−NDMI 80.72 77.48 75.31 82.52 [OPT2]−RDVI 79.82 77.86 75.42 81.93 DSWI 81.61 77.86 75.83 83.27
下载: 导出CSV
-
[1] 樊改丽. 基于中国知网的“松材线虫病”相关研究文献计量分析[J]. 植物检疫, 2018, 32(4): 18−25. Fan G L. Bibliometric analysis of pine wilt disease based on China National Knowledge Infrastructure[J]. Plant Quarantine, 2018, 32(4): 18−25.
[2] 秦军. 基于深度学习的多平台遥感松材线虫病害监测方法[D]. 合肥: 安徽大学, 2021. Qin J. Deep learning based multi-platform remote sensing method for pine wood nematode disease monitoring[D]. Hefei: Anhui University, 2021.
[3] 杨鼎, 秦思源, 迟世宽, 等. 基于CiteSpace的国内外松材线虫病研究现状及热点分析[J]. 自然保护地, 2022, 2(2): 115−128. Yang D, Qin S Y, Chi S K, et al. Research status and hotspot analysis of pine wood nematode disease based on CiteSpace[J]. Natural Protected Areas, 2022, 2(2): 115−128.
[4] 许格希, 余荣兵, 杨昌旭, 等. 基于GIS空间技术和MaxEnt模型预测川西松材线虫病入侵风险[J]. 北京林业大学学报, 2023, 45(9): 104−115. Xu G X, Yu R B, Yang C X, et al. Prediction of invasion risk of pine wilt disease based on GIS spatial technology and MaxEnt model in western Sichuan Province of southwestern China[J]. Journal of Beijing Forestry University, 2023, 45(9): 104−115.
[5] 陈玉惠, 叶建仁, 魏初奖, 等. 松材线虫侵染对马尾松、黑松水分及其相关代谢的影响[J]. 植物病理学报, 2005, 35(3): 201−207. Chen Y H, Ye J R, Wei C J, et al. Effects of pine wood nematode (PWN) infection on water regime and metabolism of related to hosts[J]. Acta Phytopathologica Sinica, 2005, 35(3): 201−207.
[6] 朱克恭. 松材线虫病研究综述[J]. 世界林业研究, 1995(4): 28−33. Zhu K G. Studies on pine disease caused by Bursaphelenchus xylophilus: a review[J]. World Forestry Research, 1995(4): 28−33.
[7] 武红敢. 卫星遥感技术在森林病虫害监测中的应用[J]. 世界林业研究, 1995(2): 24−29. Wu H G. Application of satellite remote sensing technology in the assessment of forest damage[J]. World Forestry Research, 1995(2): 24−29.
[8] 徐华潮, 骆有庆, 张廷廷, 等. 松材线虫自然侵染后松树不同感病阶段针叶光谱特征变化[J]. 光谱学与光谱分析, 2011, 31(5): 1352−1356. Xu H C, Luo Y Q, Zhang T T, et al. Changes of reflectance spectra of pine needles in different stage after being infected by pine wood nematode[J]. Spectroscopy and Spectral Analysis, 2011, 31(5): 1352−1356.
[9] Woodhouse I H. Introduction to microwave remote sensing[M]. Boca Raton: CRC Press, 2006.
[10] Zhang J C, Huang Y B, Pu R L, et al. Monitoring plant diseases and pests through remote sensing technology: a review[J/OL]. Computers and Electronics in Agriculture, 2019, 165: 104943[2022−03−21]. https://www.sciencedirect.com/science/article/pii/S016816991930290X.
[11] Franklin S E, Wulder M A, Skakun R S, et al. Mountain pine beetle red-attack forest damage classification using stratified landsat TM data in British Columbia, Canada[J]. Photogrammetric Engineering & Remote Sensing, 2003, 69(3): 283−288.
[12] White J C, Wulder M A, Brooks D, et al. Detection of red attack stage mountain pine beetle infestation with high spatial resolution satellite imagery[J]. Remote Sensing of Environment, 2005, 96(3−4): 340−351.
[13] Rahimzadeh-Bajgiran P, Weiskittel A, Kneeshaw D, et al. Detection of annual spruce budworm defoliation and severity classification using Landsat imagery[J/OL]. Forests, 2018, 9(6): 357[2022−04−05]. https://www.mdpi.com/1999-4907/9/6/357.
[14] Prabhakar M, Prasad Y G, Thirupathi M, et al. Use of ground based hyperspectral remote sensing for detection of stress in cotton caused by leafhopper (Hemiptera: Cicadellidae)[J]. Computers and Electronics in Agriculture, 2011, 79(2): 189−198. doi: 10.1016/j.compag.2011.09.012
[15] Apan A, Held A, Phinn S, et al. Detecting sugarcane ‘orange rust’ disease using EO-1 Hyperion hyperspectral imagery[J]. International Journal of Remote Sensing, 2004, 25(2): 489−498. doi: 10.1080/01431160310001618031
[16] Xu H R, Ying Y B, Fu X P, et al. Near-infrared spectroscopy in detecting leaf miner damage on tomato leaf[J]. Biosystems Engineering, 2007, 96(4): 447−454. doi: 10.1016/j.biosystemseng.2007.01.008
[17] Lin Q N, Huang H G, Chen L, et al. Using the 3D model RAPID to invert the shoot dieback ratio of vertically heterogeneous Yunnan pine forests to detect beetle damage[J/OL]. Remote Sensing of Environment, 2021, 260: 112475[2022−03−21]. https://www.sciencedirect.com/science/article/abs/pii/S0034425721001930.
[18] Li X Y, Shabanov N V, Chen L, et al. Modeling solar-induced fluorescence of forest with heterogeneous distribution of damaged foliage by extending the stochastic radiative transfer theory[J/OL]. Remote Sensing of Environment, 2022, 271: 112892[2022−03−21]. https://www.sciencedirect.com/science/article/abs/pii/S0034425722000062.
[19] Ortiz S, Breidenbach J, Kändler G. Early detection of bark beetle green attack using TerraSAR-X and RapidEye data[J]. Remote Sensing, 2013, 5(4): 1912−1931. doi: 10.3390/rs5041912
[20] Tanase M A, Aponte C, Mermoz S, et al. Detection of windthrows and insect outbreaks by L-band SAR: a case study in the Bavarian Forest National Park[J]. Remote Sensing of Environment, 2018, 209: 700−711. doi: 10.1016/j.rse.2018.03.009
[21] 薛娟. 联合多时相光学和InSAR数据的云南松切梢小蠹虫害监测研究[D]. 北京: 北京林业大学, 2018. Xue J. Fusing multi-temporal optical and InSAR to monitor the damage degrees of shoot beetle in Yunnan pine forest[D]. Beijing: Beijing Forestry University, 2018.
[22] Tiwari V, Kumar V, Matin M A, et al. Flood inundation mapping-Kerala 2018; Harnessing the power of SAR, automatic threshold detection method and Google Earth Engine[J/OL]. PLoS ONE, 2020, 15(8): e0237324[2021−11−22]. https://journals.plos.org/plosone/article?id=10.1371/journal.pone.0237324.
[23] Gorelick N, Hancher M, Dixon M, et al. Google Earth Engine: planetary-scale geospatial analysis for everyone[J]. Remote Sensing of Environment, 2017, 202: 18−27. doi: 10.1016/j.rse.2017.06.031
[24] Li L, Mu X, Jiang H, et al. Review of ground and aerial methods for vegetation cover fraction (fCover) and related quantities estimation: definitions, advances, challenges, and future perspectives[J]. ISPRS Journal of Photogrammetry and Remote Sensing, 2023, 199: 133−156. doi: 10.1016/j.isprsjprs.2023.03.020
[25] Potapov P, Li X Y, Hernandez-Serna A, et al. Mapping global forest canopy height through integration of GEDI and Landsat data[J/OL]. Remote Sensing of Environment, 2021, 253: 112165[2021−11−26]. https://www.sciencedirect.com/science/article/abs/pii/S0034425720305381.
[26] Farr T G, Rosen P A, Caro E, et al. The shuttle radar topography mission[J/OL]. Reviews of Geophysics, 2007, 45(2)[2021−22−25]. https://agupubs.onlinelibrary.wiley.com/doi/10.1029/2005rg000183.
[27] Sexton J O, Song X P, Feng M, et al. Global, 30-m resolution continuous fields of tree cover: landsat-based rescaling of MODIS vegetation continuous fields with lidar-based estimates of error[J]. International Journal of Digital Earth, 2013, 6(5): 427−448. doi: 10.1080/17538947.2013.786146
[28] Vollrath A, Mullissa A, Reiche J. Angular-based radiometric slope correction for Sentinel-1 on Google Earth Engine[J/OL]. Remote Sensing, 2020, 12(11): 1867[2022−03−16]. https://www.mdpi.com/2072-4292/12/11/1867.
[29] Lee J, Grunes M R, De Grandi G. Polarimetric SAR speckle filtering and its implication for classification[J]. IEEE Transactions on Geoscience and remote sensing. 1999, 37(5): 2363-2373. DOI: 10.1109/36.789635
[30] Yin F, Lewis P E, Gomez-Dans J L, et al. A sensor invariant atmospheric correction method: application to Sentinel-2/MSI and Landsat 8/OLI[J/OL]. EarthArXiv[Preprint]. 2019[2021−11−22]. https://eartharxiv.org/repository/view/1034.
[31] Apan A, Held A, Phinn S, et al. Formulation and assessment of narrow-band vegetation indices from EO-1 Hyperion imagery for discriminating sugarcane disease[C]//Proceeding of the Spatial Sciences Institute Biennial Conference (SSC 2003). Canberra: Spatial Sciences Institute, 2003: 1−13.
[32] Gitelson A A, Kaufman Y J, Merzlyak M N. Use of a green channel in remote sensing of global vegetation from EOS-MODIS[J]. Remote Sensing of Environment, 1996, 58(3): 289−298. doi: 10.1016/S0034-4257(96)00072-7
[33] Xu H. Modification of normalised difference water index (NDWI) to enhance open water features in remotely sensed imagery[J]. International Journal of Remote Sensing, 2006, 27(14): 3025−3033. doi: 10.1080/01431160600589179
[34] Cocke A E, Fulé P Z, Crouse J E. Comparison of burn severity assessments using Differenced Normalized Burn Ratio and ground data[J]. International Journal of Wildland Fire, 2005, 14(2): 189-198. DOI: 10.1071/WF04010.
[35] Wilson E H, Sader S A. Detection of forest harvest type using multiple dates of Landsat TM imagery[J]. Remote Sensing of Environment, 2002, 80(3): 385−396. doi: 10.1016/S0034-4257(01)00318-2
[36] Rouse J W, Haas R H, Schell J A, et al. Monitoring vegetation systems in the Great Plains with ERTS[J/OL]. NASA Special Publication, 1974, 351: 309[2022−03−25]. https://ntrs.nasa.gov/citations/19740022614.
[37] Roujean J, Breon F. Estimating PAR absorbed by vegetation from bidirectional reflectance measurements[J]. Remote Sensing of Environment, 1995, 51(3): 375−384. doi: 10.1016/0034-4257(94)00114-3
[38] Blaes X, Defourny P, Wegmuller U, et al. C-band polarimetric indexes for maize monitoring based on a validated radiative transfer model[J]. IEEE Transactions on Geoscience and Remote Sensing, 2006, 44(4): 791−800. doi: 10.1109/TGRS.2005.860969
[39] Nasirzadehdizaji R, Balik S F, Abdikan S, et al. Sensitivity analysis of multi-temporal sentinel-1 SAR parameters to crop height and canopy coverage[J/OL]. Applied Sciences, 2019, 9(4): 655[2022−01−14]. https://www.mdpi.com/2076-3417/9/4/655.
[40] Press W H, Teukolsky S A. Savitzky-Golay smoothing filters[J]. Computers in Physics, 1990, 4(6): 669−672. doi: 10.1063/1.4822961
[41] Simoes R, Camara G, Queiroz G, et al. Satellite image time series analysis for big earth observation data[J/OL]. Remote Sensing, 2021, 13(13): 2428[2021−10−08]. https://www.mdpi.com/2072-4292/13/13/2428.
[42] Keogh E, Lin J. Clustering of time-series subsequences is meaningless: Implications for previous and future research[J]. Knowledge and Information Systems, 2005, 8(2): 154−177. doi: 10.1007/s10115-004-0172-7
[43] Chen T Q, Guestrin C. XGBoost: a scalable tree boosting system[C]//Proceedings of the 22nd acm sigkdd international conference on knowledge discovery and data mining. San Francisco: Association for Computing Machinery, 2016: 785−794.
[44] Hickey J, Birnie R, Zhao M X. Oleoresin, chemistry and spectral reflectance in stressed lodgepole and white bark pine, mammoth mountain, California[C]//Proceedings of the tenth JPL airborne earth science workshop. Pasadena: National Aeronautics and Space Administration, 2001: 1−10.
[45] Steele-Dunne S C, Friesen J, van de Giesen N. Using diurnal variation in backscatter to detect vegetation water stress[J]. IEEE Transactions on Geoscience and Remote Sensing, 2012, 50(7): 2618−2629. doi: 10.1109/TGRS.2012.2194156
[46] van Emmerik T, Steele-Dunne S C, Judge J, et al. Impact of diurnal variation in vegetation water content on radar backscatter from maize during water stress[J]. IEEE Transactions on Geoscience and Remote Sensing, 2015, 53(7): 3855−3869. doi: 10.1109/TGRS.2014.2386142
[47] 张王菲. 星载SAR遥感反演中地形辐射校正的关键技术研究[D]. 昆明: 昆明理工大学, 2018, 138. Zhang W F. Research on key techniques of terrain radiation correction in spaceborne SAR remote sensing retrieval[D]. Kunming: Kunming University of Science and Technology, 2018, 138.
[48] 李慧敏. 基于微波遥感数据的森林参数反演[D]. 成都: 电子科技大学, 2017: 78. Li H M. Inversion of forest parameters using microwave remote sensing data[D]. Chengdu: University of Electronic Science and Technology of China, 2017: 78.
[49] 边金虎, 李爱农, 王少楠, 等. 基于MODIS NDVI的Landsat TM影像地形阴影区光谱信息恢复方法研究[J]. 遥感技术与应用, 2016, 31(1): 12−22. Bian J H, Li A N, Wang S N, et al. Restoration of information obscured by mountain shadows for Landsat TM images based on MODIS NDVI[J]. Remote Sensing Technology and Application, 2016, 31(1): 12−22.
-
期刊类型引用(0)
其他类型引用(4)


计量
- 文章访问数: 477
- HTML全文浏览量: 57
- PDF下载量: 60
- 被引次数: 4
