
Predicting potential suitable distribution areas for Juniperus przewalskii in Qinghai Province of northwestern China based on the optimized MaxEnt model
-
摘要:目的
预测祁连圆柏在青海省的潜在分布区,为祁连圆柏林的经营管理和保护修复提供理论依据。
方法利用气候、地形、土壤、生态系统类型和人类活动强度5类环境变量,基于R语言Kuenm程序包优化后的MaxEnt模型预测祁连圆柏在青海的潜在分布区,并探讨影响祁连圆柏地理分布的主导环境因子及其适宜区间,同时应用2018—2020年青海省祁连圆柏林现地调查数据对预测结果进行准确性验证。
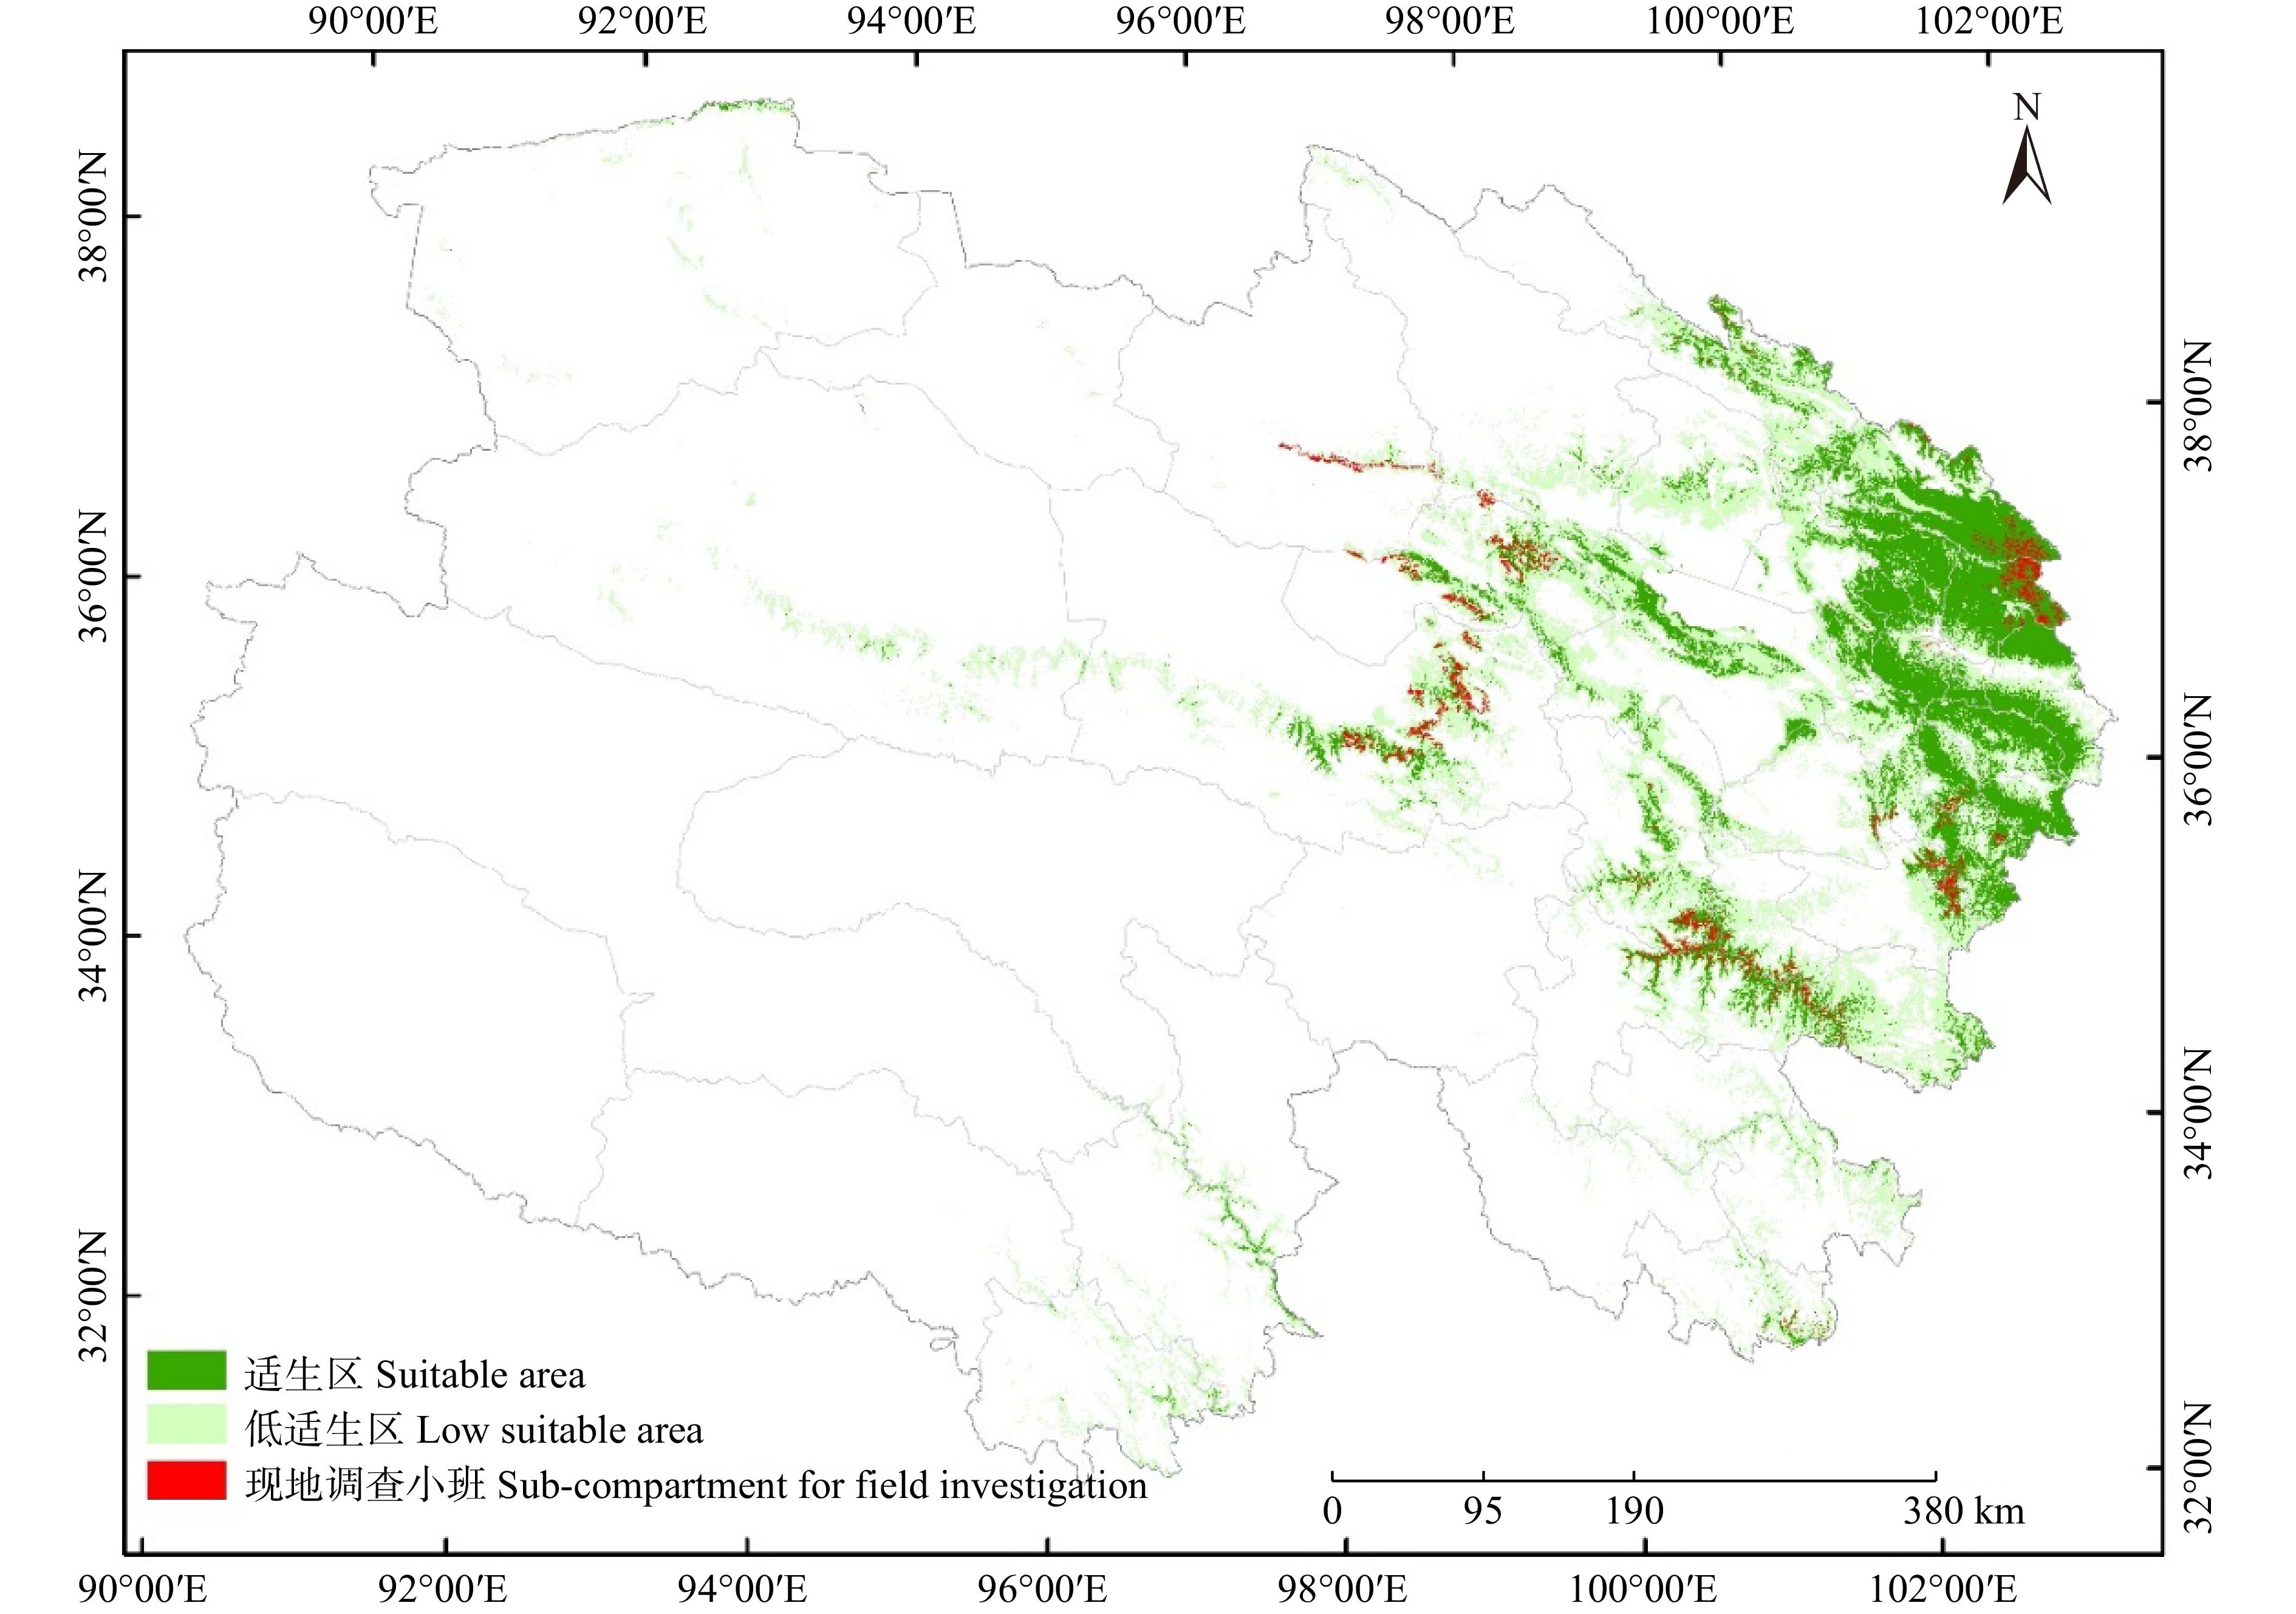
结果预测的祁连圆柏潜在分布区主要分布在青海东部、东北部和北部,适生区面积为3.20万km2,用于验证的现地调查小班均落入预测的适生区。祁连圆柏适宜生长的环境条件:气候(最热月份最高温15 ~ 22 ℃、最冷月最低温−23 ~ −15 ℃、年平均降水量300 ~ 600 mm、等温性 < 39%、降水季节性变异系数88 ~ 103),地形(海拔2 800 ~ 3 950 m、坡度12° ~ 18°、坡向(阳坡、半阳坡及半阴坡)),土壤(土壤有效水含量 > 0.4 mm/m、0 ~ 30 cm土层硫酸盐含量 < 0.2%),生态系统类型(农田、林地和草地生态系统);祁连圆柏适宜分布区人类足迹指数 > 10。
结论优化后的MaxEnt模型可准确反映祁连圆柏的潜在适宜区分布情况。祁连圆柏地理分布是由地形、气温、降水、生态系统类型、土壤和人类活动等多种因素综合影响的结果,海拔是影响祁连圆柏在青海分布的主导环境因子。研究结果可为祁连圆柏造林适宜空间选择提供可靠的理论依据和实施方向,同时,分布区适宜性等级划分结果可为祁连圆柏林的经营管理和保护修复决策提供参考。
Abstract:ObjectiveThis paper aims to predict the potential distribution area of Juniperus przewalskii in Qinghai Province of northwestern China, and to provide a theoretical basis for the management, protection and restoration of J. przewalskii.
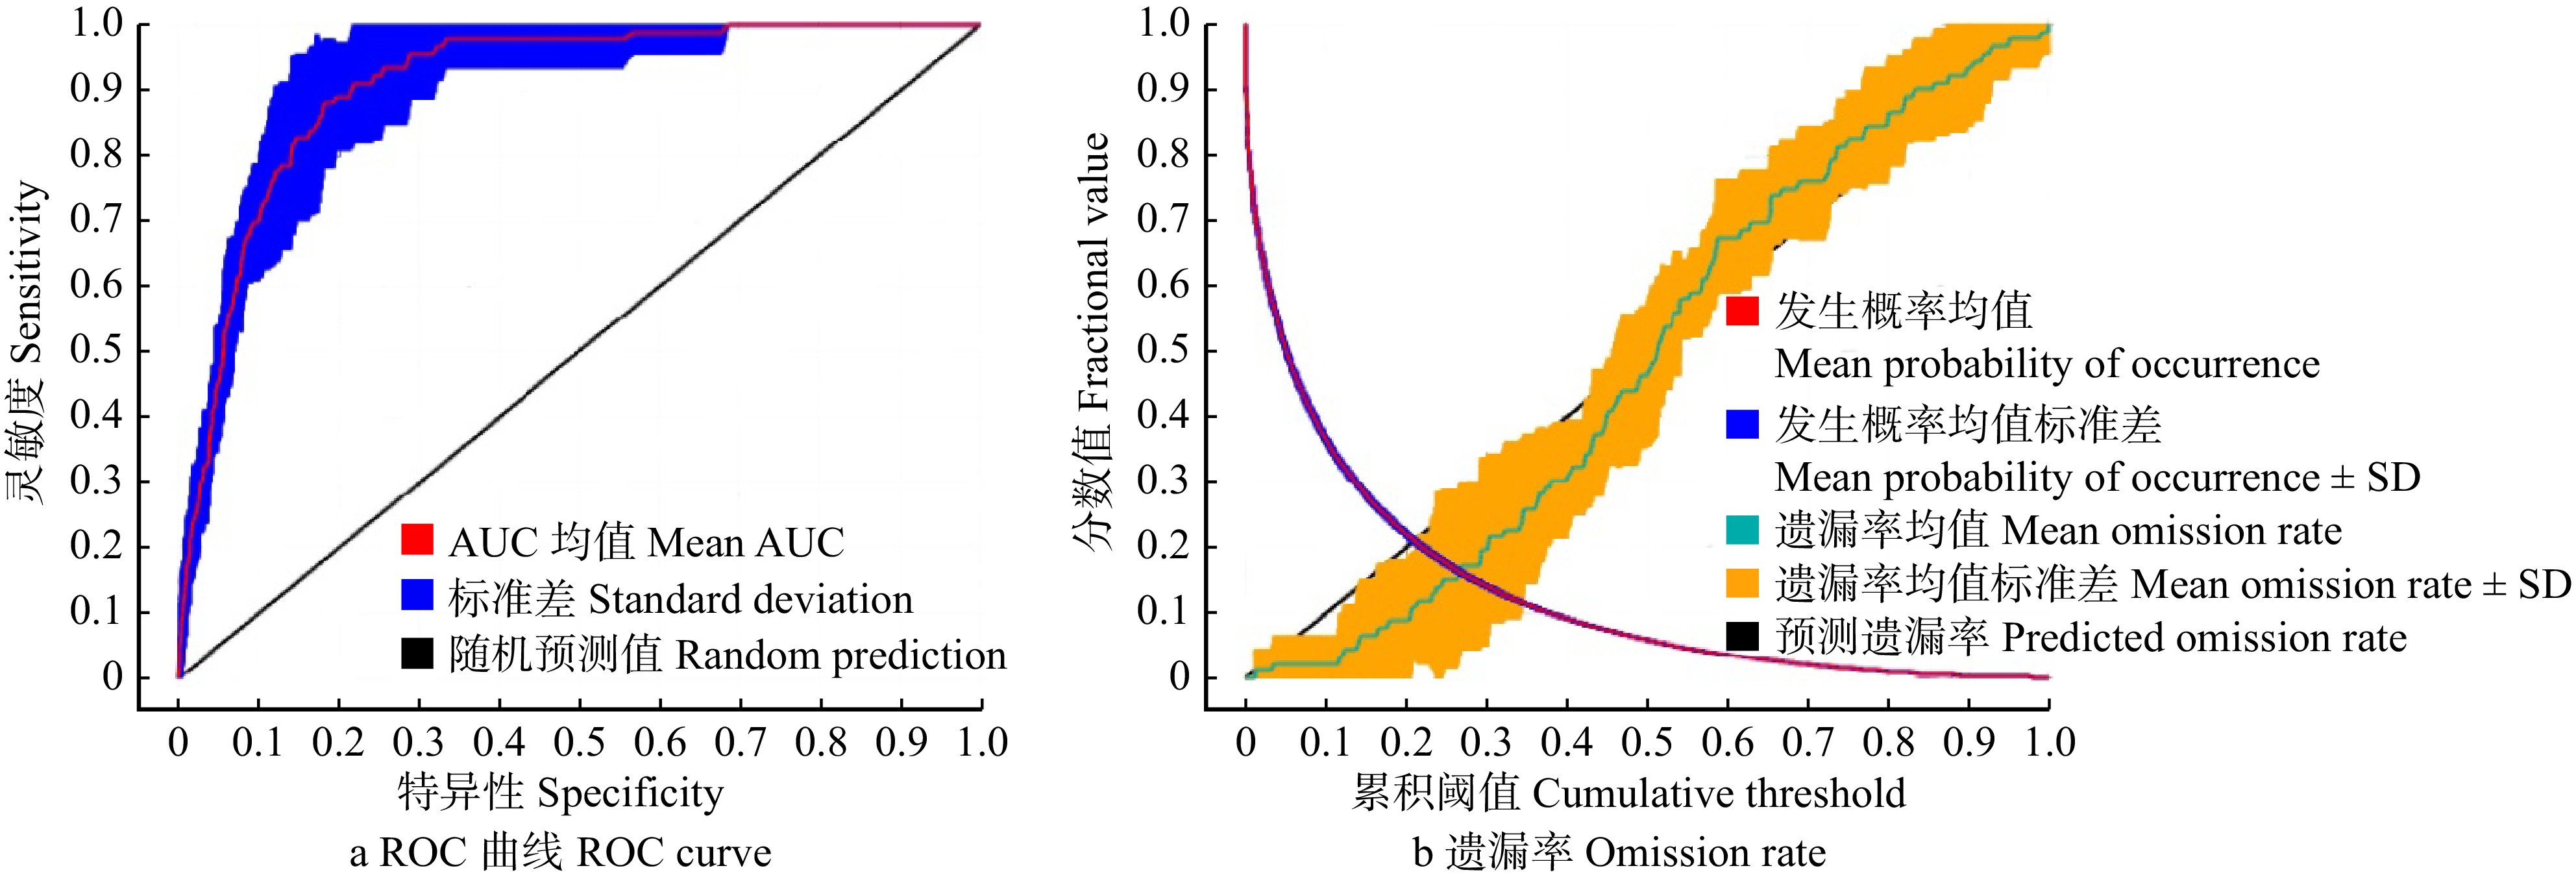
MethodThe potential distribution of J. przewalskii in Qinghai Province was predicted by a variety of environmental variables (climate, topography, soil, ecosystem and human activity intensity) based on the MaxEnt model optimized by the Kuenm package of R, and the dominant environmental factors and value ranges affecting the geographical distribution of J. przewalskii were discussed, and the accuracy of the prediction results was verified by the project team from 2018 to 2020 in the field survey of J. przewalskii resources in Qinghai Province.
ResultThe predicted suitable areas of J. przewalskii were mainly distributed in the eastern, northeastern and northern Qinghai Province, with a suitable area of 32 000 km2. From 2018 to 2020, sub-compartment for field investigations of J. przewalskii resources in Qinghai Province fell into the predicted suitable area, and the environmental conditions suitable for the growth of J. przewalskii, i.e. climate (max. temperature of the warmest month was 15−22 ℃, min. temperature of the coldest month was −23−15 ℃, annual mean precipitation was 300−600 mm, isothermality was < 39%, the variance of precipitation was 88 − 103), topography (elevation was 2 800−3 950 m, slope was 12°−18°, slope to sunny slope, semi-sunny slope and semi-shaded slope), soil (AWC range > 0.4 mm/m), topsoil gypsum < 0.2%), ecosystem type (farmland, forest land and grassland ecosystem). The human footprint index of J. przewalskii distribution area > 10.
ConclusionIn this study, the optimized MaxEnt model can accurately reflect the distribution of potential suitable areas of J. przewalskii. The geographical distribution of J. przewalskii is the result of the comprehensive influence of topography, temperature, precipitation, ecosystem type, soil and human activities, and altitude is the dominant environmental factor affecting the distribution of J. przewalskii in Qinghai Province. The research results can provide a reliable theoretical basis and implementation direction for the selection of suitable space for afforestation in J. przewalskii, and at the same time, the results of the suitability classification of distribution area can provide a reference for the management and protection and restoration decisions of J. przewalskii.
-
20世纪以来,以遥感影像作为主要信息源,可以对林分以及单木层次上的森林结构参数进行精准测量、制图和数字化表达,进而对森林资源状况及其动态变化进行全面、快速、有效监测和评估。高分辨率遥感影像可以更加清晰地表达地物目标的空间结构,纹理特征和地物边缘信息,树冠的大小、形态以及光谱信息,是树冠轮廓自动识别的基本特征,也是建立众多林分模型的重要因子[1-2]。传统的图像分析方法是在像元层次上进行的基于影像光谱特征的信息提取,这种方式是建立在统计模式下而不是空间模式下,易出现“椒盐现象”,分辨率越高、这种现象越严重,会造成空间数据的大量冗余和资源浪费。
为充分利用高分辨率遥感影像丰富的空间信息,实现信息的准确提取,面向对象的遥感影像信息提取技术应运而生,这种方法充分利用了对象的光谱、形状、纹理等信息,以最小单元为分割对象,可以在很大程度上减少“椒盐现象”的出现,提高分析精度[3]。单木树冠识别和勾绘很重要的一个途径就是图像分割,主要是以树冠的辐射传输模型为理论基础,其核心思想是树冠中心点的亮度值大,而树冠边界点的亮度低。常用的方法主要有局部最大值法、模板匹配法、区域增长法、分水岭算法等[4-10]。但是对于高郁闭度林分,树冠之间有粘连重叠的现象,无法简单利用树冠边缘灰度值突变的思想进行树冠分割,需要从影像所表现的几何形状、尺寸和空间格局等角度进行单木冠幅提取,提高树冠识别的精度[11-13]。
高空间分辨率遥感影像具有高空间分辨率和低光谱分辨率的特点,影像中地物在光谱空间中表现出类间差异小、类内差异大和视觉对比度差,因此在图像分割之前先进行增强处理,一方面可以增强图像对比度,将地物目标与背景环境之间的差异拉大,另一方面可以滤除大部分的噪声对分割结果的影响。小波变换具有频域与时域二维分辨率的特点,同时具有多尺度的特征,能够从不同尺度上对图像进行理解和表达,因此在遥感影像处理中得到了广泛应用[14-17]。应用高分影像,使用面向对象的多尺度分割方法提取树冠信息,已有很多研究[18-20],但是针对不同平台高分影像特征的相似性和差异性,树冠提取方法的适宜性研究较少。已有研究表明,在不同空间分辨率影像下地物面积提取精度存在差异[21-23],但多数都是采用重采样后影像而不是真实尺度下的遥感影像,这种方式会对影像的空间和光谱信息造成损失或失真,影响研究结论[24-25]。
本文以高分影像下单木树冠分割提取为研究目的,进行不同影像的空间尺度响应研究。选用3种不同平台下的高分辨率遥感影像(空间分辨率分别为0.03 m、0.2 m和1 m),对研究区内主要人工林树种进行树冠提取实验,首先对低空无人机CCD和机载CCD影像进行小波变换增强处理,然后采用面向对象的多尺度分割方法进行单木树冠提取;在对GF-2影像进行影像融合后,直接以多尺度分割方法进行树冠分割,最后结合3种平台影像下的单木分割精度,分析不同空间尺度遥感影像对单木树冠识别及其面积提取精度的影响规律,讨论在不同林业调查目标下该方法的应用价值。
1. 研究区与数据
1.1 研究区概况
广西国有高峰林场位于南宁市兴宁区,地理坐标为22°48′48″ ~ 23°03′34″N、108°07′55″ ~ 108°32′53″E,所在区域为大明山余脉,属低山丘陵地貌,地势东北高、西南低,呈东北—西南走向,海拔高度70 ~ 500 m,坡度20° ~ 35°,经营面积近800 km2,森林蓄积量超430万m3,是广西规模最大的国有林场。林场内人工林的主要树种是桉树(Eucalyptus robusta)和杉木(Cunninghamia lanceolata)。为了验证本文算法的普遍性和实用性,桉树和杉木实验区选择在密林区(郁闭度 > 0.7)。研究区示意图见图1。
1.2 数据获取
1.2.1 实地调查数据
在高峰林场内选择杉木纯林和桉树纯林作为实验区,均设立边长30 m × 30 m大小的样地,在2018年1月16日至2月5日开展地面样地数据的调查,每种树种随机选取45株树木作为验证数据,利用皮尺测定每棵树的东西及南北两个方向冠幅,并计算两个方向冠幅的平均值作为树冠直径;同时利用全站仪对实验区内的树木进行单木定位,方便之后处理分析时对应查找。同时记录样地的坐标、坡度、坡向,以及样地内树种的胸径、树高、枝下高等数据。桉树实验区树木平均胸径为11.7 cm,平均树高为17.8 m,平均冠幅为2.8 m;杉木实验区树木平均胸径为21.2 cm,平均树高为15.4 m,平均冠幅为3.9 m。
1.2.2 影像数据
低空无人机CCD影像是采用iFly D6电动多旋翼无人机搭载iCam Q2倾斜摄影相机进行拍摄,拍摄时间为2018年2月,实际飞行航高约为180 m,数据获取当天晴朗无风、阳光充足。影像分辨率为0.03 m,采用China Geodetic Coordinate System 2000大地坐标系,高斯克吕格3度带投影,通过三维实景建模软件ContextCapture Center输出正射影像。
机载CCD影像是由中国林业科学研究院LiCHy(LiDAR、CCD and Hyperspectral)机载遥感系统采集提供,由德国IGI公司集成,数据由运-12飞机搭载传感器飞行获取,拍摄时间为2018年1月,实际飞行航高约为1 000 m,数据获取当天晴朗少云。影像分辨率为0.2 m,数据坐标系统设定为UTM-North投影,WGS-84坐标系。
GF-2影像分为全色影像和多光谱影像,全色影像分辨率为1 m,多光谱影像分辨率为4 m,包括红、绿、蓝、近红外4个波段,获取时间为2018年8月。在对GF-2影像进行面向对象分割之前,为了消除遥感数据误差,提高解译精度,需对影像数据进行预处理。预处理过程主要包括几何正射校正、图像融合、几何精校正、影像裁剪。本研究结合DEM数据,利用RPC物理模型对全色影像及多光谱影像进行正射校正,并采用NNDiffuse Pan Sharpening方法对全色波段和多光谱波段进行融合,融合后影像空间分辨率为1 m。
2. 原理与方法
首先对3种平台下的影像预处理得到正射影像,采用小波变换对图像进行增强处理,通过定量分析评价图像增强效果,然后应用面向对象的多尺度分割方法进行单木树冠提取,最后结合外业实测数据计算提取精度。方法流程如图2所示。
2.1 图像增强
小波变换的基本原理:若傅里叶变换
ˆΨ(ω) 能够满足容许条件,Ψ(t)=∫R|ˆΨ(ω)|2|ω|dω<∞ ,则称Ψ(t) 为一基本小波母函数。小波母函数Ψ(t) 经伸缩和平移后得到连续小波函数Ψa,b(t) ,a为伸缩因子,b为平移因子[14]。小波变换的实质就是用一族小波函数去表示信号或函数。图像经过小波变换之后,每层分解尺度中分别得到4个子图像(图3)。LL为低频部分,代表图像的近似信息,也就是主要内容信息;HL、LH和HH是高频部分,分别代表图像水平方向、垂直方向和对角线方向的细节信息。图像的低频部分保存的是图像的轮廓信息,而高频保存的是图像的细节信息,图像中大部分的噪声和一些边缘细节都属于高频子带,而低频子带主要表征图像的近似信号。为了能够在增强图像的同时减少噪声的影响,可以对低频子带进行图像增强,用以增强目标的对比度,抑制背景;对高频部分进行小波去噪处理,减少噪声对图像的影响。![]() 图 3 小波分解示意图LL. 近似信息;HL. 水平细节信息;LH. 垂直细节信息;HH. 对角线细节信息。LL represents approximate information; HL represents horizontal detail information; LH represents vertical detail information; HH represents diagonal detail information.Figure 3. Wavelet decomposition diagram
图 3 小波分解示意图LL. 近似信息;HL. 水平细节信息;LH. 垂直细节信息;HH. 对角线细节信息。LL represents approximate information; HL represents horizontal detail information; LH represents vertical detail information; HH represents diagonal detail information.Figure 3. Wavelet decomposition diagram2.2 多尺度分割
为了提高单木树冠提取精度,实验首先排除背景区域干扰,然后针对树冠区域进行面向对象的分割。经过小波增强变换后,图像内部的树冠区域与非树冠区域的灰度值差异明显增大,因此可以采用阈值法进行树冠区域与非树冠区域的区分。阈值法的基本思想是寻找一个合适的阈值将前景和背景按照像素灰度值的大小进行分类,灰度值大于阈值归为前景(树冠),小于阈值归为背景(非树冠区域)。
多尺度分割的思想是自下而上,逐级合并。它是以图像中任一像元作为中心点,将这个像元周围异质性最小的像元集合合并成一个对象单元,然后再把这些小单元逐渐聚合成一个较大对象的过程。在这个过程中,尺度参数、形状参数、紧致度参数是需要多次试验进行确定的参数。
2.3 冠幅面积计算
影像和实地调查的树冠面积(S)计算公式[26]为:
S=π(RSN+REW)216 (1) 式中:RSN和REW分别表示树木的树冠南北冠幅和东西冠幅。
2.4 精度分析
精度验证分为单木分割精度和冠幅估测精度两个部分。若某个野外实测树木在分割结果中不存在或者在该区域出现了多个分割树冠,则判定为错误分割,正确分割的树木的百分占比即为单木分割精度;根据3种影像下的单木分割结果以及外业实测冠幅大小,结合公式(2)、(3),计算冠幅估测精度。
δ=|LM−LT|LT×100% (2) 式中:LT为真实值,即外业观测值;LM为面向对象分割结果值;δ为冠幅估测相对误差。
冠幅估测精度(R)计算公式:
R=n∑i=1(1−δi)/n (3) 式中:n为树木个数,δi为第i个树木的相对误差。
3. 结果与分析
3.1 小波增强效果
小波变换不同于傅里叶变换,根据小波母函数的不同,小波变换的结果也不尽相同。由于正交小波函数sym4进行分解时具有正交性和数据冗余最小的优点,因此本文选用sym4对图像进行处理。首先对研究区的影像进行小波二层分解,得到低频系数(近似)和高频系数(细节);然后对低频系数进行增大,对高频系数进行缩小;最后对高频系数和低频系数进行小波系数重构,得到的图像结果突出了轮廓,弱化了细节,从而达到图像增强的效果。以图4为例,将原影像进行小波分解以后,设置系数阈值,如果低频系数大于系数阈值,则将该值增大2倍,以增强轮廓信息;若高频系数小于系数阈值,则缩小为原影像的一半幅度,来弱化图像内部噪声。通过多次对比实验,为不同影像设定不同的小波系数阈值,结果详见表1。图5是桉树和杉木在3种影像下进行小波增强变换得到的结果。本文对图像增强效果进行定量分析,主要采用图像均值、标准差和边缘强度3个参量,结果如表1所示。
表 1 统计特征Table 1. Statistical characteristics树种 Species 影像 Image 小波阈值系数
Wavelet threshold coefficient边缘强度
Edge strength均值
Mean标准差
Standard deviation杉木
Cunninghamia lanceolata机载原始影像 Airborne original image 237 34.19 42.17 34.44 增强后影像 Enhancement image 70.83 78.85 68.19 桉树
Eucalyptus robusta机载原始影像 Airborne original image 306 23.88 39.69 38.91 增强后影像 Enhancement image 85.20 65.42 70.47 杉木
Cunninghamia lanceolata无人机原始影像 UAV original image 280 47.66 53.76 49.02 增强后影像 Enhancement image 90.91 95.94 99.49 桉树
Eucalyptus robusta无人机原始影像 UAV original image 500 36.38 64.19 64.89 增强后影像 Enhancement image 102.78 102.77 118.79 杉木
Cunninghamia lanceolataGF-2原始影像 GF-2 original image 1 050 150.35 131.40 103.17 增强后影像 Enhancement image 118.15 133.01 98.74 桉树
Eucalyptus robustaGF-2原始影像 GF-2 original image 1 070 169.32 120.19 116.64 增强后影像 Enhancement image 151.76 122.49 106.67 ![]() 图 4 原始影像及不同小波阈值处理后影像Figure 4. Original image and different wavelet threshold processed images
图 4 原始影像及不同小波阈值处理后影像Figure 4. Original image and different wavelet threshold processed images![]() 图 5 不同平台影像小波增强变换效果Figure 5. Wavelet enhancement transform effects for different platform images
图 5 不同平台影像小波增强变换效果Figure 5. Wavelet enhancement transform effects for different platform images从表1可以看出,机载影像和低空无人机影像经过小波增强后的图像的均值相较于原图明显增加,有良好的视觉效果;标准差的增大说明图像对比度增强;边缘强度,实质上是边缘点梯度的幅值,边缘强度越大表明图像轮廓信息越明显,经过小波增强后的图像的边缘强度显著增大,说明图像轮廓信息得到明显增强;GF-2增强后影像边缘强度和标准差的结果反而有所降低,均值变化不明显。实验结果表明:本文方法在机载和低空无人机影像上增强效果明显,为后续图像分割奠定了基础;针对GF-2影像增强统计结果,并结合影像自身特点进行分析,该影像空间分辨率为1 m,相比于其他两种平台下的影像分辨率,每棵树在影像上所包含的像元数量较少,且单木树冠有着明显的灰度最大值,周围像素依次递减,树冠与背景对比度明显,因此不需要对其进行小波增强变换处理来进行树冠内部噪声去除和增强轮廓。此外,为了更好地描绘树冠大小及边界,在小波系数阈值设定结果上可以发现,阈值的大小在不同树种和平台影像上有一定的变化规律,即在同一平台下桉树影像小波系数阈值高于杉木影像,同一区域在不同平台下阈值设定大小顺序依次为GF-2影像、低空无人机影像、机载影像。
3.2 多尺度分割提取树冠
本实验树冠分割的具体方法如下:
(1) 首先,通过树冠和背景区域多个分割对象的选取,查看其阈值分布范围,然后设定影像中树冠与背景区域之间灰度阈值界限,对分割结果进行阈值分类,结果如图6所示,绿色为树冠区域。
(2) 在分类后的树冠区域进行多尺度分割,设置尺度参数、形状参数和紧致度参数,对单木树冠进行精细分割,最终分割结果与原图像叠加显示如图6所示,外业实测的单木位置在图中以黄色标记显示。
相关分割参数及规则设置详见表2。
表 2 面向对象树冠分割参数Table 2. Object-oriented tree crown segmentation parameters项目
Item分割参数
Segmentation parameter机载影像 Airborne image 无人机影像 UAV image GF-2影像 GF-2 image 杉木Cunninghamia lanceolata 桉树Eucalyptus robusta 杉木Cunninghamia lanceolata 桉树Eucalyptus robusta 杉木Cunninghamia lanceolata 桉树Eucalyptus robusta 阈值分类
Threshold classification灰度阈值 Gray threshold > 70 > 82 > 105 > 125 > 35 > 85 单木树冠分割
Individual tree crown segmentation分割尺度 Segmentation scale 18 12 120 130 4 4 形状 Shape 0.9 0.9 0.9 0.9 0.9 0.9 紧致度 Compactness 0.5 0.9 0.9 0.8 0.7 0.8 3.3 结果验证与分析
树冠提取的单木分割精度及冠幅估测精度详见表3。由表3可知,GF-2影像无论是单木分割精度还是冠幅估测精度都明显低于其他两种影像。这与影像自身分辨率密切相关,实验区树木平均冠幅不超过4 m,GF-2影像空间分辨率为1 m,每棵树木在影像中包含的像元数量少,无法对较小树木进行有效地探测,得到树冠的形状和边界的准确描绘难度较大,从而影响了提取精度。在机载和无人机影像下单木分割精度和冠幅估测精度结果相接近,但是在处理过程中发现,在空间分辨率为厘米级的无人机影像下,仍然对林下灌草或者其他植被进行了清楚的拍摄,通过灰度阈值对树冠和背景区域进行分类的效果不佳,而机载影像适宜的空间分辨率避免了这一问题;此外,机载影像获取范围更广,数据量更小,处理速度更快。从表3中还可以发现,杉木树冠提取精度优于桉树,这是因为杉木的树冠轮廓在影像上显示更加清晰,无论是在图像增强还是单木分割上都能提高对树冠边界和大小描绘的准确性。
表 3 单木树冠提取精度分析Table 3. Accuracy analysis on extracted individual tree crown项目
Item树种
Species树木总株树
Total number
of trees正确分割株数
Correct segmentation
number of trees单木分割精度
Tree crown segmentation accuracy/%相对误差均值
Relative error mean/%冠幅估测总精度
Tree crown estimation accuracy/%机载影像
Airborne image杉木 Cunninghamia lanceolata 45 41 91.1 15.6 84.4 桉树 Eucalyptus robusta 45 40 89.0 16.1 83.9 无人机影像
UAV image杉木 Cunninghamia lanceolata 45 42 93.3 14.9 85.1 桉树 Eucalyptus robusta 45 39 87.0 15.8 84.2 GF-2影像
GF-2 image杉木 Cunninghamia lanceolata 45 40 89.0 26.7 73.3 桉树 Eucalyptus robusta 45 37 82.0 27.7 72.3 4. 结论与讨论
本文针对米级、亚米级和厘米级的遥感影像,首先采用小波变换对图像进行增强处理,然后结合多尺度分割下树冠的提取精度,进行影像适宜性分析和评价。主要结论:(1) 高分辨率影像在增强地物信息的获取能力的同时,地物信息呈现高度细节化,树冠与背景区域对比度不明显,处理结果中存在“椒盐现象”,因此引入小波变换对影像进行增强处理,针对不同影像提出了适合的小波增强变换参数,同时对增强效果进行定量分析,亚米级和厘米级影像的均值、标准差和边缘强度显著提升,说明在这两种尺度的影像下该方法能够有效增强树冠轮廓,弱化树冠内部细节;同样对米级影像进行增强处理,所得结果显示该方法并不适用于这种尺度的影像;(2) 对亚米级和厘米级影像小波增强变换后,排除背景区域的干扰,针对树冠区域进行单木树冠分割,得到杉木冠幅估测精度可达84.4%,桉树因其相对不清晰的树冠轮廓使得在估测精度上略低于杉木;(3) 对3种尺度的影像进行单木树冠分割,提出了适合的分割参数,得到的精度均能满足应用需求;米级影像的空间分辨率在单木识别和描绘树冠形态上有很大的局限性,因此杉木和桉树应用厘米级和亚米级影像可以达到更好的精度,相比于米级影像冠幅估测精度均可以提高10%以上,且获取这两种影像无论是从天气还是时间上都更加灵活,适合专业的科研学者精细调查使用,从另一个角度来看,米级影像下的提取精度也能够满足森林调查的基本需求;近几年来,随着更高空间分辨率的商用卫星陆续发射成功,如果需要一次性对大范围的森林信息进行获取,卫星影像具有很大的应用价值。
本文的研究仍存在以下不足:(1) 亚米级和厘米级影像下冠幅估测精度可达84.4%以上,证明这两种影像的空间分辨率具备准确描绘树冠大小及轮廓的能力,但树冠提取与实测数据相比仍存在偏差,一是可能外业测量冠幅大小的过程中,在树冠存在连续或者遮挡的情况下存在一定视觉误差,二是树冠区域涵盖灌草植被,影响最终精度;(2) 即使对影像进行正射校正处理,仍不能解决由摄影角度误差、地物纹理贴合不准确导致的树冠几何形变问题,从而影响最终的提取精度,在今后的研究中需要在影像几何纠正方法上进一步探讨;(3) 在本研究实验处理过程中,小波系数阈值、图像分割等参数是进行多次试验后手动设定,在后续的研究中应探究阈值系数大小选取依据以及参数自适应调节算法提高实验效率;(4) 本次研究的3种影像的空间分辨率相差10倍左右,在接下来的工作中,结合本文研究结果,寻找出最佳尺度的遥感影像,并将合适的影像应用在不同地理位置、生长状况以及生态环境的人工林中,以树冠参数为基础建立胸径、森林郁闭度、材积等林分模型,降低林业调查成本,提高研究效率。
-
![]()
图 3 祁连圆柏潜在分布环境变量重要性的刀切法检验
Figure 3. Jackknife on the importance of environmental variables for simulating potential geographical distribution of Juniperus przewalskii
![]()
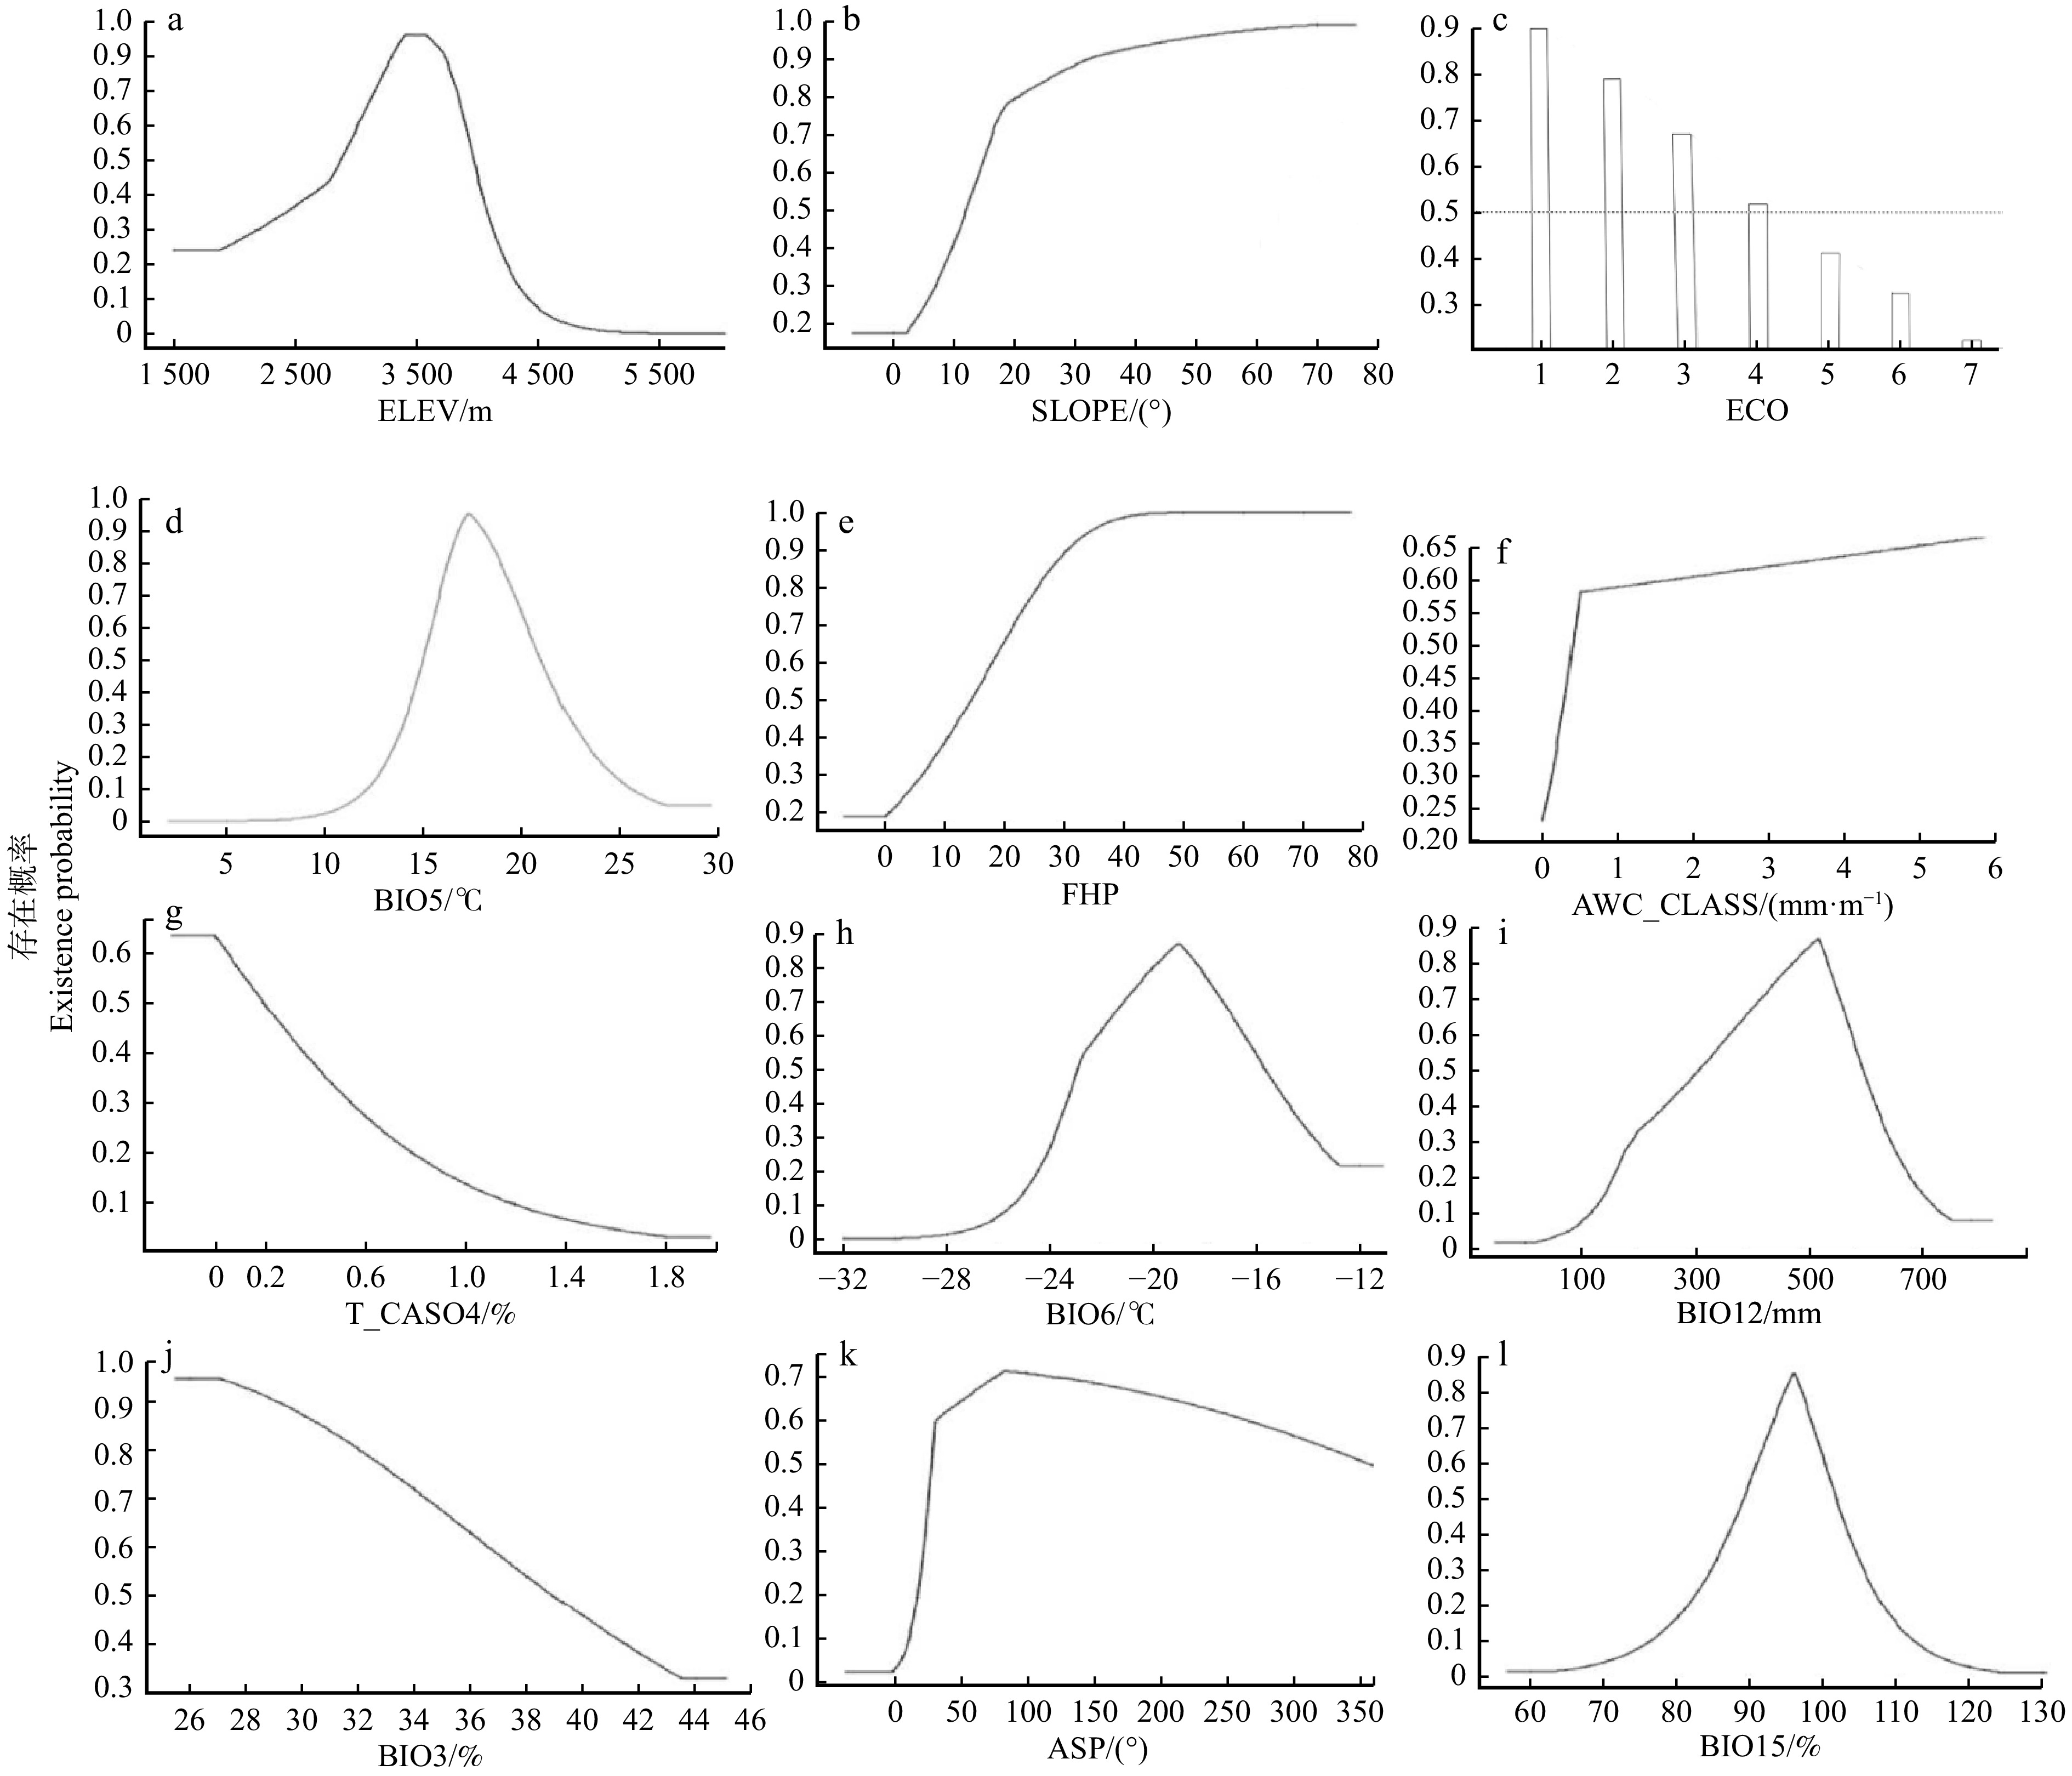
图 4 祁连圆柏潜在地理分布概率与环境因子的关系
Figure 4. Relationship between environmental factors and the distribution probability of J. przewalskii
![]()
图 5 祁连圆柏在青海省的适宜分布区
Figure 5. Distribution of suitable areas of J. przewalskii in Qinghai Province
表 1 祁连圆柏地理坐标信息和环境变量信息来源
Table 1 Sources of geographic coordinate information and environmental variables of Juniperus przewalskii
数据类型 Data type 来源 Source 简称
Abbreviation网站 Website 祁连圆柏地理坐标信息
Geographic coordinate information
of Juniperus przewalskii全球生物多样性信息网络
Global Biodiversity Information FacilityGBIF https://www.gbif.org/ 中国国家标本资源平台
National Specimen Information InfrastructureNSII http://nsii.org.cn/2017/home.php 中国数字植物标本馆
National Plant Specimen Resource CenterNPSRC https://www.cvh.ac.cn 文献报道[26] Literature coverage 实地调查 field investigation 气候变量数据Bio1 ~ Bio19
Climate variable data Bio1−Bio19世界气候数据库
WorldclimWorldClim https://www.worldclim.org/ 地形变量数据
Topography variable data中国科学院资源环境科学数据中心
Resource and Environment Science and Data CenterRESDC https://www.resdc.cn/ 土壤变量数据
Soil variable data世界土壤数据库
Harmonized World Soil DatabaseHWSD https://www.fao.org/soils-portal/en/ 生态系统变量数据
Ecosystem variable data国家地球系统科学数据中心
National Earth System Science Data CenterNSTI http://www.geodata.cn/ 人类活动强度数据
Human activity intensity data国际地球科学信息网络中心
The Center for International Earth Science Information NetworkCIESIN http://www.ciesin.org/ 祁连圆柏林现地调查数据
Field survey data of Juniperus przewalskii项目组2018—2020年青海省祁连圆柏资源现地调查
The project team investigated the site of Juniperus przewalskii resources in Qinghai Province from
2018 to 2020 下载: 导出CSV
表 2 祁连圆柏分布模拟的24个环境因子
Table 2 24 environmental factors simulated by the distribution of Juniperus przewalskii
类型 Type 用于建模的变量 Variables for modeling 单位 Unit 代码 Code 气温
Air temperature等温性 Isothermality % BIO3 最热月份最高温 Max. temperature of the warmest month ℃ BIO5 最冷月份最低温 Min. temperature of the coldest month ℃ BIO6 降水
Precipitation年平均降水量 Annual mean precipitation mm BIO12 最干月份降水量 Precipitation of the driest month mm BIO14 降水量季节性变异系数 Precipitation seasonality (coefficient of variation) % BIO15 地形
Topography海拔 Elevation m ELEV 坡度 Slope ° SLOPE 坡向 Aspect ° ASP 土壤 Soil 土壤有效水含量 Soil available water content mm/m AWC_CLASS 0 ~ 30 cm土壤碳酸盐或石灰质量分数 0−30 cm topsoil calcium carbonate % T_CACO3 0 ~ 30 cm土壤硫酸盐含量 Sulfate content in 0−30 cm soil % T_CASO4 0 ~ 30 cm土壤阳离子交换能力 0−30 cm topsoil cation exchange capacity cmol/kg T_CEC_SOIL 0 ~ 30 cm土壤黏土含量 0−30 cm topsoil clay fraction % T_CLAY 0 ~ 30 cm土壤电导率 0−30 cm topsoil conductivity dS/m T_ECE 0 ~ 30 cm土壤可交换钠盐 0−30 cm topsoil exchangeable sodium salt % T_ESP 0 ~ 30 cm土壤碎石体积百分比 0−30 cm topsoil gravel volume percentage % T_GRAVEL 0 ~ 30 cm土壤有机碳含量 0−30 cm topsoil organic carbon % T_OC 0 ~ 30 cm土壤交换性盐基 0−30 cm topsoil exchangeable base cmol/kg T_TEB 0 ~ 30 cm土壤质地 0−30 cm topsoil texture T_TEXTURE 30 ~ 100 cm土壤硫酸盐含量 Sulfate content in 30−100 cm soil % S_CASO4 FAO90土壤分类系统土壤类型 Soil classification system soil type (FAO-90) SU_CODE90 生态系统 Ecosystem 农田(1)、林地(2)、草地(3)、水体与湿地(4)、荒漠(5)、 聚落(6)和其他生态系统(7)
Farmland(1), forestland(2), grassland(3), water body and wetlands(4), desert(5),
settlement(6) and other ecosystem(7)ECO 人类活动强度
Human activity intensity人类足迹指数 Human footprint index FHP
下载: 导出CSV
表 3 用于预测模型的环境因子重要性程度
Table 3 Importance level of environmental factors used for predicting models
% 代码
Code贡献率
Contribution rate置换重要值
Permutation importance value代码
Code贡献率
Contribution rate置换重要值
Permutation importance valueELEV 37.50 ± 1.92 49.57 ± 2.43 T_CEC_SOIL 0.24 ± 0.27 0.34 ± 0.35 SLOPE 24.95 ± 3.17 2.52 ± 0.73 T_CLAY 0.09 ± 0.05 0.30 ± 0.17 ECO 9.13 ± 1.97 0.75 ± 0.42 BIO14 0.07 ± 0.23 0.01 ± 0.01 BIO5 7.69 ± 0.82 28.45 ± 1.01 T_TEXTURE 0.05 ± 0.13 0 FHP 6.14 ± 6.05 0.08 ± 0.06 S_CASO4 0.05 ± 0.08 0.08 ± 0.06 AWC_CLASS 3.49 ± 0.73 1.18 ± 0.29 T_CACO3 0.03 ± 0.07 0.01 ± 0.02 T_CASO4 3.02 ± 0.99 0.30 ± 0.65 T_GRAVEL 0.01 ± 0.01 0.01 ± 0.02 BIO6 2.39 ± 1.37 9.53 ± 1.59 SU_CODE90 0 0 BIO12 1.95 ± 0.99 3.49 ± 0.41 T_ECE 0 0 BIO3 1.65 ± 1.13 0 T_ESP 0 0 ASP 0.98 ± 0.51 0.43 ± 0.19 T_OC 0 0 BIO15 0.58 ± 0.30 2.97 ± 0.81 T_TEB 0 0
下载: 导出CSV
表 4 祁连圆柏在各环境变量条件下的适生区面积预测
Table 4 Prediction of suitable area of J. przewalskii under various environmental variables
地市级行政区
Prefecture-level
administrative region县级行政区
County-level administrative region适生区
Suitable area面积
Area/104 km2占比
Ratio/%合计 Total 3.20 100.00 西宁市
Xining City湟中区、湟源县、大通回族土族自治县
Huangzhong District, Huangyuan County, Datong Hui and Tu Autonomous County0.52 16.34 海东市
Haidong City互助土族自治县、乐都区、平安区、化隆回族自治县、循化撒拉族自治县、
民和回族土族自治县 Tu Autonomous County of Huzhu, Ledu District, Ping’an
District, Hui Autonomous County of Hualong, Salar Autonomous County of Xunhua,
Minhe Hui and Tu Autonomous County0.82 25.49 海北藏族自治州
Haibei Xizang Autonomous
Prefecture祁连县、门源回族自治县、海晏县、刚察县
Qilian County, Menyuan Hui Autonomous County, Haiyan County, Gangcha County0.60 18.61 黄南藏族自治州
Huangnan Xizang Autonomous
Prefecture同仁市、泽库县、尖扎县、河南蒙古族自治县
Tongren City, Zeku County, Jianzha County, Mongolian Autonomous County of Henan0.40 12.36 海南藏族自治州
Hainan Xizang Autonomous
Prefecture共和县、贵南县、贵德县、同德县、兴海县
Gonghe County, Guinan County, Guide County, Tongde County, Xinghai County0.44 13.78 海西蒙古族藏族自治州
Haixi Mongolian and Xizang
Autonomous Prefecture德令哈市、乌兰县、都兰县、天峻县
Delingha City, Ulan County, Dulan County, Tianjun County0.25 7.87 果洛藏族自治州
Guoluo (Golog) Xizang
Autonomous Prefecture玛沁县、班玛县
Maqin County, Banma County0.14 4.51 玉树藏族自治州
Yushu Xizang Autonomous
Prefecture玉树市
Yushu City0.03 1.04
下载: 导出CSV
-
[1] 吴成基. 自然地理学[M]. 北京: 科学出版社, 2008: 271−282. Wu C J. Physical geography[M]. Beijing: Science Press, 2008: 271−282.
[2] Zhan Q Q, Zhao W, Yang M J, et al. A long-term record (1995—2019) of the dynamics of land desertification in the middle reaches of Yarlung Zangbo River Basin derived from Landsat data[J]. Geography and Sustainability, 2021, 2(1): 12−21.
[3] Li X L, Gao J, Zhang J, et al. Natural and anthropogenic influences on the spatiotemporal change of degraded meadows in southern Qinghai Province, West China: 1976−2015[J]. Applied Geography, 2018, 97: 176−183. doi: 10.1016/j.apgeog.2018.06.011
[4] 曹倩, 高庆波, 郭万军, 等. 基于MaxEnt模拟人类活动与环境因子对青藏高原特有植物祁连獐牙菜潜在分布的影响[J]. 植物科学学报, 2021, 39(1): 22−31. Cao Q, Gao Q B, Guo W J, et al. Impacts of human activities and environmental factors on potential distribution of Swertia przewalskii Pissjauk, an endemic plant in Qing-Tibetan Plateau, using MaxEnt[J]. Plant Science Journal, 2021, 39(1): 22−31.
[5] 董苏君, 马松梅, 张丹, 等. 新疆猪毛菜属植物多样性地理分布格局及其环境解释[J/OL]. 生态学报, 2023, 43(19): 1−10 [2023−09−01]. https://kns.cnki.net/kcms/detail/11.2031.0.20230515.1410.018.html. Dong S J, Ma S M, Zhang D, et al. Gegraphy distribution pattern and the enyironmental interpretation of plant species of Salsola genus in Xinjiang[J/OL]. Acta Ecologica Sinica, 2023, 43(19): 1−10 [2023−09−01]. https://kns.cnki.net/kcms/detail/11.2031.0.20230515.1410.018.html.
[6] Gibson L, Lee T M, Koh L P, et al. Primary forests are irreplaceable for sustaining tropical biodiversity[J]. Nature, 2011, 478: 378−381. doi: 10.1038/nature10425
[7] Gibson L, Lynam A J, Bradshaw C J A, et al. Near-complete extinction of native small mammal fauna 25 years after forest fragmentation[J]. Science, 2013, 341: 1508−1510. doi: 10.1126/science.1240495
[8] Bellard C, Bertelsmeier C, Leadley P, et al. Impacts of climate change on the future of biodiversity[J]. Ecology Letters, 2012, 15(4): 365−377. doi: 10.1111/j.1461-0248.2011.01736.x
[9] 张静, 陈志林, 侯晓巍, 等. 三江源区祁连圆柏群落物种多样性沿海拔梯度的变化格局[J]. 西北植物学报, 2020, 40(10): 1759−1767. Zhang J, Chen Z L, Hou X W, et al. Species diversity of Juniperus przewalskii community in Three River Headwater along altitude gradient[J]. Acta Botanica Boreali-Occidenta-lia Sinica, 2020, 40(10): 1759−1767.
[10] Peng J F, Gou X H, Chen F H, et al. Climate-growth relationships of Qilian juniper ( Sabina przewalskii) in the Anyemaqen Mountains, Tibet[J]. Climate Research, 2010, 41: 31−40. doi: 10.3354/cr00834
[11] Piao S L, Fang J Y, He J S. Variations in vegetation net primary production in the Qinghai-Xizang Plateau, China, from 1982 to 1999[J]. Climate Change, 2006, 74: 253−267. doi: 10.1007/s10584-005-6339-8
[12] Harris R B. Rangeland degradation on the Qinghai-Tibetan plateau: A review of the evidence of its magnitude and causes[J]. Journal of Arid Environments, 2010, 74(1): 1−12.
[13] 雷军成, 徐海根. 基于MaxEnt的加拿大一枝黄花在中国的潜在分布区预测[J]. 生态与农村环境学报, 2010, 26(2): 137−141. Lei J C, Xu H G. MaxEnt-based prediction of potential distribution of Solidago canadensis in China[J]. Journal of Ecology and Rural Environment, 2010, 26(2): 137−141.
[14] 唐燕, 赵儒楠, 任钢, 等. 基于MaxEnt模型的中华枸杞潜在分布预测及其重要影响因子分析[J]. 北京林业大学学报, 2021, 43(6): 23−32. Tang Y, Zhao R N, Ren G, et al. Prediction of potential distribution of Lycium chinense based on MaxEnt model and analysis of its important influencing factors[J]. Journal of Beijing Forestry University, 2021, 43(6): 23−32.
[15] 张童, 黄治昊, 彭杨靖, 等. 基于MaxEnt模型的软枣猕猴桃在中国潜在适生区预测[J]. 生态学报, 2020, 40(14): 4921−4928. Zhang T, Huang Z H, Peng Y J, et al. Prediction of potential suitable areas of Actinidia arguta in China based on MaxEnt model[J]. Acta Ecologica Sinica, 2020, 40(14): 4921−4928.
[16] 朱耿平, 乔慧捷. MaxEnt模型复杂度对物种分布区预测的影响[J]. 生物多样性, 2016, 24(10): 1189−1196. doi: 10.17520/biods.2016265 Zhu G P, Qiao H J. Effect of the MaxEnt model’s complexity on the prediction of species potential distributions[J]. Biodiversity Science, 2016, 24(10): 1189−1196. doi: 10.17520/biods.2016265
[17] Radosavljevic A, Anderson R P. Making better MaxEnt models of species distributions: complexity, overfitting and evaluation[J]. Journal of Biogeography, 2014, 41: 629−643. doi: 10.1111/jbi.12227
[18] Cobos M E, Peterson A, Tbarve N, et al. Kuenm: an R package for detailed development of ecological niche models using MaxEnt[J/OL]. Peer J, 2019, 7: e6281[2022−12−20]. https://doi.org/10.7717/peerj.6281.
[19] Fick S E, Hijmans R J. WorldClim 2: new 1-km spatial resolution climate surfaces for global land areas[J]. International Journal of Climatology, 2017, 37(12): 4302−4315. doi: 10.1002/joc.5086
[20] Fischer G, Nachtergaele F, Prieler S, et al. Global agro-ecological zones assessment for agriculture (GAEZ 2008)[J]. IIASA, Laxenburg, Austria and FAO, Rome, Italy, 2008, 10.
[21] 徐新良, 刘纪远, 张增祥, 等. 中国5年间隔陆地生态系统空间分布数据集(1990—2010)内容与研发[J]. 全球变化数据学报, 2017, 1(1): 52−59. Xu X L, Liu J Y, Zhang Z X, et al. A time series land ecosystem classification dataset of China in five year increments (1990−2010)[J]. Journal of Global Change Data & Discovery, 2017, 1(1): 52−59.
[22] Venter O, Sanderson E W, Magrach A, et al. Last of the wild project, Version 3 (LWP-3): 2009 human footprint, 2018 release[R/OL]. New York: NASA Socioeconomic Data and Applications Center (SEDAC)[2023−10−12]. https://doi.org/10.7927/H4H9938Z.
[23] Venter O, Sanderson E W, Magrach A, et al. Global terrestrial human footprint maps for 1993 and 2009[J]. Scientific Data, 2016, 3(1): 1−10.
[24] Warren D L, Glor R E, Turelli M. ENMTools: a toolbox for comparative studies of environmental niche models[J]. Ecography, 2010, 33: 607−611. doi: 10.1111/j.1600-0587.2009.06142.x
[25] Gacesa R, Kurilshikov A. Vich Vila A, et al. Environmental factors shaping the gut microbiome in a Dutch population[J]. Nature, 2022, 604: 732−739. doi: 10.1038/s41586-022-04567-7
[26] 张茜. 祁连圆柏的分子谱系地理学研究[D]. 兰州: 兰州大学, 2008. Zhang Q. Molecular phylogeography of Juniperus przewalskii (Cupressaceae) [D]. Lanzhou: Lanzhou University, 2008.
[27] Yang X Q, Kushwaha S P S, Saran S, et al. MaxEnt modeling for predicting the potential distribution of medicinal plant, Justicia adhatoda L. in Lesser Himalayan foothills[J]. Ecological Engineering, 2013, 51: 83−87. doi: 10.1016/j.ecoleng.2012.12.004
[28] Zhang M G, Zhou Z K, Chen W Y, et al. Major declines of woody plant species ranges under climate change in Yunnan, China[J]. Diversity and Distributions, 2014, 20(4): 405−415. doi: 10.1111/ddi.12165
[29] Phillips S J, Anderson R P, Dudík M, et al. Opening the black box: an open-source release of MaxEnt[J]. Ecography, 2017, 40(7): 887−893. doi: 10.1111/ecog.03049
[30] Shcheglovitova M, Anderson R P. Estimating optimal complexity for ecological niche models: a jackknife approach for species with small sample sizes[J]. Ecological Modelling, 2013, 269: 9−17. doi: 10.1016/j.ecolmodel.2013.08.011
[31] Phillips S J. A brief tutorial on MaxEnt [EB/OL][2020−12−04]. http://biodiversityinformatics.amnh.org/open_source/maxent/.
[32] Rong Z L, Zhao C Y, Liu J J, et al. Modeling the effect of climate change on the potential distribution of Qinghai spruce (Picea crassifolia Kom.) in Qilian Mountains[J/OL]. Forests, 2019, 10: 62[2023−01−23]. https://doi.org/10.3390/f10010062.
[33] 张伟萍, 胡云云, 李智华, 等. 气候变化情景下祁连圆柏在青海省的适宜分布区预测[J]. 应用生态学报, 2021, 32(7): 2514−2524. Zhang W P, Hu Y Y, Li Z H, et al. Predicting suitable distribution areas of Juniperus przewalskii in Qinghai Province under climate change scenarios[J]. Chinese Journal of Applied Ecology, 2021, 32(7): 2514−2524.
[34] Warren D L, Seifert S N. Ecological niche modeling in MaxEnt: the importance of model complexity and the performance of model selection criteria[J]. Ecological Applications, 2011, 21(2): 335−342. doi: 10.1890/10-1171.1
[35] Warren D L, Wright A N, Seifert S N, et al. Incorporating model complexity and spatial sampling bias into ecological niche models of climate change risks faced by 90 California vertebrate species of concern[J]. Diversity and Distributions, 2014, 20: 334−343. doi: 10.1111/ddi.12160
[36] 中国科学院中国植物志编辑委员会. 中国植物志[M]. 北京: 科学出版社, 1978: 375. Editorial Committee of Flora of China, Chinese Academy of Sciences. Flora of China[M]. Beijing: Science Press, 1978: 375.
[37] 中国科学院植物研究所系统与进化植物学国家重点实验室. iPlant 植物智−植物物种信息系统[EB/OL][2019−11−23]. http://www.iplant.cn/info/%E7%A5%81%E8%BF%9E%E5%9C%86%E6%9F%8F?t=f. Institute of Botany, the Chinese Academy of Sciences. State Key Laboratory of Systematic and Evolutionary Botany (LSEB). iPlant[EB/OL][2019−11−23]. http://www.iplant.cn/info/%E7%A5%81%E8%BF%9E%E5%9C%86%E6%9F%8F?t=f.
[38] 朱耿平, 刘强, 高玉葆. 提高生态位模型转移能力来模拟入侵物种的潜在分布[J]. 生物多样性, 2014, 22(2): 223−230. doi: 10.3724/SP.J.1003.2014.08178 Zhu G P, Liu Q, Gao Y B. Improving ecological niche model transferability to predict the potential distribution of invasive exotic species[J]. Biodiversity Science, 2014, 22(2): 223−230. doi: 10.3724/SP.J.1003.2014.08178
[39] Muscarella R, Galante P J, Soley-Guardia M. ENMeval: an R package for conducting spatially independent evaluations and estimating optimal model complexity for MAXENT ecological niche models[J]. Methods in Ecology and Evolution, 2014, 5: 1198−1205. doi: 10.1111/2041-210X.12261
[40] Leeuw J D. Information theory and an extension of the maximum likelihood principle by Hirotogu Akaike[J]. Department of Statistics Ucla, 1994, 87: 284−292.
[41] 叶利奇, 张伟皓, 叶兴状, 等. 基于MaxEnt模型的珙桐潜在分布预测及其重要影响因子分析[J]. 四川农业大学学报, 2021, 39(5): 604−612. Ye L Q, Zhang W H, Ye X Z, et al. Prediction of potential distribution area and analysis of dominant environmental variables of Davidia involucrate based on MaxEnt[J]. Journal of Sichuan Agricultural University, 2021, 39(5): 604−612.
[42] 张明珠, 叶兴状, 刘益鹏, 等. 基于SSPs 预测格木在中国的潜在地理分布[J]. 北京林业大学学报, 2022, 44(4): 54−65. Zhang M Z, Ye X Z, Liu Y P, et al. Predicting the potential geographical distribution of Erythrophleum fordii in China based on SSPs[J]. Journal of Beijing Forestry University, 2022, 44(4): 54−65.
[43] 王艳君, 高泰, 石娟. 基于MaxEnt模型对舞毒蛾全球适生区的预测及分析[J]. 北京林业大学学报, 2021, 43(9): 59−69. Wang Y J, Gao T, Shi J. Prediction and analysis of the global suitability of Lymantria dispar based on MaxEnt[J]. Journal of Beijing Forestry University, 2021, 43(9): 59−69.
[44] 郭飞龙, 徐刚标, 卢孟柱, 等. 基于MaxEnt模型分析胡杨潜在适宜分布区[J]. 林业科学, 2020, 56(5): 184−192. Guo F L, Xu G B, Lu M Z, et al. 2020. Prediction of potential suitable distribution areas for Populus euphratica using the MaxEnt model[J]. Scientia Silvae Sinicae, 2020, 56(5): 184−192.
[45] 邵雪梅, 黄磊, 刘洪滨, 等. 树轮记录的青海德令哈地区千年降水变化[J]. 中国科学: D 辑, 2004, 34(2): 145−153. Shao X M, Huang L, Liu H B, et al. Reconstruction of precipitation variation from tree rings in recent 1 000 years in Delingha, Qinghai[J]. Science in China: Series D, 2004, 34(2): 145−153.
[46] 刘录三, 邵雪梅, 梁尔源. 祁连山中部祁连圆柏生长与更新方式的树轮记录[J]. 地理研究, 2006, 25(1): 53−61. Liu L S, Shao X M, Liang E Y, et al. Tree ring records of Qilian Juniper’s growth and regeneration patterns in the central Qilian Mountains[J]. Geographical Research, 2006, 25(1): 53−61.
[47] 刘贤德, 王清忠, 孟好军. 祁连圆柏[M]. 北京: 中国科学技术出版社, 2006: 1−149. Liu X D, Wang Q Z, Meng H J. Qilian Juniper (Sabina przewalskii Kom.)[M]. Beijing: China Science and Technology Press, 2006: 1−149.
[48] 刘喜梅, 李海朝. 不同海拔高度祁连圆柏叶中挥发性成分的比较[J]. 北京林业大学学报, 2014, 36(1): 126−131. Liu X M, Li H C. Comparison of volatile components of Sabina przewalskii in different altitudes[J]. Journal of Beijing Forestry University, 2014, 36(1): 126−131.
[49] 戎战磊. 气候变化对祁连山优势物种分布和植被格局的影响[D]. 兰州: 兰州大学, 2019. Rong Z L. Effects of climate change on distribution of dominant species and pattern of vegetation in Qilian Mountains[M]. Lanzhou: Lanzhou University, 2019.
[50] Burke A. Classification and ordination of plant communities of the Naukluft Mountains, Namibia[J]. Journal of Vegetation Science, 2001, 12(1): 53−60. doi: 10.1111/j.1654-1103.2001.tb02616.x
[51] Gaston K J. Global patterns in biodiversity[J]. Nature, 2000, 405: 220−227. doi: 10.1038/35012228
[52] 唐志红, 尉秋实, 刘虎俊, 等. 祁连山东段高寒植被群落特征及其与地形气候因子关系研究[J]. 生态学报, 2020, 40(1): 223−232. Tang Z H, Yu Q S, Liu H J, et al. Characteristics of alpine vegetation community and its relationship to topographic climate factors in the eastern Qilian Mountain[J]. Acta Ecologica Sinica, 2020, 40(1): 223−232.
[53] 陈文年, 吴宁, 罗鹏. 氓江上游祁连山圆柏群落结构研究[J]. 应用生态学报, 2005, 16(2): 197−202. Chen W N, Wu N, Luo P. Sabina przewalskii community structure in the upper reaches of Minjiang River[J]. Chinese Journal of Applied Ecology, 2005, 16(2): 197−202.
[54] 高静, 单鸣秋, 丁安伟, 等. 柏科药用植物研究进展[J]. 中药材, 2008, 31(11): 1765−1769. Gao J, Shan M Q, Ding A W, et al. Advances in medicinal plants of Cupressaceae[J]. Journal of Chinese Medicinal Materials, 2008, 31(11): 1765−1769.
[55] 文陇英, 陈拓, 张满效, 等. 不同生境下祁连圆柏叶片色素和稳定碳同位素组成的变化[J]. 冰川冻土, 2010, 32(4): 823−828. Wen L Y, Chen T, Zhang M X, et al. Variations of pigments and stable-carbonisotope ratios in Sabina przewalskii under different environments[J]. Journal of Glaciology and Geocryology, 2010, 32(4): 823−828.
[56] Sillero N. What does ecological modelling model? a proposed classification of ecological niche models based on their underlying methods[J]. Ecological Modelling, 2011, 222(8): 1343−1346. doi: 10.1016/j.ecolmodel.2011.01.018
[57] Guo Y L, Li X, Zhao Z F, et al. Modeling the distribution of Populus euphratica in the Heihe River Basin, an inland river basin in an arid region of China[J]. Science China: Earth Sciences, 2018, 61(11): 1669−1684. doi: 10.1007/s11430-017-9241-2
-
期刊类型引用(3)
1. 张露月,刘艳红,韩冬青. 连香树雌雄株生长及适应性策略差异. 北京林业大学学报. 2024(12): 71-81 .  本站查看
本站查看
2. 亢红伟,岳康杰,刘慧欣,王佳丽,田旭平. 性别和叶形对圆柏气体交换参数和叶绿素荧光特征的影响. 植物科学学报. 2024(06): 791-799 . 百度学术
3. 孙晓伟,王兴昌,孙慧珍,全先奎,杨青杰. 雌雄异株树种山杨、水曲柳和东北红豆杉光合特性对比. 南京林业大学学报(自然科学版). 2023(01): 129-135 . 百度学术
其他类型引用(5)


计量
- 文章访问数: 510
- HTML全文浏览量: 74
- PDF下载量: 88
- 被引次数: 8
