
Construction of individual tree DBH growth models for natural Betula platyphylla forests in Daxing’an Mountains, Inner Mongolia of northern China
-
摘要:目的
为准确预测内蒙古大兴安岭林区的白桦天然林单木生长并制定适应性经营管理措施,构建包含气候因子和林木大小多样性因子的白桦单木胸径生长混合效应模型。
方法数据来源于内蒙古大兴安岭林区第8和9次森林资源清查数据,共筛选出符合要求的固定样地97块,白桦样木4 785株。基于筛选的数据,运用逐步回归法,构建传统单木胸径生长模型,并在此模型的基础上,引入样地随机效应,构建白桦单木胸径生长混合效应模型。利用十折交叉验证法分别对已构建的基础模型和混合效应模型进行检验。
结果期初胸径的对数、大于对象木的断面积和、样地内胸径标准差、生长积温和年平均降雨量对白桦单木胸径生长量存在显著影响。与基础模型相比,混合效应模型的调整决定系数提高了0.120 6,均方根误差降低了0.097 1 cm2,模型的预测精度显著提高。十折交叉验证的结果表明混合效应模型同样表现出较好的拟合结果。
结论包含气候因子和林木大小多样性因子的白桦单木胸径生长混合效应模型能精准预测白桦单木胸径的生长动态,可以为内蒙古大兴安岭林区的白桦天然林的科学经营提供支持。
Abstract:ObjectiveIn order to accurately predict growth and formulate adaptive management measures for natural Betula platyphylla forests in Daxing’an Mountains, Inner Mongolia of northern China, a mixed-effects individual-tree DBH growth model of Betula platyphylla, including climatic factors and tree size diversity factors, was developed.
MethodThe data were derived from the 8th and 9th national forest inventory in Daxing’an Mountains of Inner Mongolia, including a total of 97 fixed sample plots and 4 785 sample tree observations of Betula platyphylla. Based on the selected data, the traditional growth model of individual-tree DBH was constructed by stepwise regression method. Then, sample plot effects were added to construct individual-tree mixed-effects model of Betula platyphylla. Finally, we validated the basic model and the mixed-effects model by 10-fold cross-validation method.
ResultThe logarithm of initial DBH, basal area of trees larger than the subject tree, standard deviation of DBHs, growth accumulation temperature and mean annual precipitation had significant effects on individual-tree DBH growth of Betula platyphylla. Compared with basic model, R2adj of final mixed-effects model increased by 0.120 6, and the root mean square error decreased by 0.097 1 cm2, respectively. The prediction accuracy of the mixed-effects model improved significantly. The results of 10-fold cross-validation indicated that the mixed-effects model also showed a better fitting result.
ConclusionThe individual-tree DBH growth mixed-effects model of Betula platyphylla including climatic factors and tree size diversity factors can accurately predict the DBH growth of individual trees, which can provide support for scientific management of natural Betula platyphylla forests in Daxing’an Mountains, Inner Mongolia of northern China.
-
天然林林分结构复杂多样,树种组成丰富。双碳战略背景下,为最大限度地发挥森林在固碳释氧、生物多样性保育等方面的重要作用,必须及时了解林木的生长动态特征及变化规律,科学地开展天然林经营管理。林分生长与收获模型广泛应用于森林生长预测,包括全林分模型、径阶模型和单木模型[1]。其中单木模型以单株林木为基本单元,基于林木之间的竞争关系,在复杂天然林中能够精准预测单木生长量[2],并较为准确地掌握不同时期的单株林木生长情况,从而可以针对单株林木采取抚育措施,促进林木生长,提高固碳能力。
目前,已有许多学者针对不同树种构建了特定的单木胸径生长模型[3−6]。如段劼等[3]、杜志等[4]、芦海涛等[5]运用传统回归分析法,分别构建了油松(Pinus tabuliformis)、马尾松(P. massoniana)和水曲柳(Fraxinus mandshurica)单木胸径生长模型。这些模型考虑了林木大小、竞争关系和立地条件等因素。然而,树木生长是一个复杂的过程,除了上述因素外,还受到气候因子(如温度、降雨量等)[7]、林木结构多样性因子等[8−9]影响。例如,Lei等[10]采用树种、林木大小和树高多样性指数来表示林分结构多样性,发现林分结构多样性与森林净生长和保留木生长存在显著正相关关系,但对林木枯损和进界影响不显著。此外,气候变化也会显著影响森林的幼苗建植[11]、林木生长[12]、树种分布格局和种间竞争[13]。通过获取样地的气候数据,可以预测未来气候变化下的林木生长,并制定气候适应性森林经营措施[14]。目前,关于林木大小多样性及气候因子与单木生长之间关系的研究相对较少。因此,有必要将林木大小多样性及气候因子纳入单木模型中,研究它们与林木生长之间的关系,为实现森林可持续经营提供科学支撑。
普通最小二乘回归(ordinary least squares regression,OLS)广泛应用于单木模型的构建。OLS方法要求数据满足以下假设:统计独立性、残差服从正态分布且残差方差相等[15]。然而,林业调查数据多为纵向数据,具有多层嵌套结构和重复测量的特点[16]。如果采用传统的回归分析方法,可能会导致模型参数的有偏估计[17]。混合效应模型通过引入随机效应来描述组内和组间变异性,为处理纵向和嵌套数据提供了一种有效的解决方案[14]。目前,混合效应模型已被广泛应用于林业建模中,包括树高–胸径模型[18]、单木生长、枯损和进界模型[19−21]、树干削度模型[22]等。
白桦(Betula platyphylla)是大兴安岭林区的主要树种,具有较强的天然更新能力,是天然林演替过程中的先锋树种[23]。白桦天然林对内蒙古大兴安岭林区的水土保持、土壤肥力提升、固碳释氧、生态系统平衡具有重要意义[6]。因此,本研究以内蒙古大兴安岭林区白桦天然林为研究对象,基于第8和9次全国森林资源清查的97块白桦为优势树种的固定样地,共计4 785株白桦样木数据,构建包含林木大小多样性和气候因子的白桦单木胸径生长模型。研究目标包括:(1)探究各变量对白桦单木胸径生长的影响,进而甄别影响林木生长动态变化的来源及重要影响因素;(2)构建白桦单木胸径生长混合效应模型,以期为内蒙古大兴安岭林区白桦天然林管理策略的制定提供数据支持。
1. 研究区概况与研究方法
1.1 研究区概况
研究区位于内蒙古大兴安岭林区,地理位置位于119°36′30″ ~ 125°24′00″E,47°03′40″ ~ 53°20′00″N。该区域东西跨度为384 km,南北跨度位696 km,覆盖呼伦贝尔市、兴安盟的9个旗市。研究区平均海拔范围为250 ~ 1 745 m,属寒温带大陆性气候,夏季多雨,冬季干燥,年均温度3.5 ℃,日照时长达2 550 h,平均全年无霜期为98 d。土壤类型从南向北呈地带性分布特征。主要植被类型有兴安落叶松(Larix gmelinii)、黑桦(Betula dahurica)、樟子松(Pinus sylvestris var. mongolica)、蒙古栎(Quercus mongolica)、白桦等。
1.2 数据来源
研究基于内蒙古大兴安岭林区第8次(2013年)、第9次(2018年)全国森林资源连续清查固定样地数据(简称“一类清查数据”),从中筛选出以白桦为优势树种的天然林(白桦树种组成的比例在60%以上)样地97块,共计4 785株白桦样木数据,样地面积为0.066 7 hm2。
每块固定样地包括两类调查指标,即样木调查因子和样地调查因子。其中,样木调查因子主要针对固定样地进行每木检尺,并详细记录样地内所有林木的相对位置,即方位角和水平距;样地调查因子主要包括样地横纵坐标、海拔、坡度、坡向、林分密度、土层厚度、腐殖质厚度等。样地基本情况统计见表1。表2展示了97块白桦天然林样地内主要树种的断面积和蓄积量。
表 1 白桦天然林样地和样木调查数据Table 1. Survey data on natural Betula platyphylla forest sample plots and sample trees组别
Group变量符号
Variable symbol描述
Description最小值
Min. value最大值
Max. value均值
Mean标准差
SD单木 Individual tree (n = 4 785) D1 期初胸径 Initial DBH/cm 5.0 47.7 12.9 5.6 D2 期末胸径 Final DBH/cm 5.1 49.0 13.6 5.8 V 前期材积 Initial volume/m3 0.001 1.312 0.095 0.112 样地 Sample plot (n = 97) T 平均年龄/a Mean age/year 23 115 66 18 Hm 平均树高 Mean tree height/m 9.2 22.0 15.3 2.6 Dm 林分平均胸径 Stand mean DBH/cm 7.3 32.7 14.0 3.7 E 海拔 Elevation/m 168 127 9 908 202 S 坡度 Slope/(°) 1.0 30.0 6.6 4.8 A 坡向 Aspect/(°) 0.0 315.0 157.3 110.8 ST 土层厚度 Soil thickness/cm 6 65 28 11 HT 腐殖质层厚度 Humus thickness/cm 1 15 5 3 N 林分密度/(株·hm−2)
Stand density/(tree·ha−1)285 2 985 1 319 527 表 2 白桦天然林样地主要树种统计Table 2. Statistics of main tree species in sample plots of natural Betula platyphylla forests树种
Tree species总断面积
Total basal area/m2断面积占比
Proportion of basal area/%总蓄积
Total volume/m3蓄积占比
Proportion of volume/%白桦 Betula platyphylla 74.34 79.26 455.13 78.03 兴安落叶松 Larix gmelinii 13.59 14.49 90.51 15.52 蒙古栎 Quercus mongolica 0.59 0.63 1.92 0.33 柳树 Salix spp. 0.14 0.15 0.59 0.10 其他软阔类 Other soft broadleaved trees 5.13 5.47 35.10 6.02 合计 Total 93.79 100.00 583.25 100.00 气候数据通过Climate AP软件[24]获得。输入选定样地坐标后,该软件能够提供过去多年气候数据。本研究使用了2013—2018年样地气候数据,计算了各项主要气候指标的平均值,用于模型的构建。具体气候因子信息见表3。
表 3 研究期间白桦天然林样地气候变量统计Table 3. Statistical analysis of climate variables in sample plots of natural Betula platyphylla forests during study period变量符号
Variable symbol描述
Description最小值
Min. value最大值
Max. value平均值
Mean标准差
SDTw 最热月均温 Mean warmest month temperature/℃ 16.68 20.52 18.20 0.73 Tc 最冷月均温 Mean coldest month temperature/℃ −28.00 −22.24 −25.92 1.21 Tm 年平均气温 Mean annual temperature/℃ −3.98 0.64 −2.47 0.80 TD 平均气温差 Annual mean temperature difference 39.90 45.60 44.11 1.00 Pm 年均降雨量 Mean annual precipitation/mm 413.40 528.00 466.96 22.86 IM 年湿热指数 Annual heat/moisture index (Tm + 10)/(Pm/ 1000 )13.32 22.14 16.93 1.97 Ta 生长积温 Accumulated growth temperature/℃ 1 071.40 1 749.00 1 278.89 117.96 DNFF 无霜期天数 Number of frost-free days 110 155 127 7.82 TEM 30年来的极端低温 Extreme min. temperature over the past 30 years/℃ −45.30 −35.40 −41.11 1.99 TEX 30年来的极端高温 Extreme max. temperature over the past 30 years/℃ 30.30 32.60 31.28 0.41 IH 哈格里夫斯降水指数 Hargreaves precipitation index 536.6 635.2 572.7 18.49 ID 哈格里夫斯水分缺失指数 Hargreaves moisture deficit index 142.0 246.0 198.5 21.64 1.3 模型构建
1.3.1 变量的选择和基础模型的构建
为了探究气候和林木大小多样性对白桦单木胸径生长的影响,并构建高预估精度的白桦天然林单木胸径生长模型,本研究将气候和林木大小多样性因子作为自变量引入模型之中。此外,选取不同的因变量参与模型构建可能会得到精度差异较大的回归模型。Bella[25]研究发现,以单株林木的断面积增长量作为因变量时,构建的生长模型预测精度要高于单木胸径增长量模型。Wykoff[26]针对11个针叶树种构建了单木模型,发现将期末、期初胸径平方的差值取对数作为因变量,模型的拟合精度较高。在模型的构建过程中,可能存在两期调查数据胸径生长量为0的情况,或者生长量小于1时,取对数进行建模会出现因变量无法计算以及误差较大的情况。为解决这一问题,本研究在胸径平方生长量(DDS = D22 − D12,其中D1和D2分别表示期初胸径和期末胸径)添加了一个常数1后,进行对数变换[19],即ln(DDS + 1)作为因变量。同时,林木大小、林木竞争、立地条件、气候和林木大小多样性5类因子作为自变量,构建包含气候因子和林木大小多样性因子的白桦天然林单木胸径生长模型。
ln(DDS+1)=a0+f(x1)+f(x2)+f(x3)+f(x4)+f(x5) (1) 式中:a0为常数项,f(x1)、f(x2)、f(x3)、f(x4)和f(x5)分别表示林木大小、林木竞争、立地因子、气候因子和林木大小多样性所构成的函数。
上述5类因子所包含的具体变量如下。
(1)林木大小因子主要使用期初胸径(D1)进行表示,包括D1、1/D1、D12和ln D1。
(2)林木竞争因子主要包括单木水平竞争指标对象木期初胸径与林分平均胸径(Dm)之比(D1/Dm)、大于对象木断面积和(BAL)、林分水平竞争指标林分断面积(BAS)和林分密度(N)。
(3)立地因子主要包括土层厚度(ST)、腐殖质厚度(HT)、海拔(E)、坡度(S)和坡向(A,正北0°,西北45°,正西90°,以此类推)。考虑到海拔、坡度和坡向之间的交互作用,根据Stage[27]提出的公式对三者进行了组合,得到Ssin = tan S × sin A,Scos = tan S × cos A,Esin = ln E × sin A和Ecos = ln E × cos A。
(4)气候因子主要包括年平均气温(Tm)、最热月气温(Tw)、最冷月气温(Tc)、平均气温差(TD)、年降雨量(Pm)、湿热指数(IM)、生长积温(Ta)、无霜期天数(DNFF)、30年来的极端低温(TEM)、30年来的极端高温(TEX)、哈格里夫斯降水指数(IH)、哈格里夫斯水分缺失指数量(ID)。
(5)林木大小多样性因子主要采用香农指数(IS)、基尼系数(G)和样地内胸径标准差(SD)。
IS=−∑di=1pi⋅lnpi (2) 式中:d为样地中径阶总数,pi为第i个径阶在样地胸高断面积中所占比例。
G=∑nt=1(2t−n−1)Bt∑nt=1Bt(n−1) (3) 式中:n为样地内林木株数,Bt为第t株林木的胸高断面积。
SD=√∑ni=1(Di−¯D)2n−1 (4) 式中:n为样地内林木株数,Di为第i株林木的胸径,¯D为样地内各林木胸径的算数平均值。
在构建线性回归模型之前,采用Spearman相关性分析法确定与因变量相关性显著(P < 0.05)的林分因子和气候因子进入模型参与逐步回归。此外,采用方差膨胀因子(variance inflation factor,VIF)来判断模型中的自变量之间是否存在共线性,一般来说VIF > 5的自变量将会被剔除,最终保留共线性弱且回归系数显著的变量。
1.3.2 混合效应模型的构建
采用单水平线性混合效应模型的方法构建包含气候因子和林木大小多样性因子的白桦天然林单木胸径生长模型。将不同的样地作为随机效应引入基础模型,可以更有针对性地预测出每一块样地中林木胸径的生长量。具体的混合效应模型形式为
\left\{\begin{array}{*{20}{c}}{\boldsymbol{y}}_{i}={\boldsymbol{X}}_{i}{\boldsymbol{\beta}}+\boldsymbol{Z}_{i}{\boldsymbol{b}}_i+{\boldsymbol{e}}_i,i=1,2,\cdots,n \\ {\boldsymbol{b}}_i\sim\mathrm{N}(0,{\boldsymbol{D}}) \\ {\boldsymbol{e}}_i\sim\mathrm{N}(0,{\boldsymbol{R}}_i)\end{array}\right. (5) 式中:{\boldsymbol{y}}_i由5年间隔期内白桦单木胸径生长量组成的向量,{\boldsymbol{X}}_i为包含林木大小、竞争、立地、气候和林木大小多样性因子在内的已知设计矩阵,{{\boldsymbol{Z}}}_i为基于样地水平的随机效应设计矩阵,{\boldsymbol{\beta}} 为固定效应参数向量,{{\boldsymbol{b}}}_i为基于样地水平确定的随机效应参数向量,{{\boldsymbol{e}}}_i为单木模型的误差向量,D为基于样地水平随机参数的方差–协方差矩阵,{{\boldsymbol{R}}}_i为误差协方差结构。
混合效应模型构建的第一步就是确定模型的参数效应,将基础模型中的所有参数均视为包含随机效应的混合参数,对所有可能的随机参数组合进行模拟,输出模型的赤池信息规则(Akaike information criterion,AIC)、贝叶斯准则(Bayesian information criterion,BIC)和对数似然值(logarithm of the likelihood,logLik),通过分析不同模型的统计量以及似然比检验(likelihood ratio test,LRT)的结果确定最优随机参数组合。考虑到本研究所使用的数据来源于同一样地不同生长期的重复观测,数据之间可能存在异方差和自相关问题。为解决该问题,引入下列常用公式来描述模型误差[28]。
{{\boldsymbol{R}}}_i = {\sigma ^2}{\boldsymbol{G}}_{{i}}^{0.5}{{{{\boldsymbol{\varGamma}} _{\boldsymbol{i}}}}}{\boldsymbol{G}}_{{i}}^{0.5} (6) 式中:\sigma ^{2} 为模型的误差方差值;{{\boldsymbol{G}}}_i为描述样地内异方差问题的对角矩阵;{{\boldsymbol{\varGamma }}}_i为模拟样地内误差相关性的结构。
本文选择常用的指数函数和幂函数进行方差异质性的描述[4],采用一阶自回归[AR(1)]和一阶自回归移动平均结构[ARMA(1, 1)]校正自相关性[29]。
1.4 模型的评价与检验
为了比较和评价基础模型和混合效应模型的性能,选择的评价指标主要有赤池信息准则(AIC)、贝叶斯信息准则(BIC)、调整决定系数(adjusted coefficient of determination, {R}_{\mathrm{a}\mathrm{d}\mathrm{j}}^{2} )和均方根误差(root mean square error,RMSE)[9]。采用十折交叉验证的方法分别对基础模型和最终的混合效应模型进行检验,模型检验指标主要有归一化均方误差(normalized mean square error,ENMS)和预测残差平方和(predicted residual sum of squares,SPRES),具体计算公式为
E_{\text{NMS}} = \frac{{ \displaystyle \sum\nolimits_{i = 1}^n {{{\left(I_{{\text{ob}}{{\text{j}}_i}} - I_{{\text{es}}{{\text{t}}_i}}\right)}^2}} }}{{ \displaystyle \sum\nolimits_{i = 1}^n {{{\left(I_{{\text{ob}}{{\text{j}}_i}} - {\overline I_{ {{\text{ob}}{{\text{j}}_i}}}} \right)}^2}} }} (7) S_{\text{PRES}} = \sum\nolimits_{i = 1}^n {{{\left(I_{{\text{ob}}{{\text{j}}_i}} - I_{{\text{es}}{{\text{t}}_i}}\right)}^2}} (8) 式中:I_{ {\text{ob}}{{\text{j}}_i}} 为观测值, I_{{\rm{es}}{{\rm{t}}_i}} 为估计值,{ \overline I_{ {{\text{ob}}{{\text{j}}_i}}}} 为观察值的均值,n为观察值的个数。
2. 结果与分析
2.1 基础模型结果
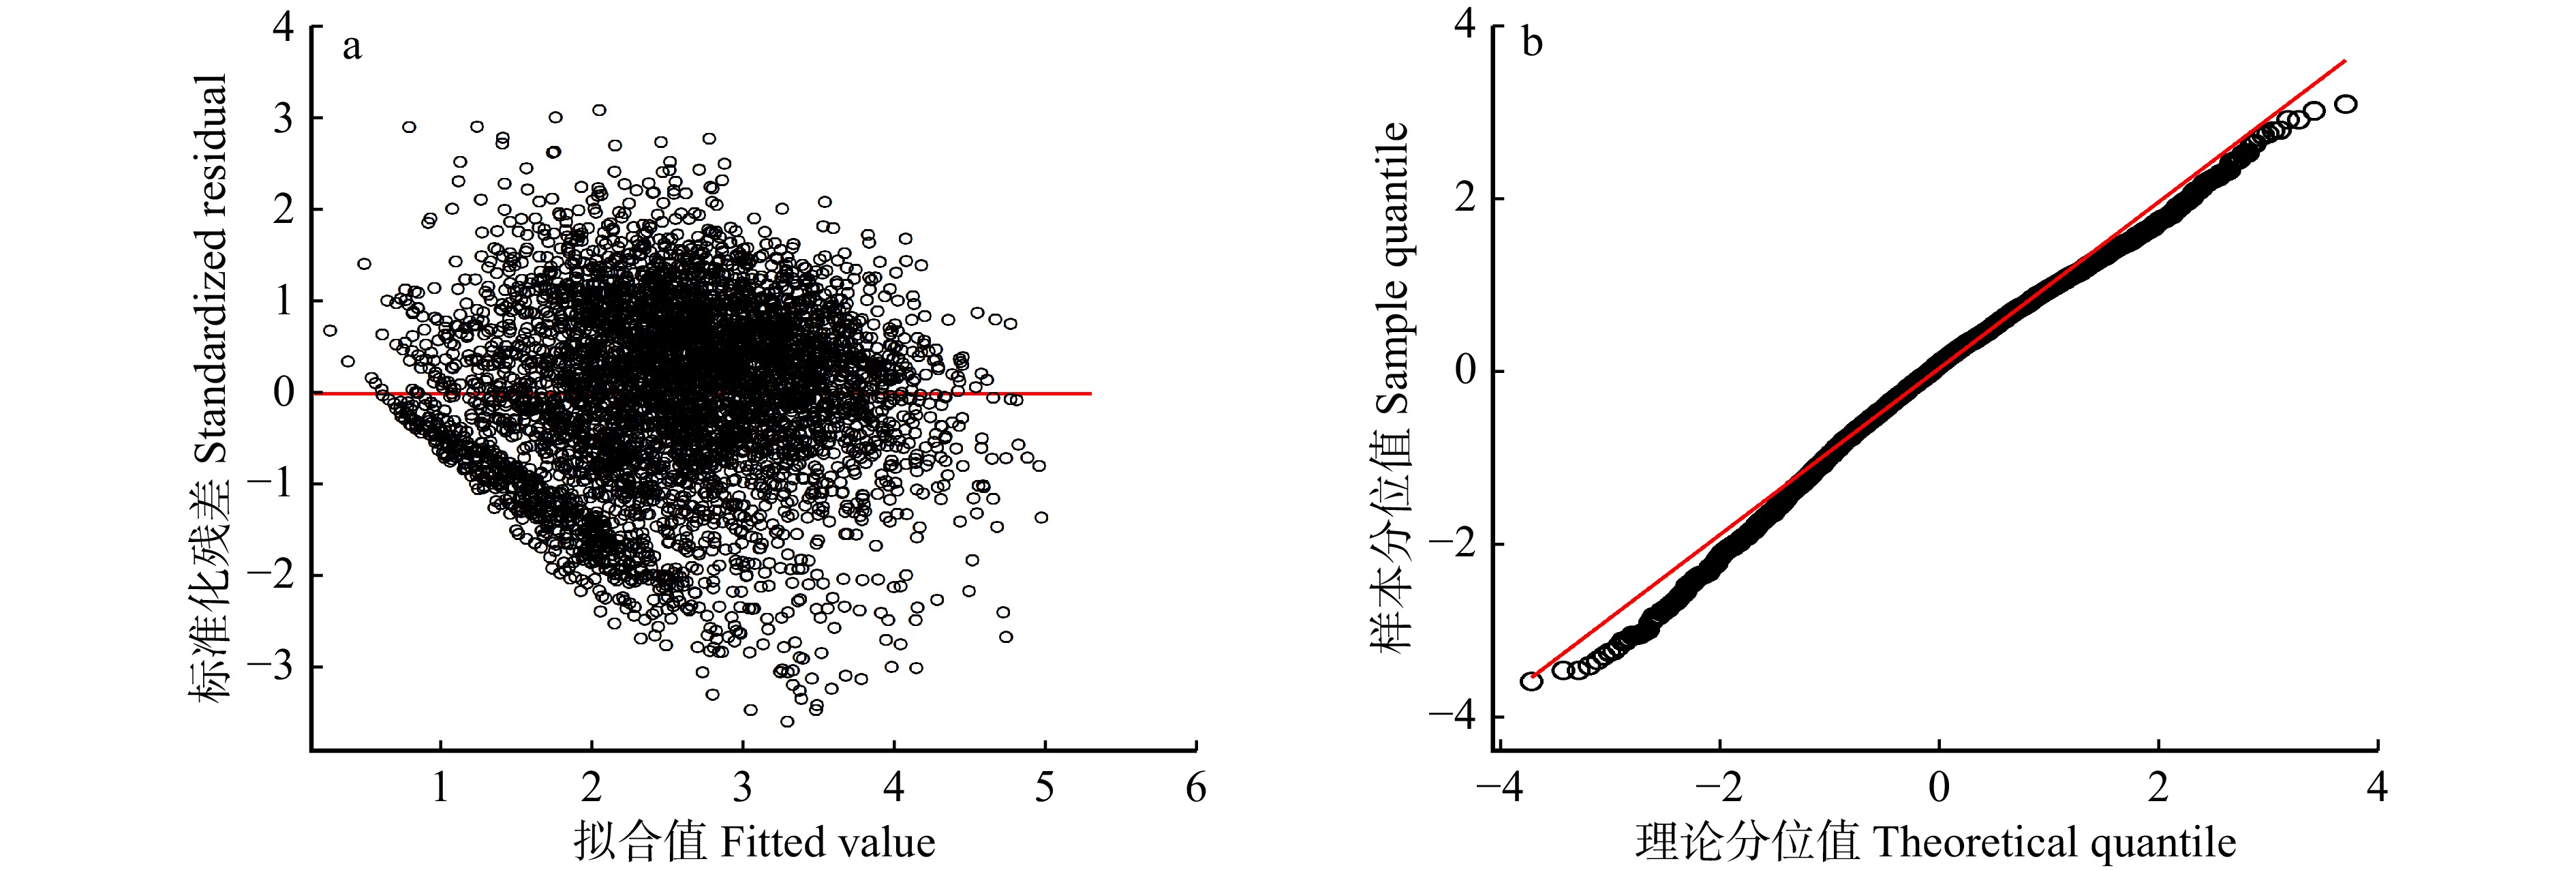
在保留与白桦单木胸径生长量存在显著相关性的变量基础上,采用逐步回归方法拟合得到的基础模型结果见公式(9)和表4。根据结果可以确定期初胸径的对数(ln D1)、大于对象木的断面积和(BAL)、样地内胸径标准差(SD)、生长积温(Ta)和年均降雨量(Pm)5个变量最终保留在基础模型中,其回归系数显著(P < 0.05)且通过了共线性检验(VIF < 5),各自变量回归系数的正负号也与Spearman相关性分析中的相关系数正负号保持了一致。包含气候因子和林木大小多样性因子的基础模型的AIC、BIC和logLik分别为9 931.6、9 976.9和−4 958.8, {R}_{\mathrm{a}\mathrm{d}\mathrm{j}}^{2} 和RMSE分别为0.514 8和0.682 4 cm2。从图1的残差图和QQ图能够观察到残差点分布情况较好,但仍存在异质性。
![]() 图 1 基于普通最小二乘法的单木胸径生长基础模型残差图(a)和QQ图(b)(未添加随机效应)Figure 1. Residual plot (a) and QQ plot (b) of basic model for individual tree DBH growth based on ordinary least squares method(without random effects)
图 1 基于普通最小二乘法的单木胸径生长基础模型残差图(a)和QQ图(b)(未添加随机效应)Figure 1. Residual plot (a) and QQ plot (b) of basic model for individual tree DBH growth based on ordinary least squares method(without random effects)\begin{split} \ln(\mathit{ }D_{\mathrm{DS}}+1)= & \; \beta_1+\beta_2\ln D_1+\beta_3\mathit{ }_{\mathrm{ }}B\mathrm{_{AL}}+\beta_4S\mathrm{_D}+ \\ &\beta_5T\mathrm{_a}+\beta_6\mathit{ }P_{\mathrm{m}} \end{split} (9) 式中: {\beta }_{1} \sim {\beta }_{6} 表示固定参数。
表 4 基于普通最小二乘法的单木胸径生长基础模型拟合结果(未添加随机效应)Table 4. Fitting results of basic model for individual tree DBH growth based on ordinary least squares method(without adding random effects)自变量
Independent variable系数
Coefficient标准差
Standard deviationt P 方差膨胀因子
Variance inflation factor (VIF)截距 Intercept (Int) −1.664 0 0.251 6 −6.615 < 0.000 1 — ln D1 0.892 2 0.031 7 28.121 < 0.000 1 1.860 3 BAL –1.077 0 0.036 9 −31.670 < 0.000 1 1.800 9 SD 0.084 3 0.007 5 11.247 0.001 8 1.586 7 Ta 0.001 2 0.000 1 14.403 < 0.000 1 1.036 6 Pm 0.002 1 0.000 4 4.904 < 0.000 1 1.020 0 注Notes:AIC = 9 931.6; BIC = 9 976.9; logLik = −4 958.8, df = 7。 2.2 混合效应模型结果
基于多元线性回归方法拟合得到的基础模型,将样地随机效应添加在截距项和所有自变量上,基础模型的公式(9)将有63种(C_6^1 + C_6^2 + C_6^3 + C_6^4 + C_6^5 + C_6^6 = 63)不同的混合效应参数组合。对所有的组合形式进行拟合,其中60种组合达到收敛。由于排列组合形式过多,故只列出了相同随机参数个数时表现最优的组合(表5)。通过对比AIC、BIC、logLik以及似然比检验LRT来确定了最优组合形式,结果表明模型(5)拟合效果最好。最优参数效应结果为
表 5 部分不同随机参数组合下的单木胸径生长线性混合效应模型拟合精度Table 5. Fitting accuracy of linear mixed effects model for individual tree DBH growth under different combinations of random parameters模型 Model 随机参数 Random parameter AIC BIC logLik LRT P (1) 无 None 9 931.6 9 976.9 −4 958.8 (2) BAL 9 287.2 9 339.0 −4 635.6 646.40 < 0.000 1 (3) Int、ln D1 9 109.7 9 174.4 −4 544.8 181.54 < 0.000 1 (4) Int、ln D1、BAL 9 085.3 9 169.5 −4 529.7 30.35 < 0.000 1 (5) Int、ln D1、BAL、SD 9 077.0 9 187.0 −4 521.5 16.34 0.002 6 (6) Int、ln D1、BAL、SD、Pm 9 087.2 9 229.6 −4 521.6 −0.20 0.999 1 (7) Int、ln D1、BAL、SD、Ta、Pm 未收敛 Without convergence 注:模型(2) ~ 模型(6)的似然比结果分别为模型(2)与模型(1)、模型(3)与模型(2)、模型(4)与模型(3)、模型(5)与模型(4)、模型(6)与模型(5)进行方差分析得到的。 Notes: the likelihood ratio results for model (2) to model (6) are obtained by the variance analysis between model (2) and model (1), model (3) and model (2), model (4) and model (3), model (5) and model (4), model (6) and model (5), respectively. \begin{split} & \; \ln(\mathit{ }D\mathrm{_{DS}}+1)=(\beta_1+b_1)+(\beta_2+b_2)\ln\ D_1+(\beta_3+b_3)B\mathrm{_{AL}}+ \\ &\qquad(\beta_4+b_4)\ S\mathrm{_D}+\beta_5\ T_{\mathrm{a}}+\beta_6\ P_{\mathrm{m}} \end{split} (10) 式中: {b}_{1} \sim {b}_{4} 表示随机参数。
已知最优参数效应结果,为准确描述样地内误差方差协方差结构,将常用的异方差函数和自相关结构引入进混合效应模型。由表6可知,3种异方差函数对于模型的精度均没有改善,故在模型不包含异方差函数的基础上引入自相关结构。一阶自回归AR(1)引入模型后,模型的AIC和BIC显著降低且通过了似然比检验(P < 0.05),拟合精度有了显著改善。因此,本研究最终未使用异方差函数,确定的自相关结构为AR(1)。
表 6 引入不同误差方差–协方差结构的线性混合效应模型拟合精度Table 6. Fitting accuracy of linear mixed effects model by introducing different error variance-covariance structures模型
Model异方差函数
Heteroscedasticity function自相关结构
Autocorrelation structureAIC BIC logLik LRT P (8) 无 None 独立 Independent 9 077.0 9 187.0 −4 521.5 (9) 常数加幂函数
Constant + Power function独立 Independent 9 079.5 9 202.5 –4 520.8 1.46 0.482 6 (10) 幂函数 Power function 独立 Independent 9 077.5 9 194.0 –4 520.8 1.46 0.227 1 (11) 指数函数
Exponential function独立 Independent 9 078.3 9 194.8 –4 521.1 0.72 0.395 2 (12) 无 None 复合对称 Compound symmetry 9 079.0 9 195.5 –4 521.5 0.02 0.883 3 (13) 无 None 一阶自回归 First-order autoregression [AR(1)] 9 027.3 9 143.8 –4 495.6 51.71 < 0.000 1 (14) 无 None 一阶自回归移动平均结构
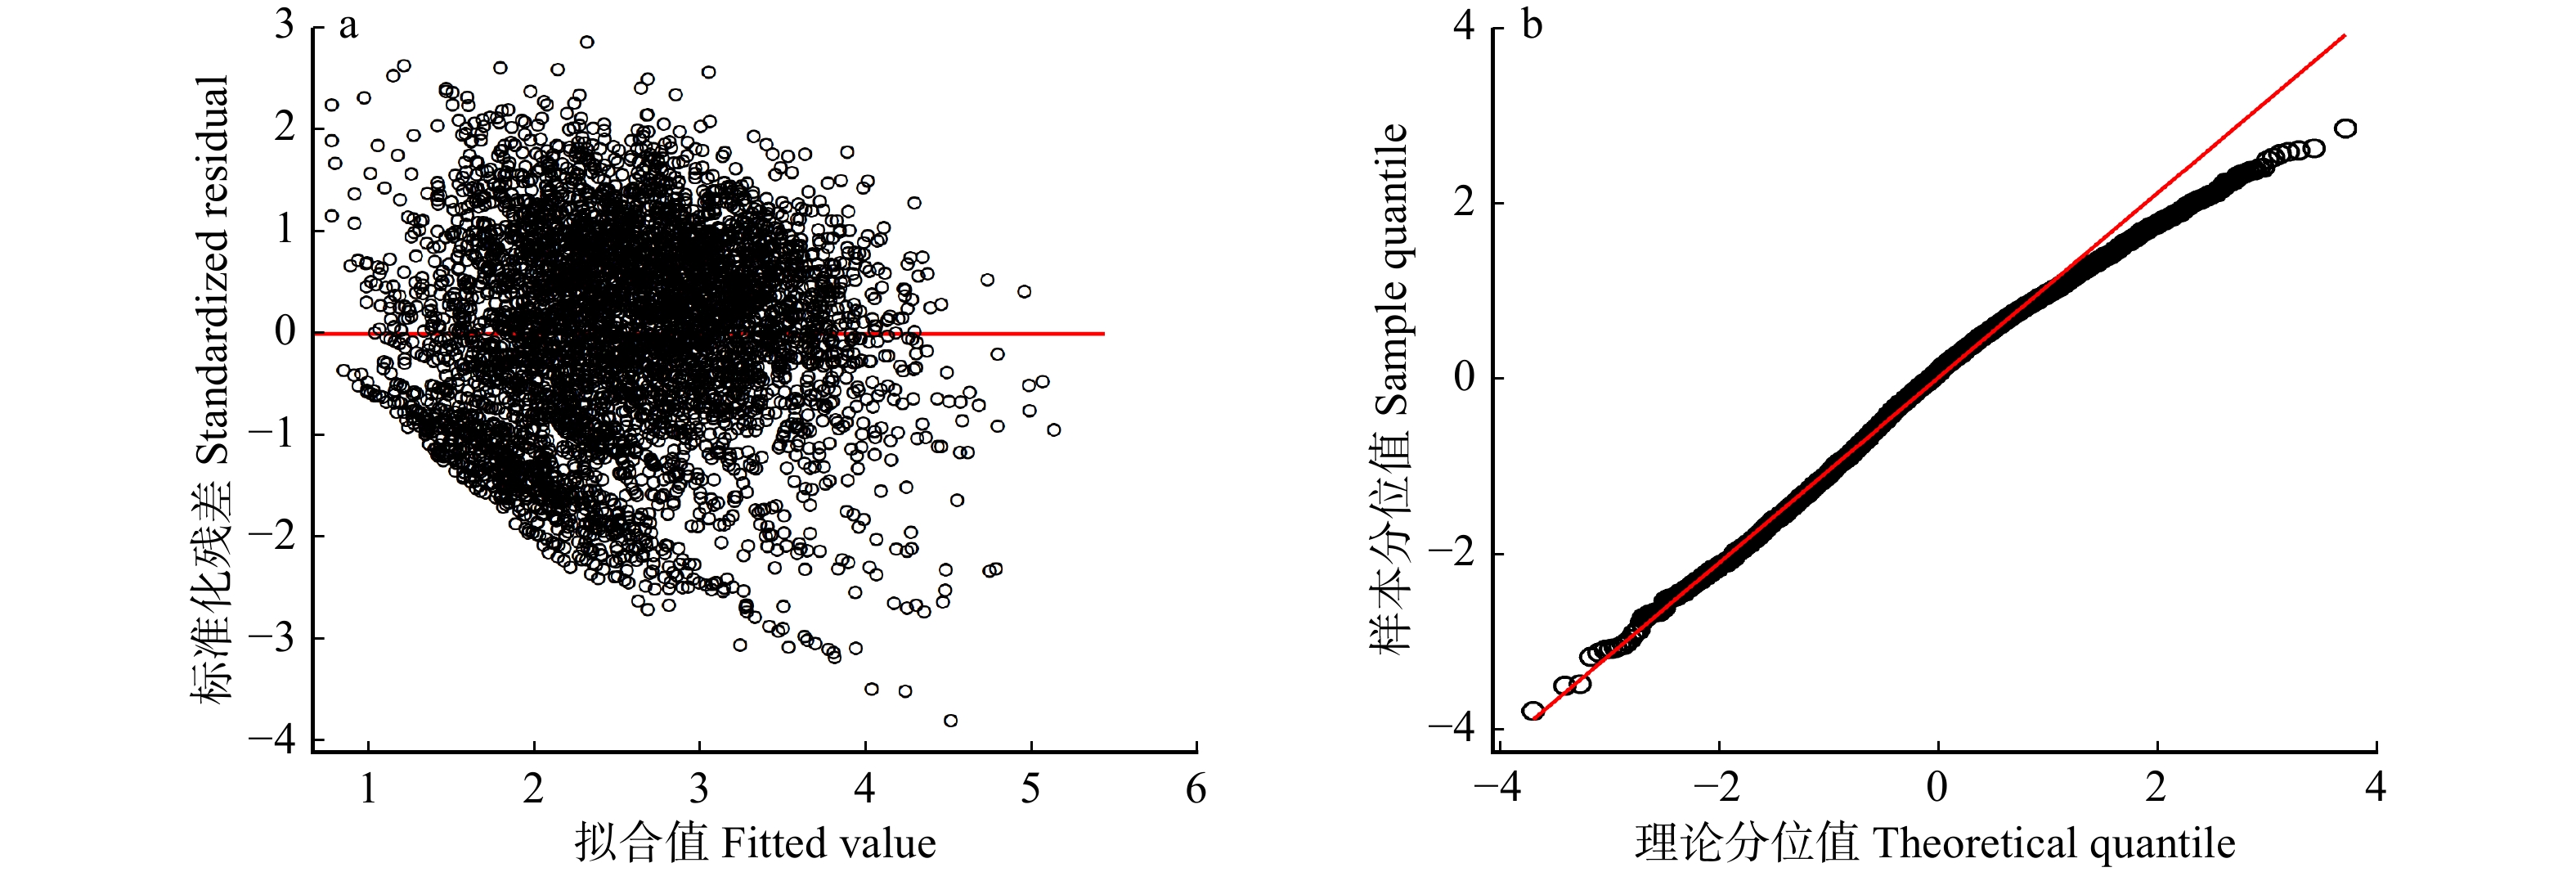
First-order autoregressive moving average structure [ARMA(1, 1)]未收敛 Without convergence 注:模型(9)、(10)和(11)的似然比结果是分别与模型(8)进行方差分析得到的;模型(12)和(13)的似然比结果也是分别与模型(8)进行方差分析得到的。 Notes: the likelihood ratio results for models (9), (10), and (11) are obtained by the variance analysis separately with respect to model (8). Similarly, the likelihood ratio results for models (12) and (13) are also obtained by conducting variance analysis separately with respect to model (8). 确定了参数效应、样地内误差方差协方差结构后,可输出最终的混合效应模型结果。公式(11)所展示的模型,即为包含气候因子和林木大小多样性因子的白桦天然林单木胸径生长混合效应。AIC、BIC和logLik分别为9 027.3、9 143.8和−4 495.6(df = 18),模型的 {R}_{\mathrm{a}\mathrm{d}\mathrm{j}}^{2} 和RMSE分别为0.635 4和0.585 3 cm2。从图2的模型残差图和QQ图可以看出:与基础模型相比,混合效应模型的残差分布更加均匀且更近似于正态分布,方差异质性明显有所消除。
![]() 图 2 基于样地水平随机效应的模型残差图(a)和QQ图(b)Figure 2. Residual plot (a) and QQ plot (b) of the model based on random effects of sample plots
图 2 基于样地水平随机效应的模型残差图(a)和QQ图(b)Figure 2. Residual plot (a) and QQ plot (b) of the model based on random effects of sample plots\begin{split} & \ln(D_{\mathrm{DS}}+1)=(-1.911\; 4+b_1)+(1.171\; 8+b_2)\ln\ D_1+ \\ &(-0.992\; 5+b_3)B\mathrm{_{AL}}+(0.031\; 2+b_4)S_{\mathrm{D}}+0.001\; 1T_{\mathrm{a}}+ \\ &0.001\; 5P_{\mathrm{m}} \end{split} (11) \begin{gathered} {{\boldsymbol{b}}_i} = \left[ {\begin{array}{*{20}{c}} {{b_1}} \\ {{b_2}} \\ {{b_3}} \\ {{b_4}} \end{array}} \right]\sim {\rm{N}}\left\{ {\left[ {\begin{array}{*{20}{c}} 0 \\ 0 \\ 0 \\ 0 \end{array}} \right],} \right. \\ \left. {{\boldsymbol{D}} = \left( {\begin{array}{*{20}{c}} {2.910\;6}&{ - 1.068\;1}&{ - 1.023\;5}&{0.125\;9} \\ { - 1.068\;1}&{0.436\;7}&{0.310\;5}&{ - 0.056\;1} \\ { - 1.023\;{\kern 1pt} 5}&{0.310\;5}&{0.498\;2}&{0.030\;2} \\ {0.125{\kern 1pt} \;9}&{ - 0.056\;1}&{ - 0.030\;{\kern 1pt} 2}&{0.008\;1} \end{array}} \right)} \right\}, \\ \end{gathered} \begin{split} &{{\boldsymbol{e}}_i}\sim {\rm{N}}(0,\;{R_i} = 0.597{\kern 1pt} {\kern 1pt} {\kern 1pt} {\kern 1pt} 8{\boldsymbol{G}}_i^{0.5}{{\boldsymbol{\varGamma}} _i}{\boldsymbol{G}}_i^{0.5}),\;\;{{\boldsymbol{G}}_i} = {{\boldsymbol{I}}_i},\\&{{\boldsymbol{\varGamma}} _i} = {\text{AR}}(1),\;\;\rho = 0.115{\kern 1pt} {\kern 1pt} {\kern 1pt} {\kern 1pt} 1 \end{split} 2.3 模型评价与检验结果
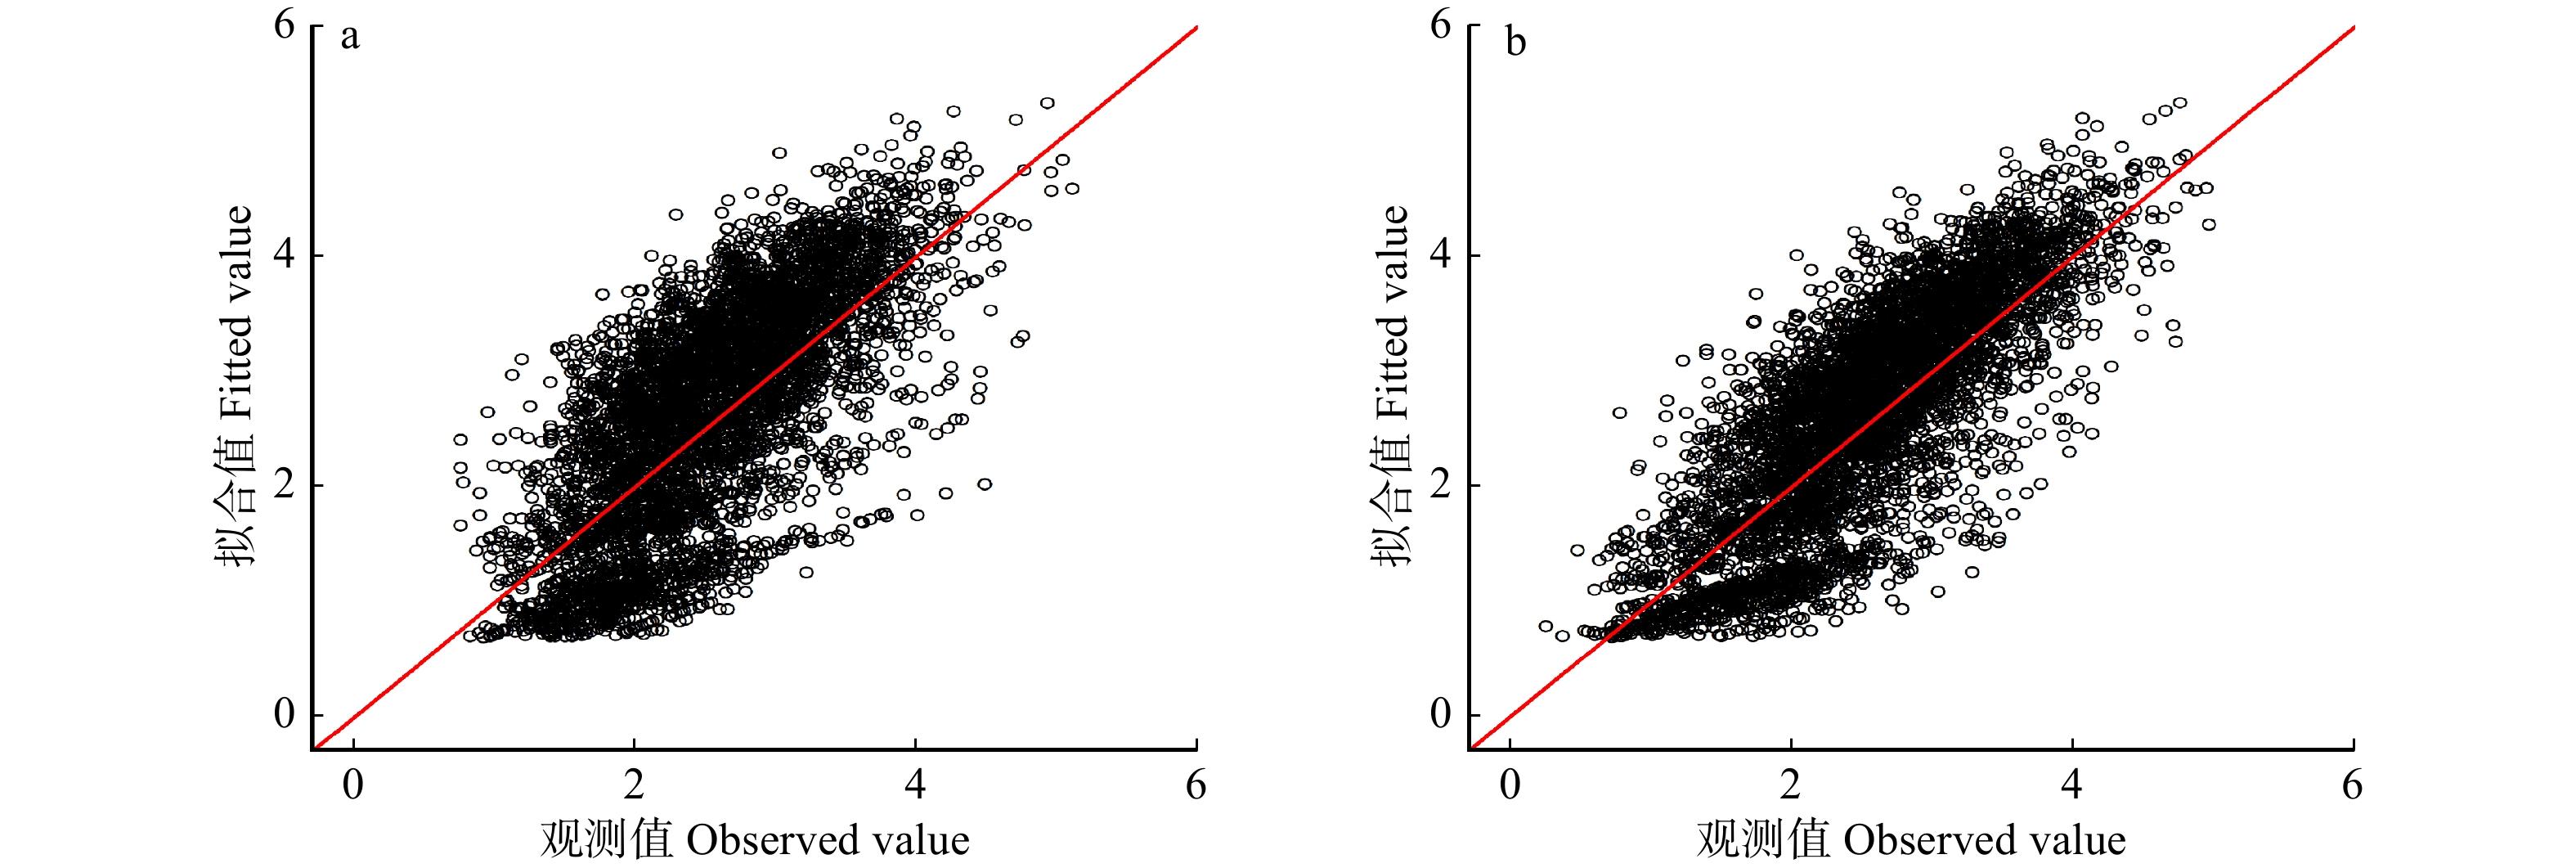
由表7可知:混合效应模型的AIC和BIC要低于基础模型, {R}_{\mathrm{a}\mathrm{d}\mathrm{j}}^{2} 从0.514 8提高至0.635 4,RMSE从0.682 4 cm2降至0.585 3 cm2。十折交叉验证的结果表明,采用混合效应模型的方法进行白桦天然林单木胸径生长模型的构建具有更高的预估精度,主要表现在混合效应模型的ENMS从0.486 2降低至0.357 7,SPRES从222.61降低至163.73。此外,基于两个模型绘制的实测值与预测值的散点图(图3)表明混合效应模型的散点更集中分布于1∶1线。因此,进一步证明了混合效应模型能更精准地预测白桦胸径生长量这一结果。
表 7 基于普通最小二乘法的基础模型和基于样地水平的线性混合效应模型的评价和检验指标Table 7. Evaluation and testing indicators for basic models based on ordinary least square method and linear mixed effect models based on plot level模型 Model 评价指标 Evaluation indicator 检验指标 Validation indicator R_{{\text{adj}}}^2 {\text{RMSE/c}}{{\text{m}}^{\text{2}}} AIC BIC ENMS SPRES 基础模型 Basic model 0.514 8 0.682 4 9 931.6 9 976.9 0.486 2 222.61 混合效应模型 Mixed-effects model 0.635 4 0.585 3 9 027.3 9 143.8 0.357 7 163.73 ![]() 图 3 基于普通最小二乘法的基础模型(a)和基于样地水平的线性混合效应模型(b)的观测值和拟合值对比Figure 3. Comparison of observed values and fitted values for basic models based on ordinary least square method and linear mixed effect models based on plot level
图 3 基于普通最小二乘法的基础模型(a)和基于样地水平的线性混合效应模型(b)的观测值和拟合值对比Figure 3. Comparison of observed values and fitted values for basic models based on ordinary least square method and linear mixed effect models based on plot level3. 讨 论
本研究的模型拟合结果表明,内蒙古大兴安岭林区白桦单木胸径生长量受到林木大小因子ln D1、单木竞争因子BAL、林木大小多样性因子SD、气候因子Ta和Pm的显著影响。
ln D1对林木的生长具有显著促进作用,这可能是由于大树对光照、水分和土壤养分等资源具有更强的竞争能力。杜志等[4]、Wang等[9]、彭娓等[29]的研究中也得到了相同的结论。然而,Adame等[30]的研究则得出了不同的结论,即单木胸径生长量随着树龄的增加表现为先增大后减小的趋势。本研究未观察到胸径生长量随胸径增加而下降的趋势,可能是由于试验数据中成、过熟林所占比重较少。单木竞争指数BAL与胸径生长呈负相关关系,这表明受到较大竞争压力的树木生长会受到更多抑制。Condés和Sterba[31]、Monserud和Sterba[32]也得到了类似的结果。
林木大小多样性因子SD也与胸径生长呈现出显著正相关。较高的SD表示林分内树木胸径之间的差异较大,不同大小的树木能够更有效地占据生长空间,从而形成复杂的垂直结构,最大程度地减少了树木之间的竞争,有助于充分利用土壤养分、水分和光照等自然资源[33−34]。Zhang等[33]构建了大兴安岭林区天然混交林的转移矩阵模型,发现林木大小多样性的增大将会促进兴安落叶松和白桦的胸径生长和进界。Ercanli[34]研究了林分结构多样性与欧洲赤松(Pinus sylvestris)纯林地上碳储量之间的关系,得出欧洲赤松纯林碳储量与所有的林分结构多样性指数均呈正相关的结论。Lei等[10]研究了加拿大新不伦瑞克省的云杉(Picea asperata)林的林分生长与其结构多样性之间的关系,观察到林木大小和树高多样性对树木的净生长产生了积极影响。然而,也有研究发现林分结构多样性与胸径生长之间呈现负相关关系[35−36]。例如,Liang等[36]发现道格拉斯冷杉(Pseudotsuga menziesii)和西部铁杉(Tsuga heterophylla)的断面积生长量随着树木大小多样性的增加而减少;针叶混交林的断面积生长量起初随着树木大小多样性的增加略微增加,当大小多样性达到平均水平时达到最大值,然后逐渐减少。本研究所采用数据生长周期为5年,时间跨度相比于Liang等[36]采用的10年生长周期要短,可能会出现一些现象未被观察到的情况。
白桦单木胸径生长量受到气候因子生长积温(Ta)和年降雨量(Pm)的显著影响,且均随着Ta和Pm的增加而增加。这可能是生长积温的增加会产生更多的热量,从而有效促进林木生长[14]。此外,早春干旱会导致树木水分缺失,积温的增加将加速林下积雪的融化,及时补充树木生长所需的水分[37]。张海平等[7]研究发现生长季最低气温的升高将会促进白桦单木胸径生长,其原因是生长季初期气温升高打破了树木的休眠,加快了树木细胞的分裂速率,有效延长了树木生长期。年降雨量(Pm)的系数为正,说明对白桦的胸径生长具有促进作用。可能是因为水分子参与树木生长的各项生理生态过程[38],比如营养物质的运输、光合作用等,充足的水分满足了树木胸径生长发育所需,进而促进了单木的生长。在生长季初期,由于森林生长需水量较多,降雨量的增加能够及时提供林分生长所需要的水分,促进树木径向生长[39]。然而,Wang等[6]研究发现生长季最大降水量的升高将抑制红松的胸径生长,这可能是由于红松处于生长季时,降雨量过多将会导致空气潮湿、太阳辐射减少、光合作用减弱,且降雨量过多会加剧土壤养分淋溶,不利于树木养分的积累。
针对同一块样地重复测量获得的林业数据通常会表现出层次结构[9]。本研究所使用的森林资源连续清查数据也不例外。而混合效应模型是处理重复测量和嵌套数据的有效工具。因此,本研究引入样地水平的随机效应进行混合效应模型的构建,模拟不同随机参数组合,其中将样地随机效应添加在常数项截距、ln D、BAL和SD时模型表现最优。此外,本研究还选择了异方差函数和自相关结构来消除误差,结果表明3种异方差函数并没有改善模型的性能,自相关结构AR(1)则有效提升了模型的性能。与基础模型相比,混合效应模型的 {R}_{\mathrm{a}\mathrm{d}\mathrm{j}}^{2} 提高了0.120 6,RMSE降低了0.097 1 cm2。在模型检验中,混合效应模型的十折交叉验证结果仍优于基础模型,ENMS从0.486 2降低至0.357 7,SPRES从222.61降低至163.73。
本研究的主要目的是构建白桦天然林单木胸径生长模型。结果表明,林木大小多样性和气候因子显著影响白桦天然林单木胸径生长。引入样地随机效应所构建的混合效应模型,拟合精度显著提高,能够实现白桦单木胸径生长量的精准预测,为白桦天然林的经营管理提供了科学依据。然而,模型仍具有改进空间:(1)未来在数据允许的条件下,可进一步探究土壤理化性质等立地因子对林木生长动态的影响,并尝试将其引入模型;(2)本研究仅聚焦于白桦单木生长量的模型构建,未来的研究可在此基础上,构建白桦的枯损和进界模型,以形成一个完整的森林动态变化体系,实现白桦天然林生长动态的无偏估计。
4. 结 论
(1)以内蒙古大兴安岭林区白桦天然林为研究对象,基于一类清查数据构建了白桦单木胸径生长模型。期初胸径的对数(ln D1)、大于对象木的断面积和(BAL)、样地内胸径标准差(SD)、生长积温(Ta)和年均降雨量(Pm)显著影响白桦胸径生长。
(2)ln D对白桦胸径的生长有显著的促进作用,而BAL对白桦胸径的生长有显著的抑制作用。气候因子(Ta和Pm)、林木大小多样性因子SD对白桦胸径生长均起到了促进作用。
(3)基于样地水平的混合效应模型方法的引入,显著提高了白桦天然林单木胸径生长的预测精度, {R}_{\mathrm{a}\mathrm{d}\mathrm{j}}^{2} 显著增加,RMSE、AIC和BIC均显著降低。本研究所构建的模型,可以实现气候变化背景下白桦单木生长的精准预估,为该研究区域白桦天然林的科学经营提供理论依据和数据支持。
-
![]()
图 1 基于普通最小二乘法的单木胸径生长基础模型残差图(a)和QQ图(b)(未添加随机效应)
Figure 1. Residual plot (a) and QQ plot (b) of basic model for individual tree DBH growth based on ordinary least squares method(without random effects)
![]()
图 2 基于样地水平随机效应的模型残差图(a)和QQ图(b)
Figure 2. Residual plot (a) and QQ plot (b) of the model based on random effects of sample plots
![]()
图 3 基于普通最小二乘法的基础模型(a)和基于样地水平的线性混合效应模型(b)的观测值和拟合值对比
Figure 3. Comparison of observed values and fitted values for basic models based on ordinary least square method and linear mixed effect models based on plot level
表 1 白桦天然林样地和样木调查数据
Table 1 Survey data on natural Betula platyphylla forest sample plots and sample trees
组别
Group变量符号
Variable symbol描述
Description最小值
Min. value最大值
Max. value均值
Mean标准差
SD单木 Individual tree (n = 4 785) D1 期初胸径 Initial DBH/cm 5.0 47.7 12.9 5.6 D2 期末胸径 Final DBH/cm 5.1 49.0 13.6 5.8 V 前期材积 Initial volume/m3 0.001 1.312 0.095 0.112 样地 Sample plot (n = 97) T 平均年龄/a Mean age/year 23 115 66 18 Hm 平均树高 Mean tree height/m 9.2 22.0 15.3 2.6 Dm 林分平均胸径 Stand mean DBH/cm 7.3 32.7 14.0 3.7 E 海拔 Elevation/m 168 127 9 908 202 S 坡度 Slope/(°) 1.0 30.0 6.6 4.8 A 坡向 Aspect/(°) 0.0 315.0 157.3 110.8 ST 土层厚度 Soil thickness/cm 6 65 28 11 HT 腐殖质层厚度 Humus thickness/cm 1 15 5 3 N 林分密度/(株·hm−2)
Stand density/(tree·ha−1)285 2 985 1 319 527  下载: 导出CSV
表 2 白桦天然林样地主要树种统计
Table 2 Statistics of main tree species in sample plots of natural Betula platyphylla forests
树种
Tree species总断面积
Total basal area/m2断面积占比
Proportion of basal area/%总蓄积
Total volume/m3蓄积占比
Proportion of volume/%白桦 Betula platyphylla 74.34 79.26 455.13 78.03 兴安落叶松 Larix gmelinii 13.59 14.49 90.51 15.52 蒙古栎 Quercus mongolica 0.59 0.63 1.92 0.33 柳树 Salix spp. 0.14 0.15 0.59 0.10 其他软阔类 Other soft broadleaved trees 5.13 5.47 35.10 6.02 合计 Total 93.79 100.00 583.25 100.00
下载: 导出CSV
表 3 研究期间白桦天然林样地气候变量统计
Table 3 Statistical analysis of climate variables in sample plots of natural Betula platyphylla forests during study period
变量符号
Variable symbol描述
Description最小值
Min. value最大值
Max. value平均值
Mean标准差
SDTw 最热月均温 Mean warmest month temperature/℃ 16.68 20.52 18.20 0.73 Tc 最冷月均温 Mean coldest month temperature/℃ −28.00 −22.24 −25.92 1.21 Tm 年平均气温 Mean annual temperature/℃ −3.98 0.64 −2.47 0.80 TD 平均气温差 Annual mean temperature difference 39.90 45.60 44.11 1.00 Pm 年均降雨量 Mean annual precipitation/mm 413.40 528.00 466.96 22.86 IM 年湿热指数 Annual heat/moisture index (Tm + 10)/(Pm/ 1000 )13.32 22.14 16.93 1.97 Ta 生长积温 Accumulated growth temperature/℃ 1 071.40 1 749.00 1 278.89 117.96 DNFF 无霜期天数 Number of frost-free days 110 155 127 7.82 TEM 30年来的极端低温 Extreme min. temperature over the past 30 years/℃ −45.30 −35.40 −41.11 1.99 TEX 30年来的极端高温 Extreme max. temperature over the past 30 years/℃ 30.30 32.60 31.28 0.41 IH 哈格里夫斯降水指数 Hargreaves precipitation index 536.6 635.2 572.7 18.49 ID 哈格里夫斯水分缺失指数 Hargreaves moisture deficit index 142.0 246.0 198.5 21.64
下载: 导出CSV
表 4 基于普通最小二乘法的单木胸径生长基础模型拟合结果(未添加随机效应)
Table 4 Fitting results of basic model for individual tree DBH growth based on ordinary least squares method(without adding random effects)
自变量
Independent variable系数
Coefficient标准差
Standard deviationt P 方差膨胀因子
Variance inflation factor (VIF)截距 Intercept (Int) −1.664 0 0.251 6 −6.615 < 0.000 1 — ln D1 0.892 2 0.031 7 28.121 < 0.000 1 1.860 3 BAL –1.077 0 0.036 9 −31.670 < 0.000 1 1.800 9 SD 0.084 3 0.007 5 11.247 0.001 8 1.586 7 Ta 0.001 2 0.000 1 14.403 < 0.000 1 1.036 6 Pm 0.002 1 0.000 4 4.904 < 0.000 1 1.020 0 注Notes:AIC = 9 931.6; BIC = 9 976.9; logLik = −4 958.8, df = 7。
下载: 导出CSV
表 5 部分不同随机参数组合下的单木胸径生长线性混合效应模型拟合精度
Table 5 Fitting accuracy of linear mixed effects model for individual tree DBH growth under different combinations of random parameters
模型 Model 随机参数 Random parameter AIC BIC logLik LRT P (1) 无 None 9 931.6 9 976.9 −4 958.8 (2) BAL 9 287.2 9 339.0 −4 635.6 646.40 < 0.000 1 (3) Int、ln D1 9 109.7 9 174.4 −4 544.8 181.54 < 0.000 1 (4) Int、ln D1、BAL 9 085.3 9 169.5 −4 529.7 30.35 < 0.000 1 (5) Int、ln D1、BAL、SD 9 077.0 9 187.0 −4 521.5 16.34 0.002 6 (6) Int、ln D1、BAL、SD、Pm 9 087.2 9 229.6 −4 521.6 −0.20 0.999 1 (7) Int、ln D1、BAL、SD、Ta、Pm 未收敛 Without convergence 注:模型(2) ~ 模型(6)的似然比结果分别为模型(2)与模型(1)、模型(3)与模型(2)、模型(4)与模型(3)、模型(5)与模型(4)、模型(6)与模型(5)进行方差分析得到的。 Notes: the likelihood ratio results for model (2) to model (6) are obtained by the variance analysis between model (2) and model (1), model (3) and model (2), model (4) and model (3), model (5) and model (4), model (6) and model (5), respectively.
下载: 导出CSV
表 6 引入不同误差方差–协方差结构的线性混合效应模型拟合精度
Table 6 Fitting accuracy of linear mixed effects model by introducing different error variance-covariance structures
模型
Model异方差函数
Heteroscedasticity function自相关结构
Autocorrelation structureAIC BIC logLik LRT P (8) 无 None 独立 Independent 9 077.0 9 187.0 −4 521.5 (9) 常数加幂函数
Constant + Power function独立 Independent 9 079.5 9 202.5 –4 520.8 1.46 0.482 6 (10) 幂函数 Power function 独立 Independent 9 077.5 9 194.0 –4 520.8 1.46 0.227 1 (11) 指数函数
Exponential function独立 Independent 9 078.3 9 194.8 –4 521.1 0.72 0.395 2 (12) 无 None 复合对称 Compound symmetry 9 079.0 9 195.5 –4 521.5 0.02 0.883 3 (13) 无 None 一阶自回归 First-order autoregression [AR(1)] 9 027.3 9 143.8 –4 495.6 51.71 < 0.000 1 (14) 无 None 一阶自回归移动平均结构
First-order autoregressive moving average structure [ARMA(1, 1)]未收敛 Without convergence 注:模型(9)、(10)和(11)的似然比结果是分别与模型(8)进行方差分析得到的;模型(12)和(13)的似然比结果也是分别与模型(8)进行方差分析得到的。 Notes: the likelihood ratio results for models (9), (10), and (11) are obtained by the variance analysis separately with respect to model (8). Similarly, the likelihood ratio results for models (12) and (13) are also obtained by conducting variance analysis separately with respect to model (8).
下载: 导出CSV
表 7 基于普通最小二乘法的基础模型和基于样地水平的线性混合效应模型的评价和检验指标
Table 7 Evaluation and testing indicators for basic models based on ordinary least square method and linear mixed effect models based on plot level
模型 Model 评价指标 Evaluation indicator 检验指标 Validation indicator R_{{\text{adj}}}^2 {\text{RMSE/c}}{{\text{m}}^{\text{2}}} AIC BIC ENMS SPRES 基础模型 Basic model 0.514 8 0.682 4 9 931.6 9 976.9 0.486 2 222.61 混合效应模型 Mixed-effects model 0.635 4 0.585 3 9 027.3 9 143.8 0.357 7 163.73
下载: 导出CSV
-
[1] 王建军, 曾伟生, 孟京辉. 考虑预估期间林木枯死及采伐影响的杉木单木胸高断面积生长模型研究[J]. 西北林学院学报, 2017, 32(3): 181−185. Wang J J, Zeng W S, Meng J H. Individual-tree basal area growth model for Cunninghamia lanceolata with the consideration of thinning and tree mortality in the prediction interval[J]. Journal of Northwest Forestry University, 2017, 32(3): 181−185.
[2] Uzoh F C C, Oliver W W. Individual tree diameter increment model for managed even-aged stands of ponderosa pine throughout the western United States using a multilevel linear mixed effects model[J]. Forest Ecology and Management, 2008, 256(3): 438−445. doi: 10.1016/j.foreco.2008.04.046
[3] 段劼, 马履一, 薛康, 等. 北京地区侧柏人工林单木胸径生长模型的研究[J]. 林业资源管理, 2010(2): 62−68. Duan J, Ma L Y, Xue K, et al. Individual-tree diameter growth model for Platycladus orientalis plantation in Beijing Area[J]. Forest Resources Management, 2010(2): 62−68.
[4] 杜志, 陈振雄, 孟京辉, 等. 基于混合效应的马尾松单木断面积预估模型[J]. 中南林业科技大学学报, 2020, 40(9): 33−40. Du Z, Chen Z X, Meng J H, et al. Prediction model of individual-tree basal area for Pinus massoniana based on mixed effect[J]. Journal of Central South University of Forestry & Technology, 2020, 40(9): 33−40.
[5] 芦海涛, 李凤日, 贾炜玮. 水曲柳单木生长模型的研究[J]. 森林工程, 2011, 27(3): 5−8. doi: 10.3969/j.issn.1001-005X.2011.03.002 Lu H T, Li F R, Jia W W. Research on individual tree growth model of Manchurian ash[J]. Forest Engineering, 2011, 27(3): 5−8. doi: 10.3969/j.issn.1001-005X.2011.03.002
[6] Wang M, Zhao Y H, Zhen Z, et al. Individual-tree diameter growth model for Korean pine plantations based on optimized interpolation of meteorological variables[J]. Journal of Forestry Research, 2021, 32(4): 1535−1552. doi: 10.1007/s11676-020-01177-9
[7] 张海平, 李凤日, 董利虎, 等. 基于气象因子的白桦天然林单木直径生长模型[J]. 应用生态学报, 2017, 28(6): 1851−1859. Zhang H P, Li F R, Dong L H, et al. Individual tree diameter increment model for natural Betula platyphylla forests based on meteorological factors[J]. Chinese Journal of Applied Ecology, 2017, 28(6): 1851−1859.
[8] Madrigal-González J, Ruiz-Benito P, Ratcliffe S, et al. Complementarity effects on tree growth are contingent on tree size and climatic conditions across Europe[J]. Scientific Reports, 2016, 6(1): 638−646.
[9] Wang W W, Chen X Y, Zeng W S, et al. Development of a mixed-effects individual-tree basal area increment model for oaks (Quercus spp.) considering forest structural diversity[J]. Forests, 2019, 10(6): 474. doi: 10.3390/f10060474
[10] Lei X D, Wang W F, Peng C H. Relationships between stand growth and structural diversity in spruce-dominated forests in New Brunswick, Canada[J]. Canadian Journal of Forest Research, 2009, 39(10): 1835−1847. doi: 10.1139/X09-089
[11] Daniels L, Veblen T. Spatio-temporal influences of climate on altitudinal treeline in northern Patagonia[J]. Ecology, 2004, 85(5): 1284−1296. doi: 10.1890/03-0092
[12] Gordon N, Will S. Effect of climate on lodgepole pine stem taper in British Columbia, Canada[J]. Forestry, 85(5): 579−587.
[13] Hamann A, Wang T L. Potential effects of climate change on ecosystem and tree species distribution in British Columbia[J]. Ecology, 2006, 87(11): 2773−2786. doi: 10.1890/0012-9658(2006)87[2773:PEOCCO]2.0.CO;2
[14] 杨鑫, 王建军, 杜志, 等. 基于气候因子的兴安落叶松天然林单木直径生长模型构建[J]. 北京林业大学学报, 2022, 44(8): 1−11. doi: 10.12171/j.1000-1522.20210353 Yang X, Wang J J, Du Z, et al. Development of individual-tree diameter increment model for natural Larix gmelinii forests based on climatic factors[J]. Journal of Beijing Forestry University, 2022, 44(8): 1−11. doi: 10.12171/j.1000-1522.20210353
[15] Grégoire T G, Schabenberger O, Barrett J P. Linear modelling of irregularly spaced, unbalanced, longitudinal data from permanent-plot measurements[J]. Canadian Journal of Forest Research, 1995, 25(1): 137−156. doi: 10.1139/x95-017
[16] Cudeck R, Klebe K J. Multiphase mixed-effects models for repeated measures data[J]. Psychological Methods, 2002, 7(1): 41−63. doi: 10.1037/1082-989X.7.1.41
[17] Schabenberger O, Gregoire T G. A conspectus on estimating function theory and its applicability to recurrent modeling issues in forest biometry[J]. Silva Fennica, 1995, 29(1): 49−70.
[18] Sharma M, Parton J. Height-diameter equations for boreal tree species in Ontario using a mixed-effects modeling approach[J]. Forest Ecology and Management, 2007, 249(3): 187−198. doi: 10.1016/j.foreco.2007.05.006
[19] 陈国栋, 杜研, 丁佩燕, 等. 基于混合效应模型的新疆天山云杉单木胸径预测模型构建[J]. 北京林业大学学报, 2020, 42(7): 12−22. Chen G D, Du Y, Ding P Y, et al. Predicting model construction of single tree DBH of Picea schrenkiana in Xinjiang of northwestern China based on mixed effects model[J]. Journal of Beijing Forestry University, 2020, 42(7): 12−22.
[20] 李春明. 基于广义线性混合效应模型的蒙古栎林单木枯损建模及影响因子分析[J]. 林业科学研究, 2020, 33(6): 105−113. Li C M. Modeling of individual tree mortality and analysis of influence factor in Mongolian oak stand based on generalized linear mixed effect model[J]. Scientia Silvae Sinicae, 2020, 33(6): 105−113.
[21] Wang W W, Wang J J, Meng J H. A climate-sensitive mixed-effects tree recruitment model for oaks (Quercus spp.) in Hunan Province, south-central China[J]. Forest Ecology and Management, 2023, 528.
[22] 聂璐毅, 董利虎, 李凤日, 等. 基于两水平非线性混合效应模型的长白落叶松削度方程构建[J]. 南京林业大学学报(自然科学版), 2022, 46(3): 194−202. Nie L Y, Dong L H, Li F R, et al. Construction of taper equation for Larix olgensis based on two-level nonlinear mixed effects model[J]. Journal of Nanjing Forestry University (Natural Sciences Edition), 2022, 46(3): 194−202.
[23] Wang Y R, Miao Z, Hao Y S, et al. Effects of biotic and abiotic factors on biomass conversion and expansion factors of natural white birch forest (Betula platyphylla Suk.) in Northeast China[J]. Forests, 2023, 14(2): 362.
[24] Wang T, Hamann A, Spittlehouse D L, et al. Climatewna-high-resolution spatial climate data for western north America[J]. Journal of Applied Meteorology and Climatology, 2012, 51(1): 16−29. doi: 10.1175/JAMC-D-11-043.1
[25] Bella I E. A new competition model for individual trees[J]. Forest Science, 1971, 17: 364−372.
[26] Wykoff W R. A basal area increment model for individual conifer in the northern Rocky Mountains[J]. Forestry Science, 1990, 36: 1077−1104.
[27] Stage A R. An expression for the effect of aspect, slope, and habitat type on tree growth[J]. Forest Science, 1976, 22(4): 457−460.
[28] Davidian M, Giltinan D M. Nonlinear models for repeated measurement data[M]. New York: CRC Press, 1995: 78−108.
[29] 彭娓, 李凤日, 董利虎. 黑龙江省长白落叶松人工林单木生长模型[J]. 南京林业大学学报(自然科学版), 2018, 42(3): 19−27. Peng W, Li F R, Dong L H. Individual tree diameter growth model for Larix olgensis plantation in Heilongjiang Province, China[J]. Journal of Nanjing Forestry University (Natural Sciences Edition), 2018, 42(3): 19−27.
[30] Adame P, Hynynen J, Cañellas I, et al. Individual-tree diameter growth model for rebollo oak (Quercus pyrenaica Willd.) coppices[J]. Forest Ecology and Management, 2008, 255(3−4): 1011−1022.
[31] Condés S, Sterba H. Comparing an individual tree growth model for Pinus halepensis Mill. in the Spanish region of Murcia with yield tables gained from the same area[J]. European Journal of Forest Research, 2008, 127(3): 2531−261.
[32] Monserud R A, Sterba H. A basal area increment model for individual trees growing ineven- and uneven-aged forest stands in Austria[J]. Forest Ecology and Management, 1996, 80(1−3): 57−80. doi: 10.1016/0378-1127(95)03638-5
[33] Zhang L, He Y J, Wang J J, et al. Development of a climate-sensitive matrix growth model for Larix gmelinii mixed-species natural forests and its application for predicting forest dynamics under different climate scenarios[J]. Forests, 2022, 13: 574. doi: 10.3390/f13040574
[34] Ercanli I. Positive effect of forest structural diversity on aboveground stand carbon stocks for even-aged Scots pine (Pinus sylvestris L.) stands in the Sarıçiçek Forest, Northern Turkey[J]. Scandinavian Journal of Forest Research, 2018, 33: 455−463. doi: 10.1080/02827581.2018.1444196
[35] Liang J J, Buongiorno J, Monserud R A. Growth and yield of all-aged Douglas-fir–western hemlock forest stands: a matrix model with stand diversity effects[J]. Canadian Journal of Forest Research, 2005, 35(10): 2368−2381. doi: 10.1139/x05-137
[36] Liang J J, Buongiorno J, Monserud R A, et al. Effects of diversity of tree species and size on forest basal area growth, recruitment, and mortality[J]. Forest Ecology and Management, 2007, 243(1): 116−127. doi: 10.1016/j.foreco.2007.02.028
[37] Kujansuu J, Yasue K, Koike T, et al. Climatic responses of tree-ring widths of Larix gmelinii on contrasting north-facing and south-facing slopes in central Siberia[J]. Journal of Wood Science, 2007, 4: 881−102.
[38] 郭常酉, 郭宏仙, 王宝华. 基于气候因子的杉木单木胸径生长模型构建[J]. 南京林业大学学报(自然科学版), 2023, 47(1): 47−56. Guo C Y, Guo H X, Wang B H. Study on increment model of individual-tree diameter of Cunninghamia lanceolatain consideration of climatic factors[J]. Journal of Nanjing Forestry University (Natural Sciences Edition), 2023, 47(1): 47−56.
[39] Akkemik. Dendroclimatology of umbrella pine (Pinus pine L.) in Istanbul, Turkey[J]. Tree-Ring Bulletin, 2000, 56: 17−20.
计量
- 文章访问数: 560
- HTML全文浏览量: 155
- PDF下载量: 75
