
Soil water characteristics of Populus tomentosa stands under different densities and water treatments
-
摘要:目的
土壤水分是影响我国北方水分亏缺地区植被生长的重要因素,探究不同造林密度和水分管理下毛白杨林分的土壤水分状况,能为华北黄泛平原地区人工林土壤水分维持提供参考。
方法以不同造林密度(Ⅲ3 m × 3 m、Ⅱ3 m × 6 m、Ⅰ6 m × 6 m)和水分管理(滴灌FI、雨养NI)下的5种(FIⅢ、FIⅠ、NIⅢ、NIⅡ、NIⅠ)毛白杨林分为研究对象,在2021年生长季内(5、6、8和10月),采用烘干称重法测定各处理6 m剖面内的土壤含水量(SWC),研究不同处理土壤水分状况及土壤干层现象。
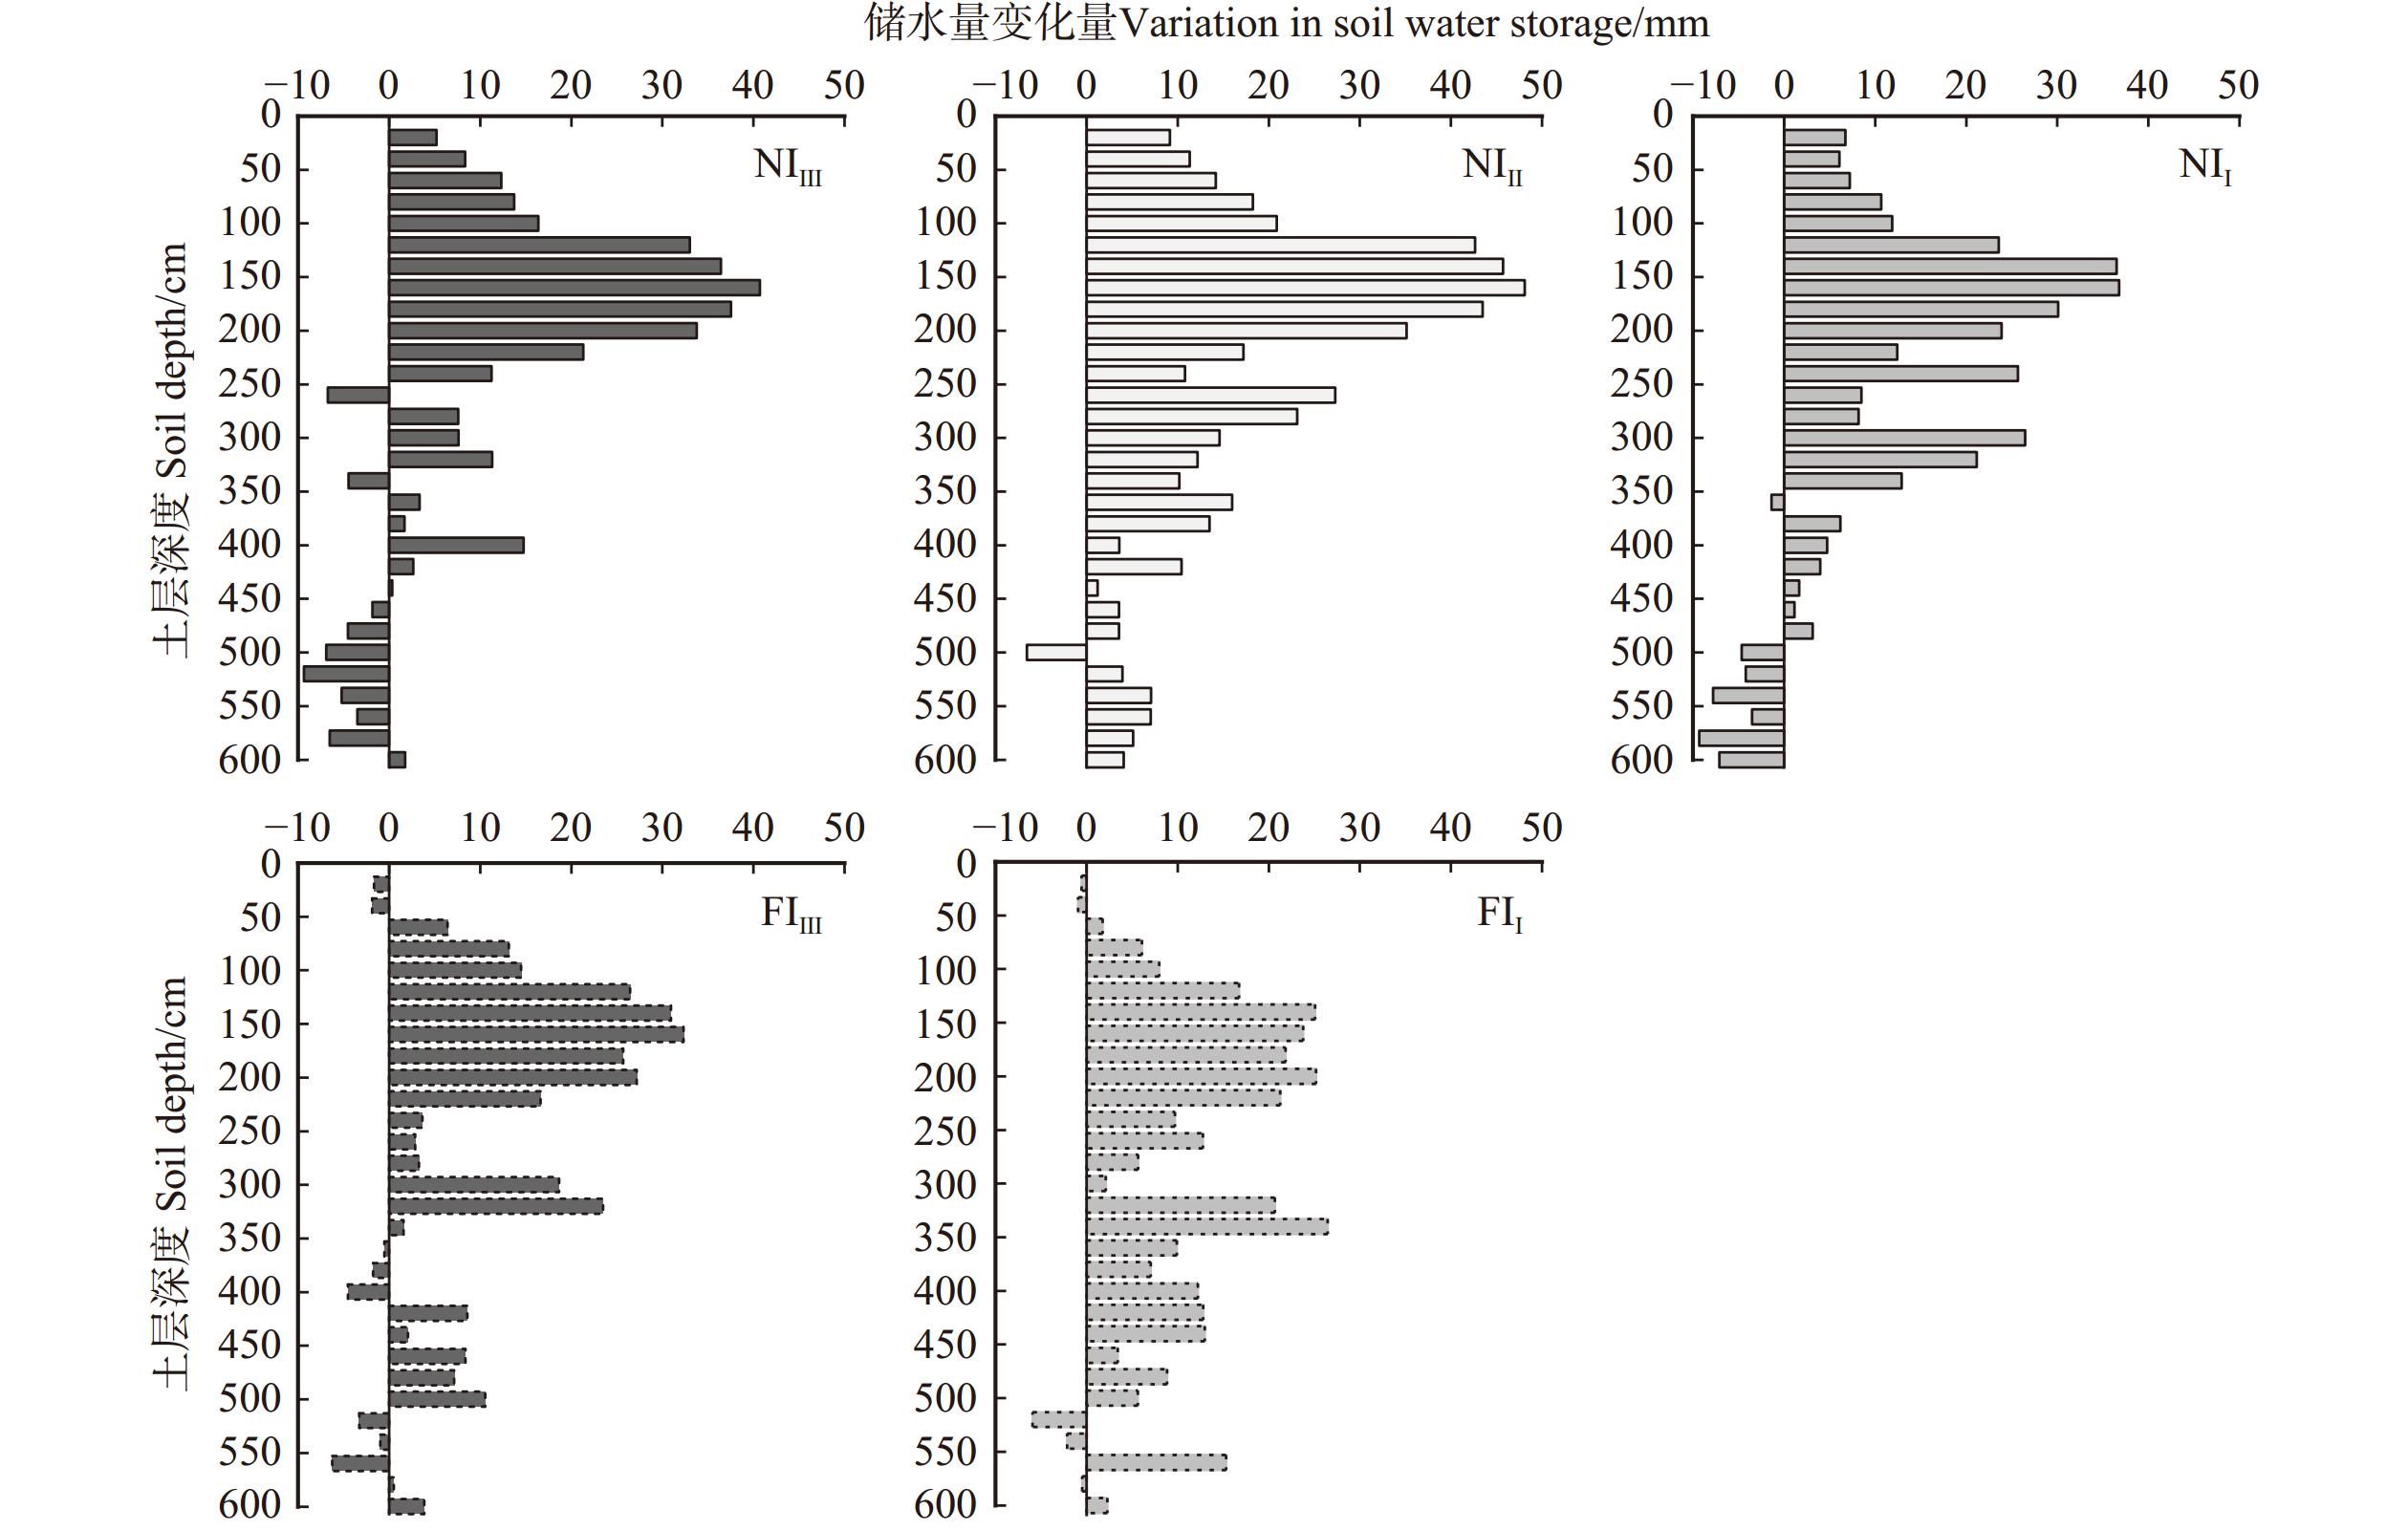
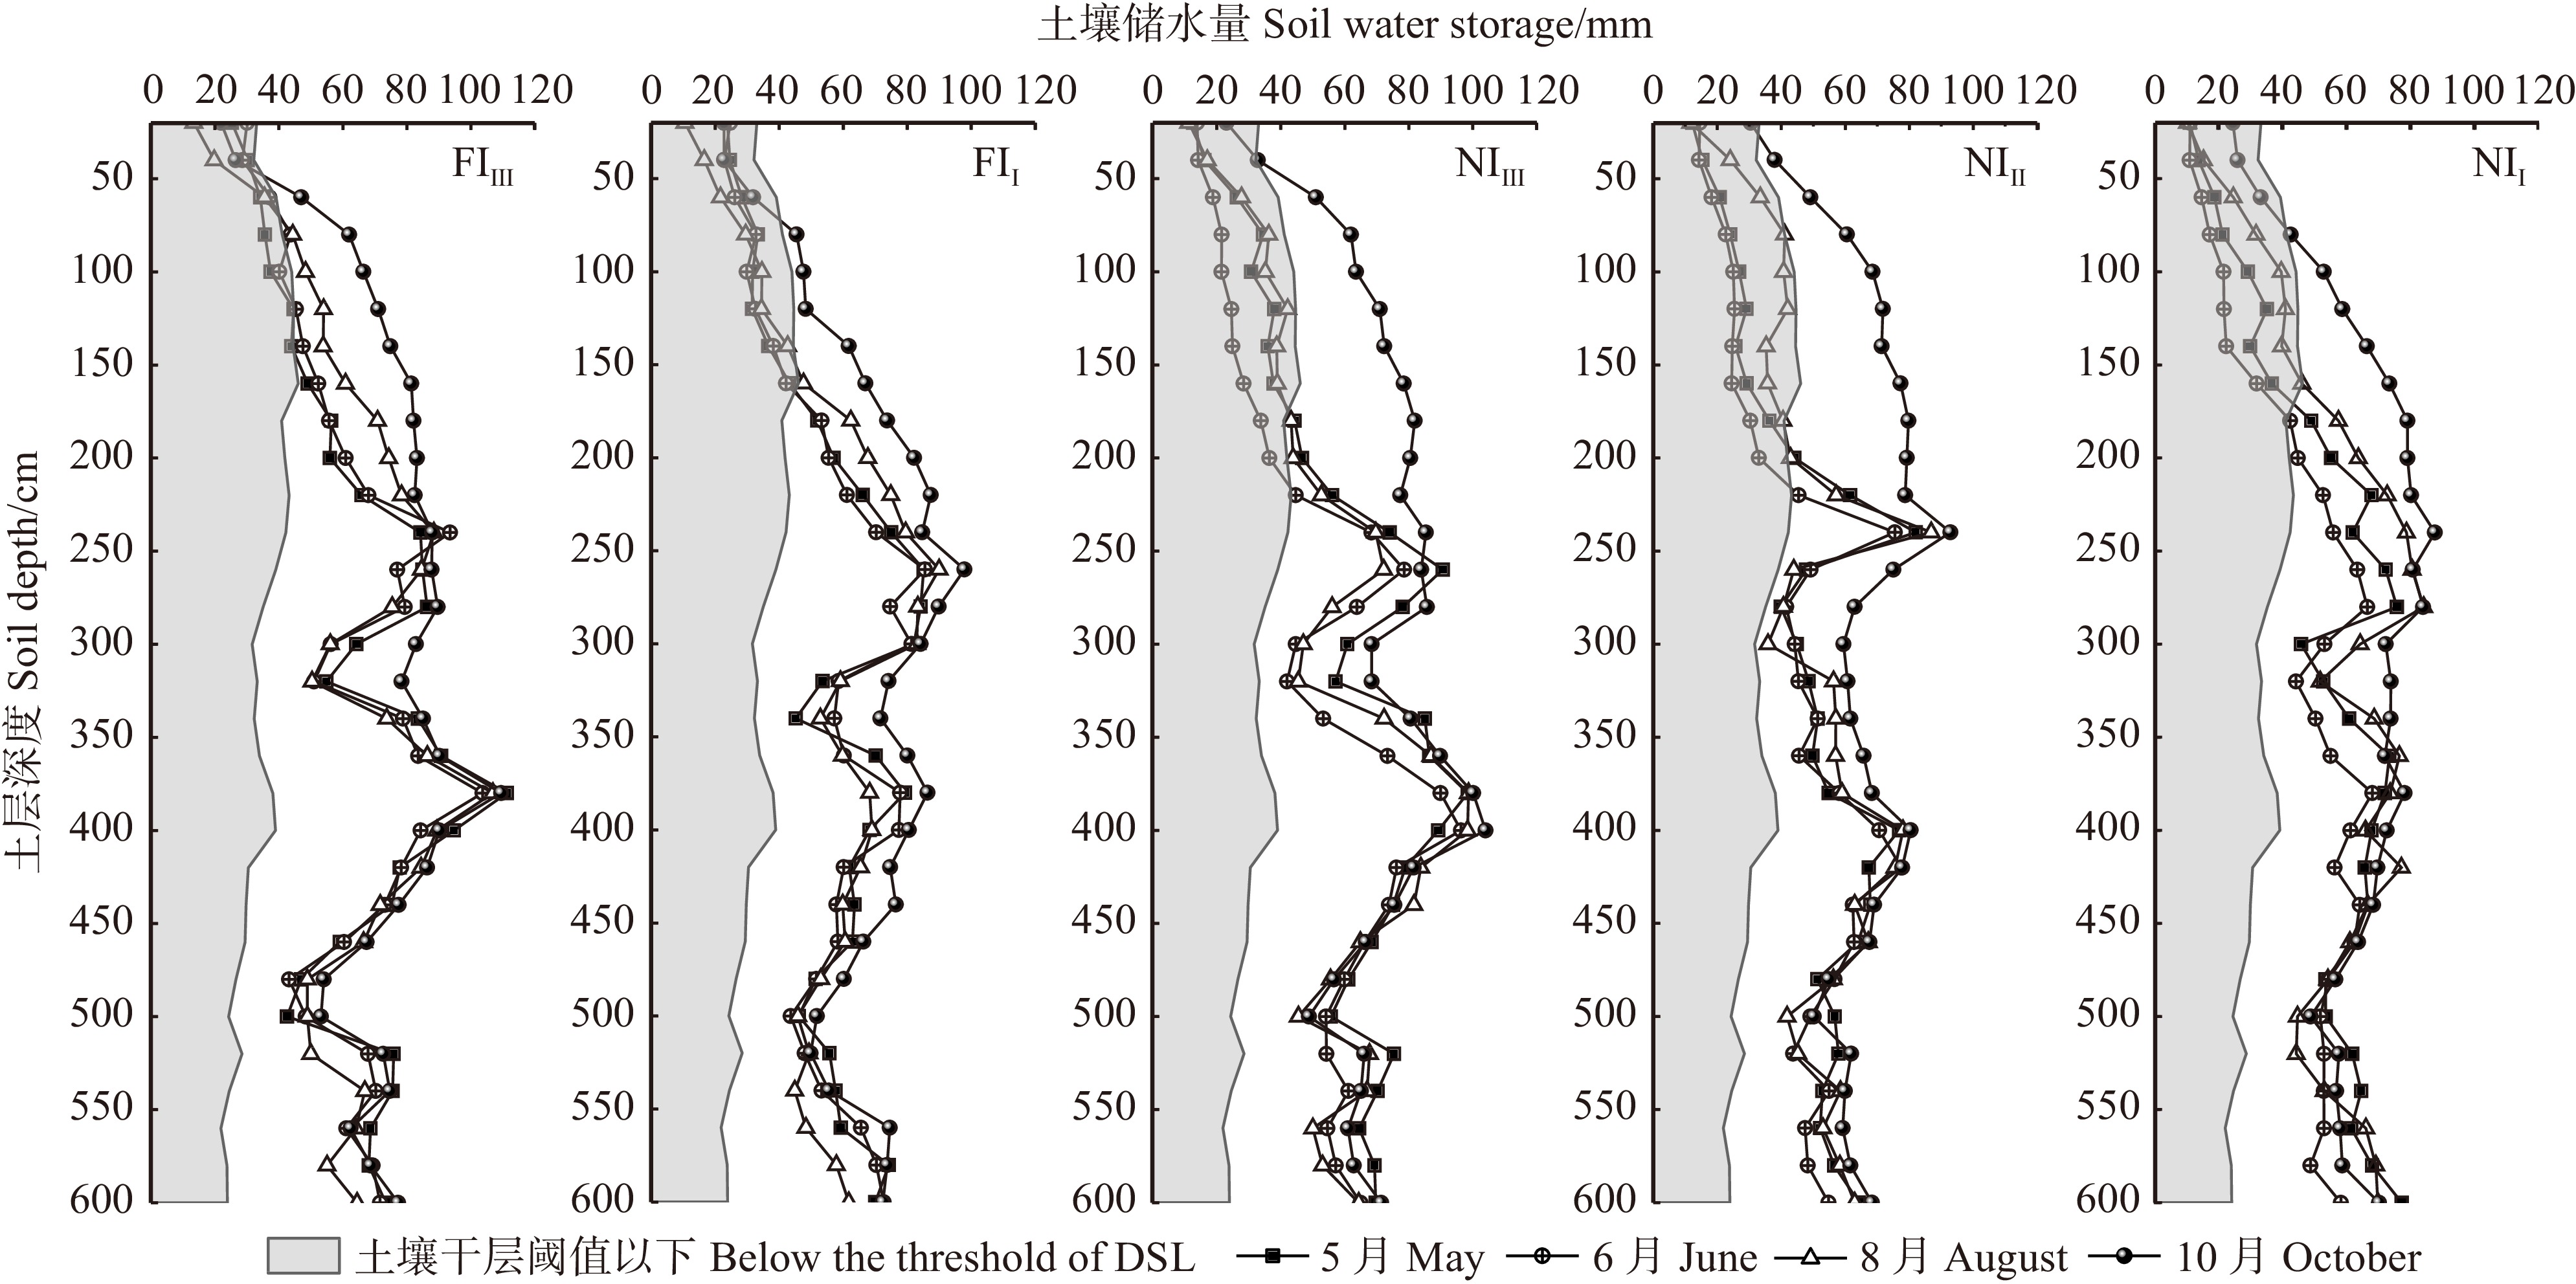
结果(1)各处理毛白杨林分浅土层(0 ~ 30 cm和30 ~ 100 cm)的SWC(5.62% ~ 15.53%)显著低于深土层(100 ~ 200 cm、200 ~ 400 cm和400 ~ 600 cm)(16.50% ~ 27.00%);林分SWC在0 ~ 240 cm垂直剖面内随深度增加而增加,并在240 ~ 260 cm(26.37% ~ 30.56%)和360 ~ 400 cm(22.79% ~ 33.00%)出现两个峰值,而400 ~ 600 cm变化平缓;(2)5种林分土壤均在10月最为湿润,平均SWC为20.16% ~ 23.16%;雨养条件下,不同密度毛白杨林分在6月最干燥,平均SWC为13.11% ~ 14.96%,滴灌减轻了30 cm以下土层SWC的季节变异程度;(3)不同水分管理下,高密度林分中深土层土壤水分状况最好(FIⅢ和NIⅢ深土层平均SWC分别为23.18%和21.13%),但雨季末(10月),NIⅡ土壤水分补偿量最高,达403.12 mm。在高密度和低密度林分中滴灌显著提高了林分0 ~ 30 cm土层的SWC,且增加了深土层土壤水分补偿量(FIⅢ较NIⅢ和FIⅠ较NIⅠ的储水量变化量分别提高了84.40%和173.99%),滴灌仅显著提高了高密度林分土壤储水量(P < 0.05);(4)滴灌和降雨均能缓解或消除不同密度林分在2 m深度内出现的可恢复性土壤干层现象。
结论根据本研究结果,建议在华北黄泛平原毛白杨大径材林培育过程中,以3 m × 3 m密度造林且于旱季(4—6月)辅以多频率滴灌充分灌溉,促进杨树人工林在快速生长期(2 ~ 4年)的林木生长并改善其深层土壤水分状况。待林分出现密度效应及深层土壤水消耗后,可通过间伐等措施在实现土壤水分维持的同时提高杨树人工林林地生产力。
Abstract:ObjectiveIn water-deficit area of northern China, soil water content is a crucial factor affecting plant growth. Studying the soil water status of Populus tomentosa stands under different planting densities and water treatments can provide a reference basis for soil water maintenance of plantations in the North China Plain.
MethodPopulus tomentosa plantations under five different planting densities (Ⅲ 3 m × 3 m, Ⅱ 3 m × 6 m and Ⅰ 6 m × 6 m) and water (drip irrigation, FI and rainfed, NI) treatments (FIⅢ, FIⅠ, NIⅢ, NIⅡ and NIⅠ) were selected in this study. During the growing season (May, June, August and October) in 2021, soil water content (SWC) within the 6 m-depth soil profile was measured using the drying-weighing method, soil water content conditions and the occurrence of dry soil layer (DSL) were investigated and compared among different treatments.
Result(1) Shallow soil layers (0−30 cm and 30−100 cm, ranging from 5.62% to 15.53%) showed significantly lower SWC than the deep soil layers (100−200 cm, 200−400 cm, and 400−600 cm, ranging from 16.50% to 27.00%) in each treatment. The SWC in all stands increased with depth within the vertical profile of 0−240 cm, showing two peaks at 240−260 cm (26.37%−30.56%) and 360−400 cm (22.79%−33.00%), while the change of SWC at 400−600 cm was relatively gradual. (2) All five stands exhibited the highest soil water availability in October, with an average SWC from 20.16% to 23.16%. In rainfed treatment, soil was driest in June independent of planting density, the average SWC ranged from 13.11% to 14.96%. Drip irrigation treatment reduced the seasonal variation in SWC in the soil layer below 30 cm. (3) Under different water treatments, high density stands exhibited the highest soil water availabilities in the deep soil layers (average SWC of 23.18% for FIⅢ and 21.13% for NIⅢ). However, NIⅡ exhibited the highest soil water compensation at the end of the rainy season (October) of 403.12 mm. In both high and low density stands, SWC in the 0−30 cm soil layer was significantly increased by drip irrigation treatment, the compensation of soil water in the deep layers was also enhanced (the change in water storage was 84.40% in FIⅢ than in NIⅢ, and 173.99% higher in FIⅠ than in NIⅠ). Drip irrigation treatment only significantly improved soil water storage in high density stands (P < 0.05). (4) Both drip irrigation and precipitation effectively alleviated or eliminated the occurrence of recoverable DSL within 2 m-depth under different planting densities.
ConclusionAccording to the results of this study, a 3 m × 3 m planting density with frequent full irrigation treatment during dry season (April to June) is recommended for the cultivation of large-diameter poplar plantation in the North China Yellow River Plain in order to achieve fast tree growth in the early growing stage (2−4 years) and improve water condition of the deep soil layers. After the occurrence of evident density effect and deep soil water content depletion, management practices like thinning can be implemented to maintain soil water production and enhance the productivity of poplar plantations.
-
Keywords:
- planting density /
- water treatments /
- Populus tomentosa /
- soil water /
- dry soil layer
-
油松(Pinus tabuliformis)为我国北方地区特有的乡土针叶树种[1],广泛分布于山西、河北、河南、辽宁、内蒙古、甘肃等省区[2],在三北地区大规模国土绿化、脆弱生态系统保护与修复、国家储备林、森林碳汇等国家重大战略过程中发挥重要作用[3]。当前,油松的遗传改良层次普遍较低,正处于初级种子园向高世代种子园的过渡阶段。油松高世代基本群体以种子园半同胞子代林为主,少部分是全同胞子代林,普遍存在参与控制授粉的亲本数量偏少、家系间和家系内单株间遗传变异巨大等问题,需要开展针对油松高世代基本群体特点的亲本选择策略研究。
近年来,配合选择策略已广泛应用于红松(Pinus koraiensis)[4]、青海云杉(Picea crassifolia)[5]、马尾松(Pinus massoniana)[6]、日本落叶松(Larix kaempferi)[7]、白桦(Betula platyphylla)[8]和枫香(Liquidambar formosana)[9]等树种高世代种子园建园亲本选择过程中,最优单株直接选择策略在油松[10]和柏木(Cupressus funebris)[11]中也逐渐得到应用。在树种多世代改良中采用配合选择策略,可以延缓近交率发展过快,使高世代种子园种子产量和品质稳固提高[12]。然而,配合选择策略忽略了被淘汰家系中存在遗传品质更优单株资源等情况,造成了大量优良育种资源的损失,从而弱化了油松高世代遗传改良中亲本选择的预期效果。最优单株直接选择策略可以有效避免遗传品质优良单株资源的损失,但单株间存在近交的可能,需要借助分子标记技术鉴别单株间的亲缘关系。
目前,油松第二代种子园建园亲本的选择多采用配合选择策略。袁虎威等[12]在油松初级种子园优树自由授粉子代测定林内,以家系平均材积优势比为指标,选出了20个优良家系,并配合单株材积优势比的相对大小选出了20个优良单株,材积遗传增益平均值为0.13%。王建伟[13]采用多性状育种值评选法和综合指数法,从桥山双龙112个油松半同胞家系中筛选出16个优良家系,并从中配合选择筛选出70个优良单株。杨培华等[14]对142个油松优树进行半同胞子代测定之后,利用独立淘汰水平法根据数量标准选出了36个优良家系,然后从中选出了263个优良单株,子代材积增益十分显著。然而,依据 2017年袁虎威等[10]提出的“油松高育种周期优良种质资源可来源于大规模种子园自由授粉子代人工林中的优良单株”的新思路,可知有必要开展油松高世代种子园建园亲本选择策略的对比分析研究,进一步提高亲本选择效率和选择效果。
本文以上庄油松初级种子园自由授粉子代测定林为基本群体,选用测定林内42个油松半同胞家系的生长性状调查数据,对半同胞家系生长性状进行遗传变异分析、遗传参数估算和相关性分析,在此基础上分别采用配合选择策略和最优单株直接选择策略来筛选油松第二代种子园建园亲本,并对比分析二者选择效果,旨在为油松高改良世代亲本的评价选择提供参考依据,加速油松育种改良的换代升级。
1. 材料与方法
1.1 试验地概况与试验材料
试验地位于山西省隰县上庄油松良种基地(111°12′E,36°45′N),地处吕梁山脉南端,紫荆山东麓,海拔1 570 ~ 1 930 m,年均气温8 ℃,年无霜期120 ~ 140 d,极端最高气温32 ℃,极端最低气温−21.5 ℃,最深冻土层0.91 m,年降雨量580 ~ 810 mm,土壤为山地棕壤,地形为石质山。供试材料为1984年营建的油松第二世代半同胞子代测定林,种子来源为该良种基地油松初级种子园优良无性系自由授粉种子。试验林采用完全随机区组试验设计,4次重复,每重复小区数45个,包含45个家系(表1),其中3个对照家系PT43(CK0)、PT40(CK1)和PT44(CK2)为当地油松天然林分优树子代,每个小区5株,单株编号1 ~ 5,共900株,株行距为2 m × 2 m结合4 m × 2 m,试验地内管理措施和坡度、坡向等立地条件基本一致。试验林内家系PT5、PT34和PT45缺失,对照家系PT40缺失5株、PT43缺失1株、PT44缺失8株,剩余家系各缺失1 ~ 2株,选择对照家系PT43作为唯一对照。本研究将以半同胞子代测定林为油松第二世代基本群体。
表 1 45个油松半同胞家系编号和对应亲本无性系Table 1. No. and corresponding parental clones from 45 half-sib families of P. tabuliformis家系号
Family No.对应亲本无性系
Corresponding parental clone家系号
Family No.对应亲本无性系
Corresponding parental clone家系号
Family No.对应亲本无性系
Corresponding parental clonePT1 复1 PT16 关53 PT31 关38 PT2 关24 PT17 初25 PT32 初2 PT3 关14 PT18 关22 PT33 关3 PT4 关4 PT19 复8 PT34 初18 PT5 关44 PT20 复13 PT35 复11 PT6 关28 PT21 关50 PT36 复18 PT7 复12 PT22 关23 PT37 关55 PT8 关6 PT23 关35 PT38 关51 PT9 关1 PT24 关46 PT39 关26 PT10 关17 PT25 关42 PT40 CK1 PT11 关8 PT26 关7 PT41 关11 PT12 复9 PT27 初4 PT42 关5 PT13 关2 PT28 关37 PT43 CK0 PT14 关56 PT29 关29 PT44 CK2 PT15 关9 PT30 关58 PT45 复17 1.2 数据调查与分析方法
2018年4月对试验林42个家系(家系PT5、PT34和PT45缺失)的生长性状进行调查,测量统计了781个单株的胸径和树高。单株材积计算利用
V=0.3578×π(D2)2(H+3) (1) 式中:V代表单株材积(m3),D代表胸径(cm),H代表树高(m) [15]。
利用SPSS 23.0、Excel 2019统计软件进行42个家系胸径、树高、材积性状的方差分析、相关性分析和遗传参数的估算。
Yijk=μ+Bi+Fj+BFij+eijk (2) 式中:Yijk代表第i区组第j家系第k单株的观测值,μ为群体平均值,Bi代表区组效应,Fj代表家系效应,BFij代表第i区组和第j家系互作效应,eijk代表机误。
家系遗传力(h2F)为
h2F=σ2Fσ2ENB+σ2FBB+σ2F (3) 单株遗传力(h2)为
h2=4σ2Fσ2E+σ2FB+σ2F (4) 式中:σ2F为家系遗传方差,σ2FB为家系和区组互作方差,σ2E为机误,B为区组数,N为小区内单株数[16,18]。
表型变异系数(PCV)为
PCV=σP¯X×100% (5) 遗传变异系数(GCV)为
GCV=σg¯X×100% (6) 式中:σP为性状表型标准差,σg为性状遗传标准差,¯X为性状群体总平均值[19−20]。
一般配合力(GCA)为
GCA=Xi−X.. (7) 式中:Xi为家系性状生长量,X..为该性状总平均值[21]。
表型相关系数(rPxy)为
rPxy=cov(Pxy)σPxσPy (8) 遗传相关系数(rgxy)为
rgxy=cov(gxy)σgxσgy (9) 式中:cov(Pxy)为性状x与性状y的表型协方差, cov(gxy)为性状x与性状y的遗传协方差;σPx和σPy分别为性状x和性状y的表型标准差;σgx和σgy分别为性状x和性状y的遗传标准差[22]。
利用布雷金多性状综合评价法[23]对家系与单株进行综合评定,具体公式为
Qi=n∑j=1xijxjmax (10) 式中: {{Q}}_{{i}} 为综合评价值,xij为某一性状的平均值,xjmax为某一性状的最大值,n为评价性状的数量。
家系现实遗传增益(G)为
G = \frac{{x - X}}{X} \times 100\% (11) 式中:x为入选家系性状生长量,X为对照家系性状生长量。
家系预期遗传增益( \Delta {G_{\rm{F}}} )[24−25]为
\Delta {G_{\rm{F}}} = \frac{{\left( {x - \overline X } \right)h_{\rm{F}}^2}}{{\overline X }} \times 100\% (12) 单株预期遗传增益( \Delta {G} )为
\Delta G = \frac{{\left( {{x_i} - \overline X } \right){h^2}}}{{\overline X }} \times 100\% (13) 式中:xi为单株性状表型值[12]。
2. 结果与分析
2.1 油松半同胞家系各性状遗传变异分析
对测定林内42个油松半同胞家系的胸径、树高和材积作方差分析发现,胸径、树高和材积在半同胞家系间和家系内均呈极显著差异(P < 0.01,表2)。
表 2 42个油松半同胞家系生长性状方差分析与遗传力估算Table 2. Variance analysis and heritability estimation of growth traits from 42 half-sib families of P. tabuliformis生长性状
Growth trait区组方差
Block variance家系间方差
Family variance家系内方差
Within-family variance家系遗传力
Family heretability单株遗传力
Individual-tree narrow heretability胸径 DBH 1.647 2.082** 2.009** 0.035 0.012 树高 Tree height 5.291** 3.264** 2.220** 0.320 0.161 材积 Volume 2.102 2.381** 1.978** 0.169 0.066 注: **表示差异极显著(P < 0.01)。Note: ** represents extremely significant difference at 0.01 level. 由图1可知:42个家系中胸径、树高和材积大于对照(PT43)的分别占83.33%、95.24% 和85.71%,并且有34个家系各性状生长量均超过对照。胸径、树高和材积最大值家系分别为PT1、PT7和PT1,最小值家系分别为PT29、PT13和PT29,各性状最大值依次为最小值的1.9倍、1.5倍和3.3倍。
![]() 图 1 油松42个半同胞家系各性状生长量Figure 1. Growth of each trait from 42 half-sib families of P. tabuliformis
图 1 油松42个半同胞家系各性状生长量Figure 1. Growth of each trait from 42 half-sib families of P. tabuliformis由表2可知:生长性状家系遗传力变化范围为0.035 ~ 0.320,其中树高家系遗传力最高,材积次之,胸径最低;单株遗传力变化范围为0.012 ~ 0.161,其中树高单株遗传力最高,材积次之,胸径最低。这表明树高受遗传因素调控的强度较高,而材积和胸径受到较弱的遗传因素调控。
油松半同胞家系生长性状均值和变异系数见表3。胸径、树高和材积平均值分别为19.89 cm、8.83 m和0.138 1 m3,变异幅度分别为11.00 ~ 29.00 cm、7.00 ~ 11.60 m和0.037 0 ~ 0.311 8 m3。油松半同胞家系间材积的遗传变异系数(0.724 1)与表型变异系数(16.075 3)分别高出胸径的遗传变异系数(0.15)与表型变异系数(7.44)3.83倍和1.16倍,高出树高的遗传变异系数(0.34)与表型变异系数(4.17)1.13倍和2.84倍,反映了材积性状变异受环境因素的影响程度相对较高。各性状表型变异系数总体均值为9.23%。
表 3 42个油松半同胞家系生长性状均值与变异系数Table 3. Variation coefficients and mean values of growth traits from 42 half-sib families of P. tabuliformis指标 Index 胸径 DBH/cm 树高 Tree height/m 材积 Volume/m3 均值 Mean value 19.89 8.83 0.138 1 变异幅度 Variation range 11.00 ~ 29.00 7.00 ~ 11.60 0.037 0 ~ 0.311 8 遗传标准差 Genetic standard deviation 0.03 0.03 0.001 0 表型标准差 Phenotypic standard deviation 1.48 0.37 0.022 2 遗传变异系数 Coefficient of genetic variation (GCV)/% 0.15 0.34 0.724 1 表型变异系数 Coefficient of phenotypic variation (PCV)/% 7.44 4.17 16.075 3 2.2 油松半同胞家系各生长性状的一般配合力
配合力是在有性繁殖过程中,为获得遗传型更好的子代而提出。一般配合力能反映亲本加性基因的效应,是种子园亲本选择的依据之一[26−27]。42个油松半同胞家系生长性状一般配合力及排序见表4。就胸径而言,一般配合力范围为−4.992 ~ 8.108,家系PT1、PT13、PT20、PT11、PT12、PT44、PT30、PT42、PT27和PT24一般配合力较高,位居前10;就树高而言,一般配合力范围为−0.933 ~ 2.634,家系PT7、PT11、PT19、PT2、PT42、PT40、PT28、PT18、PT30和PT31一般配合力较高,位居前10;就材积而言,一般配合力范围为−0.061 ~ 0.113,家系PT1、PT11、PT13、PT20、PT30、PT12、PT42、PT19、PT44和PT31一般配合力较高,位居前10。总体而言,家系PT1、PT12、PT13、PT20和PT44的胸径和材积一般配合力均较高,家系PT11、PT30和PT42的胸径、树高和材积一般配合力均较高。
表 4 42个油松半同胞家系生长性状一般配合力及排序Table 4. General combining ability of growth traits and ranking from 42 half-sib families of P. tabuliformis家系号 Family No. 胸径 DBH 排序 Ranking 树高 Tree height 排序 Ranking 材积 Volume 排序 Ranking PT1 8.108 1 −0.433 28 0.113 1 PT2 −0.925 30 0.967 4 −0.002 27 PT3 1.508 17 0.367 13 0.019 18 PT4 −2.467 37 −0.708 37 −0.041 38 PT6 −3.530 39 −0.483 31 −0.050 39 PT7 −0.359 28 2.634 1 0.019 16 PT8 0.975 21 −0.866 40 −0.002 28 PT9 1.275 18 −0.033 19 0.010 21 PT10 1.071 20 −0.458 30 0.007 22 PT11 5.291 4 1.901 2 0.109 2 PT12 5.208 5 0.242 16 0.076 6 PT13 6.708 2 −0.933 42 0.079 3 PT14 1.808 16 −0.483 32 0.025 15 PT15 −0.092 26 −0.033 20 −0.002 26 PT16 2.908 11 0.117 18 0.038 11 PT17 −1.175 31 −0.333 23 −0.023 34 PT18 0.908 22 0.767 8 0.015 20 PT19 2.808 12 1.867 3 0.060 8 PT20 5.308 3 0.267 15 0.078 4 PT21 −0.192 27 −0.583 33 −0.013 29 PT22 −4.842 41 0.567 11 −0.059 41 PT23 −0.542 29 −0.733 38 −0.021 33 PT24 2.983 10 −0.195 22 0.034 12 PT25 0.158 25 −0.416 27 0.000 25 PT26 −1.181 32 −0.405 26 −0.019 32 PT27 3.108 9 −0.433 29 0.031 14 PT28 −2.817 38 0.792 7 −0.031 35 PT29 −4.992 42 0.467 12 −0.061 42 PT30 4.708 7 0.767 9 0.076 5 PT31 2.575 14 0.762 10 0.042 10 PT32 2.808 13 −0.333 24 0.032 13 PT33 −1.492 35 −0.583 34 −0.031 36 PT35 0.208 24 −0.333 25 0.004 24 PT36 −1.392 34 0.307 14 −0.017 31 PT37 −1.317 33 −0.070 21 −0.016 30 PT38 0.608 23 0.201 17 0.005 23 PT39 −3.675 40 −0.583 35 −0.052 40 PT40 1.108 19 0.867 6 0.019 17 PT41 2.097 15 −0.611 36 0.016 19 PT42 3.708 8 0.967 5 0.062 7 PT43 −1.692 36 −0.900 41 −0.036 37 PT44 5.108 6 −0.733 39 0.057 9 2.3 油松半同胞家系生长性状相关性分析
42个油松半同胞家系生长性状遗传、表型相关分析结果见表5,3个生长性状间在遗传与表型水平上均呈极显著正相关关系。不同生长性状之间的相关性强度存在一定差异,材积与胸径和树高间的遗传相关系数分别为0.986(P < 0.01)和0.785(P < 0.01),树高与胸径间的遗传相关系数为0.828(P < 0.01),表明材积与胸径的遗传相关性最强。同理,材积与胸径间的表型相关性最强,表型相关系数为0.979(P < 0.01)。
表 5 42个油松半同胞家系生长性状间相关系数Table 5. Correlation coefficients between growth traits from 42 half-sib families of P. tabuliformis生长性状 Growth trait 胸径 DBH 树高 Tree height 材积 Volume 胸径 DBH 1 0.683** 0.979** 树高 Tree height 0.828** 1 0.720** 材积 Volume 0.986** 0.785** 1 注:加粗数据为遗传相关系数,下划线数据为表型相关系数,**表示相关达极显著水平(P < 0.01)。Notes: genetic correlation coefficient is bold, phenotype correlation coefficient is underline, ** represents correlation is extremely significant at 0.01 level. 2.4 油松第二代种子园亲本选择策略的对比分析
配合选择策略包括优良家系选择与优良单株选择2个环节。在初级种子园优良无性系自由授粉子代测定林内,首先,基于42个油松半同胞家系间各生长性状均存在极显著的差异,以胸径和树高为指标对家系进行综合评定,并以各家系Qi值高于对照家系PT43(1.158)为选择标准,筛选出30个优良家系(表6),入选率为71.43%。与对照家系PT43相比,入选家系的胸径、树高和材积的现实遗传增益变动范围分别为−6.18% ~ 53.85%、−0.42% ~ 44.54% 和5.06% ~ 146.25%,平均胸径、树高和材积现实遗传增益依次为20.24%、14.16% 和63.82%。与选择群体相比,入选家系的胸径、树高和材积的预期遗传增益变动范围分别为−0.50% ~ 1.43%、−3.38% ~ 9.54% 和−3.79% ~ 13.83%,平均胸径、树高和材积的预期遗传增益依次为 0.35%、0.81% 和3.54%。然后根据单株Qi值的相对大小,于每一优良家系中选择一个最优单株,共筛选出30个优良单株。入选30个优良单株按照Qi值的相对大小分别命名为JD1,JD2,···,JD30,具体信息如表7所示。
表 6 油松30个优良家系综合评定Qi值与遗传增益估算值Table 6. Qi value and estimated genetic gain from 30 elite families of P. tabuliformis家系号
Family No.Qi 现实遗传增益 Realized genetic gain/% 预期遗传增益 Expected genetic gain/% 胸径 DBH 树高 Tree height 材积 Volume 胸径 DBH 树高 Tree height 材积 Volume PT11 1.355 38.37 35.29 142.45 0.93 6.89 13.36 PT19 1.321 24.73 34.87 94.50 0.49 6.76 7.37 PT1 1.316 53.85 5.88 146.25 1.43 −1.57 13.83 PT30 1.310 35.16 21.01 110.08 0.83 2.78 9.32 PT7 1.303 7.33 44.54 54.43 −0.06 9.54 2.37 PT42 1.303 29.67 23.53 96.42 0.65 3.50 7.61 PT20 1.301 38.46 14.71 111.71 0.93 0.97 9.52 PT12 1.299 37.91 14.39 109.74 0.92 0.88 9.27 PT31 1.280 23.44 20.94 76.92 0.45 2.76 5.18 PT13 1.280 46.15 −0.42 112.49 1.18 −3.38 9.62 PT16 1.263 25.27 12.82 72.50 0.51 0.42 4.63 PT18 1.257 14.29 21.01 50.19 0.16 2.78 1.84 PT24 1.253 25.69 8.88 69.21 0.52 −0.71 4.22 PT3 1.252 17.58 15.97 53.94 0.27 1.33 2.31 PT27 1.247 26.37 5.88 66.15 0.55 −1.57 3.84 PT32 1.246 24.73 7.14 66.87 0.49 −1.21 3.92 PT2 1.238 4.21 23.53 33.19 −0.16 3.50 −0.28 PT9 1.234 16.30 10.92 45.62 0.22 −0.12 1.27 PT38 1.233 12.64 13.87 40.41 0.11 0.73 0.62 PT14 1.226 19.23 5.25 59.56 0.32 −1.75 3.01 PT41 1.226 20.82 3.64 50.96 0.37 −2.21 1.94 PT10 1.216 15.18 5.57 42.29 0.19 −1.66 0.86 PT15 1.214 8.79 10.92 33.57 −0.02 −0.12 −0.23 PT35 1.208 10.44 7.14 39.64 0.04 −1.21 0.53 PT36 1.207 1.65 15.21 18.91 −0.24 1.11 −2.06 PT25 1.204 10.16 6.09 35.49 0.03 −1.51 0.01 PT28 1.204 −6.18 21.32 5.06 −0.50 2.87 −3.79 PT8 1.200 14.65 0.42 33.02 0.17 −3.14 −0.30 PT37 1.195 2.06 10.45 19.77 −0.23 −0.25 −1.95 PT21 1.193 8.24 3.99 23.13 −0.03 −2.11 −1.53 表 7 配合选择策略筛选的优良单株Table 7. Superior individuals screening by combined selection strategy名称
Name编号
No.区组
Block家系号
Family No.胸径
DBH/cm树高
Tree height/m材积
Volume/m3Qi JD1 2 1 PT11 29.00 10.2 0.311 8 1.371 JD2 2 3 PT25 26.10 10.9 0.266 0 1.356 JD3 2 4 PT37 24.50 10.6 0.229 3 1.326 JD4 1 3 PT2 23.80 10.7 0.218 0 1.320 JD5 1 4 PT7 22.30 11.3 0.199 7 1.320 JD6 2 3 PT31 23.10 10.7 0.205 3 1.311 JD7 1 2 PT19 22.70 10.7 0.198 3 1.306 JD8 1 2 PT1 28.00 8.4 0.251 0 1.300 JD9 1 1 PT30 24.60 9.6 0.214 2 1.295 JD10 1 4 PT12 25.50 9.2 0.222 8 1.293 JD11 2 1 PT10 27.00 8.5 0.235 5 1.290 JD12 1 4 PT42 23.60 9.8 0.200 2 1.288 JD13 1 2 PT20 25.20 9.1 0.215 8 1.286 JD14 1 4 PT35 25.20 9.1 0.215 8 1.286 JD15 1 4 PT15 24.90 9.2 0.212 5 1.285 JD16 2 4 PT36 25.80 8.7 0.218 7 1.280 JD17 1 4 PT32 25.70 8.7 0.217 1 1.279 JD18 2 4 PT16 24.40 9.2 0.204 0 1.278 JD19 1 3 PT24 24.40 9.1 0.202 3 1.275 JD20 1 2 PT13 26.60 7.9 0.216 6 1.264 JD21 1 4 PT38 23.30 8.9 0.181 5 1.253 JD22 1 3 PT41 22.70 9.1 0.175 1 1.252 JD23 4 2 PT28 19.60 10.1 0.141 3 1.244 JD24 1 4 PT18 20.80 9.6 0.153 1 1.243 JD25 1 3 PT3 21.40 9.2 0.156 9 1.237 JD26 1 4 PT27 23.00 8.4 0.169 4 1.232 JD27 3 4 PT9 22.20 8.5 0.159 2 1.224 JD28 1 3 PT21 23.00 8.1 0.164 9 1.221 JD29 2 1 PT8 21.50 8.5 0.149 3 1.214 JD30 1 1 PT14 16.70 7.6 0.083 0 1.110 最优单株直接选择策略仅包括优良单株选择一个环节。为保证最优单株直接选择策略与配合选择策略之间具有可比性,在初级种子园优良无性系自由授粉子代测定林内,根据单株Qi值的相对大小,筛选出30个优良单株。入选30个优良单株按照Qi值的相对大小分别命名为D1,D2,···,D30,具体信息如表8所示。
表 8 最优单株直接选择策略筛选的优良单株Table 8. Superior individuals screening by direct selection strategy of optimal individual名称
Name编号
No.区组
Block家系号
Family No.胸径
DBH/cm树高
Tree height/m材积
Volume/m3Qi D1 2 1 PT11 29.00 10.20 0.311 8 1.371 D2 1 1 PT11 27.00 10.60 0.278 5 1.358 D3 2 3 PT25 26.10 10.90 0.266 0 1.356 D4 2 4 PT11 24.10 10.90 0.226 8 1.331 D5 3 4 PT11 23.80 11.00 0.222 7 1.330 D6 2 4 PT37 24.50 10.60 0.229 3 1.326 D7 1 3 PT2 23.80 10.70 0.218 0 1.320 D8 1 4 PT7 22.30 11.30 0.199 7 1.320 D9 1 3 PT25 23.70 10.70 0.216 1 1.319 D10 2 3 PT31 23.10 10.70 0.205 3 1.311 D11 1 2 PT19 22.70 10.70 0.198 3 1.306 D12 1 2 PT26 22.30 10.80 0.192 8 1.304 D13 3 4 PT7 20.10 11.60 0.165 7 1.301 D14 1 2 PT1 28.00 8.40 0.251 0 1.300 D15 1 1 PT30 24.60 9.60 0.214 2 1.295 D16 1 4 PT12 25.50 9.20 0.222 8 1.293 D17 2 1 PT31 23.80 9.80 0.203 6 1.291 D18 2 1 PT10 27.00 8.50 0.235 5 1.290 D19 1 4 PT42 23.60 9.80 0.200 2 1.288 D20 1 1 PT12 25.30 9.10 0.217 5 1.287 D21 3 4 PT31 26.30 8.70 0.227 3 1.287 D22 1 2 PT20 25.20 9.10 0.215 8 1.286 D23 1 4 PT35 25.20 9.10 0.215 8 1.286 D24 1 4 PT15 24.90 9.20 0.212 5 1.285 D25 2 4 PT36 25.80 8.70 0.218 7 1.280 D26 1 4 PT11 19.20 11.30 0.148 1 1.279 D27 1 4 PT32 25.70 8.70 0.217 1 1.279 D28 2 4 PT16 24.40 9.20 0.204 0 1.278 D29 1 3 PT24 24.40 9.10 0.202 3 1.275 D30 2 4 PT31 23.80 9.20 0.194 1 1.270 表7、表8显示:配合选择策略与最优单株直接选择策略筛选到19个相同的优良单株,并且各自筛选到11个特有的优良单株,分别为JD20、JD21、JD22、JD23、JD24、JD25、JD26、JD27、JD28、JD29、JD30和D2、D4、D5、D9、D12、D13、D17、D20、D21、D26、D30。配合选择策略与最优单株直接选择策略所筛选出的优良单株群体的平均Qi值分别为1.275和1.303。从性状生长量来看,配合选择策略入选单株的胸径、树高和材积变动范围分别为16.70 ~ 29.00 cm、7.60 ~ 11.30 m和0.083 0 ~ 0.311 8 m3,平均值分别为23.89 cm、9.32 m和0.199 6 m3,依次比总平均值高出20.09%、5.55% 和44.53%;最优单株直接选择策略所筛选出的优良单株的胸径、树高和材积变动范围分别为19.20 ~ 29.00 cm、8.40 ~ 11.60 m和0.148 1 ~ 0.311 8 m3,平均值分别为24.51 cm、9.91 m和0.217 7 m3,依次比总平均值高出23.23%、12.23% 和57.64%。最优单株直接选择策略所筛选11个特有优良单株的平均胸径、树高和材积生长量比配合选择策略所筛选的11个特有优良单株分别高出7.72%、18.56% 和31.01%。采用配合选择策略与最优单株直接选择策略筛选出的所有优良单株中, JD1和D1材积生长分别表现最优。
图2、图3显示:配合选择策略所筛选出的30个优良单株的胸径、树高和材积的预期遗传增益分别在−0.19% ~ 0.55%、−2.25% ~ 4.50% 和−2.63% ~ 8.31% 之间,最优单株直接选择策略分别在−0.04% ~ 0.55%、−0.79% ~ 5.04% 和0.48% ~ 8.31% 之间。与配合选择策略所筛选出的优良单株的平均胸径、树高和材积预期遗传增益相比,最优单株直接选择策略分别增加了15.52%、121.78% 和29.38%。采用配合选择策略与最优单株直接选择策略筛选出的所有优良单株中,JD1和D1子代材积的预期增益分别表现最为显著。
![]() 图 2 配合选择策略所筛选 30个优良单株生长性状预期遗传增益Figure 2. Expected genetic gain of growth traits of 30 superior individuals screening by combined selection strategy
图 2 配合选择策略所筛选 30个优良单株生长性状预期遗传增益Figure 2. Expected genetic gain of growth traits of 30 superior individuals screening by combined selection strategy![]() 图 3 最优单株直接选择策略所筛选 30个优良单株生长性状预期遗传增益Figure 3. Expected genetic gain of growth traits of 30 superior individuals screening by direct selection strategy of optimal individual
图 3 最优单株直接选择策略所筛选 30个优良单株生长性状预期遗传增益Figure 3. Expected genetic gain of growth traits of 30 superior individuals screening by direct selection strategy of optimal individual比较配合选择策略与最优单株直接选择策略筛选出的优良单株的分布情况(表7、表8),结果发现:与每一优良家系入选1个优良单株的配合选择策略不同,最优单株直接选择策略筛选出的30个优良单株分属于20个家系,其中有29个优良单株分属于19个优良家系,有1个优良单株D12属于非优良家系PT26,优良单株D12的材积预期遗传增益为2.62%,高于配合选择策略所筛选出的33.33% 的优良单株。此外,优良家系PT25、PT12和PT7内各有2个单株入选,优良家系PT31内有4个单株入选,优良家系PT11内入选了5个单株。
3. 讨 论
42个油松半同胞家系的3个生长性状方差分析结果表明,油松半同胞家系间和家系内胸径、树高和材积生长差异均达到极显著水平(P < 0.01),说明油松各生长性状在家系间和家系内变异丰富,这为优良家系和优良单株的评价选择奠定了基础。各生长性状家系遗传力估算值均小于0.5,与王建伟[13]、刘永红等[28]的估算结果相比偏低,表明生长性状在家系水平上受低强度遗传控制,这可能与不同试验群体、不同估算方法有关。
油松多用于用材林的营建,材积生长量的增长是其遗传改良工作最重要的育种目标之一[13,29]。值得注意的是,材积虽由胸径与树高计算所得,但材积与胸径相关性更强,遗传相关系数高达0.986,二者受遗传因素调控的强度与树高相比均较低。因此,直接以材积为指标进行选择改良的潜力相对较小,在筛选油松第二代种子园亲本材料时,可以通过对胸径与树高的联合选择,实现对材积的间接选择,有效地改进育种目标性状。
本研究根据家系综合评价结果,筛选出30个优良家系,入选率为71.43%。入选家系的胸径、树高和材积现实遗传增益变动范围分别为−6.18% ~ 53.85%、−0.42% ~ 44.54% 和5.06% ~ 146.25%,预期遗传增益变动范围分别为−0.50% ~ 1.43%、−3.38% ~ 9.54% 和−3.79% ~ 13.83%,其亲本材积一般配合力、平均材积现实遗传增益和平均材积预期遗传增益均相对较高,说明根据表型选择的家系在遗传上是优良的。根据单株综合评价结果,配合选择策略与最优单株直接选择策略分别选出30个优良单株,其中包括19个相同的优良单株和11个不同的优良单株。配合选择策略筛选出的优良单株的胸径、树高和材积生长量变动范围分别为16.70 ~ 29.00 cm、7.60 ~ 11.30 m和0.083 0 ~ 0.311 8 m3。最优单株直接选择策略筛选出的优良单株的胸径、树高和材积生长量变动范围分别为19.20 ~ 29.00 cm、8.40 ~ 11.60 m和0.148 1 ~ 0.311 8 m3。比较所筛选出的11个不同优良单株的平均胸径、树高和材积生长量,结果显示,最优单株直接选择策略比配合选择策略分别高出7.72%、18.56%和31.01%。比较入选优良单株的平均胸径、树高和材积预期遗传增益,结果显示,最优单株直接选择策略比配合选择策略分别增加了15.52%、121.78% 和29.38%。生长量与预期遗传增益的比较结果表明:利用最优单株直接选择策略筛选出的30个优良单株作为油松第二代种子园建园亲本,改良效果将会更优。除此之外,比较入选优良单株的家系分布发现,最优单株直接选择策略筛选出的优良单株几乎均来自于优良家系,那么从获得优良遗传型的繁琐程度上来说,采用最优单株直接选择策略比采用配合选择策略更加简便。最后,与配合选择策略中每个优良家系只筛选出一个优良单株相区别,最优单株直接选择策略结果显示,优良家系PT25、PT12、PT7、PT31和PT11内有多个单株入选,并且非优良家系PT26内有一单株D12入选。结合优良单株的生长量、预期遗传增益和分布情况的对比分析结果发现:采用配合选择策略损失了部分优良单株资源,不利于油松种子园的升级换代。综上所述,最优单株直接选择策略比配合选择策略更适合用于油松第二代种子园建园亲本的筛选。
4. 结 论
42个油松半同胞家系间和家系内胸径、树高和材积生长均达到了极显著差异水平(P < 0.01)。利用布雷金多性状综合评价法进行家系与单株综合评定,配合选择策略与最优单株直接选择策略分别选出30个优良单株,其中包括19个相同的优良单株和11个不同的优良单株。对入选优良单株的生长性状平均生长量、平均预期遗传增益和分布情况对比分析发现:采用配合选择策略会损失部分优良单株资源,最优单株直接选择策略比配合选择策略更适合用于油松高世代种子园亲本材料的筛选。
-
![]()
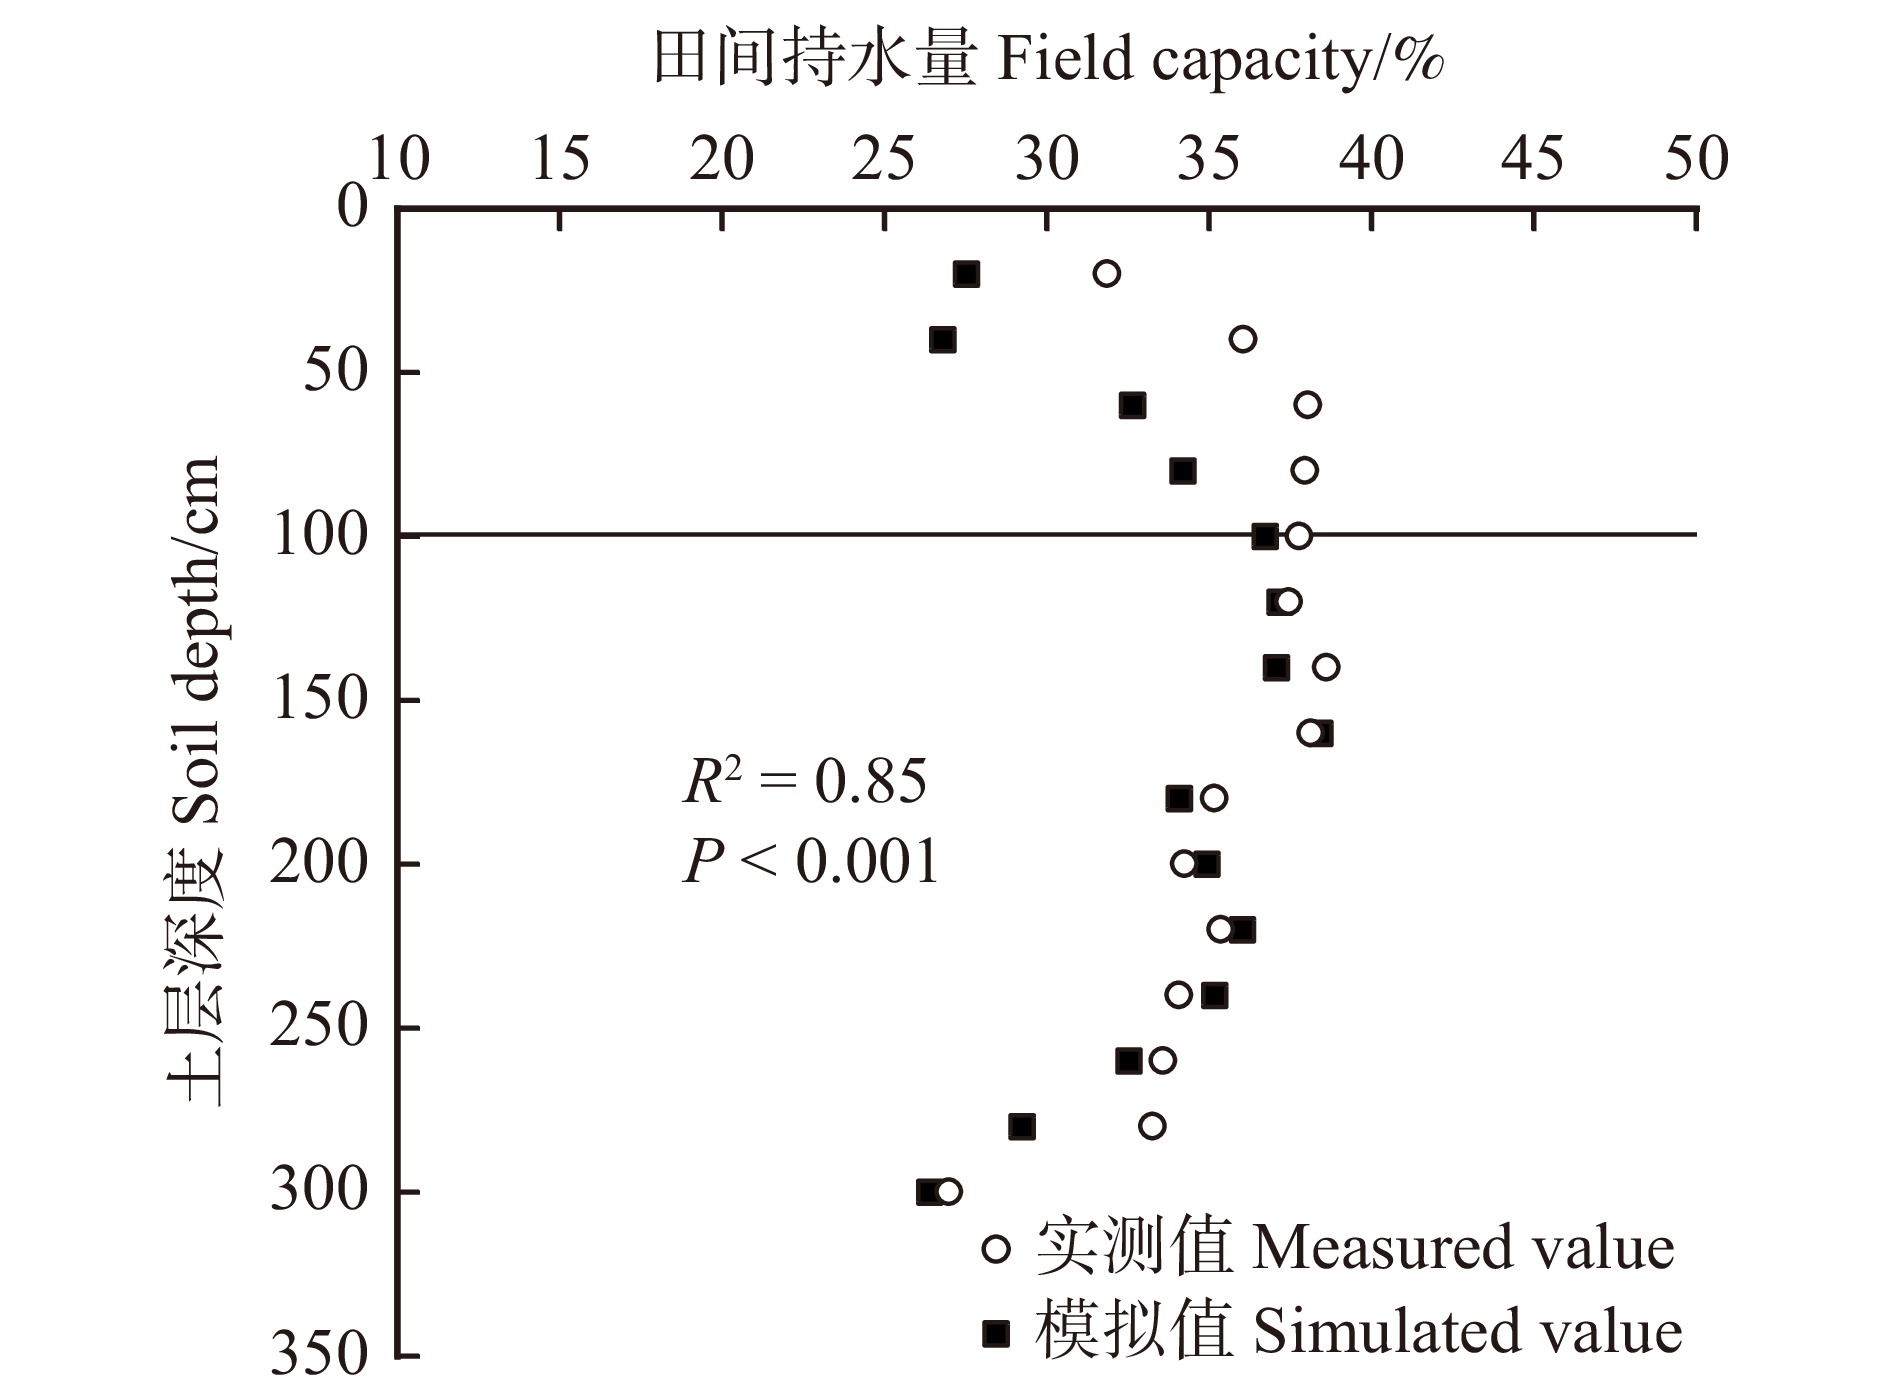
图 1 试验林不同深度土壤田间持水量实测值与模拟值比较
Figure 1. Comparison of measured and simulated field capacity in experimental forest under different depths
![]()
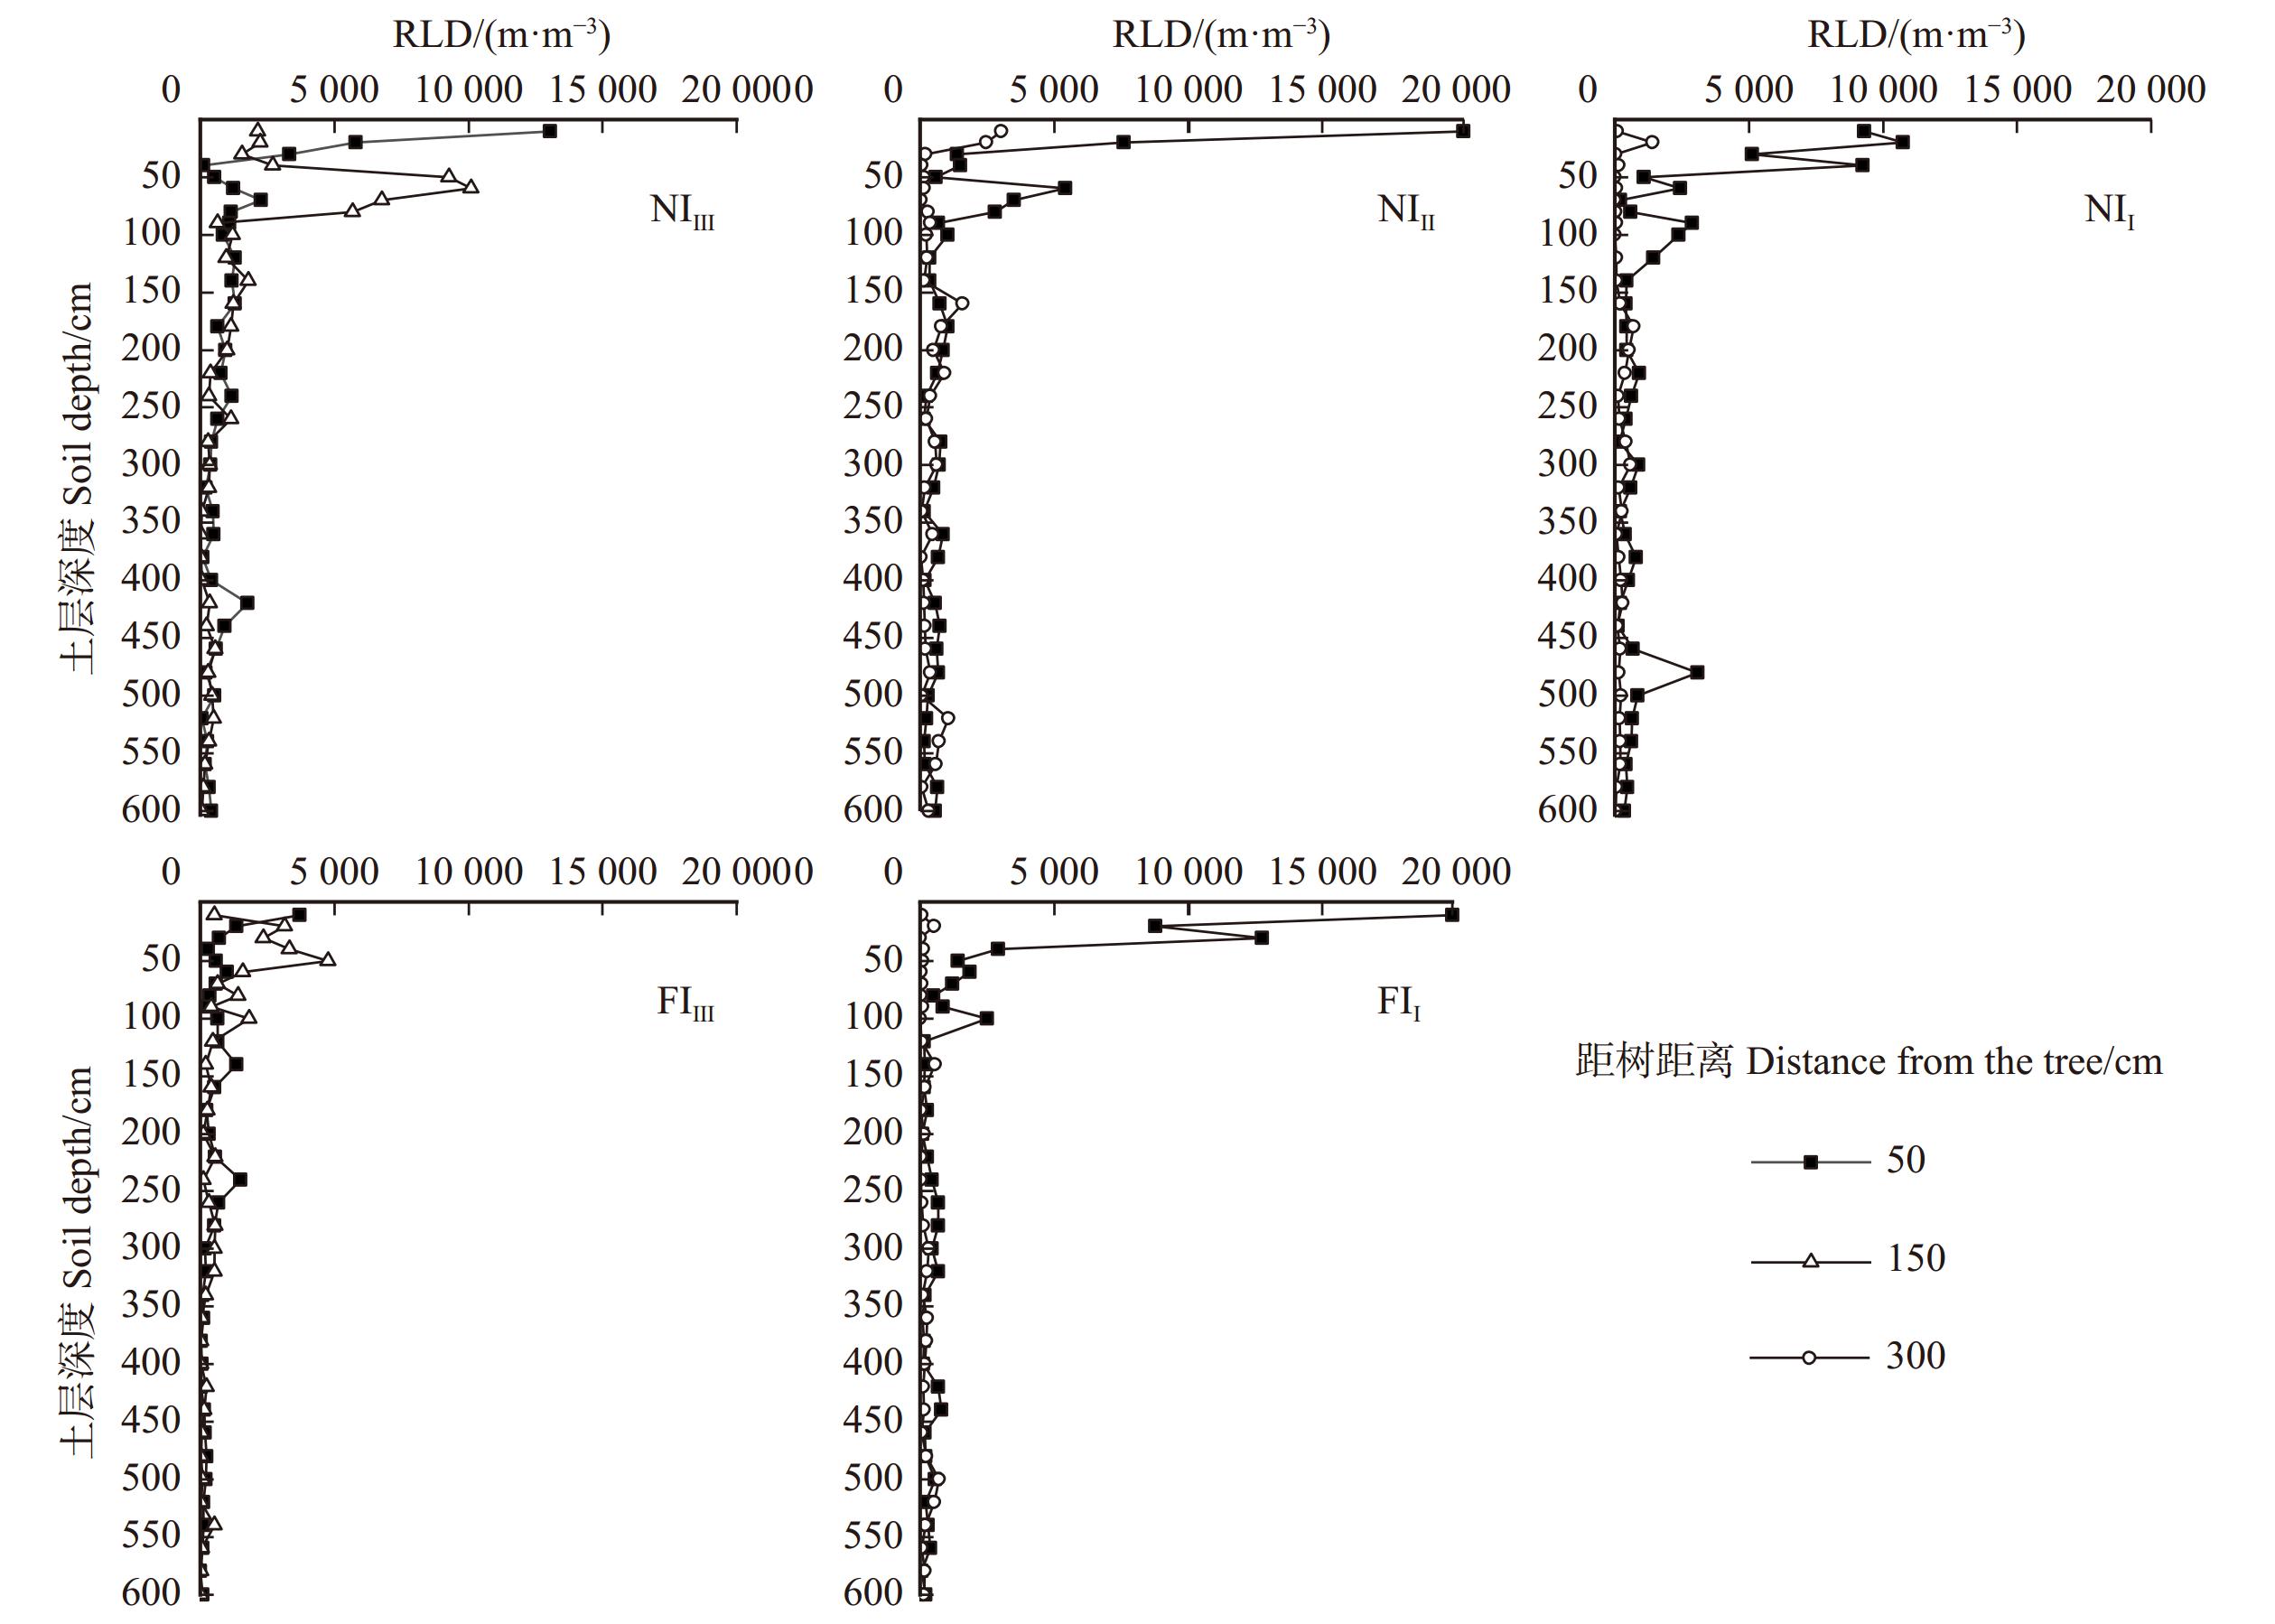
图 2 不同密度和水分管理下细根根长密度的二维空间分布
Figure 2. Two-dimensional spatial distribution of root length density (RLD) under different densities and water treatments
![]()
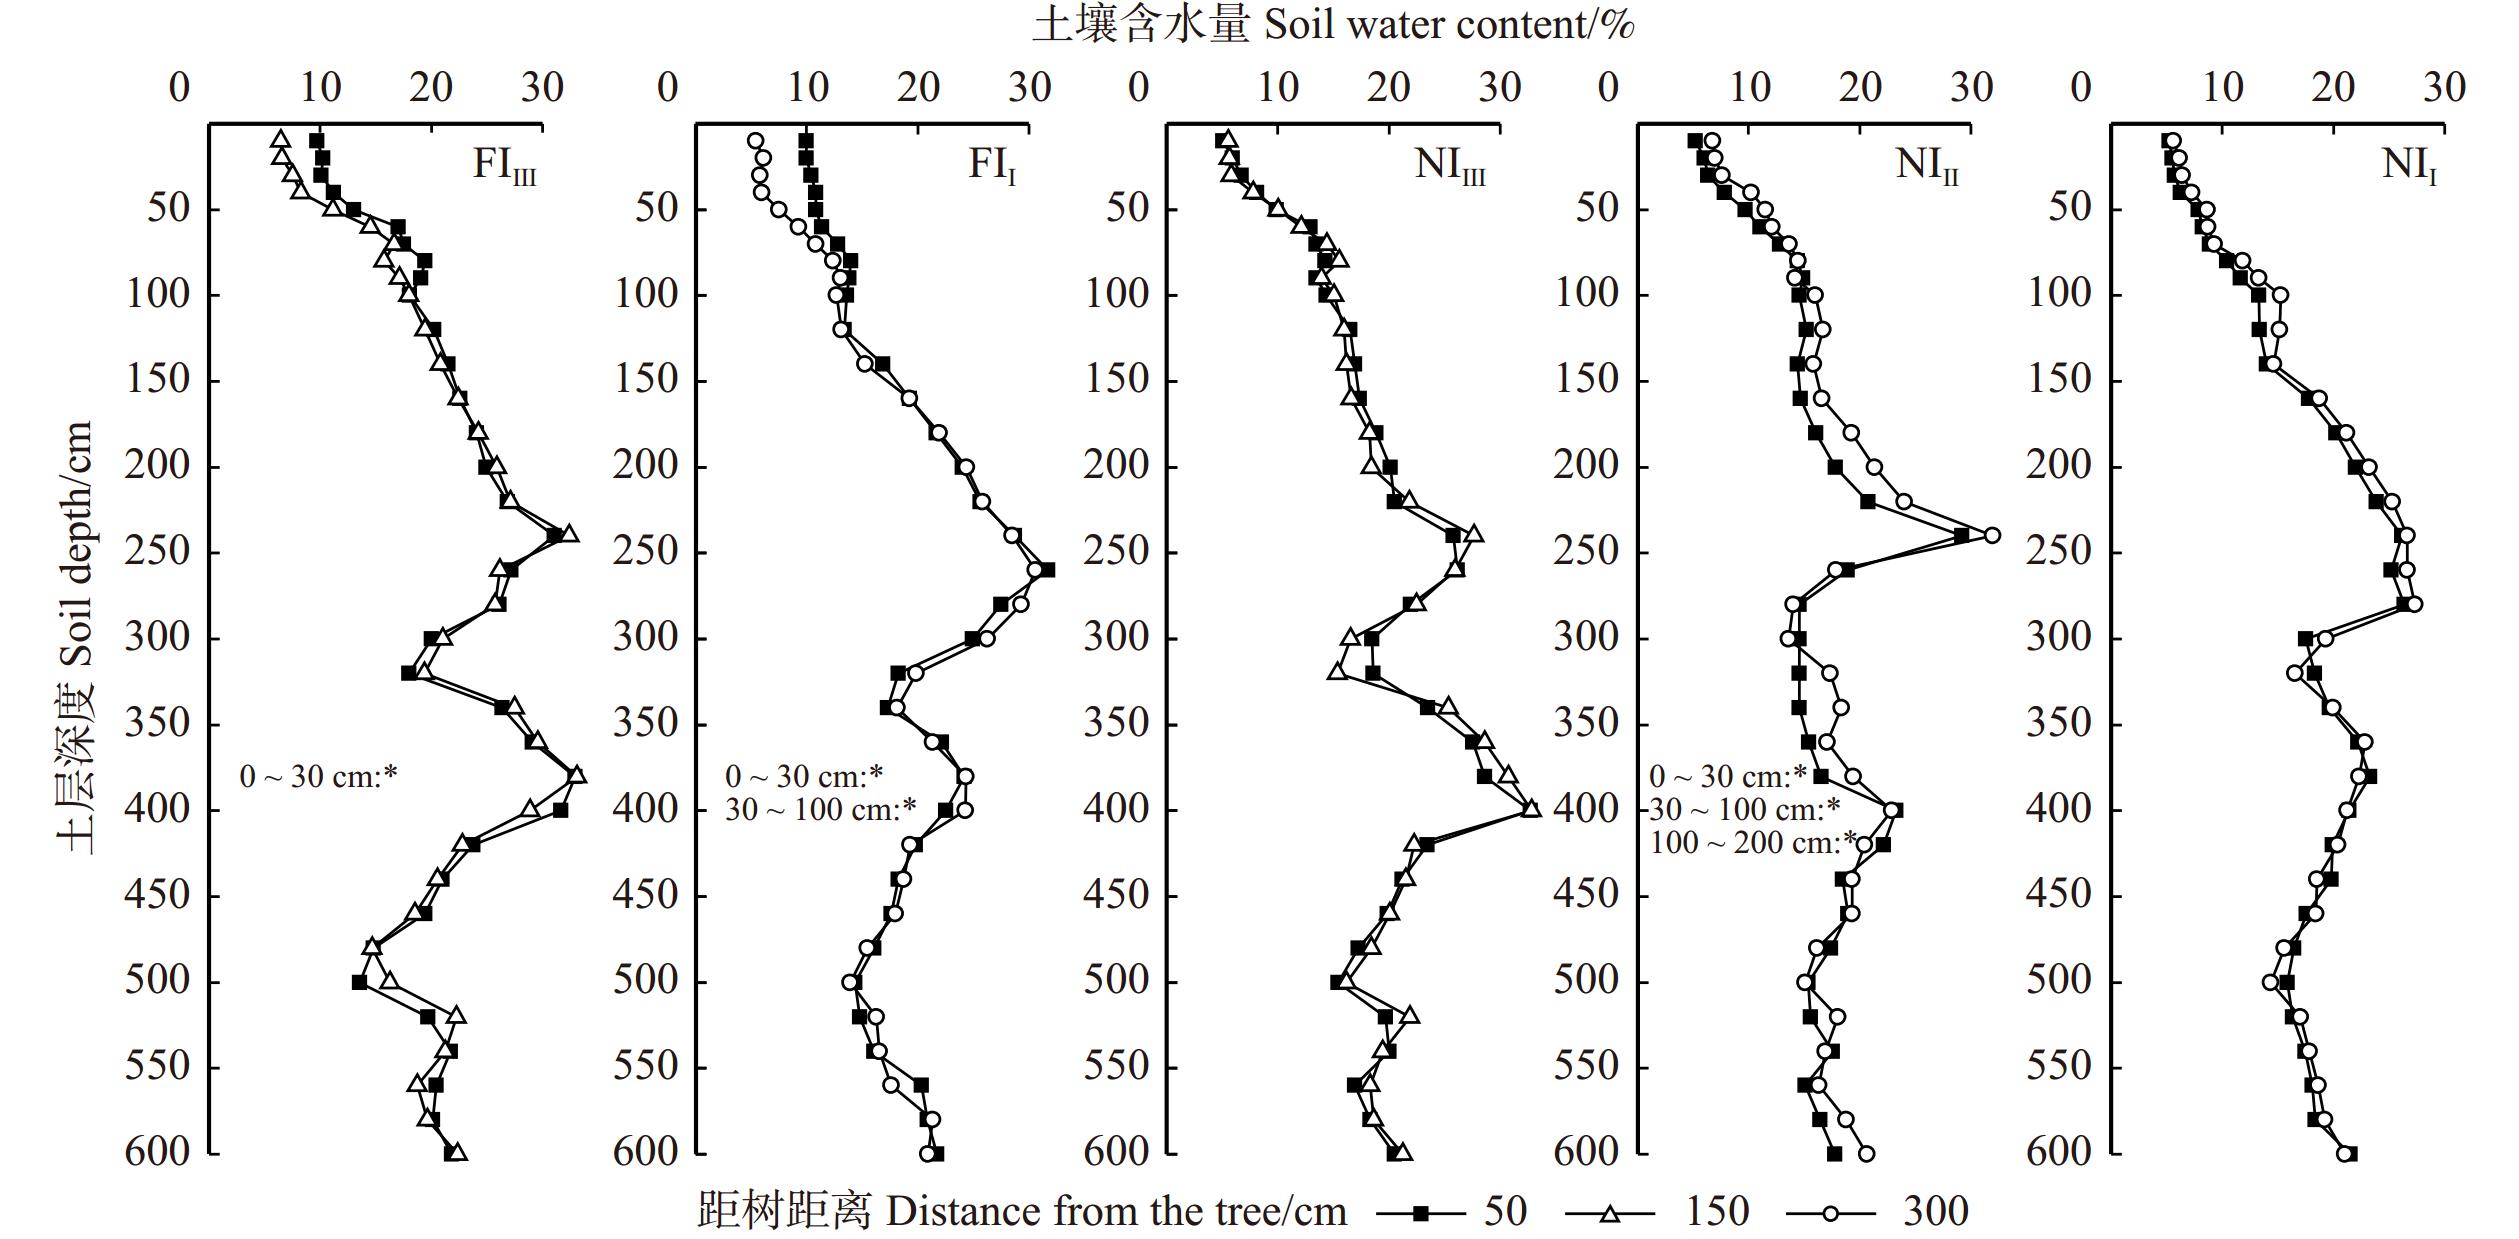
图 3 不同密度和水分管理下土壤含水量的二维空间分布
*代表该土层深度不同水平距树距离处土壤含水量差异显著(P < 0.05)。* indicates significant differences (P < 0.05) in soil water content at different horizontal distances from tree base in the same soil layer.
Figure 3. Two dimensional spatial distribution of soil water content under different densities and water treatments
![]()
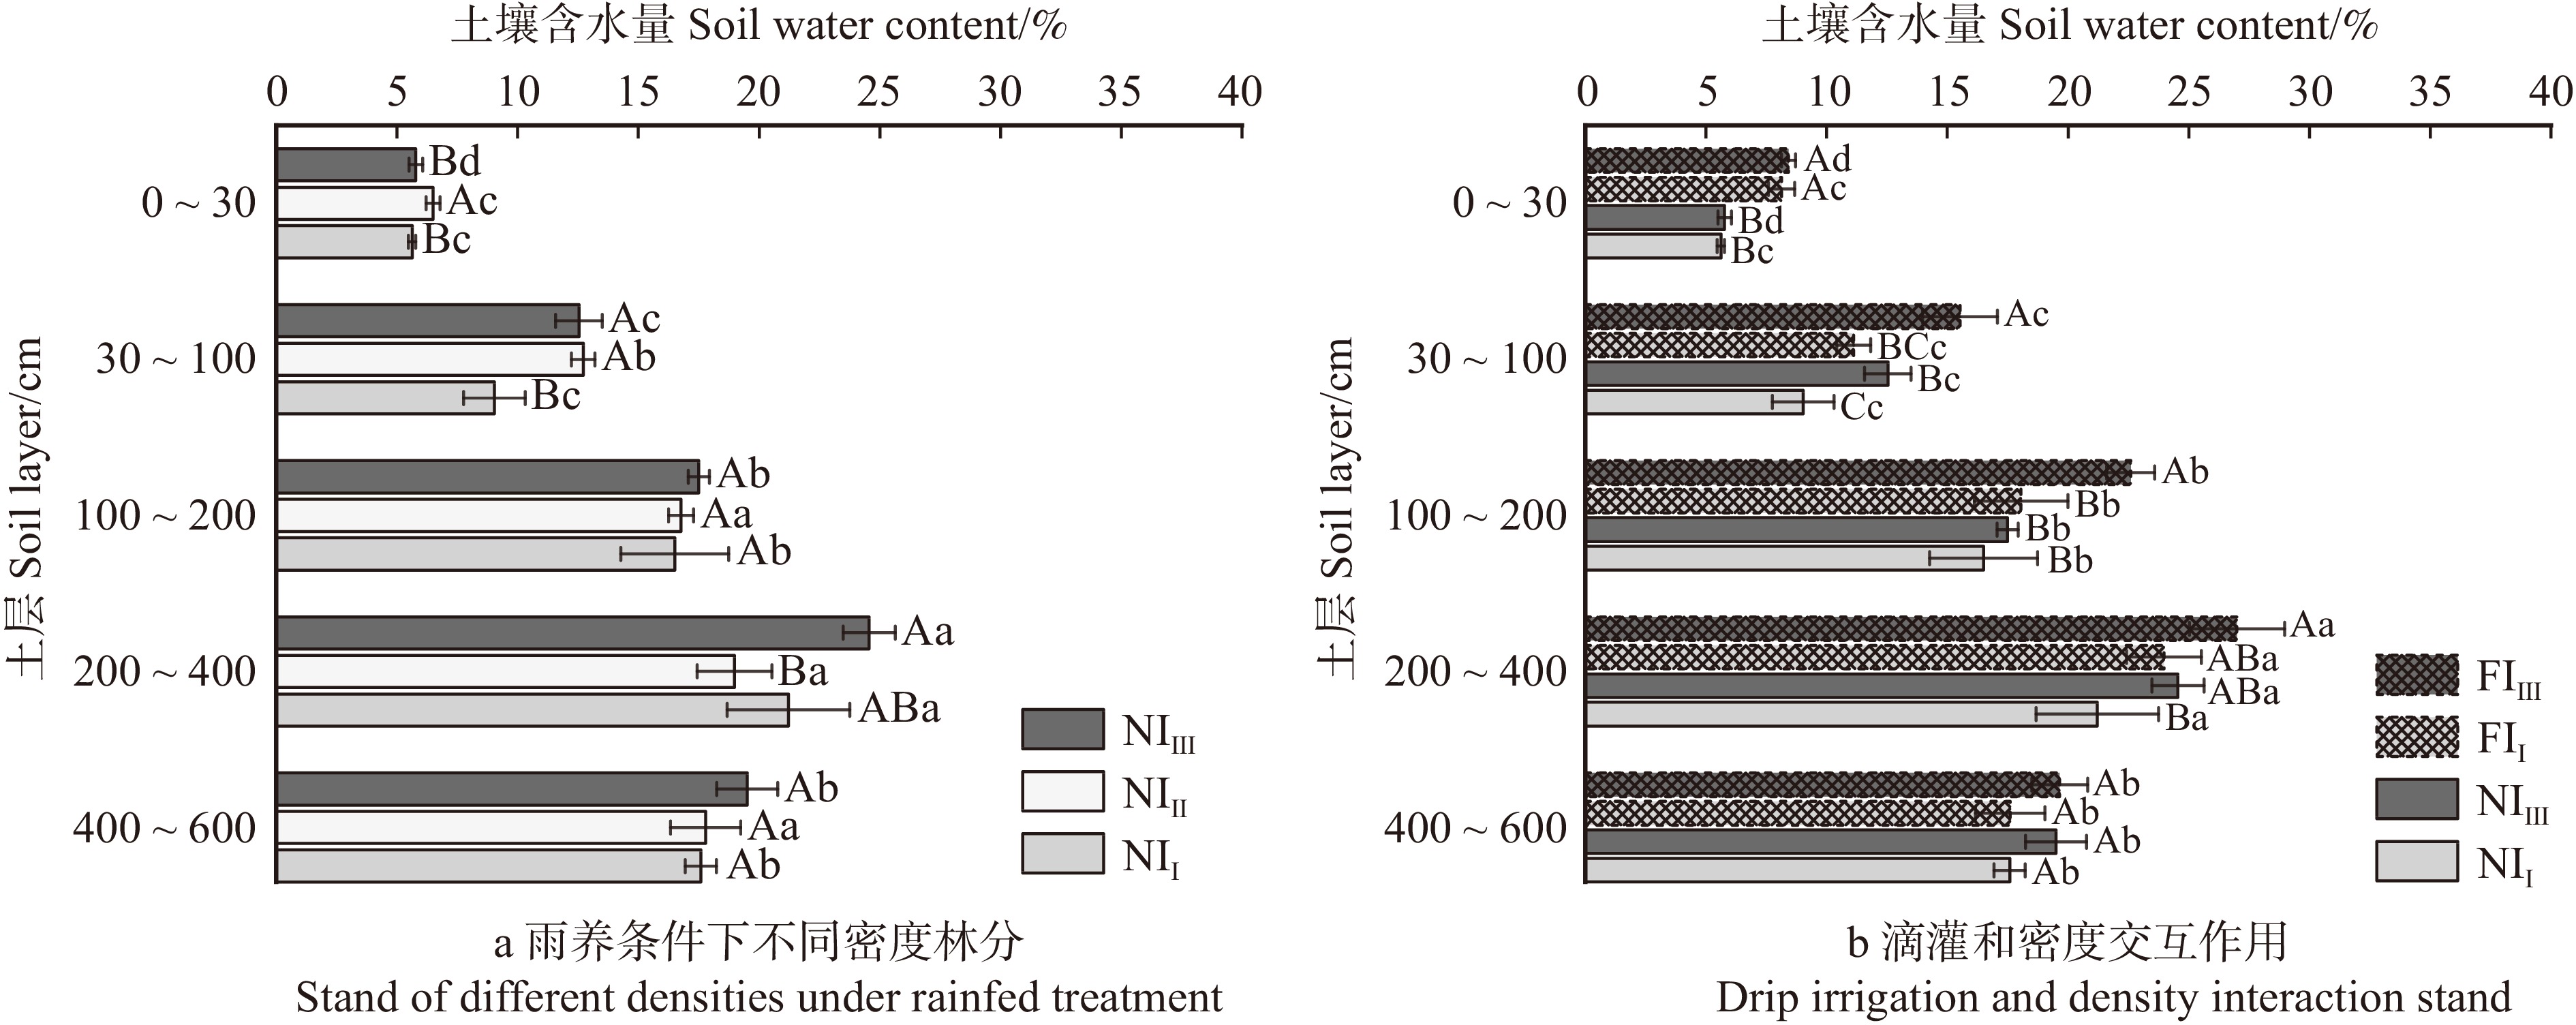
图 4 不同密度和水分管理中各土层的平均土壤含水量
不同小写字母代表不同土层SWC差异显著(P < 0.05),不同大写字母代表不同处理SWC差异显著(P < 0.05)。Different lowercase letters indicate significant differences in SWC among soil layers(P < 0.05), and uppercase letters indicate significant differences in SWC among treatments (P < 0.05).
Figure 4. Average soil water content in each soil layer under different densities and water treatments
![]()
图 5 2021年5—10月不同密度和水分管理各土层土壤含水量时间动态变化
Figure 5. Temporal dynamics of soil water content in each soil layer under different densities and water treatments from May to October in 2021
![]()
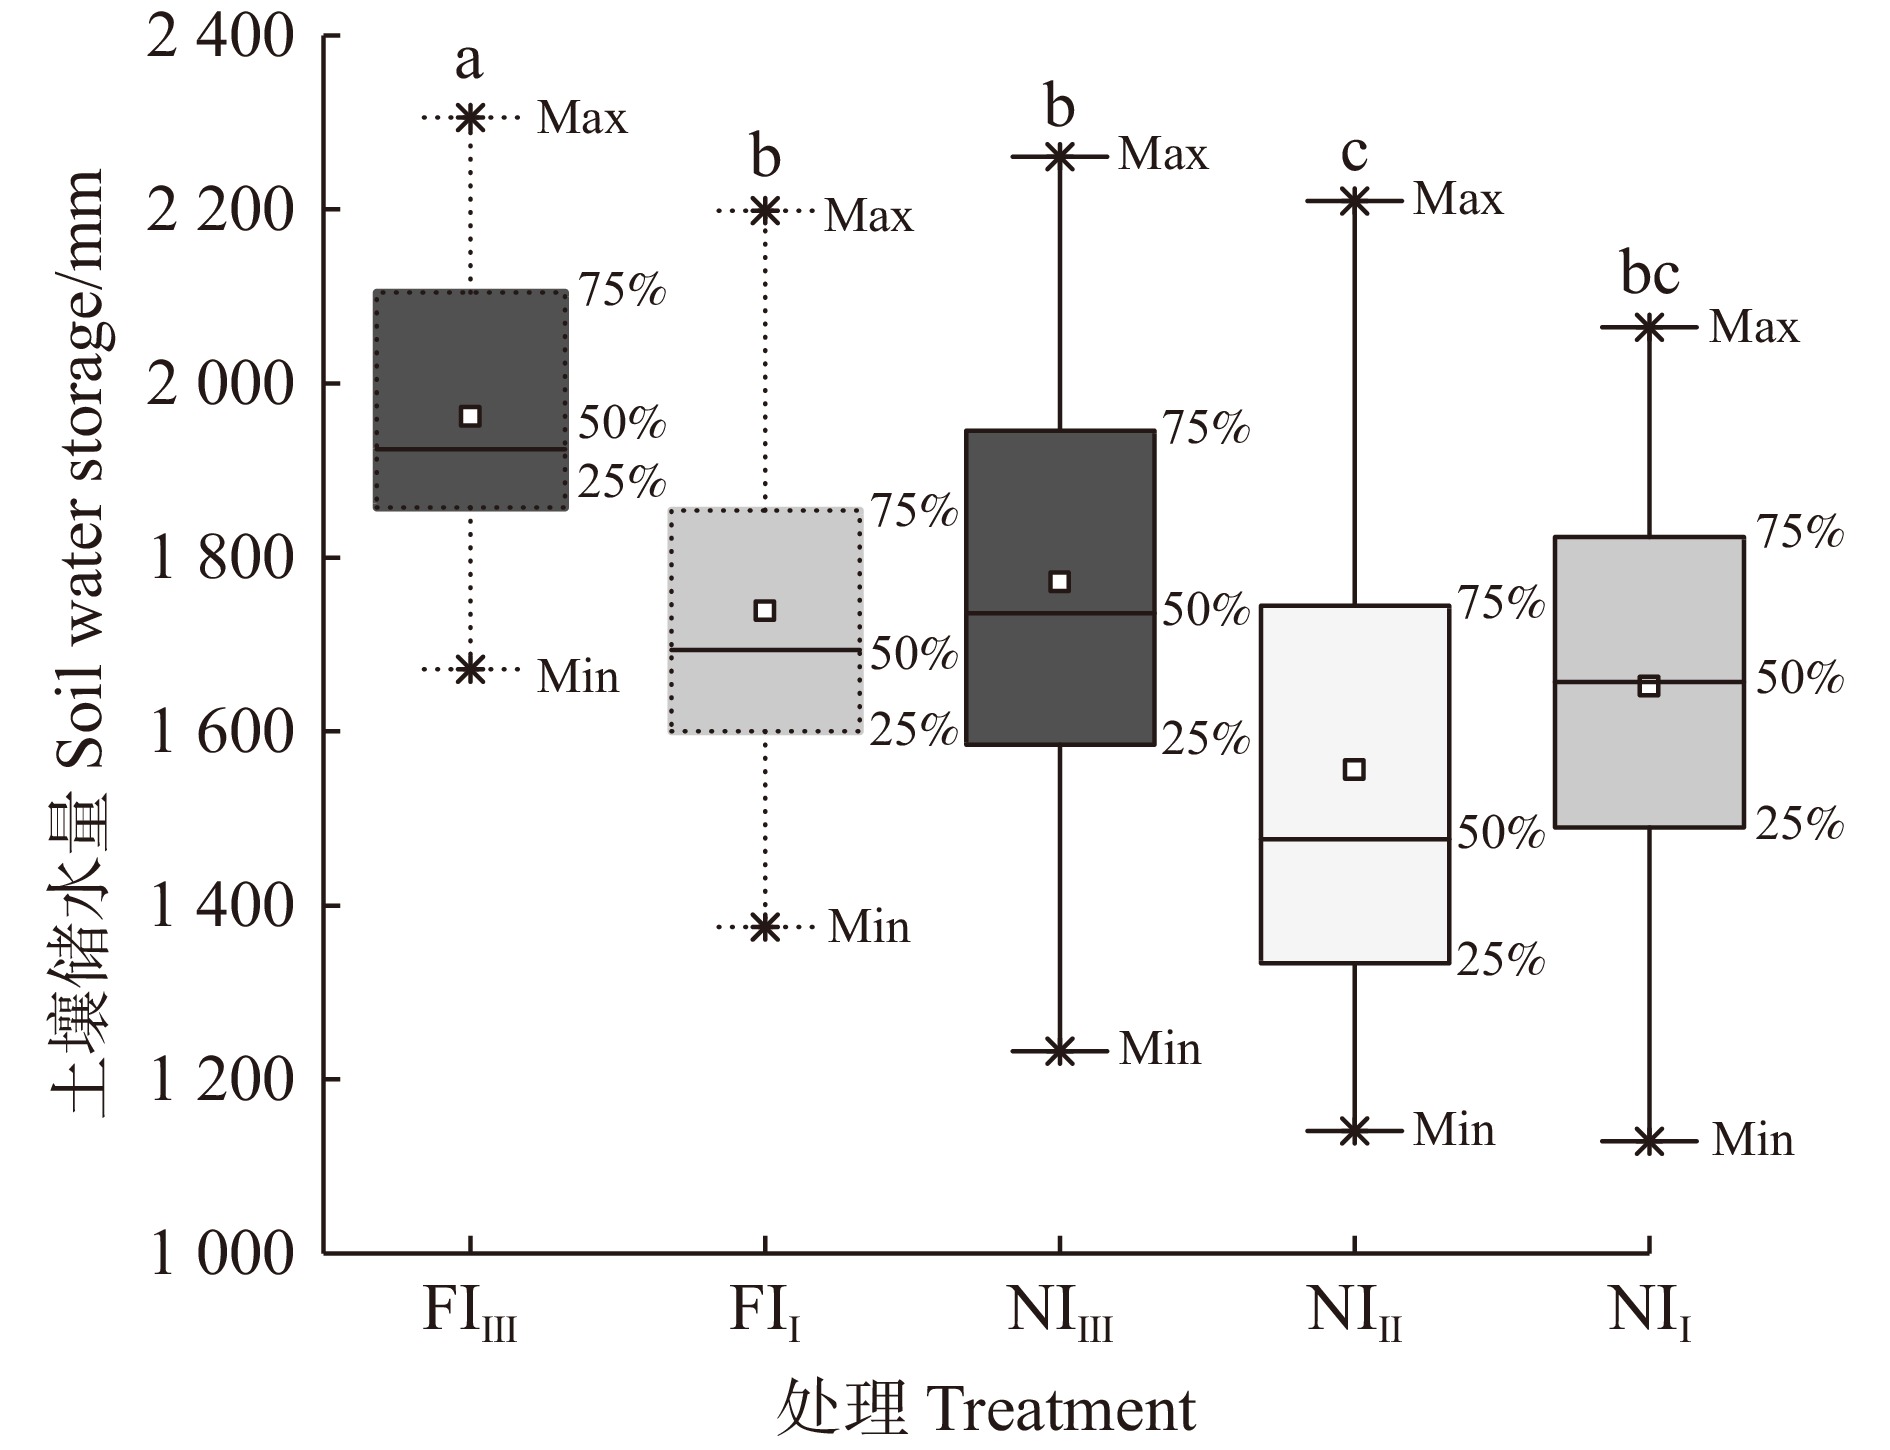
图 6 不同密度和水分管理土壤储水量
不同小写字母代表不同处理土壤储水量差异显著(P < 0.05)。Different lowercase letters indicate significant differences in soil water storage among treatments (P < 0.05).
Figure 6. Soil water storage under different densities and water treatments
![]()
图 7 2021年5—10月不同密度和水分管理下土壤储水量变化量
土层深度0 ~ 6 m每20 cm采集一组数据。Data were collected every 20 cm at soil 0 to 6 m depth.
Figure 7. Variations of soil water storage variation under different densities and water treatments from May to October in 2021
![]()
图 8 不同密度和水分管理下不同土层深度内土壤干层现象
Figure 8. Phenomenon of dry soil layer (DSL) in different soil depths under different densities and water treatments
表 1 2021年不同密度和水分处理林分基本情况
Table 1 Basic information of stands under different densities and water treatments in 2021
处理
Treatment平均胸径
Average DBH/cm平均树高
Average tree height/m林分蓄积量/(m3·hm−2)
Stand volume /(m3·ha−1)林地生产力/(m3·hm−2·a−1)
Forest land productivity /(m3·ha−1·year−1)FIⅢ 14.57 ± 0.55ab 15.65 ± 0.44a 119.1 ± 11.12a 36.61 ± 3.60a FIⅠ 15.49 ± 0.50a 12.55 ± 0.15b 15.28 ± 1.15b 6.94 ± 0.30c NIⅢ 12.92 ± 0.87b 15.33 ± 0.40a 92.32 ± 13.25b 25.58 ± 4.64b NIⅡ 14.79 ± 0.81ab 14.78 ± 0.79a 58.74 ± 8.10c 21.20 ± 4.12b NIⅠ 14.48 ± 0.74ab 12.47 ± 1.04b 13.38 ± 2.21c 5.76 ± 1.30c 注:NI.雨养;FI.滴灌。不同小写字母表示同列不同处理间差异显著(P < 0.05)。Notes: NI, rainfed; FI, drip irrigation. Different lowercase letters in the same column indicate significant differences among different treatments (P < 0.05).  下载: 导出CSV
表 2 试验地的土壤物理性质
Table 2 Soil physical characteristic of the experimental site
土层
Soil layer/cm颗粒组成 Soil particle size distribution/% 质地
Soil texture土壤密度
Bulk density/(g·cm−3)砂粒 Sand 粉粒 Silt 黏粒 Clay 0 ~ 40 51.96 42.18 5.85 砂壤土 Sand loam 1.37 40 ~ 460 24.27 67.90 7.83 粉壤土 Silt loam 1.49 460 ~ 600 56.82 37.75 5.43 砂壤土 Sand loam 1.63
下载: 导出CSV
表 3 不同密度和水分管理下各土层的平均细根根长密度
Table 3 Average RLD in each soil layer under different densities and water treatments
m/m3 处理 Treatment 土层 Soil layer/cm 0 ~ 30 30 ~ 100 100 ~ 200 200 ~ 400 400 ~ 600 FIⅢ 1 971.67 ± 456.97Aa 1 264.15 ± 447.82Aab 451.71 ± 176.84Bb 346.52 ± 118.01Ab 121.12 ± 16.11Ab FIⅠ 6 997.50 ± 866.28Aa 836.25 ± 165.36Ab 171.17 ± 46.57Bb 270.52 ± 26.22Ab 298.40 ± 70.30Ab NIⅢ 4 686.82 ± 331.50Aa 3 119.27 ± 2 065.69Aa 1 223.86 ± 94.34Aa 404.95 ± 47.77Aa 415.24 ± 45.14Aa NIⅡ 5 828.61 ± 723.29Aa 1 199.00 ± 199.47Ab 673.68 ± 51.98ABb 422.52 ± 75.87Ab 410.43 ± 93.22Ab NIⅠ 4 452.10 ± 3 850.95Aa 1 365.34 ± 580.03Aa 473.06 ± 191.01Ba 398.97 ± 124.32Aa 188.02 ± 17.11Aa 注:不同大写字母表示同列不同处理间差异显著(P < 0.05),不同小写字母表示同行不同土层间差异显著(P < 0.05)。Notes: different uppercase letters in the same column indicate significant differences among different treatments (P < 0.05), and different lowercase letters in the same row indicate significant differences among varied soil layers (P < 0.05).
下载: 导出CSV
-
[1] Wilske B, Lu N, Wei L, et al. Poplar plantation has the potential to alter the water balance in semiarid Inner Mongolia[J]. Journal of Environmental Management, 2009, 90(8): 2762−2770.
[2] Wang Y, Yang J, Chen Y, et al. The spatiotemporal response of soil moisture to precipitation and temperature changes in an arid region, China[J/OL]. Remote Sensing, 2018, 10(3): 468[2023−12−08]. https://www.mdpi.com/2072-4292/10/3/468.
[3] Zhang C, Wang Y, Jia X, et al. Variations in capacity and storage of plant-available water in deep profiles along a revegetation and precipitation gradient[J/OL]. Journal of Hydrology, 2020, 581: 124401[2023−12−08]. https://www.sciencedirect.com/science/article/abs/pii/S0022169419311369.
[4] Zhang P, Jeong J H, Yoon J H, et al. Abrupt shift to hotter and drier climate over inner East Asia beyond the tipping point[J]. Science, 2020, 370: 1095−1099. doi: 10.1126/science.abb3368
[5] Qiao L, Zuo Z, Xiao D, et al. Detection, attribution, and future response of global soil moisture in summer[J/OL]. Frontiers in Earth Science, 2021, 9: 745185[2023−12−08]. https://www.frontiersin.org/articles/10.3389/feart.2021.745185/full.
[6] Anderegg L D L, Anderegg W R L, Abatzoglou J, et al. Drought characteristics role in widespread aspen forest mortality across Colorado, USA[J]. Global Change Biology, 2013, 19(5): 1526−1537. doi: 10.1111/gcb.12146
[7] Yang F, Feng Z, Wang H, et al. Deep soil water extraction helps to drought avoidance but shallow soil water uptake during dry season controls the inter-annual variation in tree growth in four subtropical plantations[J]. Agricultural and Forest Meteorology, 2017, 234−235: 106−114. doi: 10.1016/j.agrformet.2016.12.020
[8] Jian S, Zhao C, Fang S, et al. Effects of different vegetation restoration on soil water storage and water balance in the Chinese Loess Plateau[J]. Agricultural and Forest Meteorology, 2015, 206: 85−96. doi: 10.1016/j.agrformet.2015.03.009
[9] Di N, Xi B, Clothier B, et al. Diurnal and nocturnal transpiration behaviors and their responses to groundwater-table fluctuations and meteorological factors of Populus tomentosa in the North China Plain[J]. Forest Ecology and Management, 2019, 448: 445−456. doi: 10.1016/j.foreco.2019.06.009
[10] Yu B, Liu G, Liu Q, et al. Seasonal variation of deep soil moisture under different land uses on the semi-arid Loess Plateau of China[J]. Journal of Soils and Sediments, 2019, 19(3): 1179−1189. doi: 10.1007/s11368-018-2119-8
[11] 邱德勋, 赵佰礼, 尹殿胜, 等. 黄土丘陵沟壑区土壤水分垂直变异及影响因素[J]. 中国水土保持科学(中英文), 2021, 19(3): 72−80. Qiu D X, Zhao B L, Yin D S, et al. Vertical variation of soil moisture in the loess hilly and gully region and its influence factors[J]. Science of Soil and Water Conservation, 2021, 19(3): 72−80.
[12] Gao Z, Hu X, Li X. Changes in soil water retention and content during shrub encroachment process in Inner Mongolia, northern China[J/OL]. Catena, 2021, 206: 105528[2023−12−08]. https://www.sciencedirect.com/science/article/abs/pii/S0341816221003866.
[13] 孔凌霄, 毕华兴, 周巧稚, 等. 晋西黄土区不同立地刺槐林土壤水分动态特征[J]. 水土保持学报, 2018, 32(5): 163−169. Kong L X, Bi H X, Zhou Q Z, et al. Dynamics of soil moisture in different stand sites of Robinia pseudoacacia forestland in loess region of western Shanxi Province[J]. Journal of Soil and Water Conservation, 2018, 32(5): 163−169.
[14] Liang H, Xue Y, Shi J, et al. Soil moisture dynamics under Caragana korshinskii shrubs of different ages in Wuzhai County on the Loess Plateau, China[J]. Earth and Environmental Science Transactions of the Royal Society of Edinburgh, 2018, 109(3−4): 387−396. doi: 10.1017/S1755691018000622
[15] Andrews C M, D’Amato A W, Fraver S, et al. Low stand density moderates growth declines during hot droughts in semi-arid forests[J]. Journal of Applied Ecology, 2020, 57(6): 1089−1102. doi: 10.1111/1365-2664.13615
[16] Liu J, Li D, Fernández J, et al. Variations in water-balance components and carbon stocks in poplar plantations with differing water inputs over a whole rotation: implications for sustainable forest management under climate change[J/OL]. Agricultural and Forest Meteorology, 2022, 320: 108958[2023−12−08]. https://www.sciencedirect.com/science/article/abs/pii/S0168192322001484.
[17] 张建龙. 中国森林资源报告[M]. 北京: 中国林业出版社, 2019. Zhang J L. National forestry and grassland administration[M]. Beijing: China Forestry Publishing House, 2019.
[18] 郭彪, 王尚义, 牛俊杰, 等. 晋西北不同植被类型土壤水分时空变化特征[J]. 水土保持通报, 2015, 35(1): 267−273. Guo B, Wang S Y, Niu J J, et al. Characteristics of soil moisture variation under different vegetation types in northwestern shanxi province[J]. Bulletin of Soil and Water Conservation, 2015, 35(1): 267−273.
[19] 朱炜歆, 牛俊杰, 刘庚, 等. 植被类型对生长季黄土区土壤含水量的影响[J]. 干旱区资源与环境, 2016, 30(1): 152−156. Zhu W X, Niu J J, Liu G, et al. The influence of vegetation types on the soil moistures during growing seasons in loess area[J]. Journal of Arid Land Resources and Environment, 2016, 30(1): 152−156.
[20] Wang Y, Shao M A, Zhu Y, et al. Impacts of land use and plant characteristics on dried soil layers in different climatic regions on the Loess Plateau of China[J]. Agricultural and Forest Meteorology, 2011, 151(4): 437−448. doi: 10.1016/j.agrformet.2010.11.016
[21] Shao M, Wang Y, Xia Y, et al. Soil drought and water carrying capacity for vegetation in the critical zone of the Loess Plateau: a review[J/OL]. Vadose Zone Journal, 2018, 17: 170077[2022−02−12]. https://doi.org/10.2136/vzj2017.04.0077.
[22] Ji Y, Zhou G, Li Z, et al. Triggers of widespread dieback and mortality of poplar (Populus spp.) plantations across northern China[J/OL]. Journal of Arid Environments, 2020, 174: 104076[2023−12−08]. https://www.sciencedirect.com/science/article/abs/pii/S0140196319301466.
[23] Liu Z, Jia G, Yu X, et al. Morphological trait as a determining factor for Populus simonii Carr. to survive from drought in semi-arid region[J/OL]. Agricultural Water Management, 2021, 253: 106943[2023−12−08]. https://www.sciencedirect.com/science/article/abs/pii/S0378377421002080.
[24] Jia G, Chen L, Yu X, et al. Soil water stress overrides the benefit of water-use efficiency from rising CO2 and temperature in a cold semi-arid poplar plantation[J]. Plant, Cell & Environment, 2022, 45(4): 1172−1186.
[25] 邹松言, 李豆豆, 汪金松, 等. 毛白杨幼林细根对梯度土壤水分的响应[J]. 林业科学, 2019, 55(10): 124−137. Zou S Y, Li D D, Wang J S, et al. Response of fine roots to soil moisture of different gradients in young Populus tomentosa plantation[J]. Scientia Silvae Sinicae, 2019, 55(10): 124−137.
[26] 祝维, 周欧, 孙一鸣, 等. 混交林内毛白杨和刺槐根系吸水的动态生态位划分[J]. 植物生态学报, 2023, 47(3): 389−403. doi: 10.17521/cjpe.2022.0197 Zhu W, Zhou O, Sun Y M, et al. Dynamic niche partitioning in root water uptake of Populus tomentosa and Robinia pseudoacacia in mixed forest[J]. Chinese Journal of Plant Ecology, 2023, 47(3): 389−403. doi: 10.17521/cjpe.2022.0197
[27] Hillel D. Introduction to environmental soil physic [M]. San Diego: Elsevier Academic Press, 2004.
[28] Pierret A, Maeght J, Clément C, et al. Understanding deep roots and their functions in ecosystems: an advocacy for more unconventional research.[J]. Annals of Botany, 2016, 118(4): 621−635. doi: 10.1093/aob/mcw130
[29] Maeght J, Rewald B, Pierret A. How to study deep roots-and why it matters[J/OL]. Frontiers in Plant Science, 2013, 4: 299[2023−12−08]. https://www.frontiersin.org/articles/10.3389/fpls.2013.00299/full.
[30] 席本野. 杨树根系形态、分布、动态特征及其吸水特性[J]. 北京林业大学学报, 2019, 41(12): 37−49. Xi B Y. Morphology, distribution, dynamic characteristics of poplar roots and its water uptake habits[J]. Journal of Beijing Forestry University, 2019, 41(12): 37−49.
[31] 贺曰林. 毛白杨S86人工林根区滴灌施肥及水氮调控机制研究[D]. 北京: 北京林业大学, 2021. He Y L. Research on the drip irrigation-nitrogen fertigation and mechanism of water-nitrogen regulation in root zone for Populus tomentosa S86 plantation[D]. Beijing: Beijing Forestry University, 2021.
[32] 陈洪松, 邵明安, 王克林. 黄土区荒草地和裸地土壤水分的循环特征[J]. 应用生态学报, 2005, 16(10): 1853−1857. Chen H S, Shao M A, Wang K L. Water cycling characteristics of grassland and bare land soils on Loess Plateau[J]. Chinese Journal of Applied Ecology, 2005, 16(10): 1853−1857.
[33] Postma J A, Hecht V L, Hikosaka K, et al. Dividing the pie: a quantitative review on plant density responses[J]. Plant, Cell & Environment, 2020, 44(4): 1072−1094.
[34] Wang D, Wang L. Soil water dynamics in apple orchards of different ages on the Loess Plateau of China[J/OL]. Vadose Zone Journal, 2018, 17:180049[2022−02−12]. https://doi.org/10.2136/vzj2018.03.0049.
[35] Nan W, Ta F, Meng X, et al. Effects of age and density of Pinus sylvestris var. mongolica on soil moisture in the semiarid Mu Us Dunefield, northern China[J/OL]. Forest Ecology and Management, 2020, 473: 118313[2023−12−08]. https://www.sciencedirect.com/science/article/abs/pii/S0378112720310823.
[36] Nan W, Liu S, Yang S, et al. Changes of Sabina vulgaris growth and of soil moisture in natural stands and plantations in semi-arid northern China[J/OL]. Global Ecology and Conservation, 2020, 21: e859[2023−12−08]. https://www.sciencedirect.com/science/article/pii/S2351989419304299.
[37] 杜满义, 封焕英, 裴顺祥, 等. 晋南不同密度油松人工林土壤水分的物理特性[J]. 东北林业大学学报, 2021, 49(9): 72−76. Du M Y, Feng H Y, Pei S X, et al. Soil hydro-physical properties in Pinus tabuliformis plantations with different stand densities in southern Shanxi[J]. Journal of Northeast Forestry University, 2021, 49(9): 72−76.
[38] Zou S, Li D, Di N, et al. Stand development modifies effects of soil water availability on poplar fine-root traits: evidence from a six-year experiment[J]. Plant and Soil, 2022, 480(1−2): 165−184. doi: 10.1007/s11104-022-05568-1
[39] Good S P, Noone D, Bowen G. Hydrologic connectivity constrains partitioning of global terrestrial water fluxes[J]. Science, 2015, 349: 175−177. doi: 10.1126/science.aaa5931
[40] Huang Z, Liu Y, Qiu K, et al. Soil-water deficit in deep soil layers results from the planted forest in a semi-arid sandy land: implications for sustainable agroforestry water management[J/OL]. Agricultural Water Management. 2021, 254: 106985[2023−12−08]. https://www.sciencedirect.com/science/article/abs/pii/S037837742100250X.
[41] 王利宝, 张志毅, 康向阳, 等. 造林密度对白杨杂种无性系初期生长性状的影响[J]. 北京林业大学学报, 2012, 34(5): 25−30. Wang L B, Zhang Z Y, Kang X Y, et al. Effects of planting density on the early growth traits of white poplar hybrid clones[J]. Journal of Beijing Forestry University, 2012, 34(5): 25−30.
[42] von Arx G, Pannatier E G, Thimonier A, et al. Microclimate in forests with varying leaf area index and soil moisture: potential implications for seedling establishment in a changing climate[J]. The Journal of Ecology, 2013, 101(5): 1201−1213. doi: 10.1111/1365-2745.12121
[43] Bayala J, Prieto I. Water acquisition, sharing and redistribution by roots: applications to agroforestry systems[J]. Plant and Soil, 2020, 453(1−2): 17−28.
[44] Hakamada R E, Hubbard R M, Moreira G G, et al. Influence of stand density on growth and water use efficiency in Eucalyptus clones[J/OL]. Forest Ecology and Management, 2020, 466: 118125[2023−12−08]. https://www.sciencedirect.com/science/article/abs/pii/S0378112720301109.
-
期刊类型引用(1)
1. 李凤春,宋大北,孟兆民,谭瑞虹,刘志君,张继敏,郭丽明,王文杰,焦志远. 油松轻基质网袋育苗技术集成. 现代农业研究. 2025(01): 98-102 .  百度学术
百度学术
其他类型引用(0)


计量
- 文章访问数: 441
- HTML全文浏览量: 57
- PDF下载量: 44
- 被引次数: 1
