
Remote sensing classification of stand type coupled with time series features
-
摘要:目的
结合多源遥感数据进行特征提取,获取最优分类策略并探究时间序列特征在林分类型识别中的重要性,为遥感林分类型识别提供技术途径。
方法结合Sentinel-2光谱特征和时间序列特征、Sentinel-1雷达后向散射特征和SRTM DEM地形特征在Google Earth Engine中进行各特征变量的提取,构建不同特征组合使用随机森林分类器进行分类并对不同分类结果进行制图输出和精度评价。
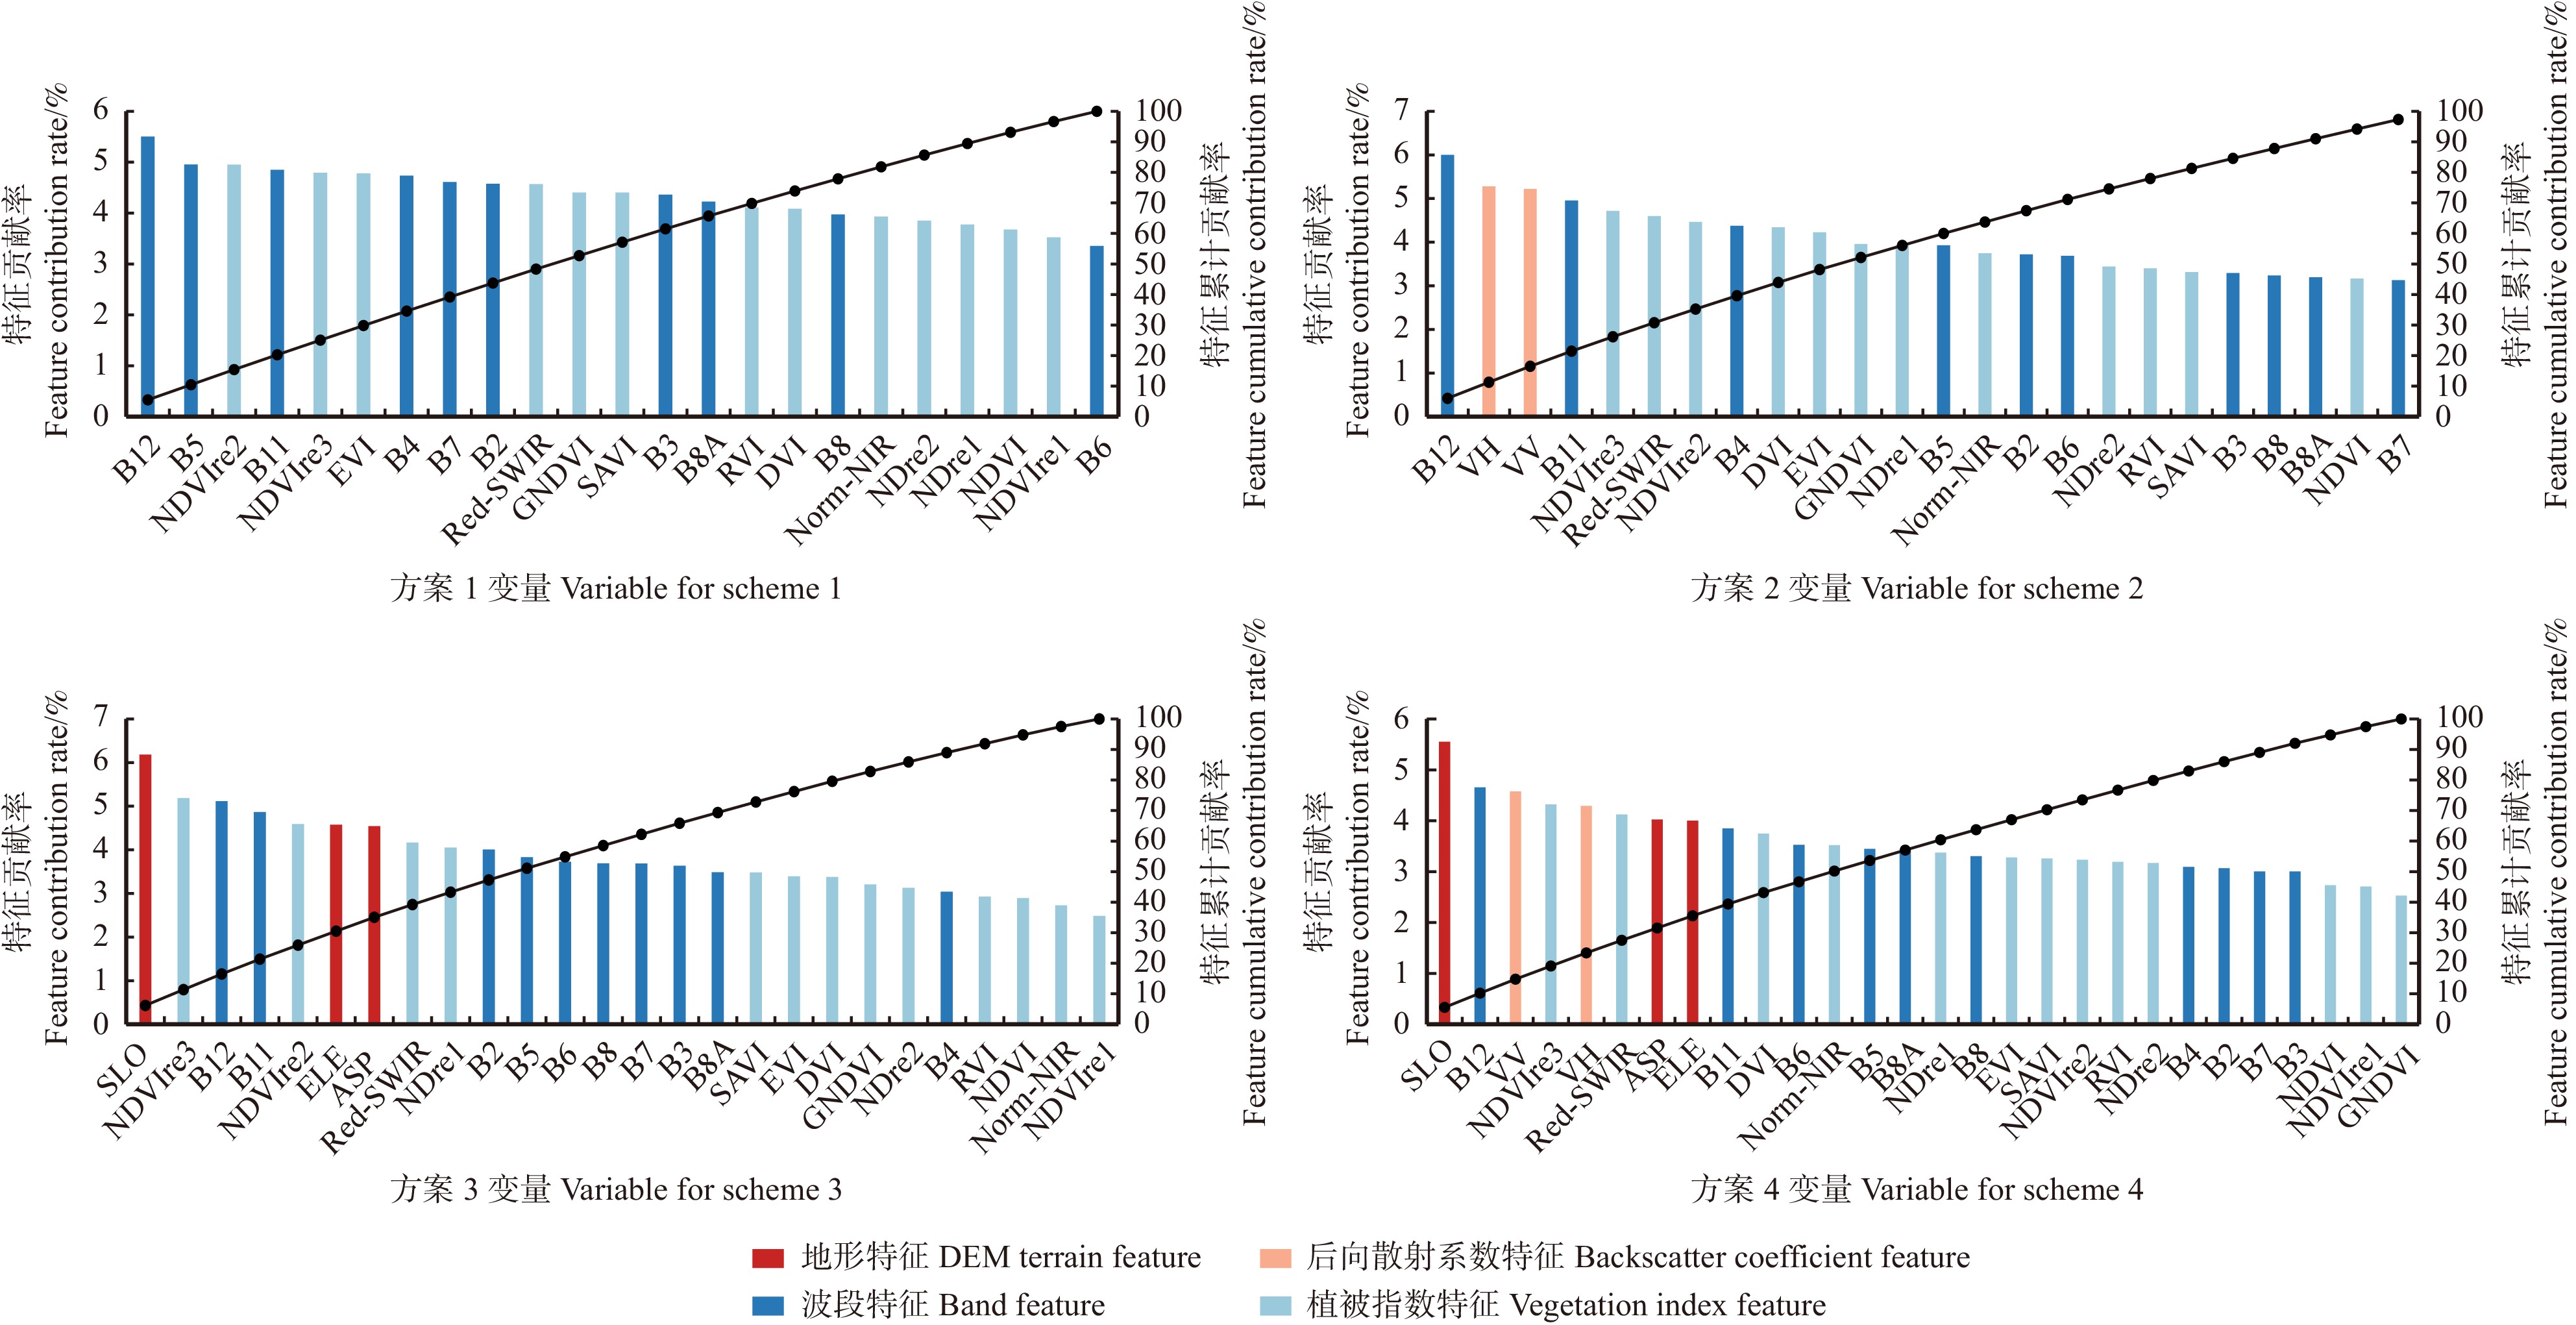
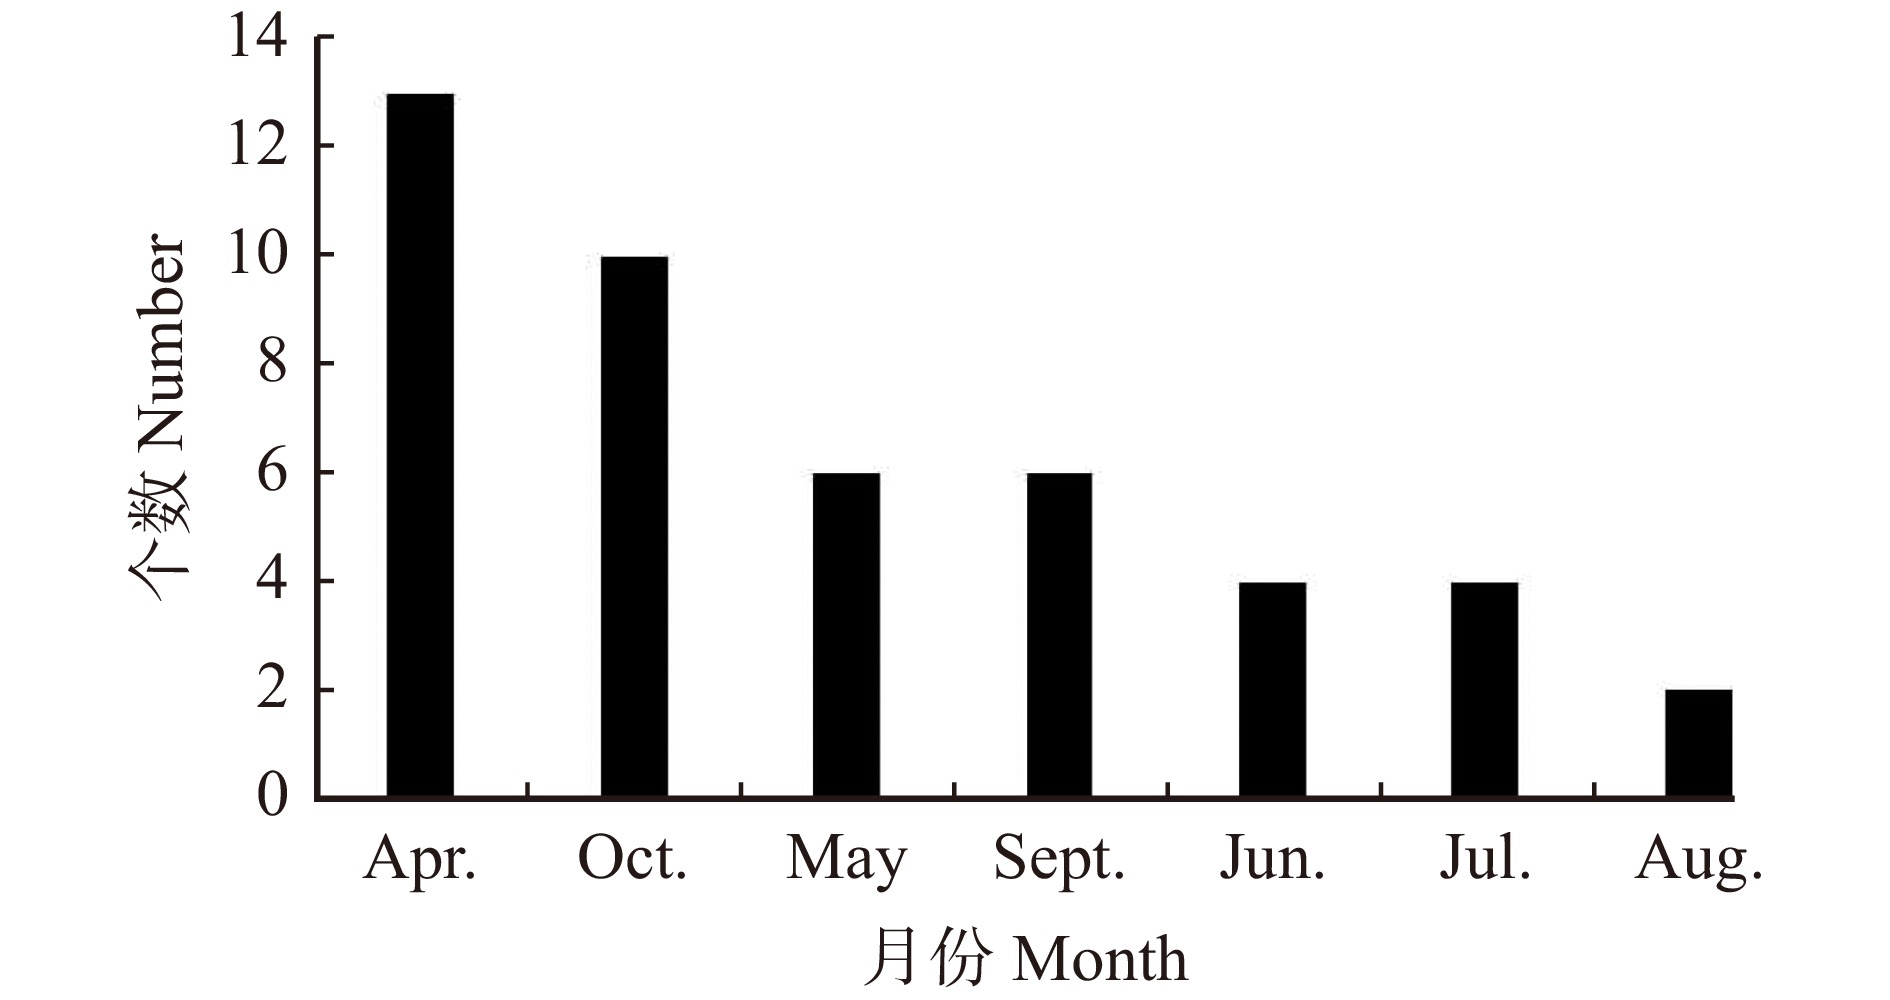
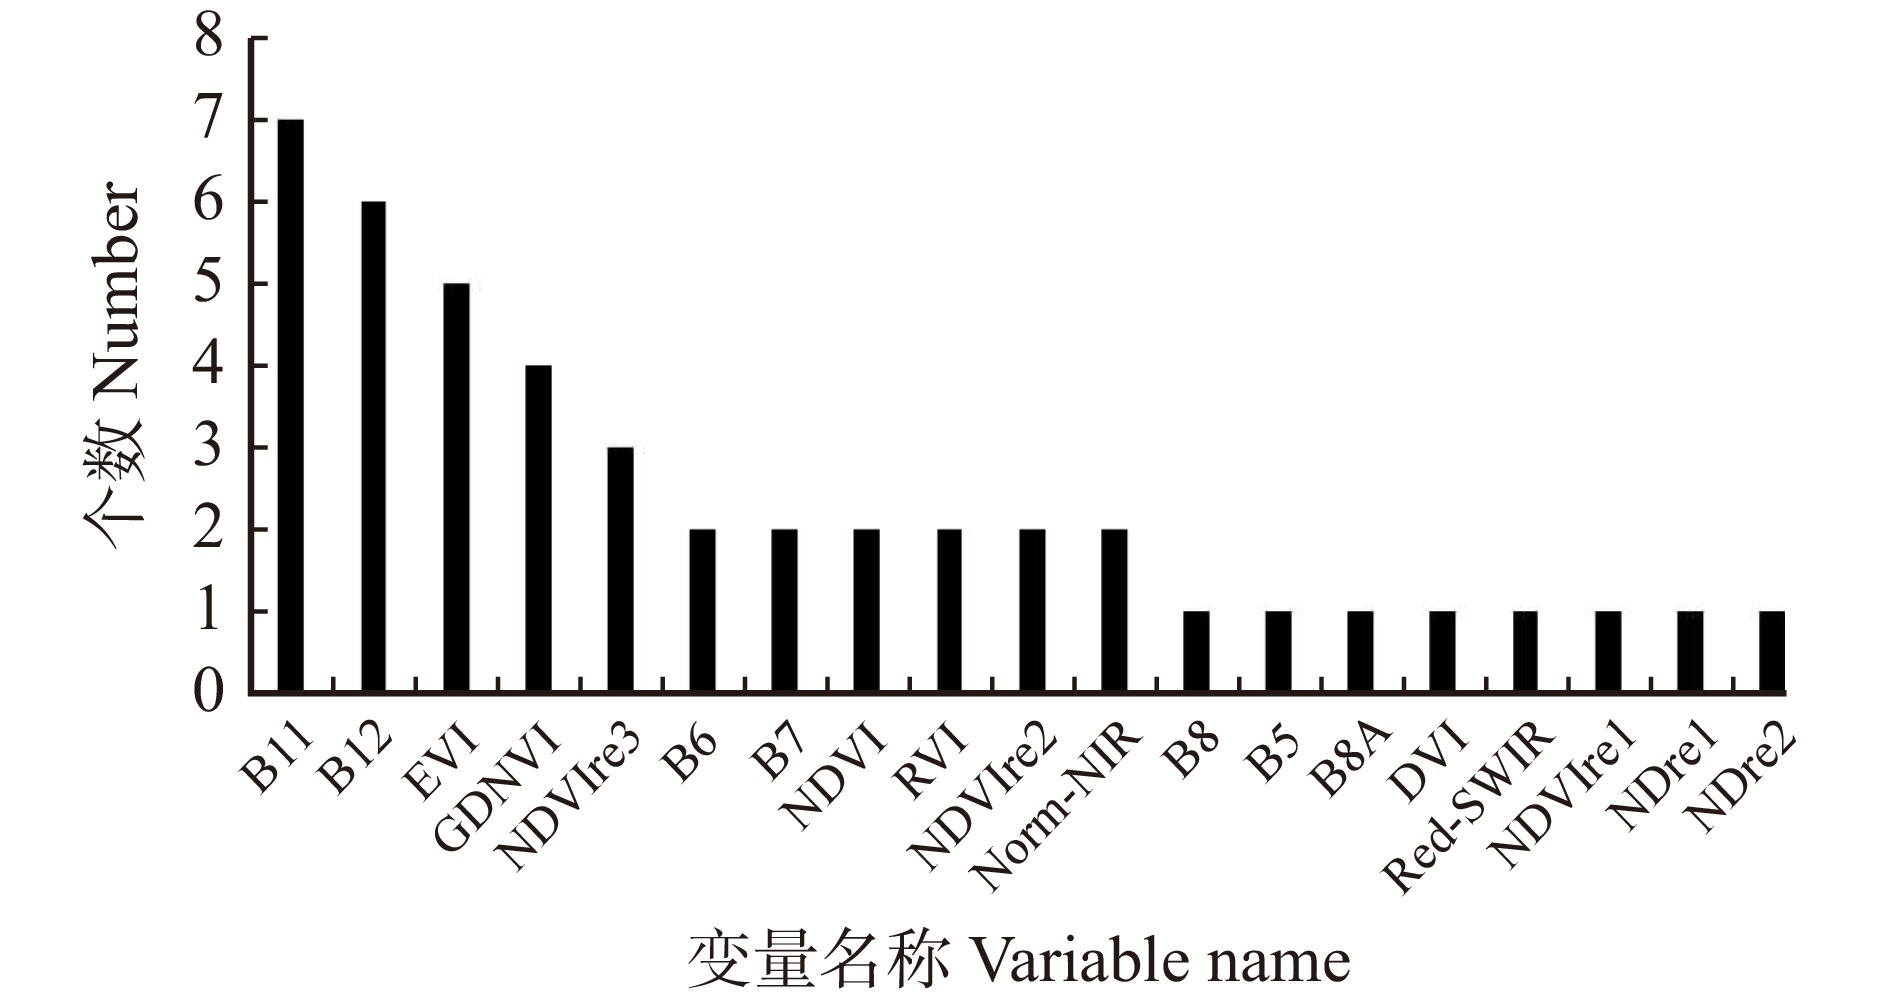
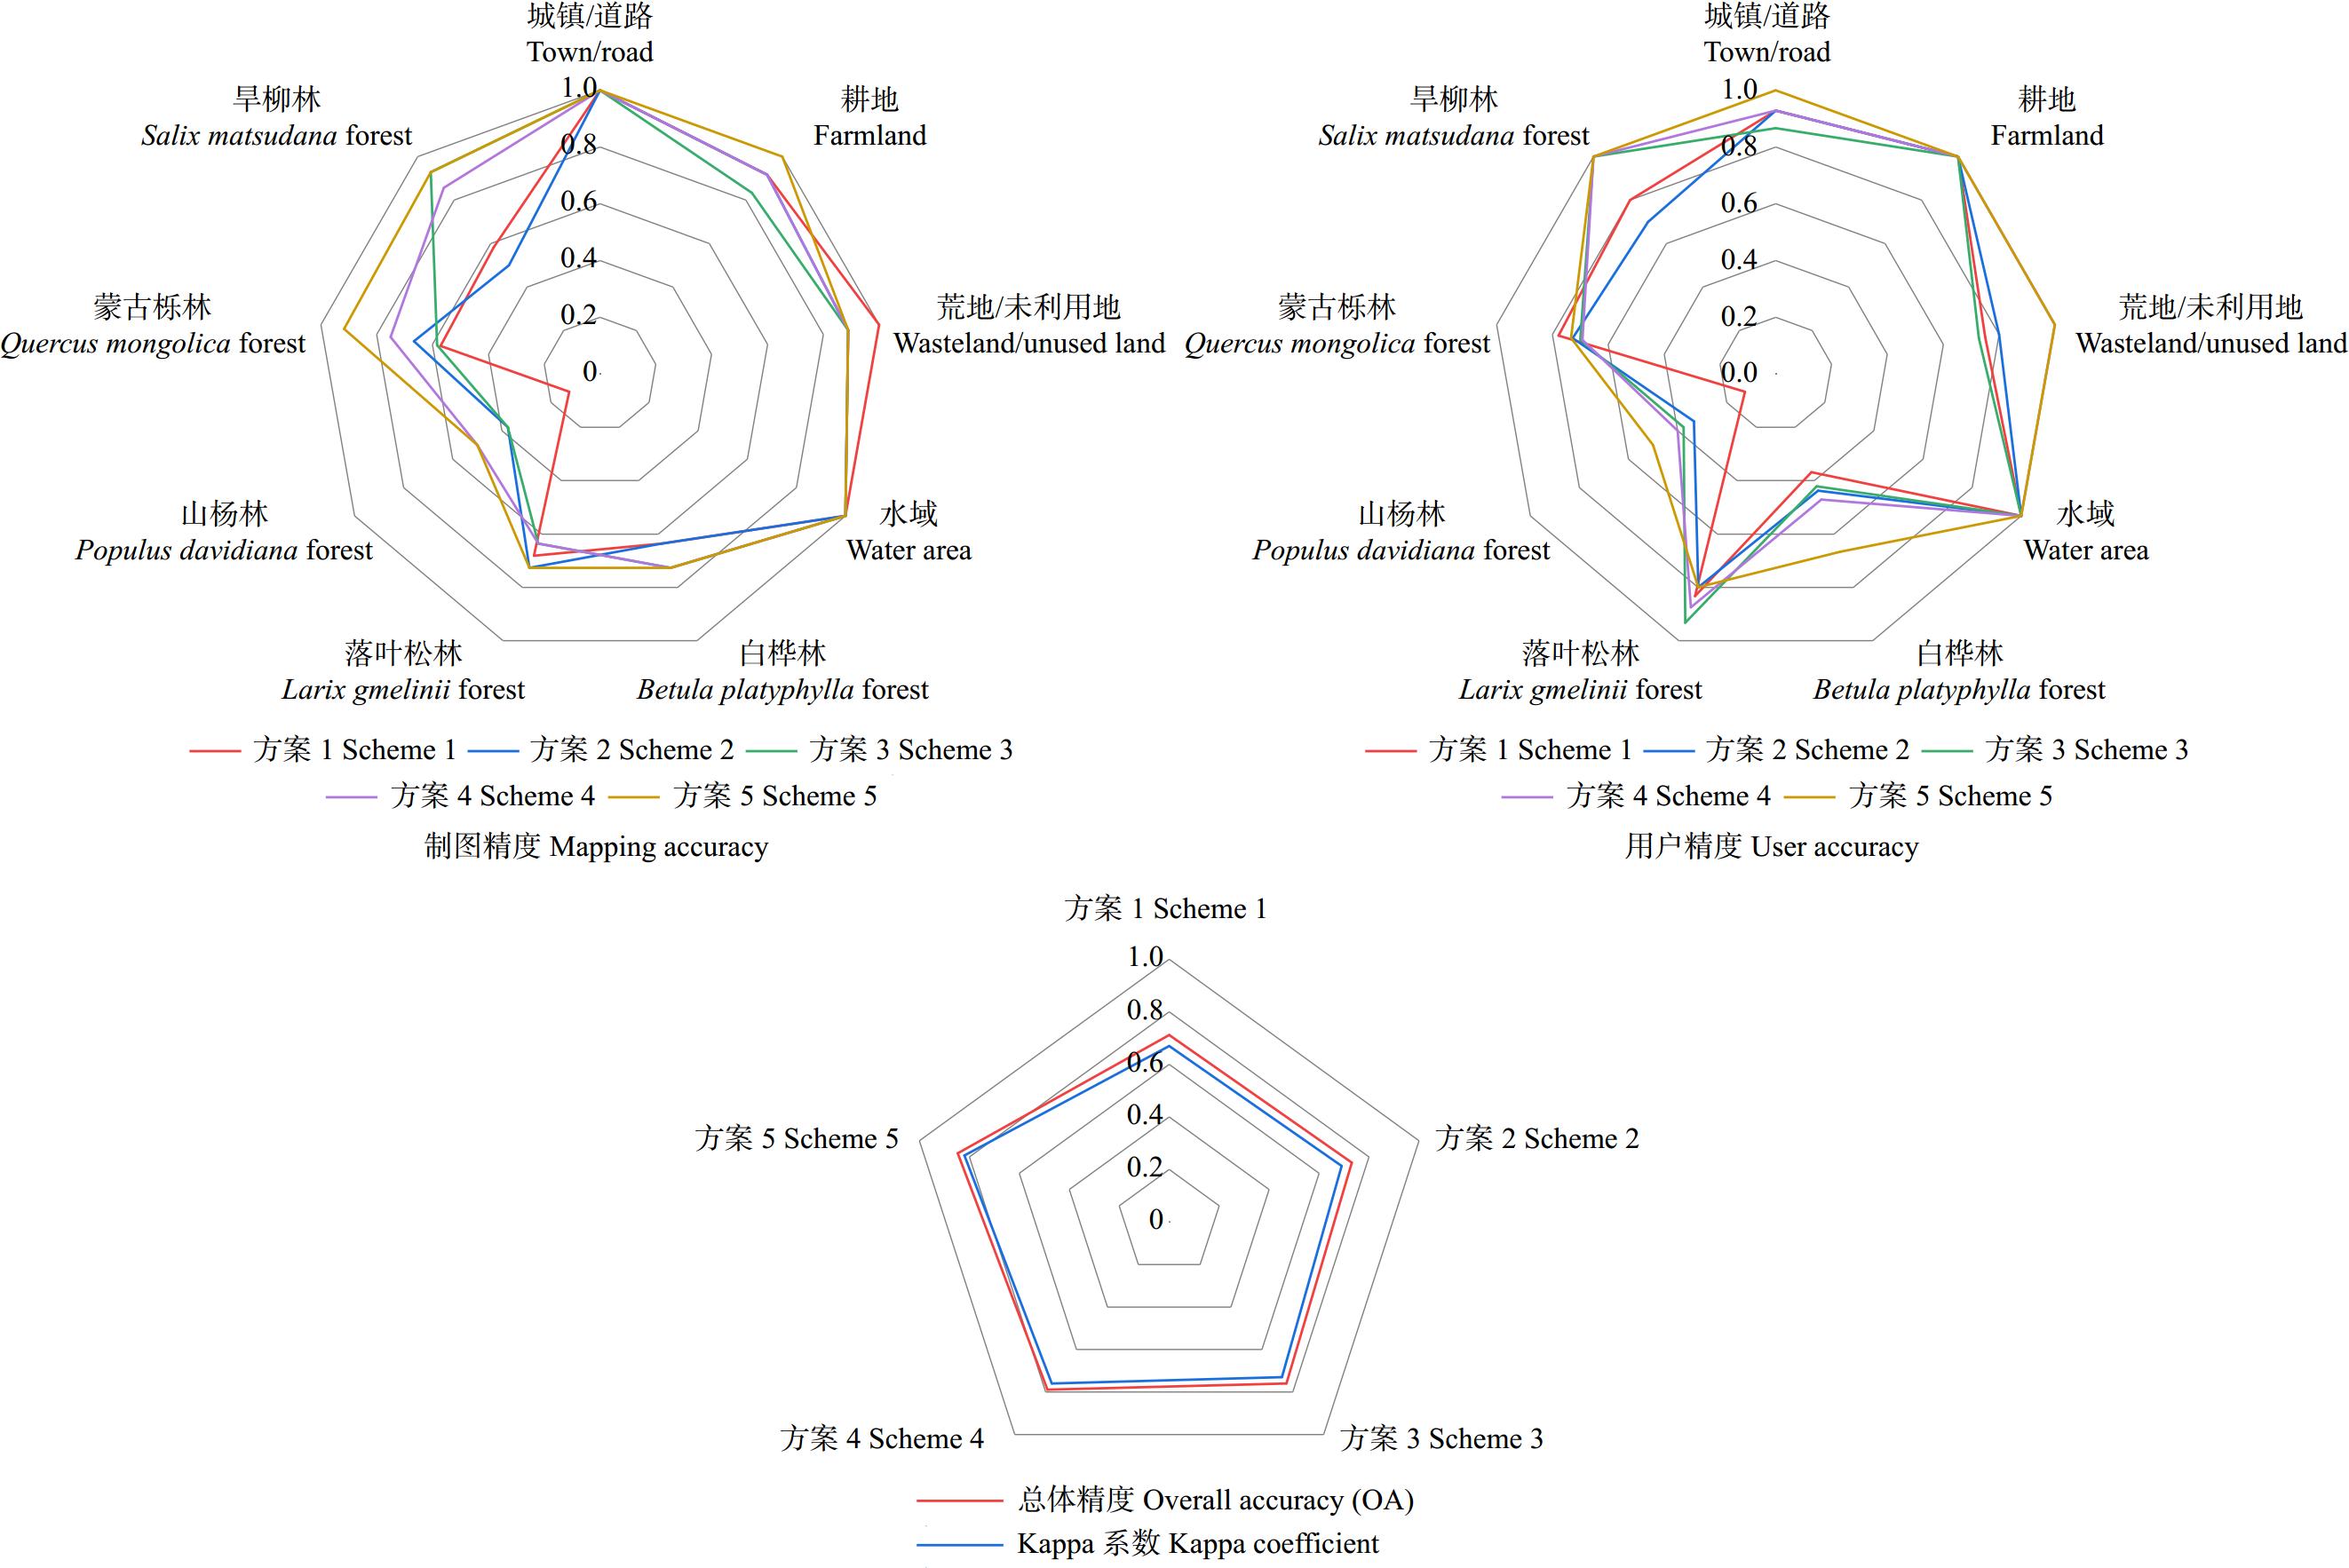
结果(1)使用Sentinel-2时间序列光谱特征、Sentinel-1雷达后向散射特征和SRTM DEM地形特征的方案分类效果最好,总体精度为84.62%,Kappa系数为0.82;(2)在构建的5个不同特征组合方案中,多特征组合的方案分类效果优于单一特征;(3)地形特征、后向散射特征和时间序列特征对于分类结果非常重要,尤其是时间序列特征的加入能大大提升林分类型识别精度。光谱特征中短红外波段B11和B12最重要,时间序列特征中4月份和10月份为最重要的时间节点。
结论基于多源遥感数据提取的多特征分类方案能够有效进行研究区林分类型识别,地形特征、后向散射特征和Sentinel-2时间序列特征可以作为光谱特征的有效辅助特征变量提高分类精度,使林分类型识别更为准确,尤其是时间序列特征在提高林分类型识别精度上有突出作用。
-
关键词:
- Sentinel-2 /
- Sentinel-1 /
- 随机森林 /
- Google Earth Engine (GEE) /
- 时间序列特征
Abstract:ObjectiveThis paper aims to combine multi-source remote sensing data for feature extraction to determine the most effective classification strategy. Additionally, we investigated the significance of time series features in identifying forest types, offering a technical approach for remote sensing-based forest type identification.
MethodThis study combined Sentinel-2 spectral features, time series features, Sentinel-1 radar backscatter features, and SRTM DEM terrain features to extract various feature variables using Google Earth Engine. Multiple feature combinations were constructed and classified using the random forest classifier. Subsequently, mapping output and accuracy evaluations were performed on the resulting classifications.
Result(1) The scheme that incorporates Sentinel-2 time series features, Sentinel-1 radar backscatter features, and SRTM DEM terrain features exhibited the highest classification accuracy, achieving an overall accuracy of 84.62% and a Kappa coefficient of 0.82. (2) Among the five constructed feature combination schemes, the multi-feature combination scheme demonstrated superior classification performance compared with individual feature. (3) Terrain features, radar backscatter features, and time series features significantly influenced the classification results. The inclusion of time series features notably enhanced the accuracy of forest type identification. Among the spectral features, the shortwave infrared bands B11 and B12 were the most critical, while April and October were identified as the most important time nodes within the time series features.
ConclusionThe multi-feature classification scheme, which combines data from various remote sensing sources, is proved to be effective in accurately identifying forest types in the study area. SRTM DEM terrain features, Sentinel-1 radar backscatter features, and Sentinel-2 time series features serve as valuable complementary indicators to spectral features, enhancing classification accuracy. Time series features, in particular, play a significant role in improving the accuracy of forest type identification.
-
Keywords:
- Sentinel-2 /
- Sentinel-1 /
- random forest /
- Google Earth Engine (GEE) /
- time series feature
-
-
![]()
图 4 方案1 ~ 4特征贡献率及特征累计贡献率
SLO.坡度;ELE.海拔;ASP.坡向。SLO, slope; ELE, elevation; ASP, aspect.
Figure 4. Feature contribution rate and feature cumulative contribution rate of schemes 1−4
![]()
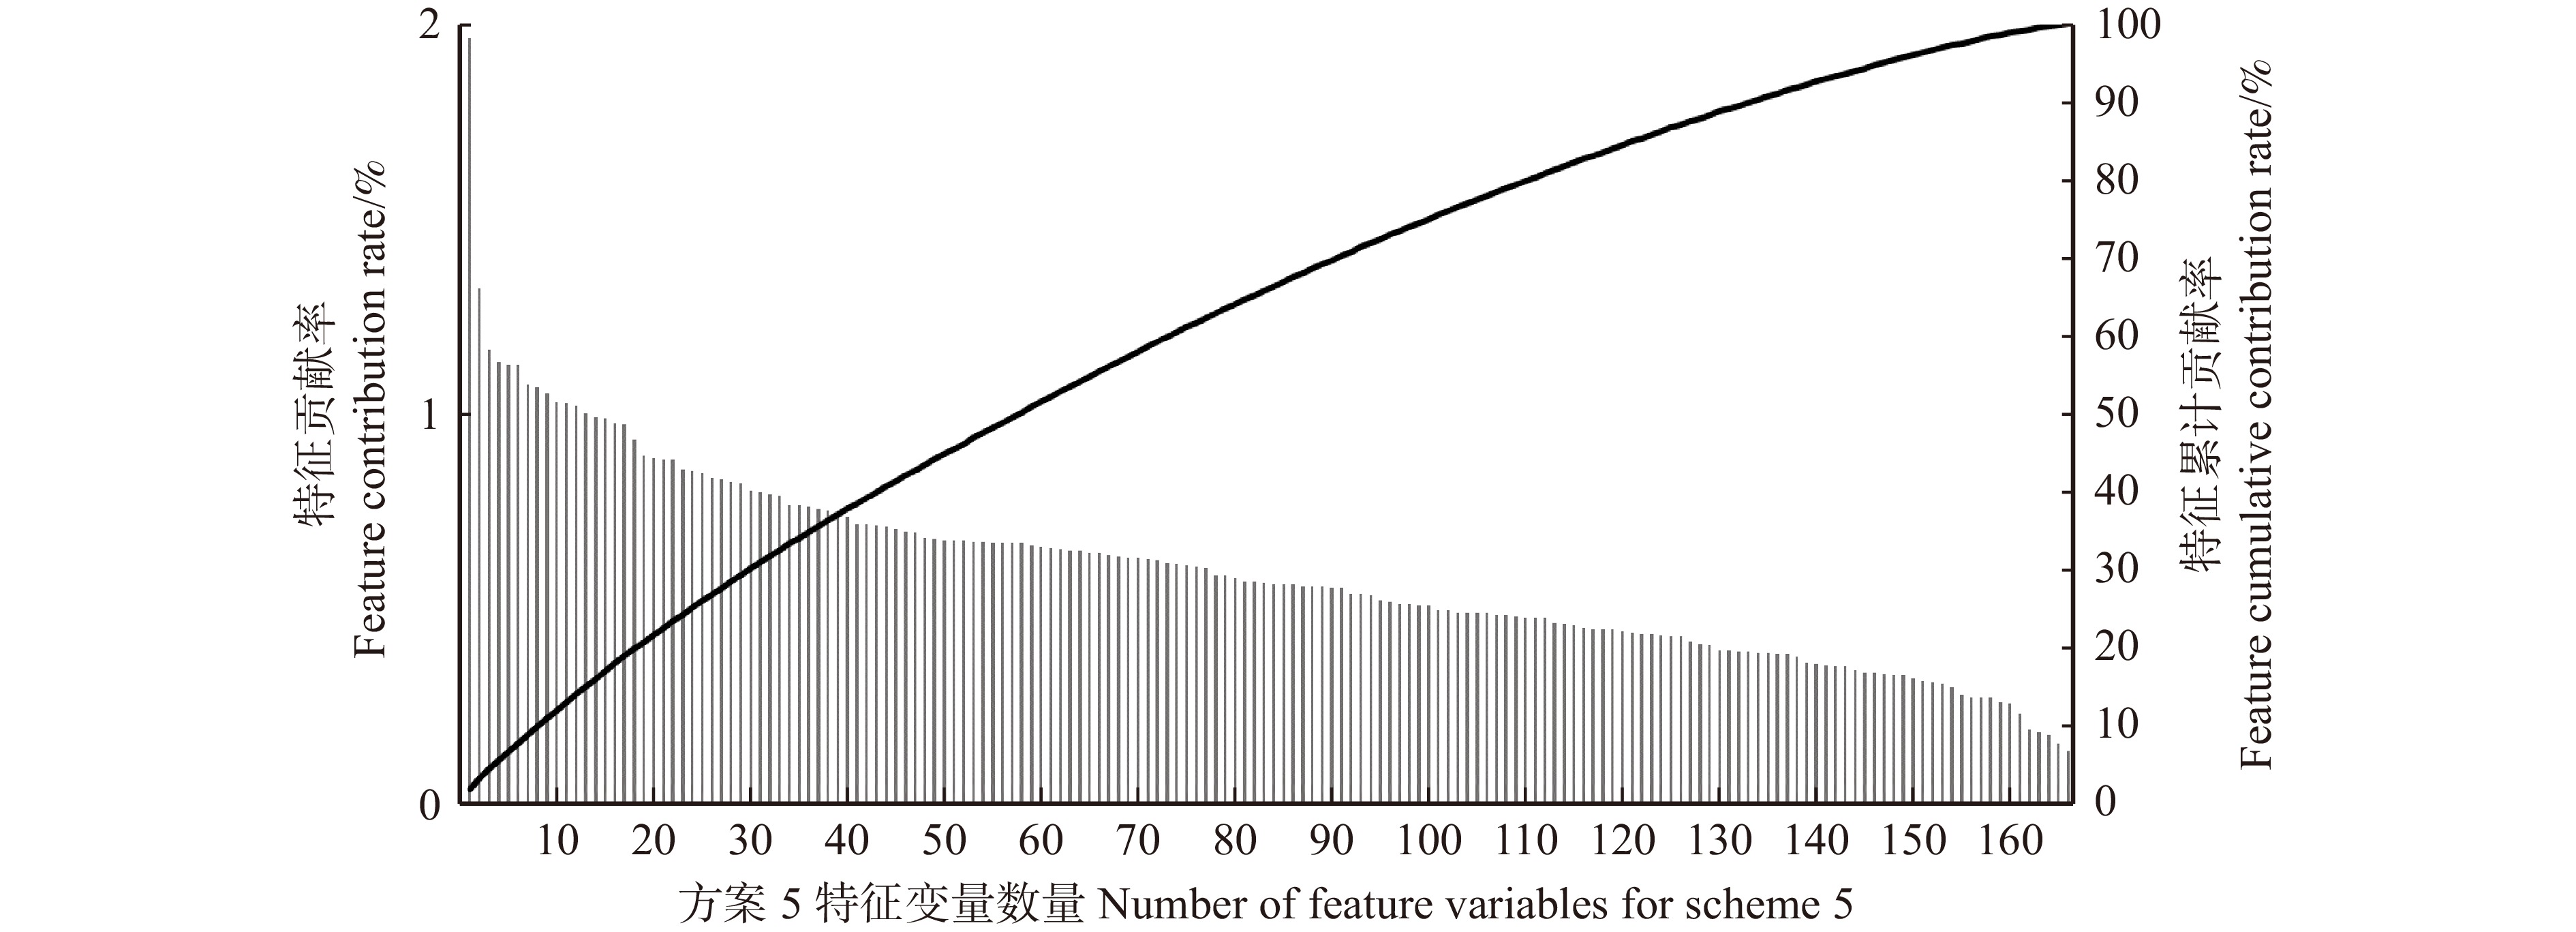
图 5 方案5特征贡献率及特征累计贡献率
Figure 5. Feature contribution rate and feature cumulative contribution rate of scheme 5
![]()
图 6 方案5各时期排名前30%的光谱特征个数
Figure 6. Number of spectral features of top 30% ineach period of scheme 5
![]()
图 7 方案5排名前30%的光谱特征及数量
Figure 7. Spectral features and quantities of the top 30% of scheme 5
表 1 Sentinel-2光谱特征集描述
Table 1 Description of Sentinel-2 spectral feature set
特征类型
Feature type特征名称
Feature name特征说明/计算公式
Feature description/calculation formula波段
BandB2 波长490 nm,蓝色 Wave length 490 nm, blue B3 波长560 nm,绿色 Wave length 560 nm, green B4 波长665 nm,红色 Wave length 665 nm, red B5 波长705 nm,红边波段 Wave length 705 nm, red edge band B6 波长749 nm, 红边波段 Wave length 749 nm, red edge band B7 波长783 nm,红边波段 Wave length 783 nm, red edge band B8 波长842 nm,近红外 Wave length 842 nm, near infrared B8A 波长865 nm,近红外 Wave length 865 nm, near infrared B11 波长1610 nm,短波红外 Wave length 1610 nm, shortwave infrared B12 波长2190 nm,短波红外 Wave length 2190 nm, shortwave infrared 植被指数
Vegetation
index归一化植被指数
Normalized difference vegetation index (NDVI)NDVI=ρNIR−ρRedρNIR+ρRed 绿波段归一化差值植被指数
Green normalized difference vegetation index (GDNVI)GNDVI=ρNIR−ρGreenρNIR+ρGreen 差值植被指数
Difference vegetation index (DVI)DVI=ρNIR−ρRed 增强植被指数
Enhanced vegetation index (EVI)EVI=2.5×(ρNIR−ρRedρNIR+6ρRed−7.5ρBlue+1) 土壤调节植被指数
Soil-adjusted vegetation index (SAVI)SAVI=1.5×(ρNIR−ρRedρNIR+ρRed+0.5) 红−短波红外波段差值
Red-SWIR band difference (Red-SWIR)RedSWIR=ρRed−ρSWIR1 比值植被指数
Ratio vegetation index (RVI)RVI=ρNIRρRed 红边归一化植被指数1
Red-edge normalized difference vegetation index 1 (NDVIre1)NDVIre1=ρNIRnarrow−ρRededge1ρNIRnarrow+ρRededge1 红边归一化植被指数2
Red-edge normalized difference vegetation index 2 (NDVIre2)NDVIre2=ρNIRnarrow−ρRededge2ρNIRnarrow+ρRededge2 红边归一化植被指数3
Red-edge normalized difference vegetation index 3 (NDVIre3)NDVIre3=ρNIRnarrow−ρRededge3ρNIRnarrow+ρRededge3 归一化红边 1
Normalized difference red-edge 1 (NDre1)NDre1=ρRededge2−ρRededge1ρRededge2+ρRededge1 归一化红边2
Normalized difference red-edge 2 (NDre2)NDre2=ρRededge3−ρRededge1ρRededge3+ρRededge1 归一化近红外
Normalized near infra-red (Norm-NIR)Norm-NIR=ρNIRρNIR+ρRed+ρGreen 注:ρNIR为近红外波段的反射值;ρRed为红光波段的反射值;ρGreen为绿光波段的反射值;ρBlue为蓝光波段的反射值;ρSWIR1为短波红外波段(此处为B11波段)的反射值;ρNIRnarrow为近红外波段(此处为B8A)波段的反射值;ρRededge1为红边波段1(此处为B5波段)的反射值;ρRededge2为红边波段2(此处为B6波段)的反射值;ρRededge3为红边波段3(此处为B7波段)的反射值。Notes: ρNIR is the reflection value in the near infrared band; ρRed is the reflection value of the red band; ρGreen is the reflection value of the green band; ρBlue is the reflection value of the blue band; ρSWIR1 is the reflection value of the shortwave infrared band (which refers to the B11 band here); ρNIRnarrow is the reflection value of the near infrared band (which refers to the B8A band here); ρRededge1 is the reflection value of the red edge band band 1 (which refers to the B5 band here); ρRededge2 is the reflection value of the red edge band 2 (which refers to the B6 band here); ρRededge3 is the reflection value of the red edge band 3 (which refers to the B7 band here).  下载: 导出CSV
表 2 分类系统
Table 2 Classification system
一级分类
First level classification二级分类
Secondary level classification林地 Forest land 白桦林 Betula platyphylla forest 落叶松林 Larix gmelinii forest 山杨林 Populus davidiana forest 蒙古栎林 Quercus mongolica forest 旱柳林 Salix matsudana forest 非林地 Non-forest land 荒地/未利用地 Wasteland/unused land 耕地 Farmland 城镇/道路 Town/road 水域 Water area
下载: 导出CSV
表 3 5种分类方案的特征组合
Table 3 Feature combinations of five classification schemes
序号
No.特征组合
Feature combination变量个数
Number of variable1 Sentinel-2光谱特征
Sentinel-2 spectral feature23 2 Sentinel-2光谱特征 + Sentinel-1雷达后向散射特征
Sentinel-2 spectral feature + Sentinel-1 SAR backscattering feature25 3 Sentinel-2光谱特征 + DEM地形特征
Sentinel-2 spectral feature + DEM terrain feature26 4 Sentinel-2光谱特征 + Sentinel-1雷达后向散射特征 + DEM地形特征
Sentinel-2 spectral feature + Sentinel-1 SAR backscattering feature + DEM terrain feature28 5 Sentinel-2时间序列光谱特征 + Sentinel-1雷达后向散射特征 + DEM地形特征
Sentinel-2 time-series spectral feature + Sentinel-1 SAR backscattering feature + DEM terrain feature166
下载: 导出CSV
表 4 方案5中排名前30%的特征变量
Table 4 Top 30% characteristic variables in schemes 5
变量排名
Ranking of variable特征变量名称
Feature variable name变量排名
Ranking of variable特征变量名称
Feature variable name1 slope 26 NDVIre3_Oct. 2 B12_Apr. 27 B11_Aug. 3 B11_Oct. 28 GNDVI_Apr. 4 VV 29 GNDVI_Sept. 5 B12_May 30 GNDVI_Jul. 6 B12_Jun. 31 RVI_Sept. 7 B11_May 32 B11_Jul. 8 B12_Jul. 33 RVI_Jun. 9 elevation 34 B11_Apr. 10 B11_Sept. 35 EVI_Oct. 11 EVI_Apr. 36 EVI_May 12 VH 37 NDVIre2_Sept. 13 NDre1_Apr. 38 EVI_Jun. 14 GNDVI_Oct. 39 B12_Sept. 15 NDre2_Apr. 40 NDVIre3_Aug. 16 NDVIre1_Apr. 41 B6_May 17 NDVI_Oct. 42 aspect 18 B12_Oct. 43 NDVI_Apr. 19 B7_Apr. 44 RedSWIR_Oct. 20 NDVIre3_Sept. 45 B8_Apr. 21 Norm-NIR_Apr. 46 EVI_Jul. 22 B7_Oct. 47 NDVIre2_Apr. 23 B6_Apr. 48 B11_Jun. 24 B5_May 49 DVI_May 25 Norm-NIR_Oct. 50 B8A_Oct.
下载: 导出CSV
-
[1] Ma M, Liu J, Liu M, et al. Tree species classification based on Sentinel-2 imagery and random forest classifier in the eastern regions of the Qilian Mountains[J/OL]. Forests, 2021, 12(12): 1736[2023−03−12]. https://www.mdpi.com/1999-4907/12/12/1736.
[2] Hocio A , Lewandowska A . Mapping forest type and tree species on a regional scale using multi-temporal Sentinel-2 data[J/OL]. Remote Sensing, 2019, 11(8): 929[2023−03−13]. https://www.mdpi.com/2072-4292/11/8/929.
[3] Abdi A M. Land cover and land use classification performance of machine learning algorithms in a boreal landscape using Sentinel-2 data[J]. GIScience & Remote Sensing, 2020, 57(1): 1−20.
[4] Halder A, Ghosh A, Ghosh S. Supervised and unsupervised landuse map generation from remotely sensed images using ant based systems[J]. Applied Soft Computing, 2011, 11(8): 5770−5781.
[5] Niemeyer J, Rottensteiner F, Soergel U. Contextual classification of lidar data and building object detection in urban areas[J]. ISPRS Journal of Photogrammetry and Remote Sensing, 2014, 87: 152−165. doi: 10.1016/j.isprsjprs.2013.11.001
[6] Lim J, Kim K M, Kim E H, et al. Machine learning for tree species classification using Sentinel-2 spectral information, crown texture, and environmental variables[J/OL]. Remote Sensing, 2020, 12(12): 2049[2023−03−12]. https://www.mdpi.com/2072-4292/12/12/2049.
[7] Lim J, Kim K, Jin R. Tree species classification using hyperion and Sentinel-2 data with machine learning in South Korea and China[J/OL]. ISPRS International Journal of Geo-Information, 2019, 8(3): 150[2023−03−13]. https://www.mdpi.com/2220-9964/8/3/150.
[8] Dostálová A, Wagner W, Milenkovic M, et al. Annual seasonality in Sentinel-1 signal for forest mapping and forest type classification[J]. International Journal of Remote Sensing, 2018, 39(21−22): 7738−7760.
[9] Da S, Soares G L, Del’Arco S, et al. Use of MSI/Sentinel-2 and airborne LiDAR data for mapping vegetation and studying the relationships with soil attributes in the Brazilian semi-arid region[J]. International Journal of Applied Earth Observation & Geoinformation, 2018, 73: 179−190.
[10] Sánchez-Espinosa A, Schröder C. Land use and land cover mapping in wetlands one step closer to the ground: Sentinel-2 versus Landsat 8[J]. Journal of Environmental Management, 2019, 247: 484−498.
[11] Chaves M, Picoli M, Sanches I. Recent applications of Landsat 8/OLI and Sentinel-2/MSI for land use and land cover mapping: a systematic review[J/OL]. Remote Sensing, 2020, 12: 3062[2023−03−13]. https://www.mdpi.com/2072-4292/12/18/3062.
[12] Mngadi M, Odindi J, Peerbhay K, et al. Examining the effectiveness of Sentinel-1 and 2 imagery for commercial forest species mapping[J]. Geocarto International, 2021, 36(1): 1−12. doi: 10.1080/10106049.2019.1585483
[13] 黄翀, 张晨晨, 刘庆生, 等. 结合光学与雷达影像多特征的热带典型人工林树种精细识别[J]. 林业科学, 2021, 57(7): 80−91. Huang C, Zhang C C, Liu Q S, et al. Multi-feature classification of optical and SAR remote sensing images for typical tropical plantation species[J]. Scientia Silvae Sinicae, 2021, 57(7): 80−91.
[14] Li N, Lu D, Wu M, et al. Coastal wetland classification with multiseasonal high-spatial resolution satellite imagery[J]. International Journal of Remote Sensing, 2018, 39(23): 8963−8983. doi: 10.1080/01431161.2018.1500731
[15] 程丽娜, 钟才荣, 李晓燕, 等. Sentinel-2密集时间序列数据和Google Earth Engine的潮间带湿地快速自动分类[J]. 遥感学报, 2022, 26(2): 348−357. doi: 10.11834/jrs.20211311 Cheng L N, Zhong C R, Li X Y, et al. Rapid and automatic classification of intertidal wetlands based on intensive time series Sentinel-2 images and Google Earth Engine[J]. National Remote Sensing Bulletin, 2022, 26(2): 348−357. doi: 10.11834/jrs.20211311
[16] Leckie D G, Gougeon F, Mcqueen R, et al. Production of a large-Area individual tree species map for forest inventory in a complex forest setting and lessons learned[J]. Canadian Journal of Remote Sensing, 2017, 43(2): 140−167. doi: 10.1080/07038992.2017.1286974
[17] Wang M, Li M, Wang F, et al. Exploring the optimal feature combination of tree species classification by fusing multi-feature and multi-temporal Sentinel-2 data in Changbai Mountain[J/OL]. Forests, 2022, 13(7): 1058[2023−03−12]. https://www.mdpi.com/1999-4907/13/7/1058.
[18] Rüetschi M, Schaepman M E, Small D. Using multitemporal Sentinel-1 C-band backscatter to monitor phenology and classify deciduous and coniferous forests in northern Switzerland[J/OL]. Remote Sensing, 2018, 10(1): 55[2023−03−12]. https://www.mdpi.com/2072-4292/10/1/55/htm.
[19] Cai Y, Guan K, Jian P, et al. A high-performance and in-season classification system of field-level crop types using time-series Landsat data and a machine learning approach[J]. Remote Sensing of Environment, 2018, 210: 35−47. doi: 10.1016/j.rse.2018.02.045
[20] Xuan F, Dong Y, Li J Y, et al. Mapping crop type in Northeast China during 2013–2021 using automatic sampling and tile-based image classification[J/OL]. International Journal of Applied Earth Observation and Geoinformation, 2023, 117, 103178[2023−03−12]. https://www.sciencedirect.com/science/article/pii/S1569843222003661.
[21] Persson M, Lindberg E, Reese H. Tree species classification with multi-temporal Sentinel-2 Data[J/OL]. Remote Sensing, 2018, 10(11): 1794[2023−03−12]. https://www.mdpi.com/2072-4292/10/11/1794.
[22] Xi Y, Ren C, Tian Q, et al. Exploitation of time series Sentinel-2 data and different machine learning algorithms for detailed tree species classification[J]. IEEE Journal of Selected Topics in Applied Earth Observations and Remote Sensing, 2021, 14: 7589−7603. doi: 10.1109/JSTARS.2021.3098817
[23] 张磊, 宫兆宁, 王启为, 等. Sentinel-2影像多特征优选的黄河三角洲湿地信息提取[J]. 遥感学报, 2019, 23(2): 313−326. doi: 10.11834/jrs.20198083 Zhang L, Gong Z N, Wang Q W, et al. Wetland mapping of Yellow River Delta Wetlands based on multi-feature optimization of Sentinel-2 images[J]. National Remote Sensing Bulletin, 2019, 23(2): 313−326. doi: 10.11834/jrs.20198083
[24] 李斌, 李崇贵, 李煜. 基于Sentinel-2数据的塞罕坝机械林场落叶松人工林提取[J]. 林业资源管理, 2021, (2): 117−123. Li B, Li C G, Li Y. Research on larch extraction in Saihanba Mechanical Forest Farm based on Sentinel-2 Data[J]. Forestry Resource Management, 2021, (2): 117−123.
[25] Waser L T, Rüetschi M, Psomas A, et al. Mapping dominant leaf type based on combined Sentinel-1/-2 data-Challenges for mountainous countries[J]. ISPRS Journal of Photogrammetry and Remote Sensing, 2021, 180: 209−226. doi: 10.1016/j.isprsjprs.2021.08.017
[26] Grabska E, Hostert P, Pflugmacher D, et al. Forest stand species mapping using the Sentinel-2 time series[J/OL]. Remote Sensing, 2019, 11(10): 1197[2023−03−12]. https://www.mdpi.com/2072-4292/11/10/1197.
[27] Pham L H, Pham L T H, Dang T D, et al. Application of Sentinel-1 data in mapping land-use and land cover in a complex seasonal landscape: a case study in coastal area of Vietnamese Mekong Delta[J]. Geocarto International, 2022, 37(13): 3743–3760.
[28] Kristian S B, Thomas N, Rasmus F. Classification of nemoral forests withfusion of multi-temporal Sentinel-1 and 2 data[J/OL]. Remote Sensing, 2021, 13(5): 950[2023−03−13]. https://www.mdpi.com/2072-4292/13/5/950.
[29] Liu Y N, Gong W S, Hu X Y, et al. Forest type identification with random forest using Sentinel-1A, Sentinel-2A, multi-temporal Landsat-8 and DEM data[J/OL]. Remote Sensing, 2018, 10(6): 946[2023−03−12]. https://www.mdpi.com/2072-4292/10/6/946.
[30] Luo C, Liu H, Lu L, et al. Monthly composites from Sentinel-1 and Sentinel-2 images for regional major crop mapping with Google Earth Engine[J]. Journal of Integrative Agriculture, 2021, 20(7): 1944−1957. doi: 10.1016/S2095-3119(20)63329-9
[31] Kollert A, Bremer M, Loew M, et al. Exploring the potential of land surface phenology and seasonal cloud free composites of one year of Sentinel-2 imagery for tree species mapping in a mountainous region[J/OL]. International Journal of Applied Earth Observation and Geoinformation, 2021, 94: 102208[2023−03−12]. https://www.sciencedirect.com/science/article/pii/S030324342030461X.
[32] 薛朝辉, 钱思羽. 融合Landsat 8与Sentinel-2数据的红树林物候信息提取与分类[J]. 遥感学报, 2022, 26(6): 1121−1142. doi: 10.11834/jrs.20221448 Xue Z H, Qian S Y. Fusion of Landsat 8 and Sentinel-2 data for mangrove phenology information extraction and classification[J]. National Remote Sensing Bulletin, 2022, 26(6): 1121−1142. doi: 10.11834/jrs.20221448
[33] 董灵波, 梁凯富, 张一帆, 等. 基于Landsat 8时间序列数据的翠岗林场森林类型划分[J]. 应用生态学报, 2022, 33(9): 2339−2346. Dong L B, Liang K F, Zhang Y F, et al. Classification of forest types in Cuigang Forest Farm based on time series data of Landsat 8[J]. Chinese Journal of Applied Ecology, 2022, 33(9): 2339−2346.
[34] Poortinga A, Tenneson K, Shapiro A, et al. Mapping plantations in Myanmar by fusing Landsat-8, Sentinel-2 and Sentinel-1 data along with systematic error quantification[J/OL]. Remote Sensing, 2019, 11(7): 831[2023−03−12]. https://www.mdpi.com/2072-4292/11/7/831.
[35] Cheng K, Wang J. Forest type classification based on integrated spectral-spatial-temporal features and random forest algorithm-a case study in the Qinling mountains[J/OL]. Forests, 2019, 10(7): 559[2023−03−12]. https://www.mdpi.com/1999-4907/10/7/559.
[36] Nasiri V, Deljouei A, Moradi F, et al. Land use and land cover mapping using Sentinel-2, Landsat-8 satellite images, and google earth engine: a comparison of two composition methods[J/OL]. Remote Sensing, 2022, 14(9): 1977[2023−03−13]. https://www.mdpi.com/2072-4292/14/9/1977.
-
期刊类型引用(6)
1. 张友谊,李松柏,钟磊. 基于地形因子的震后泥石流降雨阈值分析. 科学技术与工程. 2024(32): 13708-13717 .  百度学术
百度学术
2. 曹永强,张若凝,范帅邦. 辽宁省降雨型泥石流环境特征及分类预警. 华北水利水电大学学报(自然科学版). 2022(02): 60-68 . 百度学术
3. 曹永强,张若凝,李玲慧,路洁,宁月. 辽宁省泥石流与不同时间尺度下降水因子的关系研究. 灾害学. 2021(03): 51-56 . 百度学术
4. 乔建平. 降雨型滑坡泥石流灾害预警原理及系统结构. 人民长江. 2020(01): 50-55+74 . 百度学术
5. 胡凯衡,魏丽,刘双,李秀珍. 横断山区泥石流空间格局和激发雨量分异性研究. 地理学报. 2019(11): 2303-2313 . 百度学术
6. 凌訸,陶蓉,白晓华. 平凉鸭儿沟泥石流形成过程及特征分析. 甘肃水利水电技术. 2017(01): 18-21 . 百度学术
其他类型引用(3)


计量
- 文章访问数: 676
- HTML全文浏览量: 164
- PDF下载量: 94
- 被引次数: 9
