
Prediction of relative chlorophyll content in Hopea hainanensis based on multispectral frequency domain features
-
摘要:目的
研究坡垒叶绿素含量的多光谱图像预测法,探讨融合多光谱频域特征预测叶绿素含量的可行性,为坡垒叶绿素含量的无损监测提供有效工具。
方法采用将植被指数与传统的阈值分割法相结合的方式,去除坡垒冠层多光谱图像的背景,以F1为分割精度评价指标,确定最适多光谱图像分割方法。对分割后的坡垒冠层多光谱图像,精准提取空域特征(植被指数与纹理特征),并引入3种频域特征,然后基于相关性分析和Lasso算法筛选图像特征,以便携式叶绿素仪测得的SPAD值作为相对叶绿素含量实测值,确定与坡垒SPAD值强相关的优选特征及合适的建模特征组合,结合偏最小二乘回归(PLSR)、随机森林(RF)和极限梯度提升(XGBoost)模型,分别建立多光谱空、频、融合特征模型并进行精度验证,确定适用于幼龄坡垒SPAD值预测的模型形式。
结果差值植被指数与Kapur阈值结合的分割方法获得了最高分割精度,评价指标F1达到0.917,为坡垒冠层多光谱图像的最适分割方法。多光谱图像空频域特征表现了与坡垒SPAD值的显著相关性,其中相关性最强的特征为修正叶绿素吸收反射率植被指数,相关系数达到−0.780,为基于单图像特征预测SPAD值的优选特征。在3种频域特征中,小波特征与SPAD值的相关性表现最优。因此,小波变换为优选坡垒多光谱图像频域变换方法。基于不同图像特征构建的SPAD值预测模型,性能表现排序为单频域特征模型 < 单空域特征模型 < 融合特征模型,最适建模算法为RF、XGBoost算法。基于RF的融合特征模型为最适模型,检验R2达到0.791,较单空域特征模型的检验R2提高了7.9%。
结论引入3种频域特征能够提高坡垒SPAD值预测精度,且基于RF的融合特征模型获得了较高的预测精度,因此融合多光谱空频域特征并结合机器学习算法,可作为一种有效的幼龄坡垒相对叶绿素含量预测工具,有利于坡垒培育经营工作的智能化发展。
Abstract:ObjectiveThis paper studies the multispectral image-based estimation method for chlorophyll content in Hopea hainanensis, so as to explore the feasibility of fusing multispectral frequency domain features to estimate chlorophyll content, and provide an effective tool for nondestructive monitoring of chlorophyll content in H. hainanensis.
MethodBy combining vegetation index with traditional threshold segmentation methods, the background of multispectral images of H. hainanensis was removed, and the optimal segmentation method was determined by F1 as the segmentation accuracy evaluation index. Then, based on the segmented multispectral image, spatial domain features (vegetation index and texture features) were extracted, and three frequency domain features were introduced. The measured value of relative chlorophyll content (SPAD value) was measured using a portable chlorophyll analyzer SPAD. And based on correlation analysis and Lasso algorithm, image features were filtered to determine the preferred features which were strongly correlated with SPAD value of H. hainanensis. Finally, based on partial least-squares regression (PLSR), random forest (RF) and XGBoost algorithm, multispectral spatial domain, frequency domain and fusion feature models were established, and precision verification was conducted to determine the optimal model form for SPAD value estimation of young H. hainanensis.
ResultThe segmentation method combining DVI and Kapur threshold achieved the highest segmentation accuracy, with F1 of 0.917. Therefore, it was the most suitable segmentation method for H. hainanensis canopy multispectral images. Many spatial and frequency domain features of multispectral images exhibited significant correlations with the SPAD values of H. hainanensis. The most correlated feature was the modified chlorophyll absorption reflectivity index, with a correlation coefficient of −0.780. It was the preferred feature for estimating SPAD values based on single image features. Among the three frequency domain features, the correlation performance of wavelet features was the best. Therefore, wavelet transform was the preferred frequency domain transformation method for slope barrier multispectral images. The SPAD value estimation models constructed with different image features were sorted by performance as single frequency domain feature model < single spatial domain feature model < fused feature model, and the corresponding optimal modeling algorithms were RF and XGBoost, respectively. The fusion feature model based on RF was the optimal model, with a test R2 of 0.791, which was 7.9% higher than the test R2 of a single spatial feature model.
ConclusionThe estimation accuracy of H. hainanensis SPAD values can be improved by introducing three frequency domain features, and the fusion feature model based on RF can achieve good estimation accuracy. Therefore, integrating multispectral spatial and frequency domain features with machine learning algorithms can be used as an effective tool for estimating the relative chlorophyll content of young H. hainanensis, which is conducive to the intelligent development of H. hainanensis cultivation and management.
-
Keywords:
- Hopea hainanensis /
- chlorophyll content /
- multispectral /
- frequency domain /
- machine learning
-
坡垒(Hopea hainanensis)是龙脑香科(Dipterocarpaceae)坡垒属(Hopea)常绿乔木,主要分布于中国海南和越南义安等地区。由于人为破环、环境变化和经营不善等原因,造成其成熟个体锐减,目前已被列为国家一级保护植物,也被国际自然保护联盟列入“濒危”名单[1]。叶绿素含量通常被用来反映植物的光合能力和营养状况,是植物生长监测的重要指标[2]。因此,对濒危树种坡垒的叶绿素进行及时、无损的监测,有利于了解其生长需求,能够为其培育经营管理的精准化、智能化提供依据。
近年来,随着图像处理和遥感技术的快速发展,图像诊断法在植物叶绿素含量监测方面的应用潜力正在被开发[3]。在图像数据获取方面,多光谱相机因其低成本和实用性,已被广泛应用于植物生长生理参数的定量反演。在过去的研究中,研究人员通常提取图像中的光谱特征和纹理特征进行利用,并证明了其在预测植物叶绿素含量上的可行性[4−5]。光谱和纹理特征是基于对图像空间域分析获得的特征,而图像频域也包含了许多值得探索的微动信息。近年来,图像频域信息在农林领域上的应用也在被逐步开发,已有研究证明了频域信息在挖掘微动信息方面的巨大潜力,如植物分类[6]、氮含量反演[7],但在植物叶绿素含量诊断方面的研究报道依然较少,Zhuo等[8]证明了引入频域指数来提高湿地叶绿素含量的制图精度的可行性。因此,将频域信息与空域信息融合,具有提高图像信息对植物叶绿素含量解释能力的巨大潜力,且该方法在其他植被类型或树种上的应用可行性上仍留有大量空白,值得进一步探索。此外,在过去的研究中通常仅使用单一的频域转换方法,关于不同频域变换方法在叶绿素含量估算中的差异性研究也还存在空白。因此,鉴于频域分析方法的多样性,有必要引入多种转换方法和频域指标,以确定最合适的频域分析方法。
本研究以幼龄坡垒为研究对象,采集冠层多光谱图像和SPAD值(以便携式叶绿素仪测得的SPAD值作为相对叶绿素含量实测值),计算得到包括植被指数和图像纹理的空域特征,以及3类频域转换方法(傅里叶变换、小波变换和里斯变换)下的频域特征,确定与坡垒SPAD值具有显著相关性的优选特征,并比较了不同特征下传统模型和机器学习模型在预测幼龄坡垒SPAD值方面的性能,确定最适于坡垒SPAD值预测的最适特征选择和模型形式。旨在探索融合多光谱频域特征提高坡垒SPAD值预测精度的可行性,为坡垒相对叶绿素含量的无损监测提供有效工具。
1. 材料与方法
1.1 数据获取
试验地点位于海南省海口市云龙镇海南省林业科学院科研基地(110°28′08″E,19°52′25″N),试验区属热带季风气候,全年日照时间长,辐射能量大,年均日照时数大于2 000 h,年均气温24.4 ℃,平均最高气温28 ℃左右,平均最低气温18 ℃左右。研究选取健康无病害的两年生坡垒共60株作为试验材料,种植行株距均为1.2 m。在试验地布设近地面的摄影平台,通过远程连接方式控制多光谱相机(MicaSense RedEdge 3)在坡垒正上方2 m处进行俯视拍摄,以获取坡垒冠层多光谱图像。多光谱相机可获取蓝光(475 nm)、绿光(560 nm)、红光(668 nm)、近红外(840 nm)和红边(717 nm) 5个波段的信息,带宽分别为20、20、10、40、10 nm。
分别于2021年8月和2021年10月进行田间观测,共获取120组坡垒SPAD值和冠层影像数据。采用便携式叶绿素测定仪(TYS-4N)测量坡垒叶片的SPAD值,表征坡垒的相对叶绿素含量。每株坡垒选取不同方向的3枚叶片进行测定,并取其平均SPAD值代表该试验树冠层的相对叶绿素含量。最终测定得到坡垒的SPAD值最小值为5.1,平均值为22.5,最大值为41.4。
1.2 多光谱图像处理
1.2.1 图像去噪
由拍摄环境和相机硬件引起的图像噪声会对图像信息的有效性产生负面影响,因此,在进行图像分析前需对图像噪声进行处理。研究采用小波去噪方法实现多光谱图像去噪,既能有效去除噪声,又能保留图像的边缘特征[9]。
1.2.2 图像分割
图像分割可以避免非植物区域干扰,以提高图像特征的稳健性[10]。参考前人研究,本研究采用将植被指数与传统阈值分割法相结合的方式[11],选取3种植被指数,包括比值植被指数(ratio vegetation index,RVI)、差值植被指数(difference vegetation index,DVI)和归一化植被指数(normalized difference vegetation index,NDVI),与Kapur法相结合以确定优选分割方法。此外,将分割结果与人工标记的图像比较评估分割效果,使用F1作为分割精度指标,取值范围为[0, 1],其中0表示分割效果最差,1表示最优。定义图像分割后的真正值为VTP,真负值为VTN,假正值为VFP,假负值为VFN,则分割评价指标计算式如下。
R=VTPVTP+VFN (1) P=VTPVTP+VFP (2) F1=2RPR+P (3) 式中:R为召回率;P为精确率。
1.2.3 图像空域特征提取
从幼龄坡垒冠层的多光谱图像中,计算得到包括植被指数和图像纹理的空域特征。在此前的研究中,近红外和红边波段被证明对氮含量十分敏感[12−13],同时也与叶绿素含量密切相关。利用白板校正获得校正后的各波段图像的反射率值,基于校正后值计算得到植被指数。本研究拓展了多种传统植被指数,包括NDVI、RVI和DVI,计算方法见式(4) ~ (6)。
NDVI(j)=(RNIR−Bj)/(RNIR+Bj) (4) RVI(j)=Bj/RNIR (5) DVI(j)=RNIR−Bj (6) 式中:RNIR为近红外波段反射率;Bj为第j个波段反射率,其中j = {1, 2, 3, 4},对应的Bj分别为红、绿、蓝、红边波段反射率。
此外,参考前人[14−20]研究选取了8种其他多光谱植被指数,具体计算式见表1。
表 1 植被指数及其计算公式Table 1. Vegetation index and its calculation formula植被指数
Vegetation index计算式
Calculation formula植被指数
Vegetation index计算式
Calculation formula归一化红边绿指数
Normalized difference
red edge-green index (NDIreg)[14]NDIreg = (RRE – RG)/(RRE + RG) 红边植被指数
Red-edge vegetation index (REVI)[17]REVI = RNIR/RRE – 1 归一化红边红指数
Normalized difference
red edge-red index (NDIrer)[14]NDIrer =(RRE – RR)/(RRE + RR) 修正叶绿素吸收反射率植被指数
Modified chlorophyll absorption
reflectivity index (MCARI)[18]MCARI =
[RRE – RR – 0.2(RRE – RG)] RRE/RR增强型植被指数
Enhanced vegetation
index (EVI)[15]EVI = 2.5(RNIR – RR)/(RNIR + 6RR – 7.5RB + 1) 改进简单比值植被指数
Modified simple ratio vegetation
index (MSR)[19]MSR=(RNIR/RR−1)/√RNIR/RR+1 重归一化差异指数
Renormalized difference
vegetation index (RDVI)[16]RDVI=(RNIR−RR)/√RNIR+RR 修正植被指数
Modified vegetation index (MVI)[20]MVI=√(RNIR−RR)/(RNIR+RR)+0.5 注: RR、RG、RB、RNIR、RRE分别表示红、绿、蓝、近红外、红边波段反射率。 Note: RR, RG, RB, RNIR, RRE indicate reflectivity of red, green, blue, near infrared, and red edge bands, respectively. 研究通过灰度共生矩阵提取不同光谱波段下坡垒冠层图像的纹理特征。灰度共生矩阵作为图像纹理的一个常用描述符,能够考虑到像素之间的距离和角度关系[21]。从0°、45°、90°、135°这4个方向分别提取图像的能量、熵、惯性矩和相关特征,并计算4个方向的均值和标准差作为图像的纹理特征,以反映坡垒图像灰度在不同方向上的相邻间隔和变化幅度,描述图像的局部纹理信息。
1.2.4 图像频域特征提取
计算3类频域转换方法(傅里叶变换、小波变换和里斯变换)下幼龄坡垒冠层的多光谱图像的频域特征。
(1)傅里叶变换
二维离散傅里叶变换能够将图像从空间域变换到频域用于图像分析,利用快速傅里叶变换(fast Fourier transform,FFT)能够简化计算。设f(x, y)表示M × N像素的光谱带图像中像素坐标(x, y)处的灰度,则FFT简化后的傅里叶变换计算为
F(u,v)=∑M−1x=0[∑N−1y=0f(x,y)wux]wvy (7) 其中,
{wux=e−2iπuxMwvy=e−2iπvyN (8) 式中:(u, v)为像素坐标(x, y)对应的频域坐标;i为虚数单位。
基于FFT计算得到图像的傅里叶振幅谱,振幅谱对应于亮度对比度在空间频率和方向上的分布[22]。为了进一步描述振幅谱的分布特征,使用共生矩阵来提取振幅谱的变化特征,因此可计算得到振幅谱的能量、熵、惯性矩、相关特征的均值和标准差,各波段图像的傅里叶特征见表2。
表 2 频域特征Table 2. Frequency domain features方法
Method特征
Feature命名
Naming特征
Feature命名
Naming特征
Feature命名
Naming特征
Feature命名
Naming傅里叶变换
Fourier transform能量–均值
Energy-meanBj-EnmFFT 熵–均值
Entropy-meanBj-EntmFFT 惯性矩–均值
MOI-meanBj-MOImFFT 相关–均值
Correlation-meanBj-CormFFT 能量–标准差
Energy-SDBj-EnsFFT 熵–标准差
Entropy-SDBj-EntsFFT 惯性矩–标准差
MOI-SDBj-MOIsFFT 相关–标准差
Correlation-SDBj-CorsFFT 小波变换
Wavelet transform能量–均值
Energy-meanBj-EnmWT 熵–均值
Entropy-meanBj-EntmWT 惯性矩–均值
MOI-meanBj-MOImWT 相关–均值
Correlation-meanBj-CormWT 能量–标准差
Energy-SDBj-EnsWT 熵–标准差
Entropy-SDBj-EntsWT 惯性矩–标准差
MOI-SDBj-MOIsWT 相关–标准差
Correlation-SDBj-CorsWT 里斯变换
Riesz transform能量–均值
Energy-meanBj-EnmR 熵–均值
Entropy-meanBj-EntmR 惯性矩–均值
MOI-meanBj-MOImR 相关–均值
Correlation-meanBj-CormR 能量–标准差
Energy-SDBj-EnsR 熵–标准差
Entropy-SDBj-EntsR 惯性矩–标准差
MOI-SDBj-MOIsR 相关–标准差
Correlation-SDBj-CorsR 注:j = {1, 2, 3, 4, 5},对应的Bj分别为R、G、B、NIR、RE,即红、绿、蓝、近红外、红边波段。Notes: j = {1, 2, 3, 4, 5}, Bj indicates R, G, B, NIR, RE, namely, red, green, blue, near infrared, and red edge bands. (2)小波变换
二维离散小波变换是一种将图像变换到小波域的多尺度分析方法。这种二维离散小波变换将图像近似信息分解为4个分量:近似系数、水平细节系数、垂直细节系数和对角细节系数。使用共生矩阵来提取4个分量的变化特征,可分别计算得到4个分量下的能量、熵、惯性矩和相关特征,然后取不同分量下各特征的平均值,作为该图像的小波特征,各波段图像的小波特征见表2。
(3)里斯变换
里斯变换是希尔伯特变换在高维度空间上的推广,可被应用于高维度的频域转换,即可用来处理二维图像信号。设(x, y)为空域坐标,(u, v)为频域中的坐标,在空域和频域中里斯内核分别被定义为
(Rx(x,y),Ry(x,y))=(x2π|X|3,y2π|X|3) (9) (Ru(u,v),Rv(u,v))=(−iu√u2+v2,−iv√u2+v2) (10) 式中:(Rx, Ry)表示二维信号(x, y)对应的里斯内核; X=(x,y);i为虚数单位。
一阶里斯变换为图像信号本身与里斯内核做卷积操作得到,完成里斯变换后,同样计算得到各波段图像的里斯特征(表2)。
1.3 特征筛选与建模方法
1.3.1 特征筛选
采用皮尔逊相关性分析法确定各图像特征与坡垒SPAD值的相关性强度,基于显著性检验结果剔除不显著的特征。对于保留的图像特征利用基于正则化的Lasso算法再次进行特征筛选,且应用方差膨胀因子(variance inflation factor,VIF)来检验特征间是否存在多重共线性。VIF被广泛应用于多重共线性的检测[23]。一般认为,若VIF < 5,表示变量间不存在多重共线性;若5 ≤ VIF ≤ 10,表示变量间存在一定量的自相关;若VIF > 10,则表示变量间存在严重的多重共线性。
1.3.2 建模方法
采用多元线性回归(multiple linear regression,MLR)、偏最小二乘回归(partial least squares regression,PLSR)、随机森林(random forest,RF)和XGBoost算法构建坡垒SPAD值预测模型。其中,MLR为最传统的多自变量线性回归方法。PLSR可通过有机结合主成分分析与典型相关分析方法,有效避免过拟合问题[24]。RF是基于决策树发展而来的非线性机器学习算法,通过预测一组决策树来执行分类或回归问题[25],模型输出结果由决策树组内的所有树确定。XGBoost是由梯度提升决策树改进而来的高效集成学习算法,每一次迭代会在前一棵树的预测结果与真实值之间的残差的基础上生成新的树[26],具有出色的识别和拟合能力。
1.3.3 模型检验
通过7∶3的比例随机抽样,将总样本分为样本量为84的建模样本和样本量为36的检验样本,以评估模型的应用能力。随机抽样在python中完成,首先对所有样本进行有序标记,利用“sklearn”包中的“model_selection”模块以7∶3的比例对样本进行随机抽样,并记录分别被划分为建模和检验样本的有序标记,基于有序标记再次提取对应样本可复现该随机抽样结果,使得不同建模方法能够应用于相同的样本,令模型评估结果具有可比性。本研究使用决定系数(R2)、均方根误差(root mean square error,RMSE)和平均绝对误差(mean absolute error,MAE)作为评价指标。在RF和XGBoost模型的训练过程中,选用早停法进行参数寻优以确定模型参数,寻优迭代次数设置为100,目标函数为RMSE。
2. 结果与分析
2.1 坡垒冠层多光谱图像分割
图1为3种分割方法的分割结果,分割精度计算结果见表3。由表3可知:DVI + Kapur方法对多光谱图像的分割精度最高,F1达到0.917;NDVI + Kapur方法分割精度与其十分接近,F1为0.914;RVI + Kapur方法损失了更多的植株信息,F1为0.890。因此,DVI + Kapur方法为最适分割方法。
表 3 坡垒多光谱图像分割结果评价Table 3. Evaluation of segmentation results for slope barrier multispectral images分割精度指标
Segmentation accuracy indicatorRVI + Kapur DVI + Kapur NDVI + Kapur 精确率 Accuracy (P) 0.816 0.883 0.863 召回率 Recall (R) 0.980 0.952 0.971 F1 0.890 0.917 0.914 2.2 多光谱图像特征筛选
2.2.1 图像特征描述统计及其相关性分析
提取120组多光谱影像的25个多光谱植被指数和40个纹理特征,即共65个多光谱空域特征,计算其与坡垒SPAD值的相关系数并进行显著性检验,最终共有48个特征(19个植被指数和29个纹理特征)存在显著相关性。根据相关性排序,表4为相关性分别位于前10的植被指数和纹理特征的均值、相关系数及其显著性结果。其中修正叶绿素吸收反射率植被指数(modified chlorophyll absorption reflectivity index,MCARI)相关性最强,相关系数达到−0.780。
表 4 多光谱空域特征的描述统计和相关系数Table 4. Descriptive statistics and correlation coefficients of multispectral spatial domain features特征类别
Feature category特征
Feature均值 ± 标准差
Mean ± SD相关系数
Correlation coefficient (r)特征
Feature均值 ± 标准差
Mean ± SDr 植被指数
Vegetation indexMCARI 0.58 ± 0.30 −0.780*** NIR 0.48 ± 0.11 −0.588*** NDIrer 0.41 ± 0.10 −0.662*** RDVI 0.38 ± 0.10 −0.555*** RE 0.41 ± 0.11 −0.658*** NDVI3 0.52 ± 0.11 −0.495*** DVI3 0.33 ± 0.10 −0.632*** RVI3 3.33 ± 0.95 −0.477*** DVI1 0.31 ± 0.10 −0.615*** MVI 0.99 ± 0.06 −0.400*** 纹理特征
Texture featureB-Entm 0.06 ± 0.05 0.427*** B-MOIs 0.01 ± 0.01 0.349*** R-Entm 0.00 ± 0.00 0.416*** RE-Corm 0.12 ± 0.03 −0.347*** G-Cors 0.00 ± 0.00 0.403*** NIR-Ens 4.64 ± 1.15 0.347** B-MOIm 0.00 ± 0.00 0.400*** NIR-Corm 4.70 ± 1.17 0.340*** B-Corm 0.01 ± 0.01 0.375*** RE-Ents 4.72 ± 1.18 0.340*** 注:*表示图像特征与SPAD值在0.05水平上显著相关,**表示二者在0.01水平上显著相关,***表示二者在0.001水平上显著相关。下同。Notes: * indicates significant correlation between image features and SPAD values at 0.05 level, ** indicates significant correlation at 0.01 level, *** indicates significant correlation at 0.001 level. The same below. 经过傅里叶变换、小波变换、里斯变换共提取120个多光谱频域特征,最终共有49个特征(1个傅里叶特征,32个小波特征和16个里斯特征)与坡垒SPAD值存在显著相关性,表5为傅里叶特征和相关性分别位于前10的小波特征和里斯特征的均值、相关系数及显著性结果。其中B-CorsR相关性最强,相关系数达到−0.415,而保留的与坡垒SPAD值存在显著相关的小波特征数量显著高于傅里叶特征和里斯特征。
表 5 多光谱频域特征的描述统计和相关系数Table 5. Descriptive statistics and correlation coefficients of multispectral frequency domain features特征类别
Feature category特征
Feature均值 ± 标准差
Mean ± SDr 特征
Feature均值 ± 标准差
Mean ± SDr 傅里叶特征
Fourier featureG-CorsFFT 0.05 ± 0.03 −0.210* 小波特征
Wavelet featureG-EnmWT 0.92 ± 0.08 −0.401*** RE-EnmWT 0.92 ± 0.07 −0.337*** G-CorsWT 2.10 ± 1.57 −0.378*** B-EntmWT 0.18 ± 0.11 0.326*** G-EnsWT 0.30 ± 0.26 0.367*** G-EntmWT 0.19 ± 0.16 0.325*** B-CorsWT 2.46 ± 1.56 −0.357*** NIR-EnmWT 0.92 ± 0.07 −0.309*** B-EnsWT 0.28 ± 0.20 0.341*** B-EnmWT 0.93 ± 0.06 −0.308*** 里斯特征
Riesz featureB-CorsR 0.01 ± 0.01 −0.415*** R-EnmR 0.16 ± 0.06 −0.288** B-EnmR 0.18 ± 0.06 −0.373*** B-MOIsR 0.04 ± 0.02 0.277** RE-MOImR 0.01 ± 0.00 −0.346*** NIR-EnsR 2.46 ± 0.39 0.277** NIR-EnmR 0.20 ± 0.07 −0.301*** G-EnmR 0.15 ± 0.04 −0.276** RE-EnmR 0.17 ± 0.06 −0.300*** RE-EnsR 2.58 ± 0.36 0.270** 2.2.2 图像特征Lasso筛选
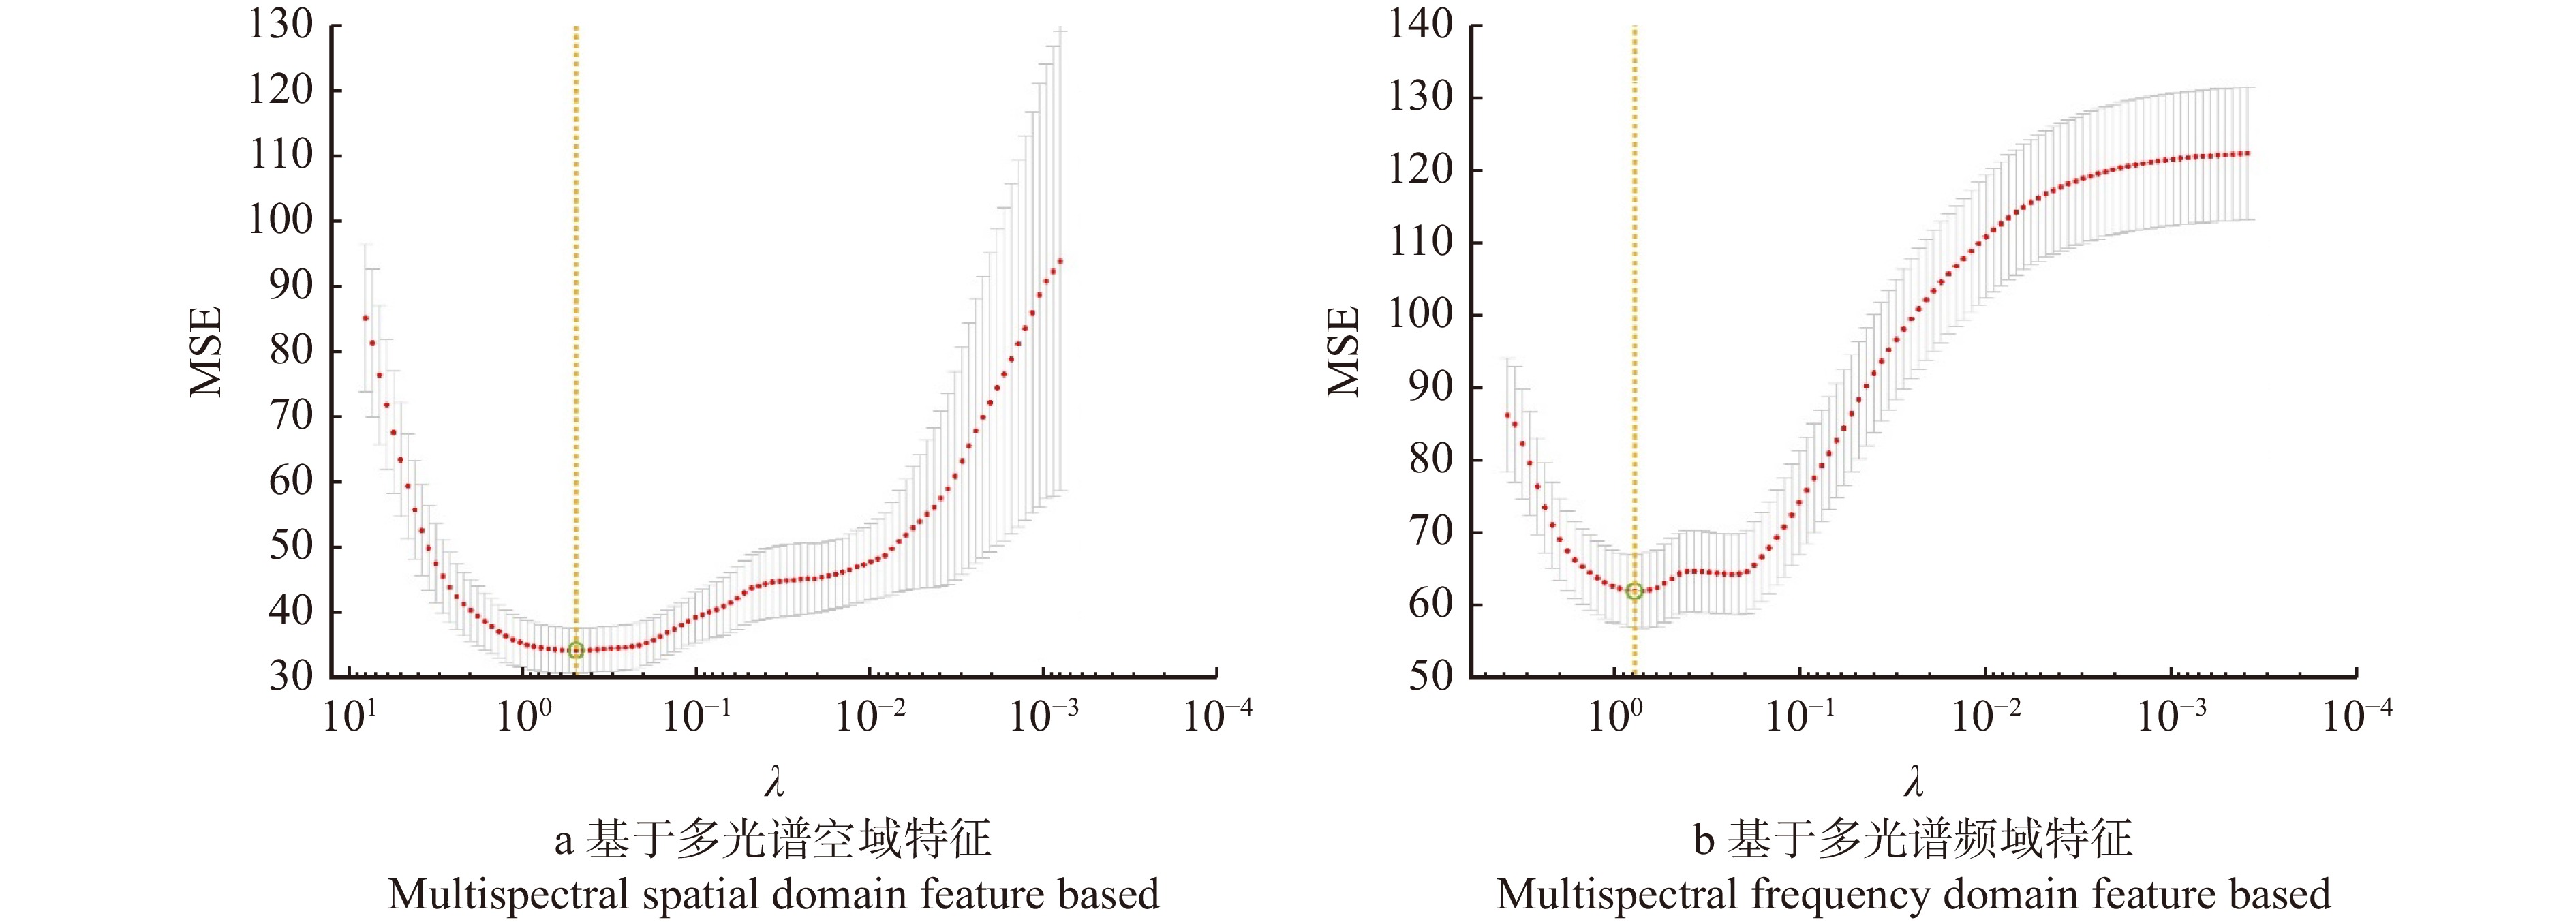
剔除了与坡垒SPAD值相关性未达到0.01水平上显著的特征,通过Lasso算法进行特征筛选消除多重共线性并降维。图2显示了Lasso算法的调整参数λ的迭代过程。表6为基于Lasso的特征筛选结果及各特征对应的VIF值,筛选后保留了9个多光谱空域特征和9个多光谱频域特征。结果显示筛选后保留特征的VIF值均小于10,多重共线性被有效消除,且特征维数被大大降低。
![]() 图 2 基于多光谱图像特征的λ迭代过程MSE为均方误差;λ为调整参数。MSE represents mean square error. λ represents tuning parameter.Figure 2. Iterative process of λ based on multispectral image features表 6 筛选后多光谱图像特征的应用方差膨胀因子(VIF)值Table 6. Variance inflation factor (VIF) values of filtered multispectral image features
图 2 基于多光谱图像特征的λ迭代过程MSE为均方误差;λ为调整参数。MSE represents mean square error. λ represents tuning parameter.Figure 2. Iterative process of λ based on multispectral image features表 6 筛选后多光谱图像特征的应用方差膨胀因子(VIF)值Table 6. Variance inflation factor (VIF) values of filtered multispectral image features特征类别
Feature category特征
FeatureVIF 特征
FeatureVIF 特征
FeatureVIF 多光谱空域特征
Multispectral spatial domain featureRE 0.705 NDIrer 0.229 B-Entm 0.729 RVI4 0.609 MCARI 2.941 RE-Ens 1.243 DVI3 2.129 B-Ens 2.947 RE-Corm 0.249 多光谱频域特征
Multispectral frequency domain featureB-EnmWT 0.042 G-EnmWT 0.017 B-MOIsR 0.012 B-EnsWT 0.042 NIR-EnmWT 0.013 B-CorsR 0.013 B-CorsWT 0.011 RE-EnmWT 0.016 RE-MOImR 0.010 2.3 坡垒相对叶绿素含量预测模型
2.3.1 多光谱空域特征模型构建
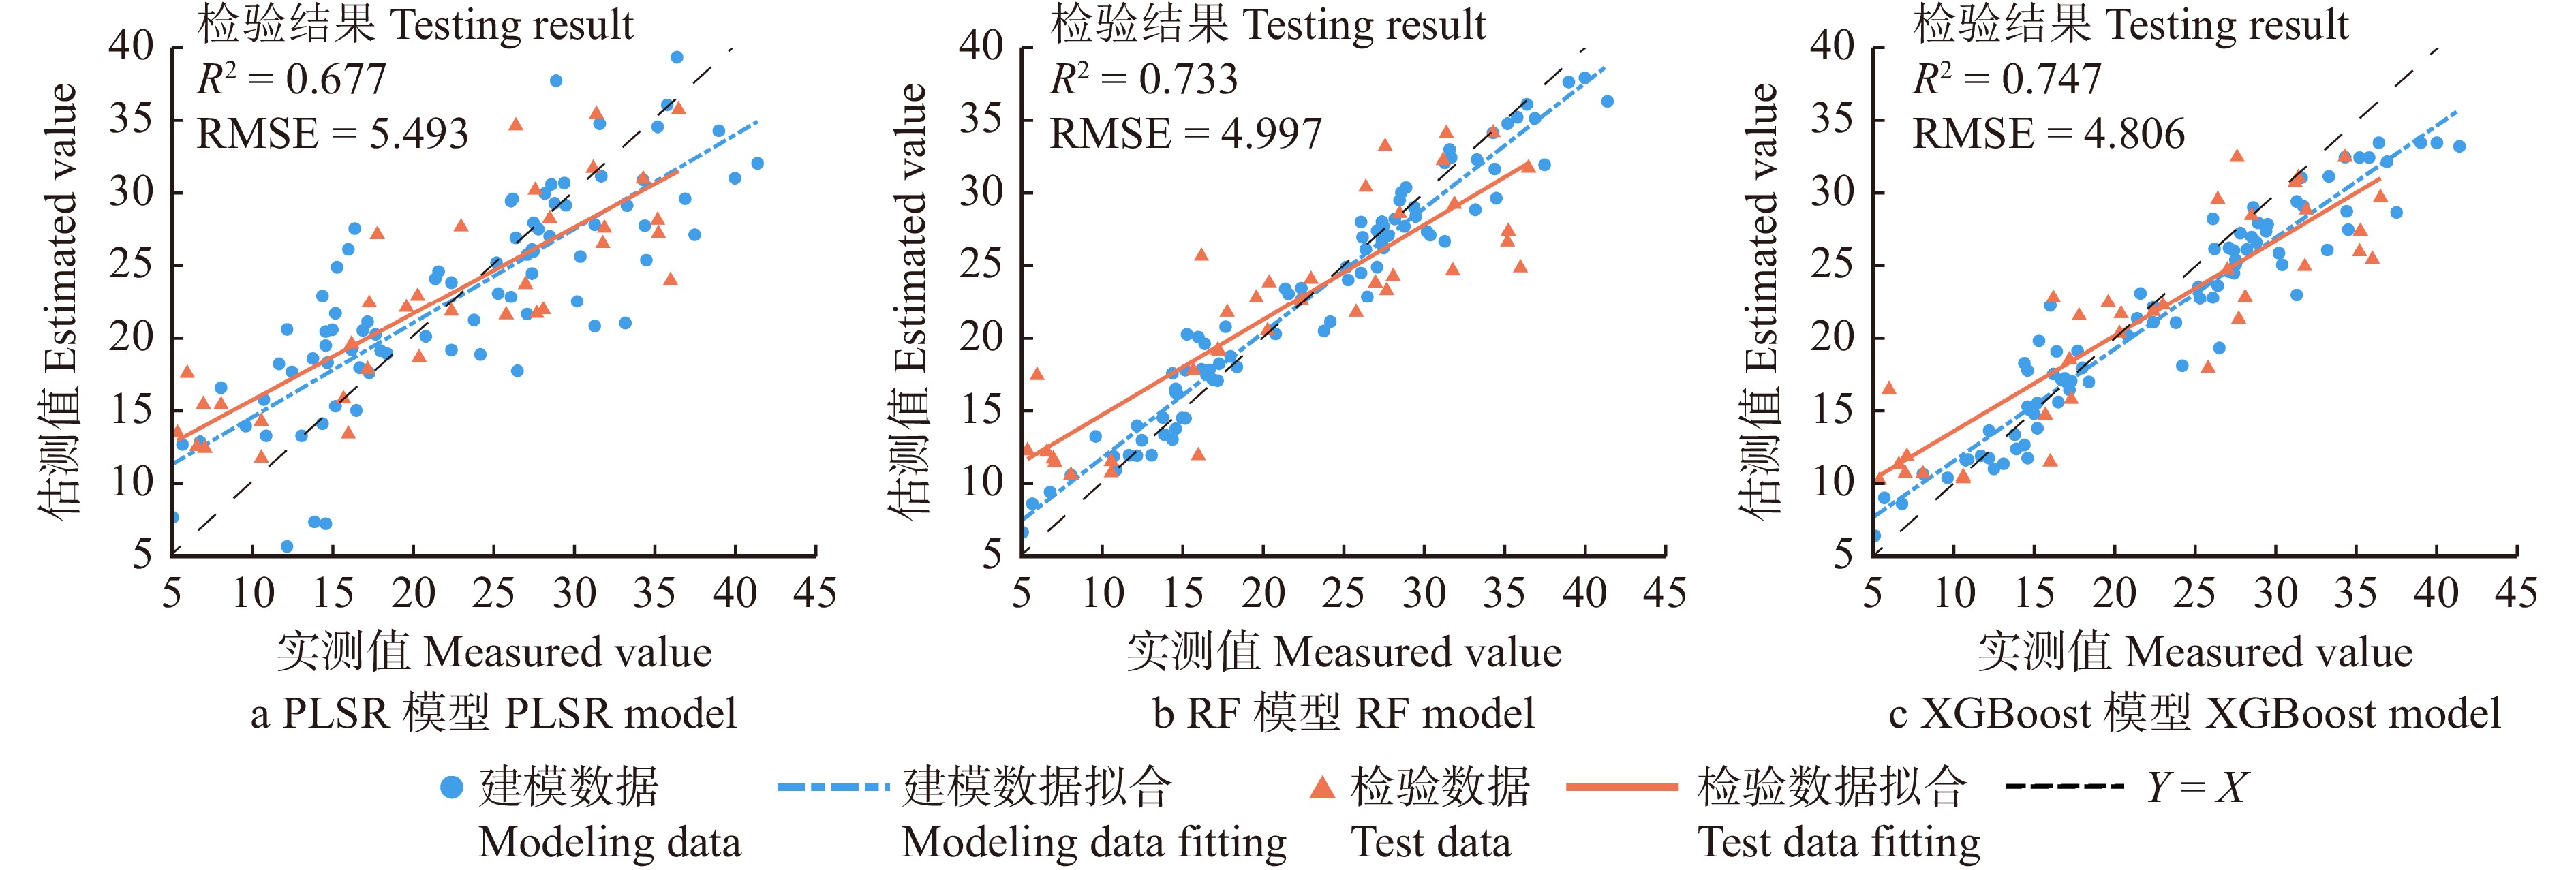
以筛选得到的9个多光谱空域特征为解释变量,分别基于PLSR、RF和XGBoost算法构建坡垒SPAD值预测模型。模型建模与检验的精度评价见表7。在建模后对参数回归模型进行F检验,MLR和PLSR模型的P值分别为1.02 × 10⁻¹³和6.94 × 10⁻⁶,通过了显著性检验,表明回归方程显著。模型建模和检验的具体结果如图3所示。
表 7 基于多光谱空域特征的预测模型评价Table 7. Evaluation of prediction model based on multispectral spatial domain features模型
Model建模 Modeling 检验 Testing R2 MAE RMSE R2 MAE RMSE MLR 0.650 4.195 5.282 0.643 4.761 5.775 PLSR 0.649 4.209 5.286 0.677 4.532 5.493 RF 0.945 1.597 2.090 0.733 4.003 4.997 XGBoost 0.868 2.430 3.239 0.747 3.821 4.860 ![]() 图 3 基于多光谱空域特征的建模和检验结果Figure 3. Modeling and verification results based on multispectral spatial domain features
图 3 基于多光谱空域特征的建模和检验结果Figure 3. Modeling and verification results based on multispectral spatial domain features基于表7评价3种模型的预测精度,并与传统MLR模型进行对比,XGBoost模型检验精度最高,R2为0.747,MAE和RMSE分别为3.821和4.860。RF模型的检验精度略低于XGBoost模型,R2达到0.733。因此,XGBoost模型可作为基于多光谱空域特征预测坡垒SPAD值的优选模型。
2.3.2 多光谱频域特征模型构建
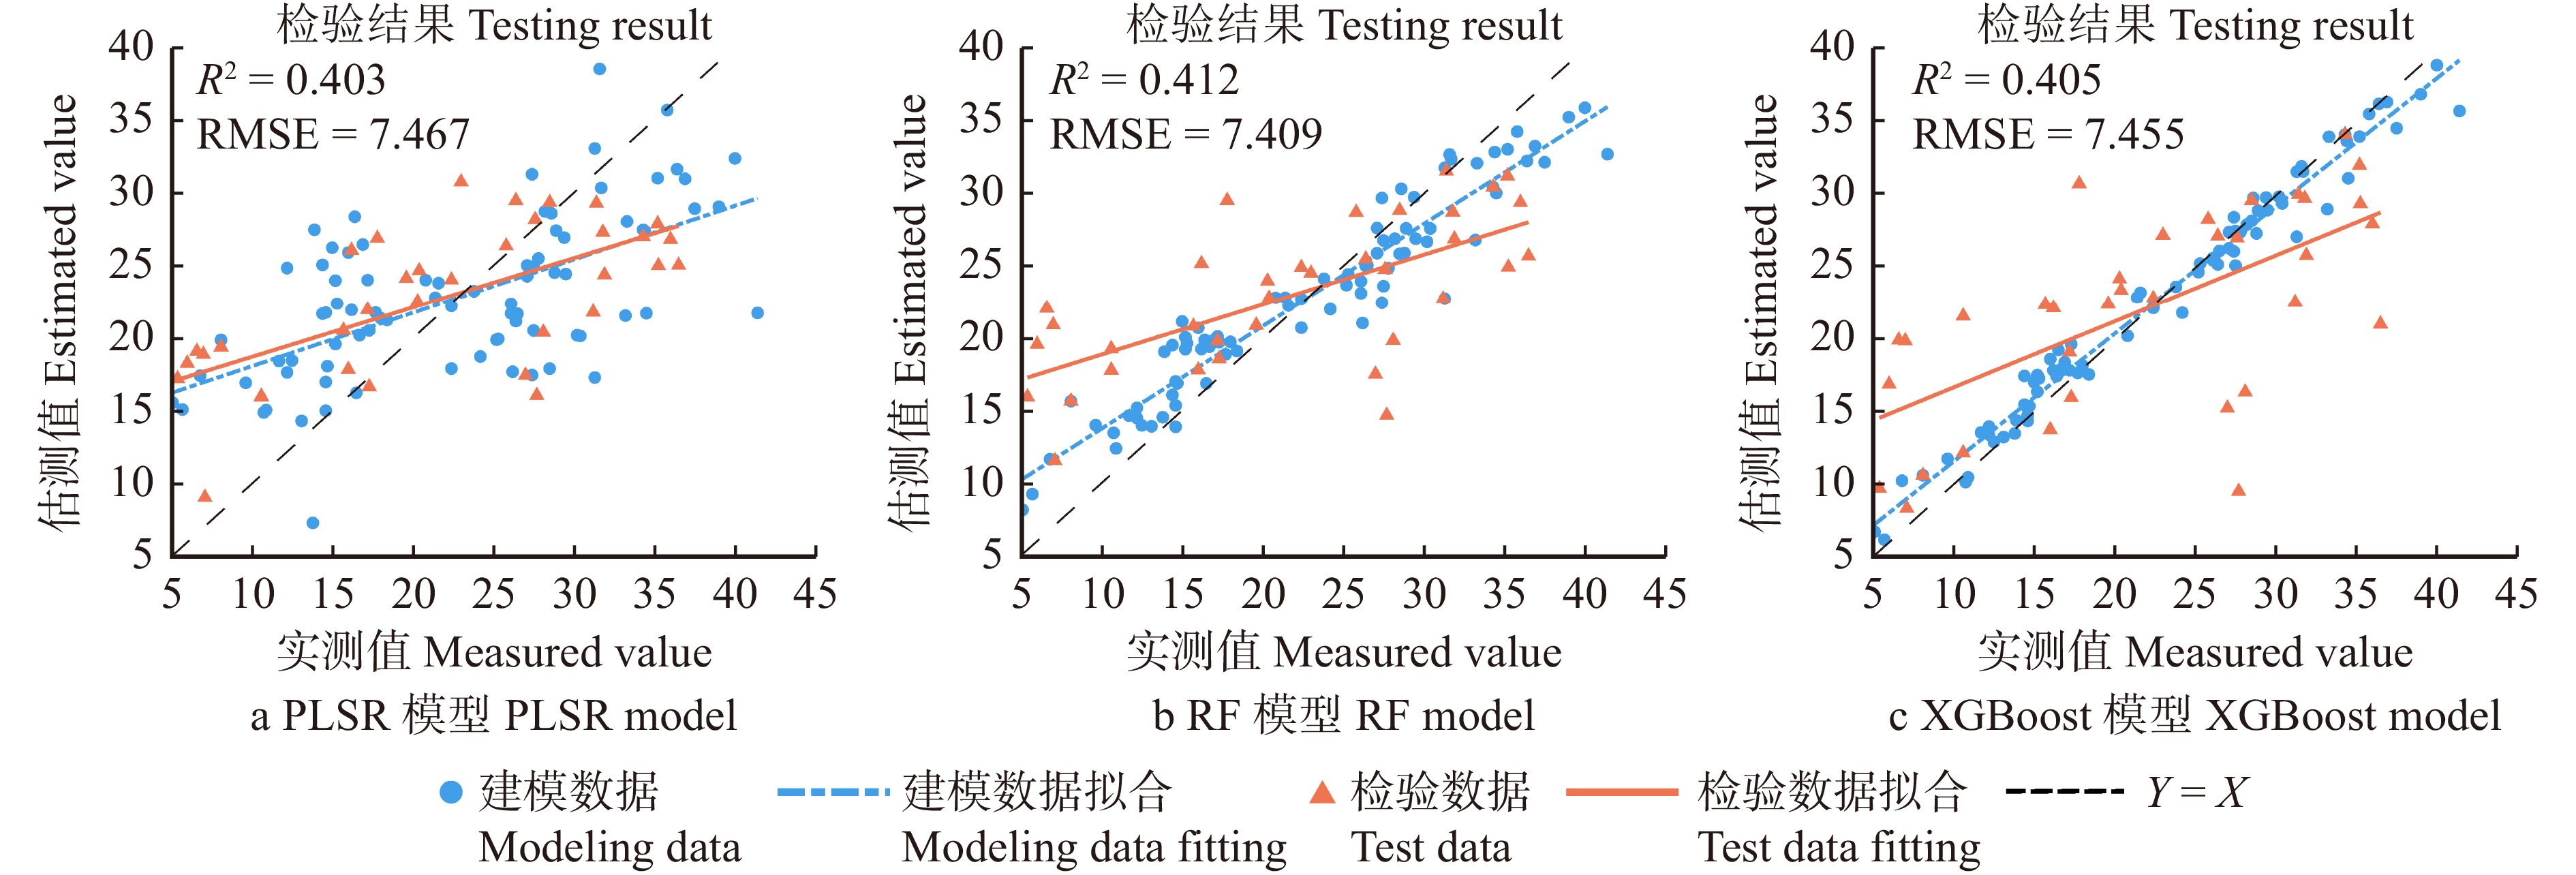
以筛选得到的9个多光谱频域特征为解释变量构建坡垒SPAD值预测模型。模型的建模与检验的精度评价见表8。在建模后对参数回归模型进行F检验,MLR和PLSR模型的P值分别为4.64 × 10⁻⁵和9.35 × 10⁻¹⁰,回归方程显著。模型建模和检验的具体结果如图4所示。
表 8 基于多光谱频域特征的预测模型评价Table 8. Evaluation of prediction model based on multispectral frequency domain features模型
Model建模 Modeling 检验 Testing R2 MAE RMSE R2 MAE RMSE MLR 0.369 5.990 7.092 0.402 0.424 7.470 PLSR 0.369 5.900 7.092 0.403 6.321 7.467 RF 0.866 2.696 3.274 0.412 6.035 7.409 XGBoost 0.968 1.169 1.609 0.405 5.586 7.455 ![]() 图 4 基于多光谱频域特征的建模和检验结果Figure 4. Modeling and verification results based on multispectral frequency domain features
图 4 基于多光谱频域特征的建模和检验结果Figure 4. Modeling and verification results based on multispectral frequency domain features基于表8评价3种模型的预测精度,并与MLR模型进行对比,在模型检验中,MLR、PLSR、RF和XGBoost模型的检验效果十分接近,其中RF模型的检验R2略高,为0.412,MAE和RMSE分别为6.035和7.409。因此RF模型可作为基于多光谱频域特征预测坡垒SPAD值的优选模型。此外,相较于多光谱空域特征模型,基于MLR、PLSR、RF、XGBoost算法的融合特征模型的精度均降低了。因此,虽然多光谱频域特征对坡垒SPAD值具有一定的解释能力,但多光谱空域特征相较于频域特征,在对坡垒SPAD值的预测方面仍具有显著优势。
2.3.3 多光谱融合特征模型构建
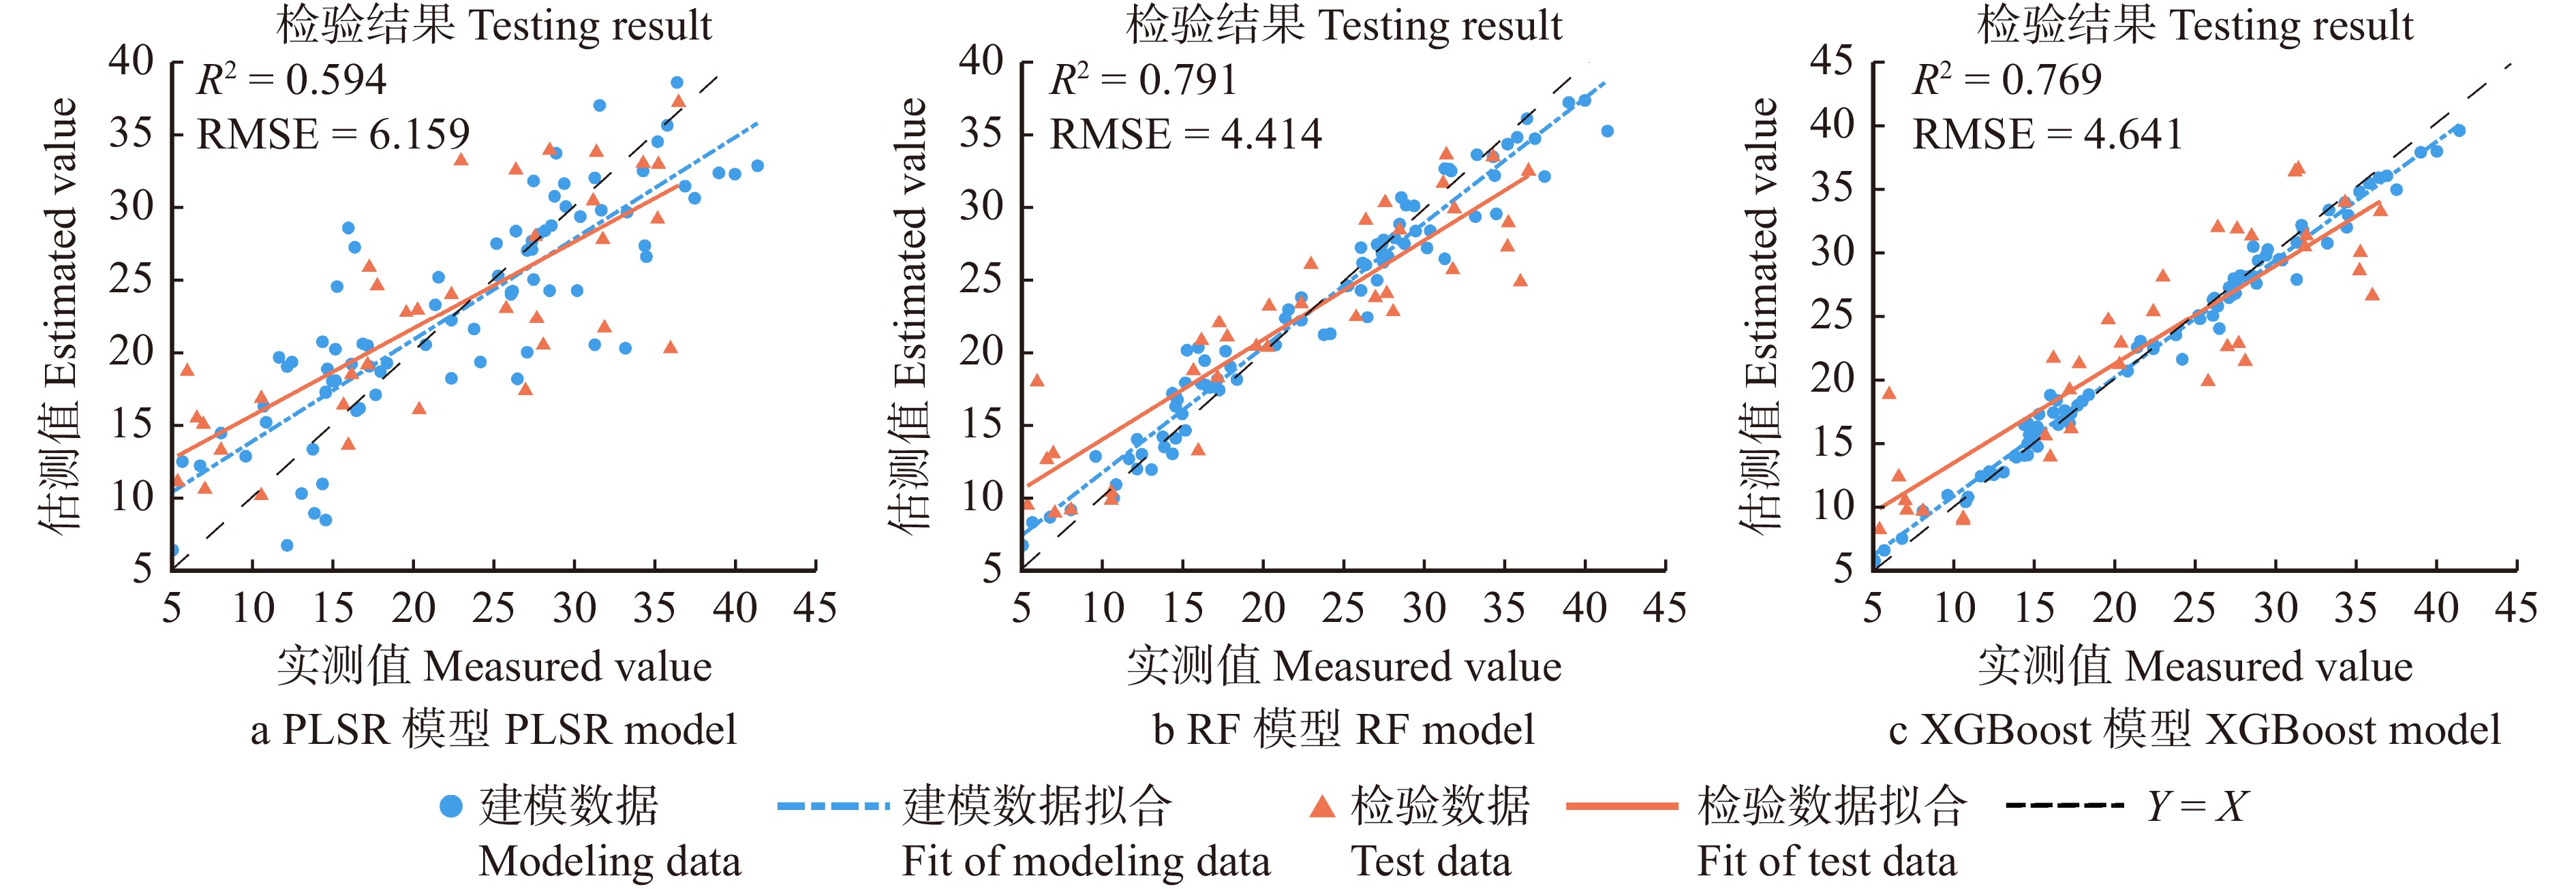
将筛选得到的9个多光谱空域特征和9个频域特征共同作为解释变量,构建坡垒SPAD值预测模型。模型的建模与检验的精度评价见表9。在建模后对参数回归模型进行F检验,MLR和PLSR模型的P值分别为5.83 × 10⁻¹¹和2.21 × 10⁻¹⁵,回归方程显著。模型建模和检验的具体结果如图5所示。
表 9 基于多光谱融合特征的预测模型评价Table 9. Evaluation of prediction model based on multispectral fusion features模型
Model建模 Modeling 检验 Testing R2 MAE RMSE R2 MAE RMSE MLR 0.700 3.806 4.894 0.537 5.074 6.576 PLSR 0.699 3.813 4.898 0.594 4.899 6.159 RF 0.947 1.552 2.056 0.791 3.431 4.414 XGBoost 0.984 0.822 1.126 0.769 3.86 4.641 ![]() 图 5 基于多光谱融合特征的建模和检验结果Figure 5. Modeling and verification results based on multispectral fusion features
图 5 基于多光谱融合特征的建模和检验结果Figure 5. Modeling and verification results based on multispectral fusion features基于表9评价3种模型的预测精度,并与MLR模型进行对比,RF和XGBoost模型依然获得了更优的检验效果,其中RF模型检验精度最高,R2为0.791,MAE和RMSE为3.431和4.414。XGBoost模型的检验精度略低于RF模型,R2为0.769,PLSR检验精度最低,R2为0.594。因此,RF模型可作为基于多光谱融合特征预测坡垒SPAD值的优选模型。
相较于单空域或单频域特征模型,基于RF、XGBoost算法的融合特征模型的精度均获得了提高。以优选模型RF模型为例,融合特征模型较多光谱空域特征模型的R2提高了7.9%,MAE和RMSE分别降低了14.3%和11.7%,较多光谱频域特征模型的R2提高了92.0%,MAE和RMSE分别降低了43.1%和40.4%。
3. 讨 论
植被指数、纹理特征可以在一定程度上反映植物的生长状况和冠层形态差异等。频域特征则能挖掘图像中的微动信息,从而与植物生长生理状态产生联系。叶绿素含量的变化能够引起叶片颜色变化,在图像的光谱、纹理和频域信息上也有所体现[4,8]。根据相关性分析可以确定相对叶绿素含量预测的优选图像特征,在一项研究中,绿色归一化差分指数被认为是红树林叶绿素含量最好的监测指标[27]。而在本研究中,MCARI对幼龄坡垒SPAD值的变化具有最高解释能力,相关性最高。因此,若使用单图像特征反映幼龄坡垒相对叶绿素含量,MCARI可作为优选指标。这与前人研究结果不同,是由于不同植物间的生理特征差异会导致图像特征适用性的差异。此外,本研究选取的图像特征有限,因此在未来仍需引入或构建其他指数,探索能够有效反映幼龄坡垒相对叶绿素含量的最佳指标。
在基于多光谱空频域特征建模的对比分析中,空域特征表现了优于频域特征的性能,大量频域指数也均表现了与SPAD值的显著相关性,这与Zhuo等[8]的研究结果(频域指数的表现优于纯光谱指数)存在差异,但也存在一致性,即融合特征对SPAD值的预测精度优于单类特征,证明了频域指数在预测幼龄坡垒SPAD值方面的巨大潜力,也表明了频域特征引入的必要性和可行性。此外,本研究还对比了傅里叶变换、小波变换和里斯变换3种方式下的频域特征的性能,结果表明小波特征和里斯特征的性能要优于傅里叶变换特征,这与此前Yang等[7]应用小波特征反演叶绿素含量的研究结果具有一致性,证明了小波特征的应用潜力。但此前研究未能考虑到里斯特征对植物相对叶绿素含量变化的解释能力,因此本研究对引入的3种频域特征进行对比分析具有一定的现实意义。此外,在未来的研究中还可进一步挖掘不同图像频域信息对植物相对叶绿素含量预测的应用潜力。
此外,在以往的研究中,传统的参数模型算法[28]和近年来发展迅速的机器学习算法[29]都已被应用于植物养分含量或生长特征的图像预测。本研究比较了传统模型(PLSR)和机器学习模型(RF和XGBoost)的性能,证明了在预测幼龄坡垒SPAD值方面,RF和XGBoost模型能够获得比PLSR更强的拟合效果。值得注意的是,虽然RF和XGBoost模型采用不同方式来避免过拟合[26,30],但由于参数复杂,过拟合问题依然容易产生。在本研究中,采用了早停法确定优选参数以避免过拟合现象,研究结果表明虽然在空域特征和融合特征模型中,RF和XGBoost均获得了良好的检验精度,但依然与建模精度存在明显差异,仍存在一定的过拟合现象。因此,在未来的研究中,将考虑引入更多的智能参数寻优方法,以探索更优的避免过拟合的参数确定方法。
4. 结 论
基于幼龄坡垒的SPAD值与相应的多光谱图像特征的相关性分析结果,多光谱空域特征较频域特征对坡垒SPAD值的变化更为敏感,但二者均表现了对坡垒相对叶绿素含量预测的应用潜力。其中MCARI可作为基于单图像特征预测坡垒SPAD值的优选特征,相关性最强,达到−0.780。而在3种频域变换方法中,基于对相关性分析和显著性筛选结果,小波变换为优选多光谱图像频域变换方法,其次为里斯变换,傅里叶特征表现较差。
此外,基于不同特征不同算法下的幼龄坡垒SPAD值预测模型的评价对比结果,引入多光谱频域特征可以有效提高坡垒SPAD值预测精度,具体不同输入特征下的模型预测精度排序为单频域特征模型 < 单空域特征模型 < 融合特征模型。而在不同算法下的多光谱空、频、融合特征模型中,XGBoost模型精度与RF模型精度相近,XGBoost和RF算法为多光谱图像特征预测幼龄坡垒SPAD值的优选建模方法。
-
![]()
图 2 基于多光谱图像特征的λ迭代过程
MSE为均方误差;λ为调整参数。MSE represents mean square error. λ represents tuning parameter.
Figure 2. Iterative process of λ based on multispectral image features
![]()
图 3 基于多光谱空域特征的建模和检验结果
Figure 3. Modeling and verification results based on multispectral spatial domain features
![]()
图 4 基于多光谱频域特征的建模和检验结果
Figure 4. Modeling and verification results based on multispectral frequency domain features
![]()
图 5 基于多光谱融合特征的建模和检验结果
Figure 5. Modeling and verification results based on multispectral fusion features
表 1 植被指数及其计算公式
Table 1 Vegetation index and its calculation formula
植被指数
Vegetation index计算式
Calculation formula植被指数
Vegetation index计算式
Calculation formula归一化红边绿指数
Normalized difference
red edge-green index (NDIreg)[14]NDIreg = (RRE – RG)/(RRE + RG) 红边植被指数
Red-edge vegetation index (REVI)[17]REVI = RNIR/RRE – 1 归一化红边红指数
Normalized difference
red edge-red index (NDIrer)[14]NDIrer =(RRE – RR)/(RRE + RR) 修正叶绿素吸收反射率植被指数
Modified chlorophyll absorption
reflectivity index (MCARI)[18]MCARI =
[RRE – RR – 0.2(RRE – RG)] RRE/RR增强型植被指数
Enhanced vegetation
index (EVI)[15]EVI = 2.5(RNIR – RR)/(RNIR + 6RR – 7.5RB + 1) 改进简单比值植被指数
Modified simple ratio vegetation
index (MSR)[19]MSR=(RNIR/RR−1)/√RNIR/RR+1 重归一化差异指数
Renormalized difference
vegetation index (RDVI)[16]RDVI=(RNIR−RR)/√RNIR+RR 修正植被指数
Modified vegetation index (MVI)[20]MVI=√(RNIR−RR)/(RNIR+RR)+0.5 注: RR、RG、RB、RNIR、RRE分别表示红、绿、蓝、近红外、红边波段反射率。 Note: RR, RG, RB, RNIR, RRE indicate reflectivity of red, green, blue, near infrared, and red edge bands, respectively.  下载: 导出CSV
表 2 频域特征
Table 2 Frequency domain features
方法
Method特征
Feature命名
Naming特征
Feature命名
Naming特征
Feature命名
Naming特征
Feature命名
Naming傅里叶变换
Fourier transform能量–均值
Energy-meanBj-EnmFFT 熵–均值
Entropy-meanBj-EntmFFT 惯性矩–均值
MOI-meanBj-MOImFFT 相关–均值
Correlation-meanBj-CormFFT 能量–标准差
Energy-SDBj-EnsFFT 熵–标准差
Entropy-SDBj-EntsFFT 惯性矩–标准差
MOI-SDBj-MOIsFFT 相关–标准差
Correlation-SDBj-CorsFFT 小波变换
Wavelet transform能量–均值
Energy-meanBj-EnmWT 熵–均值
Entropy-meanBj-EntmWT 惯性矩–均值
MOI-meanBj-MOImWT 相关–均值
Correlation-meanBj-CormWT 能量–标准差
Energy-SDBj-EnsWT 熵–标准差
Entropy-SDBj-EntsWT 惯性矩–标准差
MOI-SDBj-MOIsWT 相关–标准差
Correlation-SDBj-CorsWT 里斯变换
Riesz transform能量–均值
Energy-meanBj-EnmR 熵–均值
Entropy-meanBj-EntmR 惯性矩–均值
MOI-meanBj-MOImR 相关–均值
Correlation-meanBj-CormR 能量–标准差
Energy-SDBj-EnsR 熵–标准差
Entropy-SDBj-EntsR 惯性矩–标准差
MOI-SDBj-MOIsR 相关–标准差
Correlation-SDBj-CorsR 注:j = {1, 2, 3, 4, 5},对应的Bj分别为R、G、B、NIR、RE,即红、绿、蓝、近红外、红边波段。Notes: j = {1, 2, 3, 4, 5}, Bj indicates R, G, B, NIR, RE, namely, red, green, blue, near infrared, and red edge bands.
下载: 导出CSV
表 3 坡垒多光谱图像分割结果评价
Table 3 Evaluation of segmentation results for slope barrier multispectral images
分割精度指标
Segmentation accuracy indicatorRVI + Kapur DVI + Kapur NDVI + Kapur 精确率 Accuracy (P) 0.816 0.883 0.863 召回率 Recall (R) 0.980 0.952 0.971 F1 0.890 0.917 0.914
下载: 导出CSV
表 4 多光谱空域特征的描述统计和相关系数
Table 4 Descriptive statistics and correlation coefficients of multispectral spatial domain features
特征类别
Feature category特征
Feature均值 ± 标准差
Mean ± SD相关系数
Correlation coefficient (r)特征
Feature均值 ± 标准差
Mean ± SDr 植被指数
Vegetation indexMCARI 0.58 ± 0.30 −0.780*** NIR 0.48 ± 0.11 −0.588*** NDIrer 0.41 ± 0.10 −0.662*** RDVI 0.38 ± 0.10 −0.555*** RE 0.41 ± 0.11 −0.658*** NDVI3 0.52 ± 0.11 −0.495*** DVI3 0.33 ± 0.10 −0.632*** RVI3 3.33 ± 0.95 −0.477*** DVI1 0.31 ± 0.10 −0.615*** MVI 0.99 ± 0.06 −0.400*** 纹理特征
Texture featureB-Entm 0.06 ± 0.05 0.427*** B-MOIs 0.01 ± 0.01 0.349*** R-Entm 0.00 ± 0.00 0.416*** RE-Corm 0.12 ± 0.03 −0.347*** G-Cors 0.00 ± 0.00 0.403*** NIR-Ens 4.64 ± 1.15 0.347** B-MOIm 0.00 ± 0.00 0.400*** NIR-Corm 4.70 ± 1.17 0.340*** B-Corm 0.01 ± 0.01 0.375*** RE-Ents 4.72 ± 1.18 0.340*** 注:*表示图像特征与SPAD值在0.05水平上显著相关,**表示二者在0.01水平上显著相关,***表示二者在0.001水平上显著相关。下同。Notes: * indicates significant correlation between image features and SPAD values at 0.05 level, ** indicates significant correlation at 0.01 level, *** indicates significant correlation at 0.001 level. The same below.
下载: 导出CSV
表 5 多光谱频域特征的描述统计和相关系数
Table 5 Descriptive statistics and correlation coefficients of multispectral frequency domain features
特征类别
Feature category特征
Feature均值 ± 标准差
Mean ± SDr 特征
Feature均值 ± 标准差
Mean ± SDr 傅里叶特征
Fourier featureG-CorsFFT 0.05 ± 0.03 −0.210* 小波特征
Wavelet featureG-EnmWT 0.92 ± 0.08 −0.401*** RE-EnmWT 0.92 ± 0.07 −0.337*** G-CorsWT 2.10 ± 1.57 −0.378*** B-EntmWT 0.18 ± 0.11 0.326*** G-EnsWT 0.30 ± 0.26 0.367*** G-EntmWT 0.19 ± 0.16 0.325*** B-CorsWT 2.46 ± 1.56 −0.357*** NIR-EnmWT 0.92 ± 0.07 −0.309*** B-EnsWT 0.28 ± 0.20 0.341*** B-EnmWT 0.93 ± 0.06 −0.308*** 里斯特征
Riesz featureB-CorsR 0.01 ± 0.01 −0.415*** R-EnmR 0.16 ± 0.06 −0.288** B-EnmR 0.18 ± 0.06 −0.373*** B-MOIsR 0.04 ± 0.02 0.277** RE-MOImR 0.01 ± 0.00 −0.346*** NIR-EnsR 2.46 ± 0.39 0.277** NIR-EnmR 0.20 ± 0.07 −0.301*** G-EnmR 0.15 ± 0.04 −0.276** RE-EnmR 0.17 ± 0.06 −0.300*** RE-EnsR 2.58 ± 0.36 0.270**
下载: 导出CSV
表 6 筛选后多光谱图像特征的应用方差膨胀因子(VIF)值
Table 6 Variance inflation factor (VIF) values of filtered multispectral image features
特征类别
Feature category特征
FeatureVIF 特征
FeatureVIF 特征
FeatureVIF 多光谱空域特征
Multispectral spatial domain featureRE 0.705 NDIrer 0.229 B-Entm 0.729 RVI4 0.609 MCARI 2.941 RE-Ens 1.243 DVI3 2.129 B-Ens 2.947 RE-Corm 0.249 多光谱频域特征
Multispectral frequency domain featureB-EnmWT 0.042 G-EnmWT 0.017 B-MOIsR 0.012 B-EnsWT 0.042 NIR-EnmWT 0.013 B-CorsR 0.013 B-CorsWT 0.011 RE-EnmWT 0.016 RE-MOImR 0.010
下载: 导出CSV
表 7 基于多光谱空域特征的预测模型评价
Table 7 Evaluation of prediction model based on multispectral spatial domain features
模型
Model建模 Modeling 检验 Testing R2 MAE RMSE R2 MAE RMSE MLR 0.650 4.195 5.282 0.643 4.761 5.775 PLSR 0.649 4.209 5.286 0.677 4.532 5.493 RF 0.945 1.597 2.090 0.733 4.003 4.997 XGBoost 0.868 2.430 3.239 0.747 3.821 4.860
下载: 导出CSV
表 8 基于多光谱频域特征的预测模型评价
Table 8 Evaluation of prediction model based on multispectral frequency domain features
模型
Model建模 Modeling 检验 Testing R2 MAE RMSE R2 MAE RMSE MLR 0.369 5.990 7.092 0.402 0.424 7.470 PLSR 0.369 5.900 7.092 0.403 6.321 7.467 RF 0.866 2.696 3.274 0.412 6.035 7.409 XGBoost 0.968 1.169 1.609 0.405 5.586 7.455
下载: 导出CSV
表 9 基于多光谱融合特征的预测模型评价
Table 9 Evaluation of prediction model based on multispectral fusion features
模型
Model建模 Modeling 检验 Testing R2 MAE RMSE R2 MAE RMSE MLR 0.700 3.806 4.894 0.537 5.074 6.576 PLSR 0.699 3.813 4.898 0.594 4.899 6.159 RF 0.947 1.552 2.056 0.791 3.431 4.414 XGBoost 0.984 0.822 1.126 0.769 3.86 4.641
下载: 导出CSV
-
[1] Ly V, Nanthavong K, Pooma R, et al. Hopea hainanensis[Z/OL]. IUCN Red List of Threatened Species, 2018: e.T32357A2816074[2023−04−11]. https://dx.doi.org/10.2305/IUCN.UK.2018-1.RLTS.T32357A2816074.en.
[2] 陈澜, 常庆瑞, 高一帆, 等. 猕猴桃叶片叶绿素含量高光谱估算模型研究[J]. 西北农林科技大学学报(自然科学版), 2020, 48(6): 79−89. Chen L, Chang Q R, Gao Y F, et al. Hyperspectral estimation model of chlorophyll content in kiwifruit leaves[J]. Journal of Northwest A&F University (Natural Science Edition), 2020, 48(6): 79−89.
[3] Qi H X, Wu Z Y, Zhang L, et al. Monitoring of peanut leaves chlorophyll content based on drone-based multispectral image feature extraction[J]. Computers and Electronics in Agriculture, 2021, 187: 106292. doi: 10.1016/j.compag.2021.106292
[4] Sun Q, Chen L P, Xu X B, et al. A new comprehensive index for monitoring maize lodging severity using UAV-based multi-spectral imagery[J]. Computers and Electronics in Agriculture, 2022, 202: 107362. doi: 10.1016/j.compag.2022.107362
[5] 李永亮, 张怀清, 林辉. 基于红边参数与PCA的GA-BP神经网络估算叶绿素含量模型[J]. 林业科学, 2012, 48(9): 22−29. Li Y L, Zhang H Q, Lin H. GA-BP neural network estimation models of chlorophyll content based on red edge parameters and PCA[J]. Scientia Silvae Sinicae, 2012, 48(9): 22−29.
[6] Lin C W, Ding Q, Tu W H, et al. Fourier dense network to conduct plant classification using UAV-based optical images[J]. IEEE Access, 2019, 7: 17736−17749. doi: 10.1109/ACCESS.2019.2895243
[7] Yang B, Wang M, Sha Z, et al. Evaluation of aboveground nitrogen content of winter wheat using digital imagery of unmanned aerial vehicles[J]. Sensors, 2019, 19(20): 4416. doi: 10.3390/s19204416
[8] Zhuo W, Wu N, Shi R, et al. UAV Mapping of the chlorophyll content in a tidal flat wetland using a combination of spectral and frequency indices[J]. Remote Sensing, 2022, 14(4): 827. doi: 10.3390/rs14040827
[9] Bao Q Z, Gao J H, Chen W C. Local adaptive shrinkage threshold denoising using curvelet coefficients[J]. Electronics Letters, 2008, 44(4): 277−278. doi: 10.1049/el:20082831
[10] Wang Y P, Chang Y C, Shen Y. Estimation of nitrogen status of paddy rice at vegetative phase using unmanned aerial vehicle based multispectral imagery[J]. Precision Agriculture, 2022, 23(1): 1−17. doi: 10.1007/s11119-021-09823-w
[11] Suh H K, Hofstee J W, van Henten E J. Investigation on combinations of colour indices and threshold techniques in vegetation segmentation for volunteer potato control in sugar beet[J]. Computers and Electronics in Agriculture, 2020, 179: 105819. doi: 10.1016/j.compag.2020.105819
[12] Huang S Y, Miao Y X, Yuan F, et al. Potential of RapidEye and WorldView-2 satellite data for improving rice nitrogen status monitoring at different growth stages[J]. Remote Sensing, 2017, 9(3): 227. doi: 10.3390/rs9030227
[13] Prey L, Hu Y C, Schmidhalter U. High-throughput field phenotyping traits of grain yield formation and nitrogen use efficiency: optimizing the selection of vegetation indices and growth stages[J]. Frontiers in Plant Science, 2020, 10: 1672. doi: 10.3389/fpls.2019.01672
[14] 苏伟, 王伟, 刘哲, 等. 无人机影像反演玉米冠层LAI和叶绿素含量的参数确定[J]. 农业工程学报, 2020, 36(19): 58−65. Su W, Wang W, Liu Z, et al. Determining the retrieving parameters of corn canopy LAI and chlorophyll content computed using UAV image[J]. Transactions of the Chinese Society of Agricultural Engineering, 2020, 36(19): 58−65.
[15] Huete A R, Liu H Q, Batchily K, et al. A comparison of vegetation indices over a global set of TM images for EOS-MODIS[J]. Remote Sensing of Environment, 1997, 59(3): 440−451. doi: 10.1016/S0034-4257(96)00112-5
[16] Roujean J L, Breon F M. Estimating PAR absorbed by vegetation from bidirectional reflectance measurements[J]. Remote Sensing of Environment, 1995, 51(3): 375−384. doi: 10.1016/0034-4257(94)00114-3
[17] Gitelson A A, Kaufman Y J, Stark R, et al. Novel algorithms for remote estimation of vegetation fraction[J]. Remote Sensing of Environment, 2002, 80(1): 76−87. doi: 10.1016/S0034-4257(01)00289-9
[18] Daughtry C S T, Walthall C L, Kim M S, et al. Estimating corn leaf chlorophyll concentration from leaf and canopy reflectance[J]. Remote Sensing of Environment, 2000, 74(2): 229−239. doi: 10.1016/S0034-4257(00)00113-9
[19] Chen J M. Evaluation of vegetation indices and a modified simple ratio for boreal applications[J]. Canadian Journal of Remote Sensing, 1996, 22(3): 229−242. doi: 10.1080/07038992.1996.10855178
[20] McDaniel K C, Haas R H. Assessing mesquite-grass vegetation condition from Landsat[J]. Photogrammetric Engineering and Remote Sensing, 1982, 48(3): 441−450.
[21] Harwikarya, Ramayanti D. Feature textures extraction of macroscopic image of jatiwood ( Tectona Grandy) based on gray level co-occurence matrix[J]. IOP Conference Series:Materials Science and Engineering, 2018, 453: 012046. doi: 10.1088/1757-899X/453/1/012046
[22] Kauffmann L, Chauvin A, Guyader N, et al. Rapid scene categorization: role of spatial frequency order, accumulation mode and luminance contrast[J]. Vision Research, 2015, 107: 49−57. doi: 10.1016/j.visres.2014.11.013
[23] 张孟库, 姜立春. 基于机器学习的落叶松树皮厚度预测[J]. 北京林业大学学报, 2022, 44(6): 54−62. Zhang M K, Jiang L C. Prediction of bark thickness for Larix gmelinii based on machine learning[J]. Journal of Beijing Forestry University, 2022, 44(6): 54−62.
[24] 杨灵玉, 高小红, 张威, 等. 基于Hyperion影像植被光谱的土壤重金属含量空间分布反演: 以青海省玉树县为例[J]. 应用生态学报, 2016, 27(6): 1775−1784. Yang L Y, Gao X H, Zhang W, et al. Estimating heavy metal concentrations in topsoil from vegetation reflectance spectra of Hyperion images: a case study of Yushu County, Qinghai, China[J]. Chinese Journal of Applied Ecology, 2016, 27(6): 1775−1784.
[25] Breiman L. Random forests[J]. Machine Learning, 2001, 45(1): 5−32. doi: 10.1023/A:1010933404324
[26] Zhang J J, Cheng T, Guo W, et al. Leaf area index estimation model for UAV image hyperspectral data based on wavelength variable selection and machine learning methods[J]. Plant Methods, 2021, 17: 49. doi: 10.1186/s13007-021-00750-5
[27] Gholizadeh H, Robeson S M, Rahman A F. Comparing the performance of multispectral vegetation indices and machine-learning algorithms for remote estimation of chlorophyll content: a case study in the Sundarbans mangrove forest[J]. International Journal of Remote Sensing, 2015, 36(12): 3114−3133. doi: 10.1080/01431161.2015.1054959
[28] Liu Y, Hatou K, Aihara T, et al. A robust vegetation index based on different UAV RGB images to estimate SPAD values of naked barley leaves[J]. Remote Sensing, 2021, 13(4): 686. doi: 10.3390/rs13040686
[29] Qiu Z C, Ma F, Li Z W, et al. Estimation of nitrogen nutrition index in rice from UAV RGB images coupled with machine learning algorithms[J]. Computers and Electronics in Agriculture, 2021, 189: 106421. doi: 10.1016/j.compag.2021.106421
[30] Xie X, Zhang X, Shen J, et al. Poplar’s waterlogging resistance modeling and evaluating: exploring and perfecting the feasibility of machine learning methods in plant science[J]. Frontiers in Plant Science, 2022, 13: 821365. doi: 10.3389/fpls.2022.821365
-
期刊类型引用(14)
1. 魏广阔,闫升,赵廷宁,杨建英,贾志刚,李瑞鹏. 不同植被类型对河北张宣矿区铁尾矿土壤物理性质影响及评价. 中国水土保持科学(中英文). 2025(01): 159-167 .  百度学术
百度学术
2. 珊丹,崔崴,邢恩德,杨凌云. 矿山废弃地植被恢复对土壤养分的影响与评价. 山西农业大学学报(自然科学版). 2024(01): 101-110 . 百度学术
3. 周欣. 基于最小数据集的祁连山青海云杉森林土壤质量评价. 农业灾害研究. 2024(08): 270-272 . 百度学术
4. 俞琦,胡劭骥,申欣凯,曲来叶. 基于CNKI文献分析下不同生态系统土壤质量评价研究. 安徽农学通报. 2023(04): 104-113 . 百度学术
5. 张垚,白秀梅,郭汉清,杨秀清,亢晨波,刘洋,马文硕. 基于最小数据集的关帝山典型植被类型土壤质量评价. 山西农业科学. 2022(05): 675-681 . 百度学术
6. 珊丹,郭建英,荣浩,王小莉,张铁钢,邢恩德,吴旭南. 施肥对干旱半干旱草原区金属矿山尾矿库土壤质量的影响及其评价. 安全与环境工程. 2022(03): 208-217 . 百度学术
7. 张垚,白秀梅,郭汉清,亢晨波. 基于最小数据集的矿区复垦土壤质量分析. 山西农业科学. 2022(07): 1021-1029 . 百度学术
8. 袁运许,许永利,刘硕,马百衡,冀广,宋建伟,李小光. 河北省主要铁矿迹地复垦区土壤肥力现状调查分析. 有色金属(矿山部分). 2022(06): 55-63 . 百度学术
9. 安如意,王辉,李晟洲,田鹏飞,吴浩,刘祥宏. “双碳”背景下铁尾矿库生态修复技术方向与策略. 有色金属(矿山部分). 2022(06): 82-91 . 百度学术
10. 李玲,王珂,王秀丽,路婕,黎鹏,张少然. 矿区复垦土壤研究进展. 河南农业大学学报. 2021(01): 8-14 . 百度学术
11. 辛未冬,刘华煜,杨轶萌,赵浩志. 复垦对煤矸石山地表节肢动物群落特征的影响. 生态学杂志. 2021(07): 2213-2222 . 百度学术
12. 苏学武,张绍良,侯湖平,杨永均,唐立羽,张统,顾春芬,纵博. 基于连通性分析的采煤塌陷地复垦利用潜力评价. 中国矿业. 2021(11): 42-49 . 百度学术
13. 刘文博,姚华彦,王静峰,陈传明,刘玉亭. 铁尾矿资源化综合利用现状. 材料导报. 2020(Z1): 268-270 . 百度学术
14. 刘文博,姚华彦,王静峰,陈传明,刘玉亭. 铁尾矿资源化综合利用现状. 材料导报. 2020(S1): 268-270 . 百度学术
其他类型引用(15)

计量
- 文章访问数: 381
- HTML全文浏览量: 66
- PDF下载量: 36
- 被引次数: 29
