
Effects of neighboring tree diversity and competition on tree growth in natural spruce-fir forests
-
摘要:目的
探究天然云冷杉林邻近木多样性、竞争强度对林木生长的影响,为云冷杉林结构化经营和管理提供科学依据。
方法选取长白山天然云冷杉林2015、2018年两期固定样地调查数据,基于结构方程模型分析邻近木多样性、竞争与树木生长的关系。
结果(1)研究区内天然云冷杉林的邻近木树种、径阶、树高多样性指数均集中在1.04处,3个多样性指数整体上分布均匀,树种混交度高,林分结构复杂。(2)结构方程模型中,树种、径阶、树高3个邻近木多样性指数和竞争指数对材积生长量的总影响系数分别为−0.001、0.166、0.073和−0.489,结果表明竞争是影响林木生长的关键因素。(3)径阶和树高多样性的增加对生长量均为正面影响,其中径阶多样性为直接影响,树高多样性为间接影响;树种多样性表现为直接的负面影响与间接的正面影响,总体为负面影响;此外,树种多样性的提高可以减少林木间的竞争强度,树高多样性的提高可能会导致林分结构的分化,进而促进林分中林木个体的生长。(4)研究区内林木的生长压力可能多来自于同径级林木,小径级林木生长状况较差且竞争压力较大,大中径级林木与之相反。
结论择伐同径级或相近径级林木,同时提高林分内的径阶、树高多样性水平,可以降低林木竞争水平,促进林木个体生长,进而提高云冷杉林林分生产力。
Abstract:ObjectiveThis study aimed to investigate the effects of neighboring tree diversity and forest competition intensity on the tree growth in natural spruce-fir forests, providing a scientific basis for the structure management of spruce-fir forests.
MethodData from two fixed-sample surveys of a natural spruce-fir forest in Changbai Mountain of northeastern China in 2015 and 2018 were used to analyze the relationship between neighboring tree diversity, competition, and tree growth by a structural equation model.
Result(1) The neighboring tree diversity indexes for species, diameter classes, and tree height of the natural spruce-fir forests in the study area were all around 1.04. It indicated an overall even distribution of these three indexes, high degree of species mixture, and complex stand structure. (2) The total impact coefficients for species, diameter-classe, tree-height neighboring tree diversity indexes and the competition index on volume increment in the model were −0.001, 0.166, 0.073 and −0.489, respectively. It indicated that competition was the key factor affecting tree growth. (3) The increases in diameter-class and tree-height diversities both had positive effects on tree growth, with a direct effect of diameter-class diversity, and an indirect effect of tree-height diversity. The species diversity had a directly negative effect and an indirectly positive effect, exhibiting an overall negative effect. The increase of species diversity reduced competition intensity of trees in a stand, while the increase of tree-height diversity might lead to a differentiation of stand structure, which further promoted the growth of individual trees in a stand. (4) Growth pressure of trees in the research area may mainly come from trees of the same diameter-class. Small-diameter trees had poorer growth conditions and greater competition pressure, while large-diameter and medium-diameter trees were opposite.
ConclusionSelective cutting of the trees within the same or similar diameter-classes, and improving the level of diameter-classe and tree-height diversity within a stand, can reduce the competition level, promote individual tree growth, and enhance the productivity of spruce-fir stands.
-
天然林林分结构复杂,物种丰富,林分内树木的生长受到许多因素的影响,如光照、水分等,而个体间为争夺有限的资源所引起的竞争是影响树木生长的重要因素,研究表明林分内的单木生长会受到邻体竞争的影响,竞争强度与林木生长一般为负相关关系[1]。竞争指数是现有研究中衡量邻域间竞争强度大小的指标,主要分为与距离有关和与距离无关两类[2]。由于天然林林分结构相对复杂,与距离有关的竞争指数更能反映林木间的竞争关系[3],由 Hegyi[4]提出的简单竞争指数最常见,应用最广泛。
多样性对生态系统特性和功能的影响是生态学的一个重要研究课题,许多研究结果表明多样性与生产力密切相关。范秀华等[5]对天然林群落的物种和结构多样性与生产力之间的关系进行研究发现,物种多样化组合和结构优化有助于提升群落生产力。朱杰等[6]研究表明物种多样性和结构多样性分别与生物量呈负相关和正相关关系,而与生产力则分别呈正相关和负相关关系。一些研究认为林分多样性的变化可能会导致林木个体的生态位和竞争水平产生差异[7],从而影响森林生产力。从不同尺度研究多样性与生产力关系是诸多学者一直以来关注的热点问题。在林分水平上,常选用香农(Shannon)多样性指数和辛普森(Simpson)指数来评价物种多样性,基尼(Gini)系数和胸径变异系数常被用于林分结构多样性的评价,但这些指数可以反映林分多样性指数的平均状态,不能反映林分内部的变化。
林分结构多样性可由物种多样性和大小多样性来表征,很大程度上由相邻木的空间关系所决定[8]。结构化经营是在对象木与其相邻木构建的空间结构单元内,通过比较对象木与邻近木之间的树种、大小分布等差异,并结合邻近木空间位置,计算树种与结构多样性[9]。用邻近木多样性指数表达空间结构单元多样性,揭示林分内部物种与结构的变化[10],具有明显的生物学意义,并对林分精准经营、定量分析有重要意义。空间结构单元大小由邻近木的数量和位置决定,多样性指数的准确性一般会随空间结构单元大小的增大而变化,计算难度与分类复杂程度也随之增加[11],且过大的空间结构单元会导致邻近木的数量增多,进而使得部分无关的林木参与多样性与竞争指数计算。在前人[11−12]的研究中空间结构单元常选4 ~ 5株邻近木,得到的结果较为可靠。
结构方程模型(structural equation model,SEM)是基于研究者的先验知识,预先设定系统内因子间的依赖关系,能模拟多个因子间复杂关系的复合统计分析模型[13]。SEM对数据输入和参数化要求低,生成的路径图可以判别因子间相互关系的强度,并能对整体模型进行拟合和判断,反映自变量与因变量之间的直接和间接关系[14]。在多因子关系的研究方面,结构方程模型目前已得到广泛应用。舒树淼等[15]使用结构方程模型探究了云南松(Pinus yunnanensis)次生林林木大小多样性与立地条件、林分结构的关系,结果发现立地条件对林木大小多样性的影响除直接作用外还存在间接作用。
以往的研究主要集中在竞争或多样性单因素对树木生长的影响,同时考虑以上两类因素及其交互作用的研究较少。本文在空间结构单元尺度上,探究邻近木间竞争和多样性,以及两者的交互作用对材积生长量的影响,以期为天然云冷杉林择伐等经营生产活动提供理论依据。
1. 研究区概况和研究方法
1.1 研究区概况
研究区位于吉林省汪清县金沟岭林场(43°22′N,130°10′E),林场经营面积为16 286 hm2。林区地貌属低山丘陵,海拔550 ~ 1 200 m,属季风性气候,全年平均气温为3.9 ℃,年降水量600 ~ 700 mm,森林覆盖率达98%,以天然云冷杉林为主。研究区植被属于长白山区系,乔木树种以鱼鳞云杉(Picea jezoensis)、红皮云杉(Picea koraiensis)、臭冷杉(Abies nephrolepis)和红松(Pinus koraiensis)为主,其他树种有白桦(Betula platyphylla)、山杨(Populus davidiana)、色木槭(Acer pictum)、青楷槭(Acer tegmentosum)、枫桦(Betula costata)、紫椴(Tilia amurensis)、花楷槭(Acer ukurunduense)、水曲柳(Fraxinus mandshurica)、黄檗(Phellodendron amurense)等;主要灌木包括胡枝子(Lespedeza bicolor)、绣线菊(Spiraea salicifolia)等;主要草本植物为薹草(Carex tristachya)和山芹菜(Spuriopimpinella brachycarpa)等。
1.2 数据来源
研究采用吉林汪清林业局金沟岭林场云冷杉林固定样地2015与2018年固定样地调查数据。样地位于45林班14小班,海拔662 m,坡度8º,坡向为东北坡,坡位中上,郁闭度0.84,样地大小为100 m × 100 m。记录胸径 ≥ 5 cm树木的树种名称、树高、胸径和冠幅,并以样地西南角为原点,东西方向为x轴,南北方向为y轴,采用相对坐标(x,y)的方式记录样地内乔木坐标。
调查结果(2018年)如表1所示,样地内共有乔木树种15种,树种组成为4冷2云1红1青1枫1椴+白−色−花。林分平均胸径为14.8 cm,平均树高为11.2 m,株数密度为1 290株/hm2。林分的优势树种臭冷杉、云杉(鱼鳞云杉、红皮云杉)和红松,共703株,占总株数的54.5%。它们的平均胸径分别为16.5、19.9和20.9 cm,平均树高分别为11.5、12.1和12.0 m。
表 1 林分树木生长状况Table 1. Tree growth status in the stand树种
Tree species密度/(株·hm−2)
Density/(tree·ha−1)平均胸径
Average DBH/cm平均高
Average height/m平均材积/(m3·hm−2)
Average volume/(m3·ha−1)平均材积生长量/(m3·hm−2)
Average volume
increment/(m3·ha−1)臭冷杉 Abies nephrolepis 458 16.5 11.5 0.19 0.011 鱼鳞云杉 Picea jezoensis
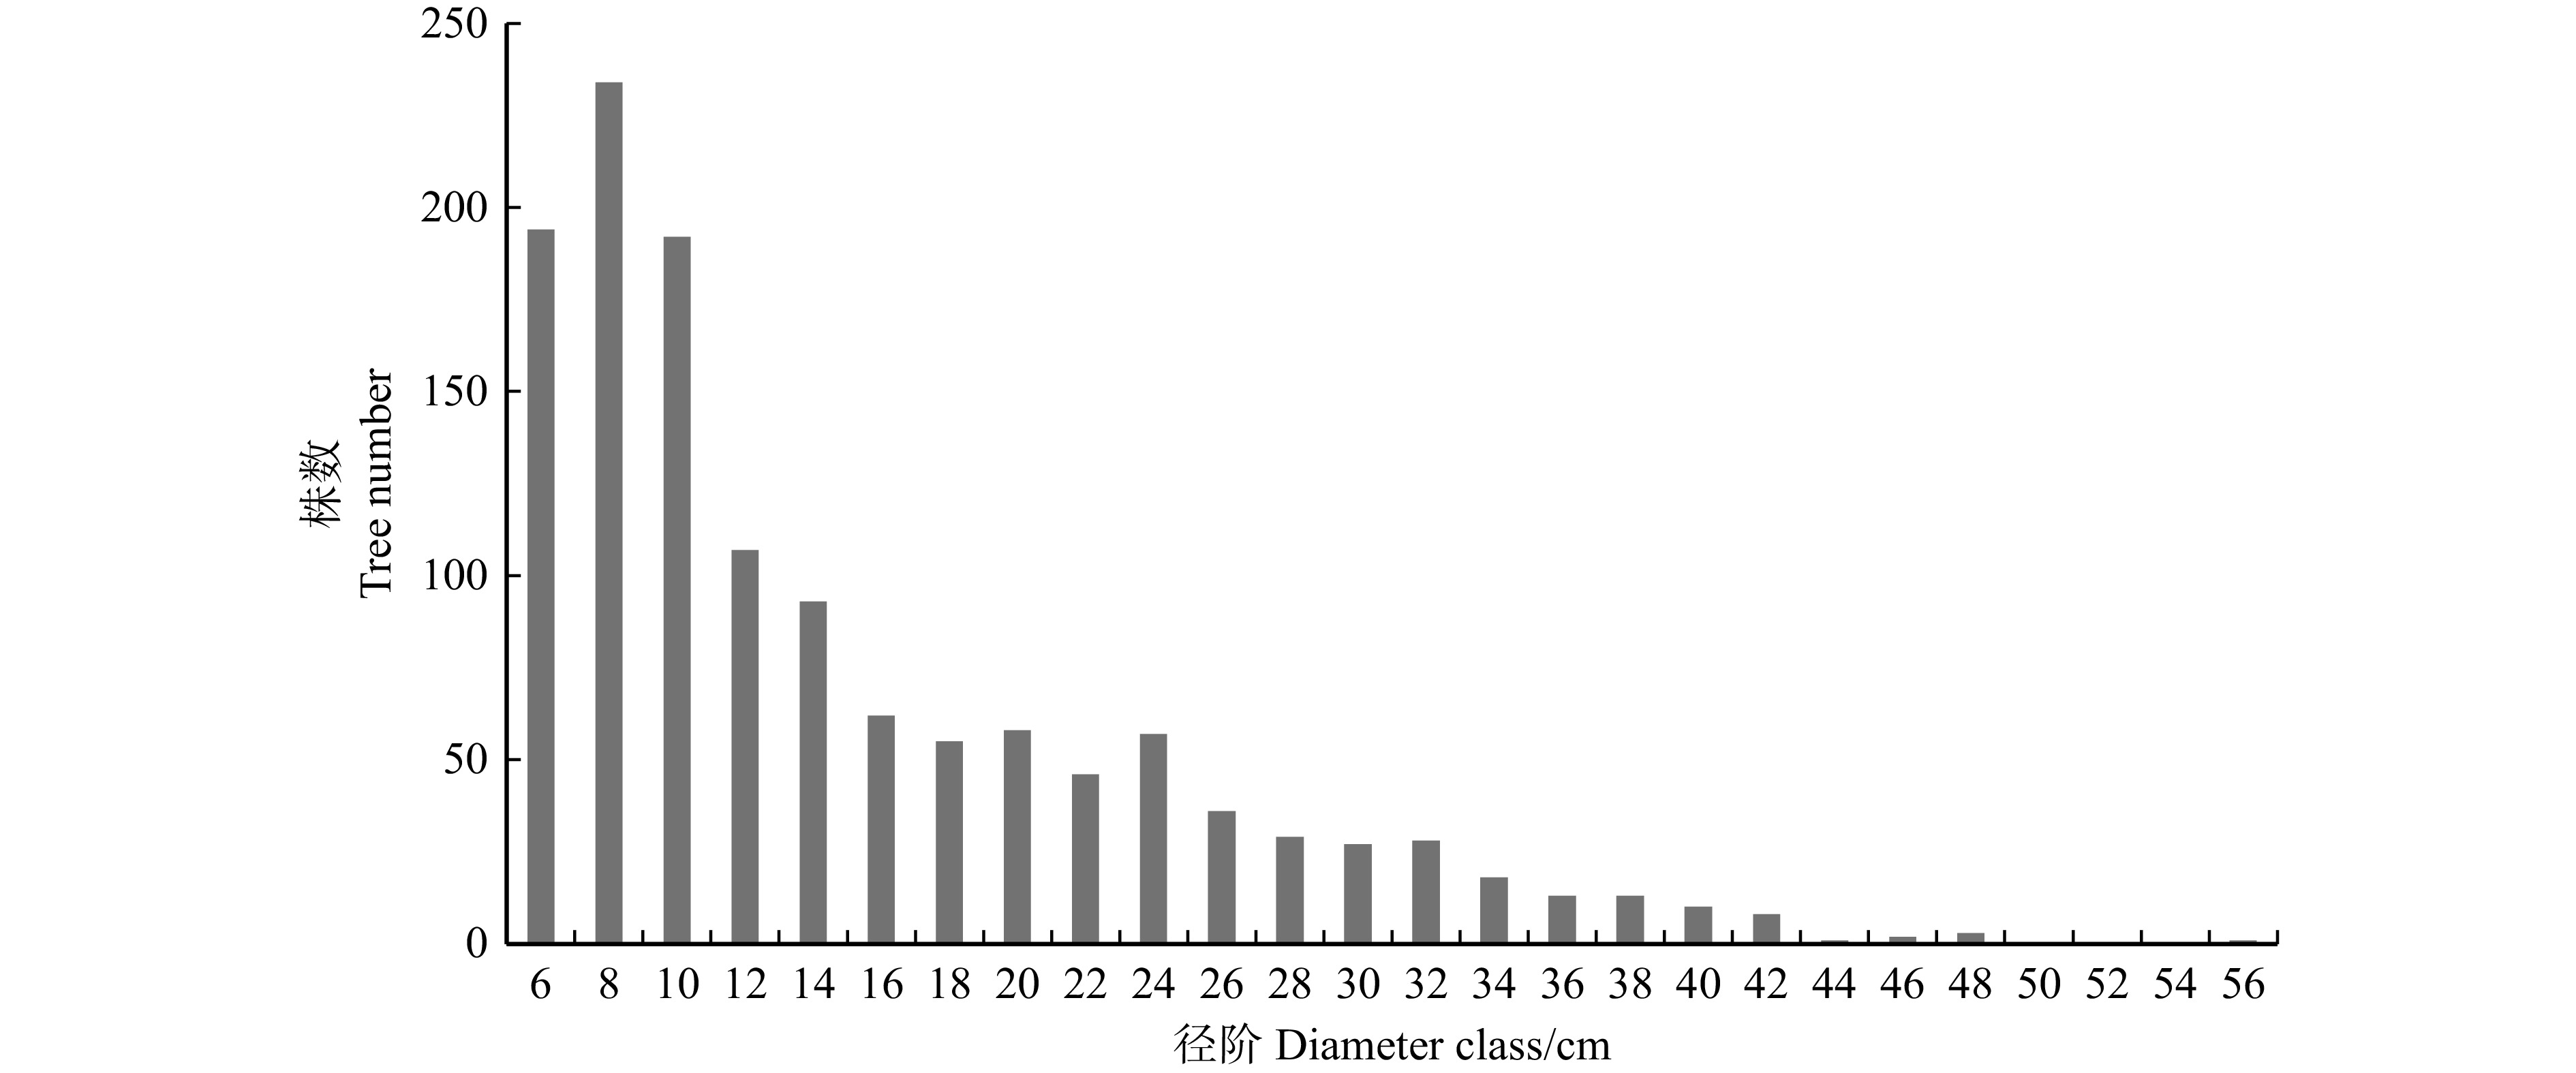
红皮云杉 Picea koraiensis150 19.9 12.1 0.29 0.015 红松 Pinus koraiensis 95 20.9 12.0 0.33 0.013 紫椴 Tilia amurensis 113 11.7 9.8 0.09 0.005 青楷槭 Acer tegmentosum 108 9.9 9.9 0.11 0.008 枫桦 Betula costata 155 10.8 11.3 0.07 0.006 白桦 Betula platyphylla 56 17.3 13.2 0.18 0.018 花楷槭 Acer ukurunduense 33 7.9 8.8 0.05 0.004 色木槭 Acer pictum 25 12.6 11.1 0.09 0.005 黄檗 Phellodendron amurense 4 15.2 11.8 0.11 0.011 青杨 Populus cathayana 3 15.6 12.5 0.14 0.042 水曲柳 Fraxinus mandshurica 2 7.0 7.1 0.02 0.001 蒙古栎 Quercus mongolica 1 10.2 8.8 0.04 0.006 春榆 Ulmus japonica 1 5.5 7.8 0.01 0.002 其他 Others 86 9.8 10.1 0.06 0.004 合计或均值 Total or average 1 290 14.8 11.2 0.17 0.010 林分内林木株数总体上随径阶增大而减少,呈反“J”型曲线,符合异龄林直径分布规律;8 cm径阶株数最多,而后随径阶增大株数开始减少,至34 cm径阶后趋于平缓;中小径阶占比较高,大径阶林木较少(图1)。
1.3 研究方法
1.3.1 空间结构单元的确定
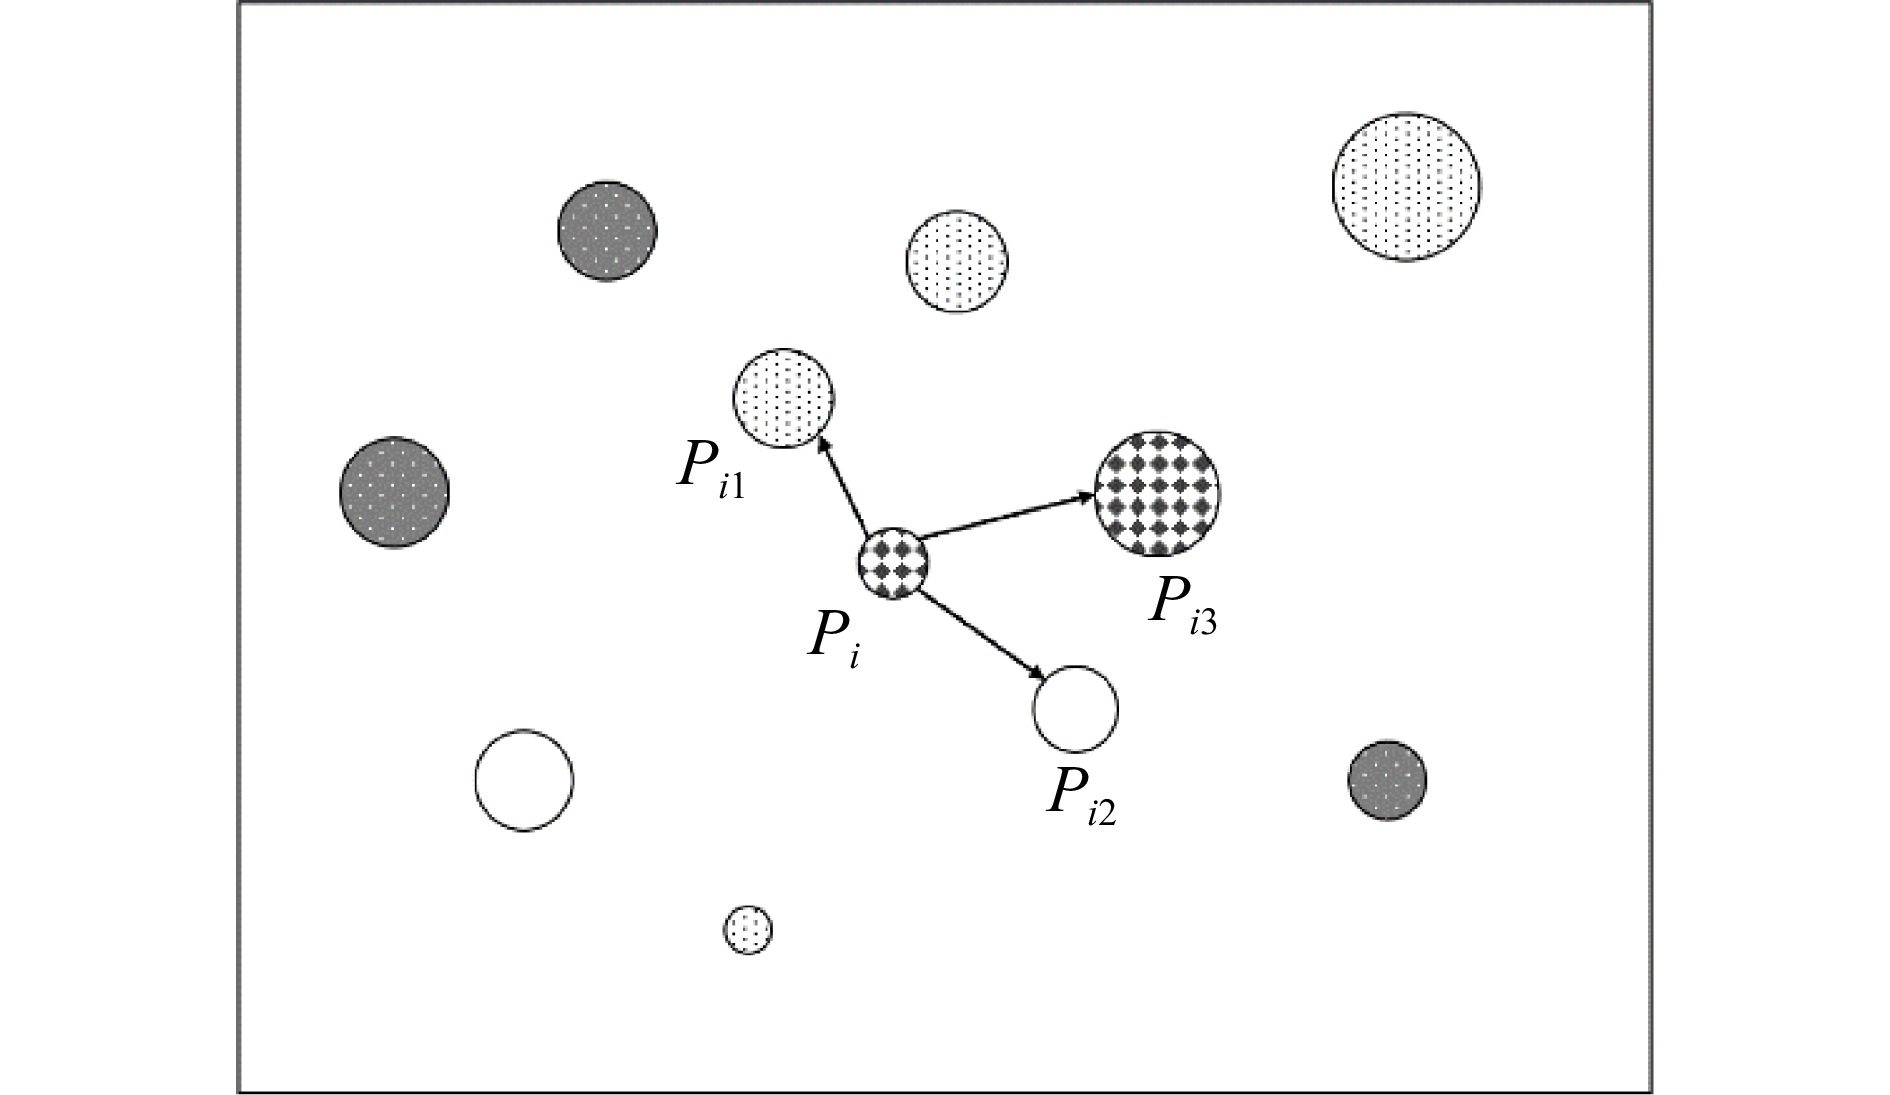
空间结构单元是对象木及其几个最邻近木共同组成的一个整体。空间结构单元内,树种、林木大小、间距等组成差异,可以反映林木竞争与多样性特征。白宇等[12]研究结果表明邻近木空间单元为 4 株(1 株对象木加 3 株邻近木)可以取得较高的物种多样性;Man等[10]在安大略省东北部混交林的研究中也选择了4株树为邻近木空间结构单元,取得了较好的研究成果。本研究也将邻近木空间结构单元大小确定为4株树(图2)。
![]() 图 2 邻近木空间结构单元Pi为对象木,i为对象木序号,Pi1、Pi2、Pi3为Pi的最邻近木。圆圈大小表示胸径,圆圈类型表示树种。Pi is the subject tree, i is an order number of subject tree, Pi1, Pi2 and Pi3 are the nearest neighbours. The size of circle is proportional to the size of trees, and circle type indicates tree species.Figure 2. Spatial structural unit of neighboring trees
图 2 邻近木空间结构单元Pi为对象木,i为对象木序号,Pi1、Pi2、Pi3为Pi的最邻近木。圆圈大小表示胸径,圆圈类型表示树种。Pi is the subject tree, i is an order number of subject tree, Pi1, Pi2 and Pi3 are the nearest neighbours. The size of circle is proportional to the size of trees, and circle type indicates tree species.Figure 2. Spatial structural unit of neighboring trees1.3.2 边缘效应的消除
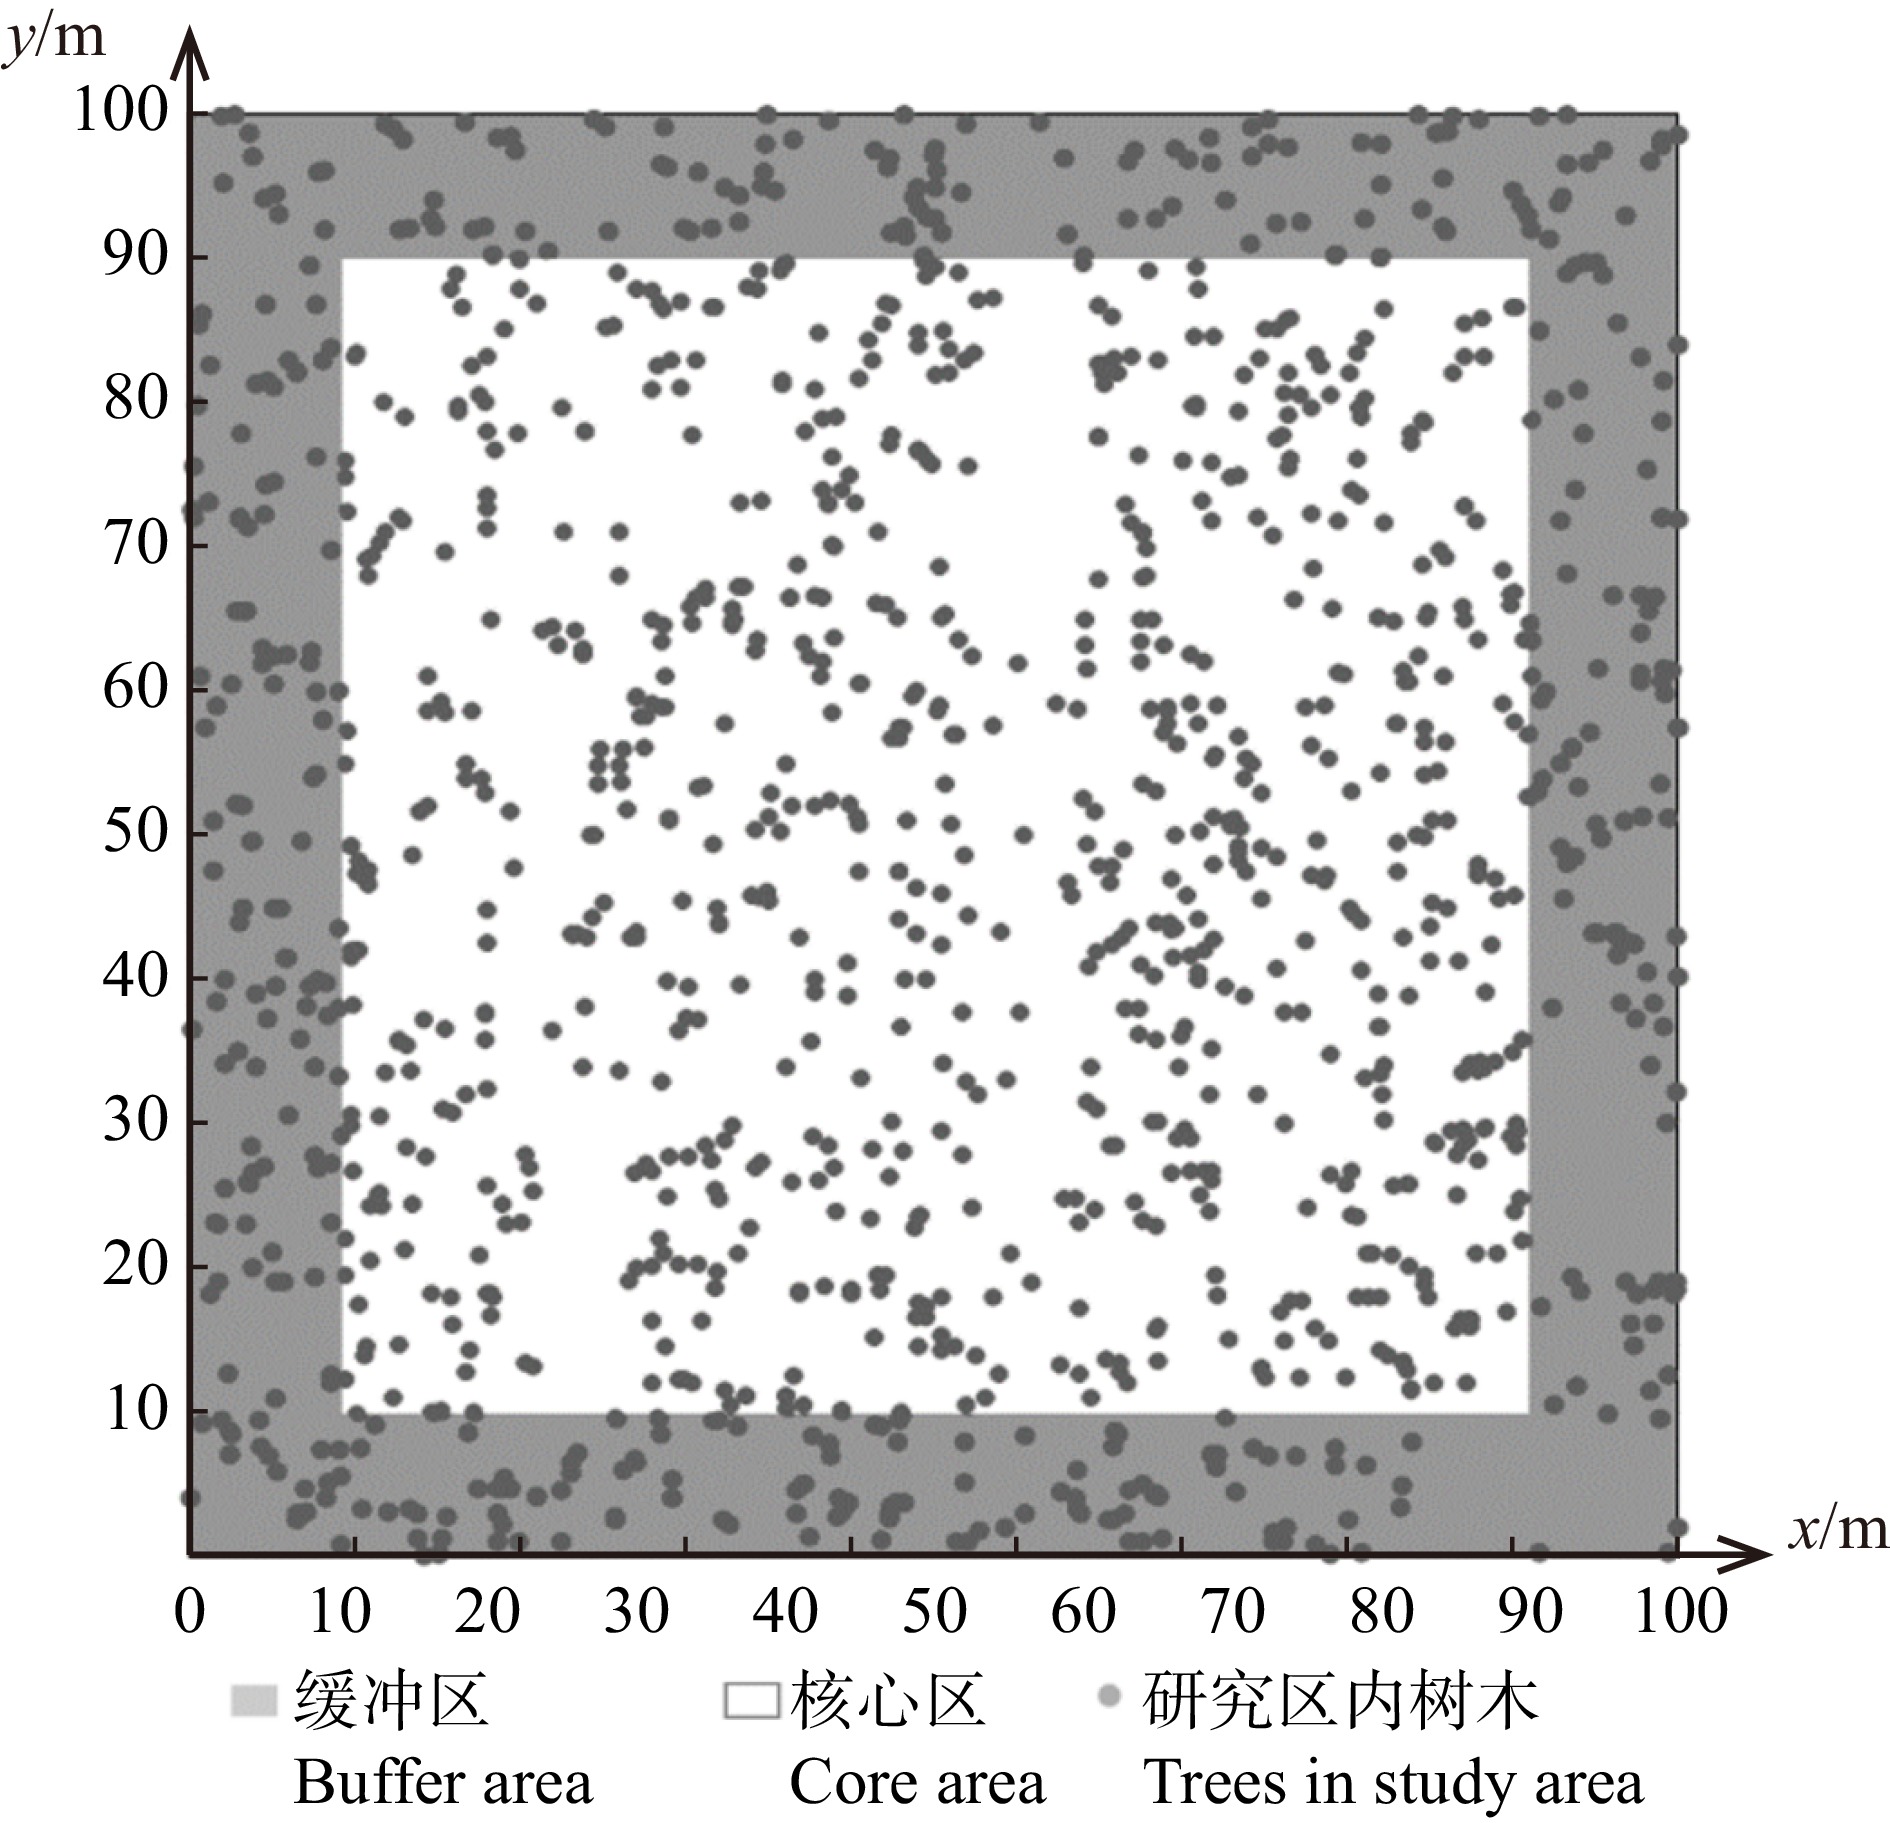
由于样地边缘可能会出现假邻近木或对象木,对研究结果产生一定影响,因此需消除边缘效应。经计算样地内所有空间结构单元的对象木与最邻近木的最大距离为9.85 m,因此设置距样地边界10 m的缓冲区(图3),缓冲区内所有林木不作为对象木。样地内核心区对象木共646株(不包括复测枯损的树木)。
![]() 图 3 树木位置图坐标以样地的西南角为原点,东西方向为x轴,南北方向为y轴。Taking the southwest corner of plot as origin, east-west direction as x-axis, and north-south direction as y-axis.Figure 3. Tree location map
图 3 树木位置图坐标以样地的西南角为原点,东西方向为x轴,南北方向为y轴。Taking the southwest corner of plot as origin, east-west direction as x-axis, and north-south direction as y-axis.Figure 3. Tree location map1.3.3 多样性指数的计算
确定空间结构单元后,根据对象木与最邻近木的树种、径阶和树高的不同,计算树种多样性指数(Hs)、径阶多样性指数(Hd)和树高多样性指数(Hh)。以Hs为例,根据各树种混交强度的不同,代入公式(1)计算。
Hs=−1n∑ni=1∑rj=1PijlnPij (1) 式中:Pij是第i个对象木及其k个最邻近木组成的空间结构单元内第j个树种所占的比例,r是最邻近木树种的总数(r ≤ k + 1),n为对象木株数。
本研究所选取空间结构单元大小为4株树,对象木与3株最邻近木树种相同则取值为0,依次类推到4株树木的树种均不相同,所对应的树种多样性指数计算结果不断增大,分别为0、0.56、0.69、1.04和1.39。
同理,分别按2 cm径阶距和2 m树高距对样地内树木的径阶、树高进行整化,则公式中的Pij即为第i个对象木及其k个最邻近木组成的空间结构单元内第j个径阶或树高所占的比例,依次可以推导出径阶多样性指数(Hd)与树高多样性指数(Hh)。
1.3.4 竞争指数的计算
单木竞争指数是衡量林分内单木竞争情况的指数,一般利用胸径、树高、冠幅大小以及对象木与相邻木的距离来量化单木的竞争环境和对生长的影响[16]。将空间结构单元内的邻近木作为竞争木,选用简单竞争指数(competition index,CI)、树冠投影面积竞争指数(distance weighted crown cross-section index,BDC)[17]和树冠竞争指数(crown competition index,CCI)[18]来衡量林木所受竞争压力的大小,计算公式如表2所示。
表 2 单木竞争指数Table 2. Individual tree competition index指数 Index 公式 Formula 说明 Remark Hegyi竞争指数[4]
Hegyi competition index (CI)CIi=∑ni=1(DjDi⋅1Dij) Di为对象木i胸径,Dj为邻近木j的胸径,Dij为对象木与邻近木之间的距离,n为邻近木数量,n = 3
Di is DBH of subject tree i, Dj is DBH of neighbouring tree j, and Dij is distance between subject tree and neighbouring tree, n is number of neighbouring tree, n = 3树冠投影面积竞争指数[17] Crown cross-sectional competition index (BDC) BDCi=∑ni=1(CjCi⋅1Dij) Ci是对象木的树冠投影面积,Cj为邻近木树冠投影面积
Ci is projected crown area of subject tree and Cj is projected crown area of neighbouring tree树冠竞争指数[18]
Crown competition index (CCI)CCIi=∑ni=1(HjHi⋅¯Wi+¯Wj−Dij¯Wi) Hi为对象木树高,Hj为邻近木的树高,¯Wi为对象木的平均冠幅半径,¯Wj 为邻近木的平均冠幅半径
Hi is height of subject tree, Hj is height of neighbouring tree, ¯Wi is average crown radius of subject tree, ¯Wj is average crown radius of neighbouring tree1.3.5 结构方程模型构建与评价
根据前人[11−12]研究经验,结合研究区的林分特征和自然条件,将多样性指数与竞争指数作为林分结构参数,将各林木的胸高断面积生长量与材积生长量统一归为生长量指数。根据变量关系建立结构方程模型的理论模型。其中各树种材积生长量与胸高断面积生长量为期初(2015年)与期末(2018年)之差,采用《中国立木材积表》[19]中汪清林业局各树种的二元材积式计算材积。
选用克朗巴哈系数(Cronbach’s alpha coefficient)法对各指标层数据进行信度检验,一般认为克朗巴哈系数 > 0.7时信度良好[20]。采用KMO(Kaiser-Meyer-Olkin)检验和Bartlett球形检验进行数据效度检验,当KMO > 0.7且Bartlett球形检验为0时效度良好;0.5 < KMO ≤ 0.7,效度可以接受[21]。
采用平均适配度指数χ2/df、均方根误差(root mean squared error,RMSE)和增值适配度指数规范拟合指数(normed fit index,NFI)、相对拟合指数(relative fit index,RFI)、非规范拟合指数(tucker-lewis coefficien,TLI)对模型适配度进行检验。一般认为χ2/df介于1到3之间,RMSE小于0.05,NFI、RFI、TLI均大于0.9,模型适配度良好[22−23]。
各指数计算通过R 3.6.2、Excel 2019完成,数据处理与分析使用SPSS 26.0、Amos 26.0完成。
2. 结果与分析
2.1 邻近木多样性指数与竞争指数的株数分布
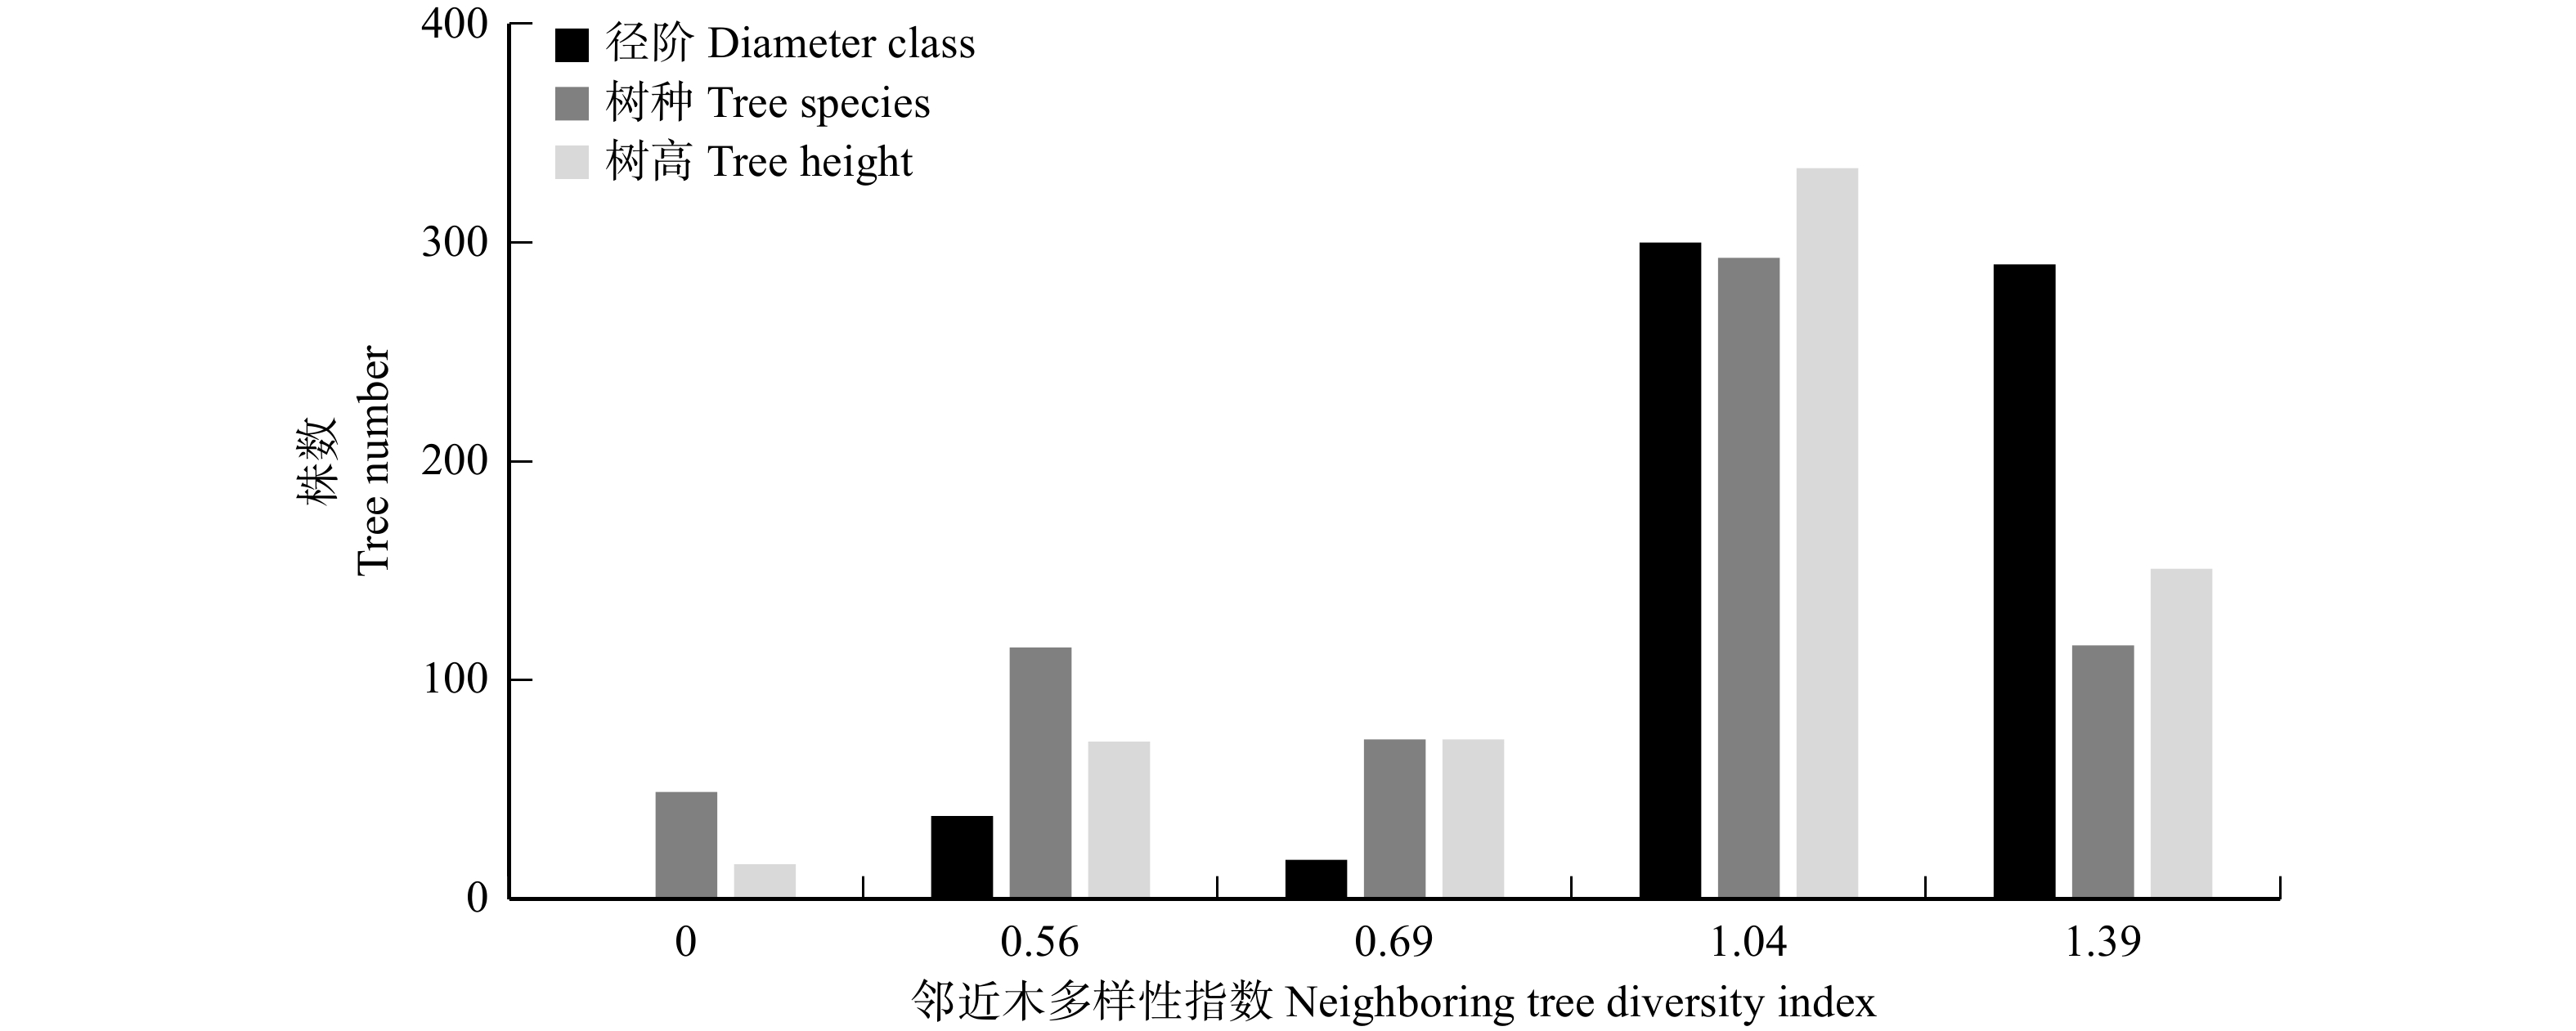
3种多样性指数数值变化趋势较为一致(图4)。在径阶、树种、树高多样性指数为0时,株数分布最少,多样性指数为1.04处株数分布最多。3种多样性指数在取值为1.04与1.39时的累计株数分布数量均超过林分总株数的60%,说明大部分空间结构单元内不同树木的树种、径阶、树高分布差异明显。但是树种多样性指数较其他两种多样性指数在取值为0、0.56、0.69时株数分布相对更多,而在取值为1.39时相对较少,说明相同树种的树木间可能存在一定的聚集情况,而树高与径阶分布则较为均匀,更加合理。整体而言,研究区内多样性水平较高,树种混交程度高,空间结构复杂,水平与垂直结构变异度大。
![]() 图 4 邻近木多样性指数的株数分布Figure 4. Plant number distribution of neighboring tree diversity index
图 4 邻近木多样性指数的株数分布Figure 4. Plant number distribution of neighboring tree diversity index从各竞争指数的表现(表3)来看,由于CI与BDC指数在计算过程中涉及对象木与邻近木的距离,而天然林中部分邻近木与对象木距离较近,因此出现最大值数值非常高[24]的情况。将3种竞争指数使用极差标准化法进行标准化后发现,所选3个竞争指数中CCI的结果偏大,且分布较为离散,BDC与CI计算结果偏小,标准化后CI分布更为集中。
表 3 各竞争指数的统计Table 3. Statistics of each competition index竞争指数
Competition index最小值
Min. value最大值
Max. value平均值 ± 标准误
Mean ± SE标准差
SD标准化后的平均值 ± 标准误
Standardized mean ± SE标准化后的标准差
Standardized SDCCI 0 11.321 2.965 ± 0.066 1.673 0.262 ± 0.006 0.148 BDC 0.055 221.545 9.382 ± 0.793 0.564 0.038 ± 0.004 0.091 CI 0.187 168.515 6.391 ± 0.544 13.825 0.038 ± 0.003 0.082 2.2 各径级林木邻近木多样性、竞争指数与生长情况
根据样地调查数据分析结果,林分的直径为反“J”型分布,根据《森林资源规划设计调查技术规程》(GB/T 26424—2010)对树木径阶进行分级,以CI作为衡量竞争强度的标准进行统计(表4)。大径级林木的竞争指数显著低于小径级林木且生长量显著高于小径级林木,随树木径级的增大,其所承受的竞争强度不断变小且趋于稳定。各多样性指数呈现出缓慢增加的趋势,说明随着树木径级的增大,对象木周围的树种、径阶、树高分布逐渐变得复杂。随着树木径级的增大,树木的材积生长量表现为增加趋势,增长幅度也趋于稳定。中径级的树木材积生长率明显高于其他两个径级的树木,生长势头最好,大径级林木生长势头中等,而小径级林木生长势头表现最差。
表 4 各径级邻近木多样性指数、竞争指数与生长量统计Table 4. Diversity index, competition index, and growth statistics of neighboring trees at different diameter levels径级
Diameter class指标
Index材积生长量
Volume
increment/m3材积生长率
Volume
growth rate径阶
多样性指数
Diameter-class
diversity index树种
多样性指数
Species
diversity index树高
多样性指数
Tree-height
diversity index竞争指数
Competition
index小径级
Small-diameter class
(5 cm ≤ DBH < 13 cm)均值 ± 标准误
Mean ± SE0.009 ± 0.001 (4.592 ± 0.154)% 1.114 ± 0.015 0.873 ± 0.021 0.981 ± 0.013 9.016 ± 0.662 标准差
Standard deviation0.016 0.029 0.275 0.382 0.324 15.207 变异系数
Coefficient of variation/%177.778 63.181 24.686 43.757 33.028 168.680 中径级
Medium-diameter class
(13 cm ≤ DBH < 25 cm)均值 ± 标准误
Mean ± SE0.041 ± 0.002 (6.046± 0.155)% 1.197 ± 0.016 0.884 ± 0.024 1.004 ± 0.020 2.864 ± 0.266 标准差
Standard deviation0.033 0.024 0.236 0.343 0.288 4.822 变异系数
Coefficient of variation/%80.488 39.670 19.716 38.801 28.685 168.390 大径级
Large-diameter class
(DBH ≥ 25 cm)均值 ± 标准误
Mean ± SE0.081 ± 0.004 (5.379 ± 0.167)% 1.252 ± 0.034 0.921 ± 0.031 1.056 ± 0.024 1.064 ± 0.112 标准差
Standard deviation0.041 0.017 0.314 0.357 0.258 1.339 变异系数
Coefficient of variation/%50.617 31.604 25.080 38.762 24.432 125.820 竞争指数变异系数大于100%的情况,可能是因为在结构稳定的天然云冷杉林中,林分结构复杂,不同林木受到的竞争压力本身差异偏高,且CI的计算涉及距离[24],当树木距离非常近时,CI的结果会出现非常高的情况,导致数据明显偏离均值。而小径级树木由于所受竞争压力不同,且树木年龄可能较小,生长能力差别较大,材积生长出现较大分化,变异系数超过100%也存在一定合理性。
2.3 邻近木多样性与竞争对生长的影响
2.3.1 结构方程模型的评价与修正
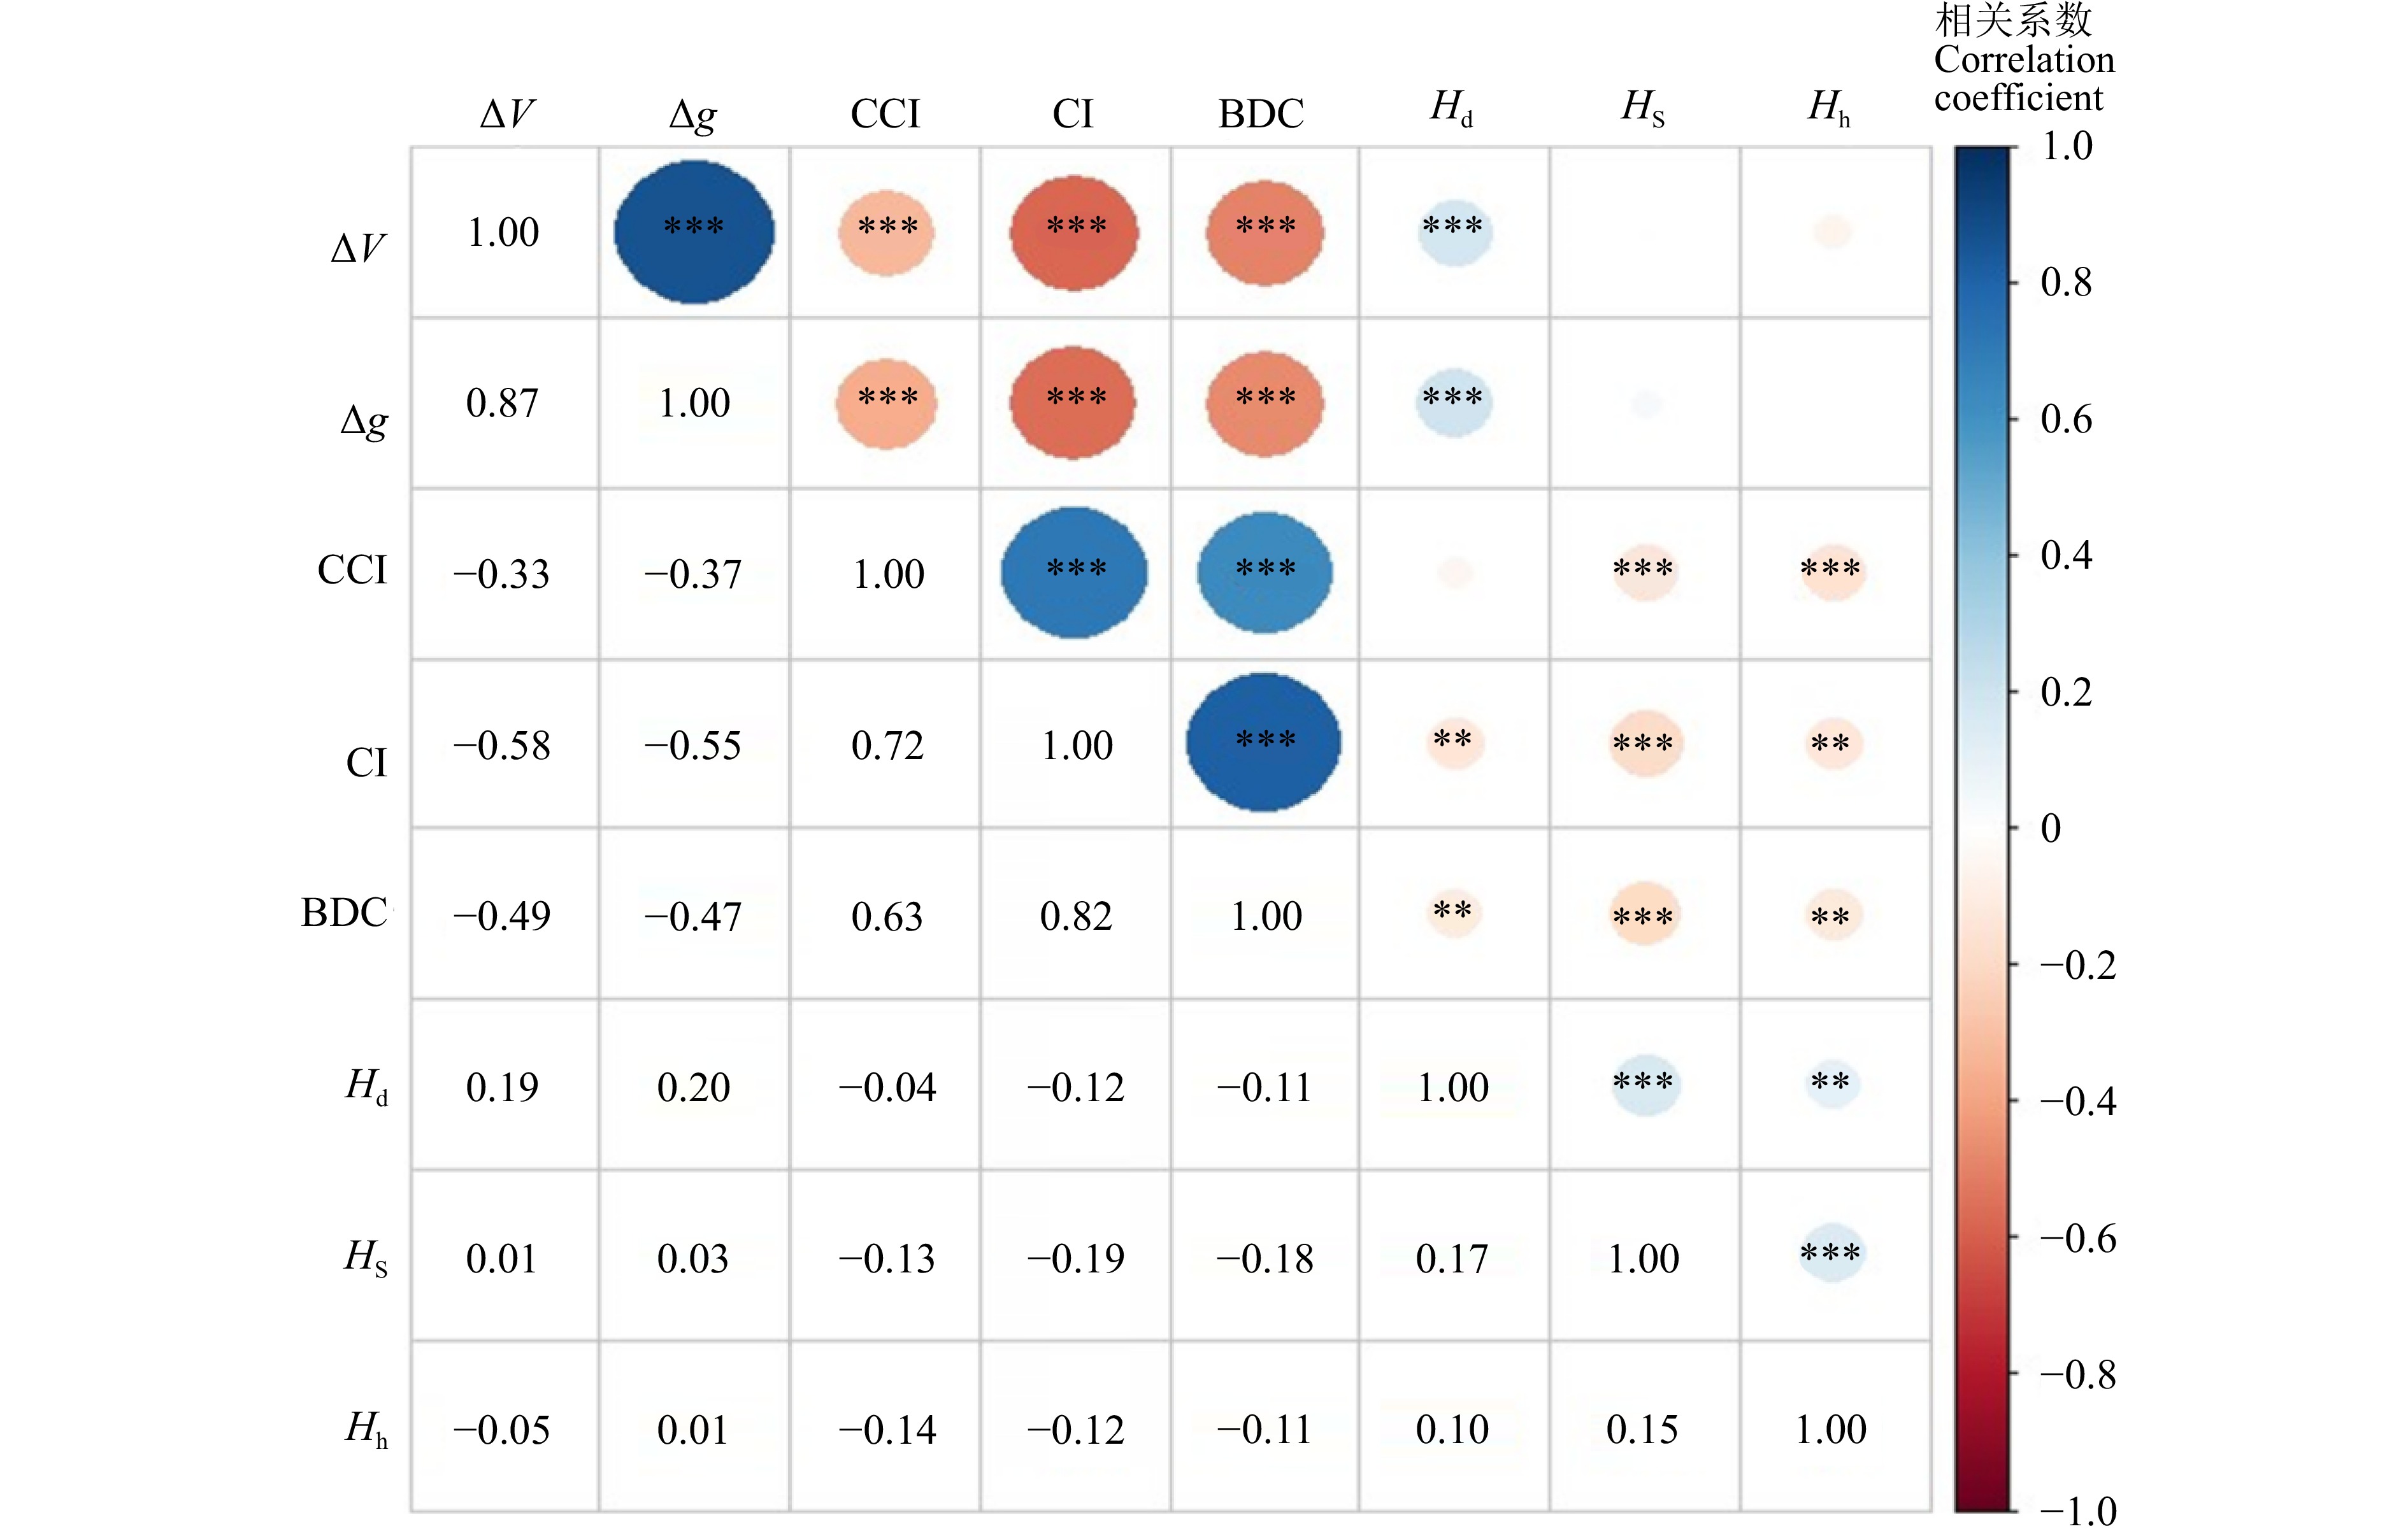
对各观测变量进行Spearman相关性分析(图5),各竞争指数和径阶多样性指数与生长量显著相关,树种和树高多样性指数与生长量相关性不显著。表5显示:竞争指数表现良好,克朗巴哈系数为0.874,KMO值为0.712,Bartlett球形检验结果为0,通过信度与效度检验。多样性因子的克朗巴哈系数为0.297,KMO值为0.516,Bartlett球形检验结果为0,虽然通过效度检验,但未能通过信度检验,可靠性不足,考虑进行优化。生长量克朗巴哈系数为0.876,KMO值为0.500,Bartlett球形检验结果为0,通过信度检验,但效度检验结果较差,真实性不佳。将竞争因子与生长量因子分别通过主成分分析进行降维,发现CI对竞争因子的解释率达82.19%,材积生长量对生长因子的解释率达84.74%,因此综合考虑后决定删除模型中的潜变量,以CI代表竞争因子,材积生长量代表生长量因子进行模型优化,再根据模型拟合指数修正,删除不显著的路径后,最终模型路径图如图6所示。
![]() 图 5 各观测变量Spearman相关性ΔV. 材积生长量;Δg.胸高断面积生长量;Hd. 径阶多样性指数;Hs.树种多样性指数;Hh.树高多样性指数。 **代表在 P < 0.05 水平上显著相关,***代表在 P < 0.01 水平上显著相关。ΔV, volume increment; Δg, basal area increment; Hd, diameter class diversity index; Hs, tree species diversity index; Hh, tree height diversity index. ** represents significant correlation at P < 0.05 level, *** represents significant correlation at P < 0.01 level.Figure 5. Spearman correlations for each observed variable表 5 信度检验和效度检验结果Table 5. Results of reliability and validity tests
图 5 各观测变量Spearman相关性ΔV. 材积生长量;Δg.胸高断面积生长量;Hd. 径阶多样性指数;Hs.树种多样性指数;Hh.树高多样性指数。 **代表在 P < 0.05 水平上显著相关,***代表在 P < 0.01 水平上显著相关。ΔV, volume increment; Δg, basal area increment; Hd, diameter class diversity index; Hs, tree species diversity index; Hh, tree height diversity index. ** represents significant correlation at P < 0.05 level, *** represents significant correlation at P < 0.01 level.Figure 5. Spearman correlations for each observed variable表 5 信度检验和效度检验结果Table 5. Results of reliability and validity tests潜变量
Latent variable显变量个数
Number of explicit variable克朗巴哈系数
Cronbach’s alpha coefficientKMO检验
KMO testBartlett球形检验
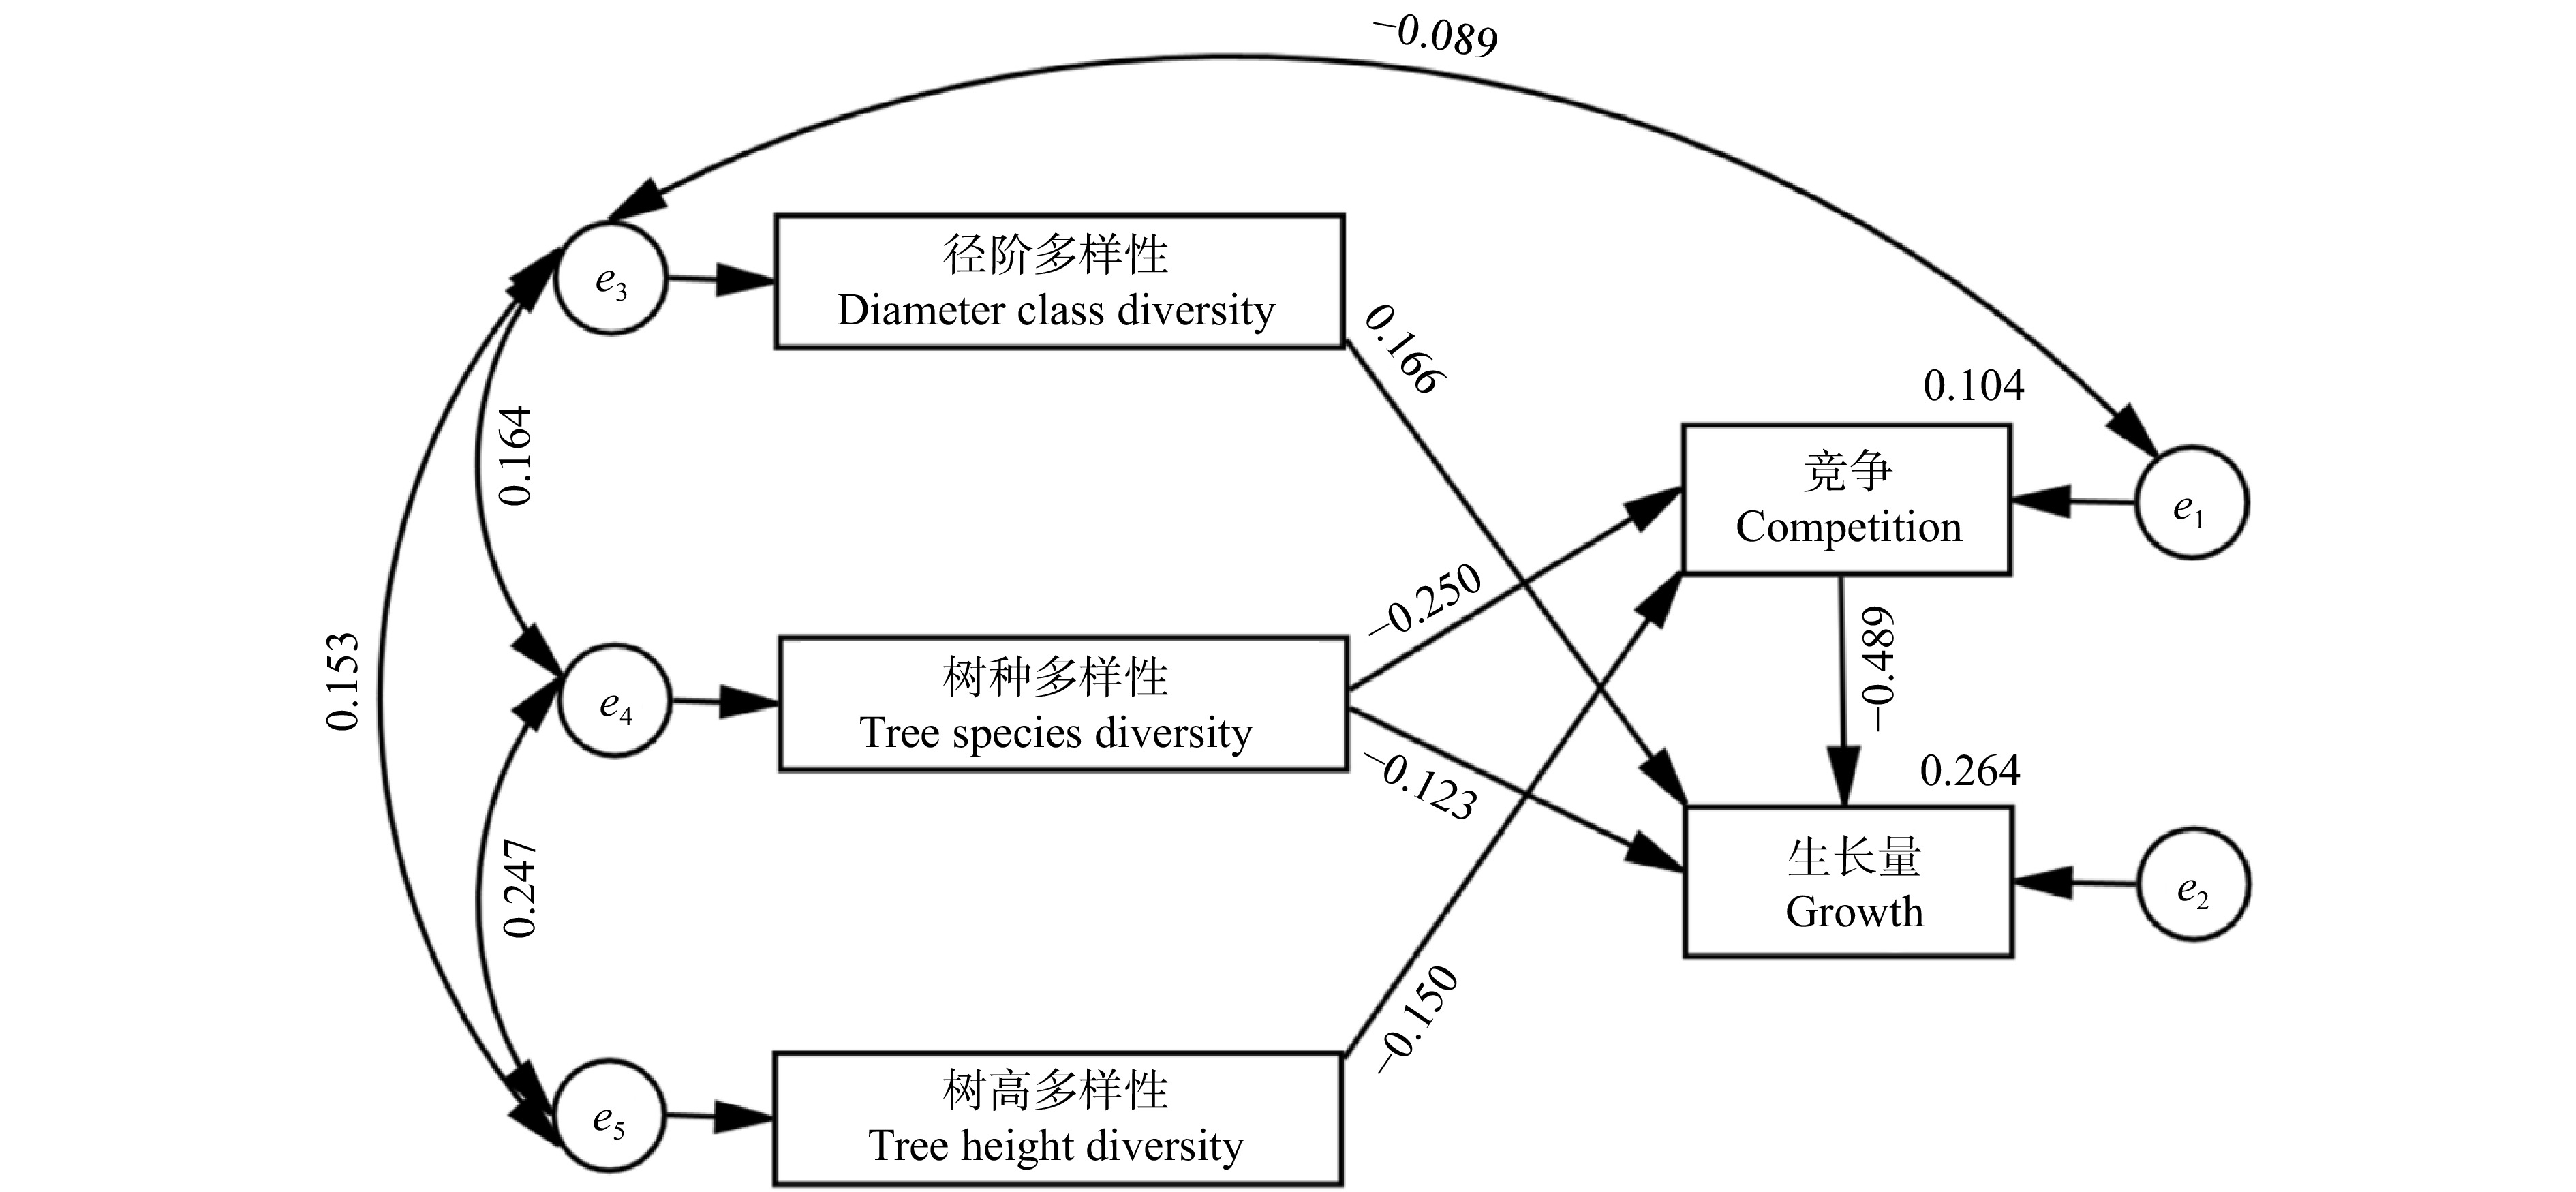
Bartlett’s sphericity test多样性 Diversity 3 0.297 0.516 0 竞争 Competition 3 0.874 0.712 0 生长量 Growth 2 0.876 0.500 0 ![]() 图 6 结构方程模型修正路径图竞争与生长量右上角数字为其方差;箭头表示影响关系;箭头上的数据为相应的路径系数,e1 ~ e5分别为相应观察变量的测量误差。Numbers in the upper right corner of competition and growth quantities are their variance; arrows indicate influence relationships; data on the arrows are corresponding path coefficients; e1 to e5 are measurement errors of corresponding observed variables, respectively.Figure 6. Structural equation model correction path diagram
图 6 结构方程模型修正路径图竞争与生长量右上角数字为其方差;箭头表示影响关系;箭头上的数据为相应的路径系数,e1 ~ e5分别为相应观察变量的测量误差。Numbers in the upper right corner of competition and growth quantities are their variance; arrows indicate influence relationships; data on the arrows are corresponding path coefficients; e1 to e5 are measurement errors of corresponding observed variables, respectively.Figure 6. Structural equation model correction path diagram修正后模型的χ2显著性概率为0.230,χ2/df为1.442,RMSE为0.026,NFI、RFI和TLI分别为为0.996、0.958和0.987,模型与观测数据适配,综合评价模型整体拟合效果良好。
2.3.2 邻近木多样性与竞争对生长的影响
结合方程结果(图6)与各指数路径间的效应(表6)可以看出,竞争与各多样性指数均对材积的生长产生影响,模型内各路径系数均通过了显著性检验。竞争和树种多样性与材积生长呈现出负相关,说明随着竞争的加剧及树种多样性的提高,树木的生长量将会受到抑制。树高多样性和径阶多样性与树木的材积生长呈现正相关。从表6可知竞争对生长量的总影响系数为−0.489,树种、径阶、树高多样性对生长量的总影响系数分别为−0.001、0.166、0.073。由此可知竞争对材积生长量的影响最大,树种、径阶与树高多样性影响则较小。径阶多样性对生长量的影响全部为直接影响,树高多样性对生长量全部为间接影响。树种多样性则二者都有,且影响效果相反,对生长量有直接负面影响,影响系数为–0.123,而在通过竞争后对生长量的影响表现为正面影响,影响系数为0.122。
表 6 各指数路径间直接效应、间接效应和总效应及适配性Table 6. Direct, indirect and total effects and fitness between index pathways变量因果关系
Causality of variables直接影响系数
Direct impact coefficient间接影响系数
Indirect effect coefficient总影响系数
Total impact coefficientP值
P value树种多样性→竞争
Tree species diversity→Competition−0.250 0 −0.250 < 0.001 树高多样性→竞争
Tree height diversity→ Competition−0.150 0 −0.150 < 0.001 竞争→生长量
Competition→Growth−0.489 0 −0.489 < 0.001 径阶多样性→生长量
Diameter class diversity→Growth0.166 0 0.166 < 0.001 树种多样性→生长量
Tree species diversity→Growth−0.123 0.122 −0.001 < 0.001 树高多样性→生长量
Tree height diversity→Growth0 0.073 0.073 < 0.001 注:“→”表示影响,箭头的指向代表一个因子对另一个因子的影响关系。Notes: “→” indicates impact, pointing of arrow represents the relationship of a factor to the influence of another factor. 2.3.3 邻近木单元内不同径级邻近木竞争与生长状况
基于结构方程模型结果,竞争因子对树木材积生长的影响系数显著高于多样性因子,因此,根据空间结构单元内各邻近木径级大小统计不同径级对象木竞争与生长情况,结果如表7所示。随着对象木周围邻近木径级的增加,小径级林木所受竞争压力逐渐减少,生长量略有增加,但生长势头有所放缓;中径级林木在邻近木以小径级为主时各项表现最佳;而大径级林木在周围均为小径级林木时表现最好。研究区内小径级林木竞争压力较大,生长状况较差,而中、大径级林木所受竞争压力整体较小,生长状况良好。林木的生长压力可能多源于同径级竞争,林木的生长势头在周围以同径级林木为主时表现最佳。
表 7 不同径级对象木邻近木径级分布的竞争与生长状况Table 7. Competition and growth status of neighbouring tree diameter distribution of subject trees of different diameter classes邻近木径级分布
Diameter class distribution
of neighboring tree指标
Index对象木径级 Diameter class of subject tree 小径级
Small-diameter class中径级
Medium-diameter class大径级
Large-diameter class总体 Total 竞争 Competition 9.902 ± 0.938 2.572 ± 0.283 1.106 ± 0.131 材积生长量 Volume increment/m3 0.009 ± 0.001 0.041 ± 0.002 0.081 ± 0.004 材积生长率 Volume growth rate/% 4.589 ± 0.151 6.049 ± 0.157 5.377 ± 0.181 全为小径级林木
All small class diameter tree竞争 Competition 14.668 ± 2.665 2.391 ± 0.796 1.232 ± 0.386 材积生长量 Volume increment/m3 0.009 ± 0.001 0.041 ± 0.005 0.082 ± 0.074 材积生长率 Volume growth rate/% 5.461 ± 0.388 6.109 ± 0.541 5.687 ± 0.345 小径级林木为主
Small diameter class tree predominant竞争 Competition 10.484 ± 1.122 2.296 ± 0.003 1.025 ± 0.004 材积生长量 Volume increment/m3 0.009 ± 0.001 0.042 ± 0.003 0.081 ± 0.005 材积生长率 Volume growth rate/% 4.827 ± 0.239 6.213 ± 0.259 5.277 ± 0.354 大径级林木为主
Large diameter class tree predominant竞争 Competition 7.264 ± 0.946 3.136 ± 0.531 1.471 ± 0.038 材积生长量 Volume increment/m3 0.010 ± 0.002 0.038 ± 0.004 0.079 ± 0.011 材积生长率 Volume growth rate/% 4.183 ± 0.219 5.877 ± 0.219 5.461 ± 0.235 3. 讨 论
3.1 竞争对树木生长的影响
研究结果表明竞争与林木的材积生长呈显著的负相关关系,随着竞争强度的增加,林木材积生长逐渐变缓,与目前研究结论普遍一致。先前的研究中关注点大多在于竞争或多样性单因素对树木个体生长发育的影响,本研究通过结构方程进一步发现,与多样性相比竞争对树木个体生长的影响更强,说明在本研究范围内,竞争是影响树木生长发育的最重要因素。
树木间的竞争强度随树木大小的增加而减弱并趋于稳定,大径级的树木所受竞争压力较小,材积生长量显著高于小径级树木。小径级树木的竞争压力可能主要来源于同径级树木,这可能是因为部分小径级林木分布较为集中,密度较大,而生长所需资源有限,从而抑制了树木生长。但部分靠近大径级林木的小径级树木生长较好,原因可能是研究区内的树种主要为鱼鳞云杉、红皮云杉、臭冷杉和红松,均为耐阴树种,幼树可以承受林下荫蔽的环境[25]。因此可以考虑对密度较高的小树进行择伐,将靠近大树的部分小树予以保留,从而降低小径级林木间的竞争压力,提高生产力。
在结构较为稳定的云冷杉天然林中,小径级林木数量占比较大,按固定范围选取竞争对象的方法有一定局限性,可能把无关的树木划分为竞争对象,而把距离较远的具有竞争效应的树木排除在外。以空间结构单元为基础计算竞争指数可以在一定程度克服这个缺点,因为该方法不仅考虑了树木间的相对位置,还在一定程度上真实反映小径级树木所受竞争压力的大小。
研究发现大中径级林木更容易受到大径级林木竞争的影响,可能是由于大径级树木所占生态位宽度较大,可利用的资源更多,竞争能力更强,生产力较强[26],因此不易受小径级林木的影响,而主要与相同径级林木进行竞争。因此可以考虑将生长状况较差的大中径级树木伐除,减少竞争压力,提高林分生产力。
3.2 多样性对树木生长的影响
关于树种多样性与林木材积生长的关系,不同学者给出了不同的结论。Versace等[27]的研究发现林分中物种多样性对林木材积的生长产生一定的积极影响,黄小荣[28]通过试验证明物种多样性与林木材积生长呈现出显著的正相关关系。本研究发现树种多样性对树木生长的影响分为两部分,直接影响为负面影响,影响系数为−0.123,间接影响效果则相反,影响系数为0.122,总体上呈现出负相关,影响系数为−0.001,即树种多样性指数高可能会抑制树木材积的生长,但可以降低林分内林木的竞争水平。汪清等[29]的研究中发现,马尾松的竞争力随着混交比例的增加而减小,竞争压力主要来源于种群密度的制约和个体大小的差异。周文嵩[30]也证实了物种多样性的增加可以减少种间竞争,在林分以种间竞争为主时,增加物种多样性可以降低林分的竞争水平。物种多样性对竞争与林木生长的作用还可能是因为物种多样性增加具有部分补偿作用,这使得群落物种–生物量分布相对更加均匀,从而减少了物种间的相互竞争[31]。随着物种丰富度的增加,群落内高碳储量物种增多,种群内的生物量虽然获得了提高,但由于高碳储量的物种一般具有较低的生产力(如演替后期的耐阴物种),导致生产力降低[32]。
本研究发现林分径阶多样性指数对林木材积生长呈现出显著的正相关关系,且全部为直接影响,影响系数为0.166,意味着径阶多样性高可能会促进树木的生长。这可能是因为复杂的直径结构可以使树木在空间中形成多元配置,进而提高资源利用效率[33]。树高多样性对材积生长的影响全部为间接影响,影响系数为0.073,树高分化通过减少物种间的相互竞争进而对林木生长产生促进作用。Hans等[34]在分析大量林冠图后认为复杂的林冠结构可能会增加光的截留量,从而改善了林木个体对干扰的抵抗能力,进而提高了个体的生长发育水平。
多样性对林木生长的积极影响也可能是互补效应的结果[35],有研究证实具有互补特性的混交林的生物量生产力超过了纯林生产力。随着多样性的增加,物种间的生态位分化或植物间的互利作用将提高资源利用效率,从而实现群落生物量的增加。
4. 结 论
本研究从空间结构单元尺度探究东北天然云冷杉林中竞争与多样性因子对林木生长的影响。竞争与林木生长呈现出显著负相关关系,且林木的生长压力多来自于同径级竞争,适当提高多样性水平可以缓解林分间林木的竞争强度或促进林分结构分化,在总体上对林木的生长产生正面的影响。因此,在天然林择伐经营时,若以增加林分蓄积为目的,可通过提高林分内的树种、径阶、树高多样性水平,优先择伐同径级或相近径级树木降低林木竞争水平,促进林木个体生长,以提高整体生产力。
-
![]()
图 2 邻近木空间结构单元
Pi为对象木,i为对象木序号,Pi1、Pi2、Pi3为Pi的最邻近木。圆圈大小表示胸径,圆圈类型表示树种。Pi is the subject tree, i is an order number of subject tree, Pi1, Pi2 and Pi3 are the nearest neighbours. The size of circle is proportional to the size of trees, and circle type indicates tree species.
Figure 2. Spatial structural unit of neighboring trees
![]()
图 3 树木位置图
坐标以样地的西南角为原点,东西方向为x轴,南北方向为y轴。Taking the southwest corner of plot as origin, east-west direction as x-axis, and north-south direction as y-axis.
Figure 3. Tree location map
![]()
图 4 邻近木多样性指数的株数分布
Figure 4. Plant number distribution of neighboring tree diversity index
![]()
图 5 各观测变量Spearman相关性
ΔV. 材积生长量;Δg.胸高断面积生长量;Hd. 径阶多样性指数;Hs.树种多样性指数;Hh.树高多样性指数。 **代表在 P < 0.05 水平上显著相关,***代表在 P < 0.01 水平上显著相关。ΔV, volume increment; Δg, basal area increment; Hd, diameter class diversity index; Hs, tree species diversity index; Hh, tree height diversity index. ** represents significant correlation at P < 0.05 level, *** represents significant correlation at P < 0.01 level.
Figure 5. Spearman correlations for each observed variable
![]()
图 6 结构方程模型修正路径图
竞争与生长量右上角数字为其方差;箭头表示影响关系;箭头上的数据为相应的路径系数,e1 ~ e5分别为相应观察变量的测量误差。Numbers in the upper right corner of competition and growth quantities are their variance; arrows indicate influence relationships; data on the arrows are corresponding path coefficients; e1 to e5 are measurement errors of corresponding observed variables, respectively.
Figure 6. Structural equation model correction path diagram
表 1 林分树木生长状况
Table 1 Tree growth status in the stand
树种
Tree species密度/(株·hm−2)
Density/(tree·ha−1)平均胸径
Average DBH/cm平均高
Average height/m平均材积/(m3·hm−2)
Average volume/(m3·ha−1)平均材积生长量/(m3·hm−2)
Average volume
increment/(m3·ha−1)臭冷杉 Abies nephrolepis 458 16.5 11.5 0.19 0.011 鱼鳞云杉 Picea jezoensis
红皮云杉 Picea koraiensis150 19.9 12.1 0.29 0.015 红松 Pinus koraiensis 95 20.9 12.0 0.33 0.013 紫椴 Tilia amurensis 113 11.7 9.8 0.09 0.005 青楷槭 Acer tegmentosum 108 9.9 9.9 0.11 0.008 枫桦 Betula costata 155 10.8 11.3 0.07 0.006 白桦 Betula platyphylla 56 17.3 13.2 0.18 0.018 花楷槭 Acer ukurunduense 33 7.9 8.8 0.05 0.004 色木槭 Acer pictum 25 12.6 11.1 0.09 0.005 黄檗 Phellodendron amurense 4 15.2 11.8 0.11 0.011 青杨 Populus cathayana 3 15.6 12.5 0.14 0.042 水曲柳 Fraxinus mandshurica 2 7.0 7.1 0.02 0.001 蒙古栎 Quercus mongolica 1 10.2 8.8 0.04 0.006 春榆 Ulmus japonica 1 5.5 7.8 0.01 0.002 其他 Others 86 9.8 10.1 0.06 0.004 合计或均值 Total or average 1 290 14.8 11.2 0.17 0.010  下载: 导出CSV
表 2 单木竞争指数
Table 2 Individual tree competition index
指数 Index 公式 Formula 说明 Remark Hegyi竞争指数[4]
Hegyi competition index (CI)CIi=∑ni=1(DjDi⋅1Dij) Di为对象木i胸径,Dj为邻近木j的胸径,Dij为对象木与邻近木之间的距离,n为邻近木数量,n = 3
Di is DBH of subject tree i, Dj is DBH of neighbouring tree j, and Dij is distance between subject tree and neighbouring tree, n is number of neighbouring tree, n = 3树冠投影面积竞争指数[17] Crown cross-sectional competition index (BDC) BDCi=∑ni=1(CjCi⋅1Dij) Ci是对象木的树冠投影面积,Cj为邻近木树冠投影面积
Ci is projected crown area of subject tree and Cj is projected crown area of neighbouring tree树冠竞争指数[18]
Crown competition index (CCI)CCIi=∑ni=1(HjHi⋅¯Wi+¯Wj−Dij¯Wi) Hi为对象木树高,Hj为邻近木的树高,¯Wi为对象木的平均冠幅半径,¯Wj 为邻近木的平均冠幅半径
Hi is height of subject tree, Hj is height of neighbouring tree, ¯Wi is average crown radius of subject tree, ¯Wj is average crown radius of neighbouring tree
下载: 导出CSV
表 3 各竞争指数的统计
Table 3 Statistics of each competition index
竞争指数
Competition index最小值
Min. value最大值
Max. value平均值 ± 标准误
Mean ± SE标准差
SD标准化后的平均值 ± 标准误
Standardized mean ± SE标准化后的标准差
Standardized SDCCI 0 11.321 2.965 ± 0.066 1.673 0.262 ± 0.006 0.148 BDC 0.055 221.545 9.382 ± 0.793 0.564 0.038 ± 0.004 0.091 CI 0.187 168.515 6.391 ± 0.544 13.825 0.038 ± 0.003 0.082
下载: 导出CSV
表 4 各径级邻近木多样性指数、竞争指数与生长量统计
Table 4 Diversity index, competition index, and growth statistics of neighboring trees at different diameter levels
径级
Diameter class指标
Index材积生长量
Volume
increment/m3材积生长率
Volume
growth rate径阶
多样性指数
Diameter-class
diversity index树种
多样性指数
Species
diversity index树高
多样性指数
Tree-height
diversity index竞争指数
Competition
index小径级
Small-diameter class
(5 cm ≤ DBH < 13 cm)均值 ± 标准误
Mean ± SE0.009 ± 0.001 (4.592 ± 0.154)% 1.114 ± 0.015 0.873 ± 0.021 0.981 ± 0.013 9.016 ± 0.662 标准差
Standard deviation0.016 0.029 0.275 0.382 0.324 15.207 变异系数
Coefficient of variation/%177.778 63.181 24.686 43.757 33.028 168.680 中径级
Medium-diameter class
(13 cm ≤ DBH < 25 cm)均值 ± 标准误
Mean ± SE0.041 ± 0.002 (6.046± 0.155)% 1.197 ± 0.016 0.884 ± 0.024 1.004 ± 0.020 2.864 ± 0.266 标准差
Standard deviation0.033 0.024 0.236 0.343 0.288 4.822 变异系数
Coefficient of variation/%80.488 39.670 19.716 38.801 28.685 168.390 大径级
Large-diameter class
(DBH ≥ 25 cm)均值 ± 标准误
Mean ± SE0.081 ± 0.004 (5.379 ± 0.167)% 1.252 ± 0.034 0.921 ± 0.031 1.056 ± 0.024 1.064 ± 0.112 标准差
Standard deviation0.041 0.017 0.314 0.357 0.258 1.339 变异系数
Coefficient of variation/%50.617 31.604 25.080 38.762 24.432 125.820
下载: 导出CSV
表 5 信度检验和效度检验结果
Table 5 Results of reliability and validity tests
潜变量
Latent variable显变量个数
Number of explicit variable克朗巴哈系数
Cronbach’s alpha coefficientKMO检验
KMO testBartlett球形检验
Bartlett’s sphericity test多样性 Diversity 3 0.297 0.516 0 竞争 Competition 3 0.874 0.712 0 生长量 Growth 2 0.876 0.500 0
下载: 导出CSV
表 6 各指数路径间直接效应、间接效应和总效应及适配性
Table 6 Direct, indirect and total effects and fitness between index pathways
变量因果关系
Causality of variables直接影响系数
Direct impact coefficient间接影响系数
Indirect effect coefficient总影响系数
Total impact coefficientP值
P value树种多样性→竞争
Tree species diversity→Competition−0.250 0 −0.250 < 0.001 树高多样性→竞争
Tree height diversity→ Competition−0.150 0 −0.150 < 0.001 竞争→生长量
Competition→Growth−0.489 0 −0.489 < 0.001 径阶多样性→生长量
Diameter class diversity→Growth0.166 0 0.166 < 0.001 树种多样性→生长量
Tree species diversity→Growth−0.123 0.122 −0.001 < 0.001 树高多样性→生长量
Tree height diversity→Growth0 0.073 0.073 < 0.001 注:“→”表示影响,箭头的指向代表一个因子对另一个因子的影响关系。Notes: “→” indicates impact, pointing of arrow represents the relationship of a factor to the influence of another factor.
下载: 导出CSV
表 7 不同径级对象木邻近木径级分布的竞争与生长状况
Table 7 Competition and growth status of neighbouring tree diameter distribution of subject trees of different diameter classes
邻近木径级分布
Diameter class distribution
of neighboring tree指标
Index对象木径级 Diameter class of subject tree 小径级
Small-diameter class中径级
Medium-diameter class大径级
Large-diameter class总体 Total 竞争 Competition 9.902 ± 0.938 2.572 ± 0.283 1.106 ± 0.131 材积生长量 Volume increment/m3 0.009 ± 0.001 0.041 ± 0.002 0.081 ± 0.004 材积生长率 Volume growth rate/% 4.589 ± 0.151 6.049 ± 0.157 5.377 ± 0.181 全为小径级林木
All small class diameter tree竞争 Competition 14.668 ± 2.665 2.391 ± 0.796 1.232 ± 0.386 材积生长量 Volume increment/m3 0.009 ± 0.001 0.041 ± 0.005 0.082 ± 0.074 材积生长率 Volume growth rate/% 5.461 ± 0.388 6.109 ± 0.541 5.687 ± 0.345 小径级林木为主
Small diameter class tree predominant竞争 Competition 10.484 ± 1.122 2.296 ± 0.003 1.025 ± 0.004 材积生长量 Volume increment/m3 0.009 ± 0.001 0.042 ± 0.003 0.081 ± 0.005 材积生长率 Volume growth rate/% 4.827 ± 0.239 6.213 ± 0.259 5.277 ± 0.354 大径级林木为主
Large diameter class tree predominant竞争 Competition 7.264 ± 0.946 3.136 ± 0.531 1.471 ± 0.038 材积生长量 Volume increment/m3 0.010 ± 0.002 0.038 ± 0.004 0.079 ± 0.011 材积生长率 Volume growth rate/% 4.183 ± 0.219 5.877 ± 0.219 5.461 ± 0.235
下载: 导出CSV
-
[1] 董利虎, 李凤日, 贾炜玮. 林木竞争对红松人工林立木生物量影响及模型研究[J]. 北京林业大学学报, 2013, 35(6): 15−22. Dong L H, Li F R, Jia W W. Effects of tree competition on biomass and biomass models of Pinus koraiensis plantation[J]. Journal of Beijing Forestry University, 2013, 35(6): 15−22.
[2] 惠刚盈, 胡艳波, 赵中华, 等. 基于交角的林木竞争指数[J]. 林业科学, 2013, 49(6): 68−73. doi: 10.11707/j.1001-7488.20130610 Hui G Y, Hu Y B, Zhao Z H, et al. A forest competition index based on intersection angle[J]. Scientia Silvae Sinicae, 2013, 49(6): 68−73. doi: 10.11707/j.1001-7488.20130610
[3] 王妍, 杨华, 李艳丽, 等. 基于结构方程模型的林木竞争指标研究[J]. 北京林业大学学报, 2015, 37(4): 28−37. Wang Y, Yang H, Li Y L, et al. Tree competition index based on the structural equation model[J]. Journal of Beijing Forestry University, 2015, 37(4): 28−37.
[4] Hegyi F. A simulation model for managing jack-pine stands[M]//Fries J. Growth models for tree and stand simulation. Stockholm: Sweden Royal College of Forest, 1974: 74−90.
[5] 范秀华, 张宝权, 范春雨. 长白山典型天然林不同演替阶段物种多样性和结构多样性对生产力影响[J]. 北京林业大学学报, 2021, 43(12): 1−8. doi: 10.12171/j.1000-1522.20210071 Fan X H, Zhang B Q, Fan C Y. Effects of species diversity and structural diversity on productivity in different succession stages of typical natural forest in Changbai Mountains of northeastern China[J]. Journal of Beijing Forestry University, 2021, 43(12): 1−8. doi: 10.12171/j.1000-1522.20210071
[6] 朱杰, 吴安驰, 邹顺, 等. 南亚热带常绿阔叶林树木多样性与生物量和生产力的关联及其影响因素[J]. 生物多样性, 2021, 29(11): 1435−1446. doi: 10.17520/biods.2021014 Zhu J, Wu A C, Zou S, et al. Relationships between tree diversity and biomass/productivity and their influence factors in a lower subtropical evergreen broad-leaved forest[J]. Biodiversity Science, 2021, 29(11): 1435−1446. doi: 10.17520/biods.2021014
[7] Forrester D I, Tang X L. Analysing the spatial and temporal dynamics of species interactions in mixed-species forests and the effects of stand density using the 3-PG model[J]. Ecological Modelling, 2016, 319(9): 233−254.
[8] 惠刚盈. 基于相邻木关系的林分空间结构参数应用研究[J]. 北京林业大学学报, 2013, 35(4): 1−9. Hui G Y. Studies on the application of stand spatial structure parameters based on the relationship of neighbourhood trees[J]. Journal of Beijing Forestry University, 2013, 35 (4): 1−9.
[9] Hui G Y, Zhao X H, Zhao Z H, et al. Evaluating tree species spatial diversity based on neighbourhood relationships[J]. Forest Science, 2011, 57(4): 292−300.
[10] Man R, Yang H. Construction of neighbourhood diversity indices with stem mapping data[J]. Canadian Journal of Forest Research, 2015, 45(8): 1138−1142.
[11] Yang H, Man R. Assessing stand species and structural diversity at neighbourhood scale[J]. MethodsX, 2018(5): 141−148.
[12] 白宇, 杨华, 温静, 等. 基于邻近木的林分结构多样性研究[J]. 北京林业大学学报, 2020, 42(6): 52−58. doi: 10.12171/j.1000-1522.20190120 Bai Y, Yang H, Wen J, et al. Study on forest structure diversity based on the neighbourhood trees[J]. Journal of Beijing Forestry University, 2020, 42(6): 52−58. doi: 10.12171/j.1000-1522.20190120
[13] Laughlin D C, Abella S R, Covington W W, et al. Species richness and soil properties in Pinus ponderosa forests: a structural equation modeling analysis[J]. Journal of Vegetation Science, 2007, 18(2): 231−242. doi: 10.1111/j.1654-1103.2007.tb02534.x
[14] 王树力, 周健平. 基于结构方程模型的林分生长与影响因子耦合关系分析[J]. 北京林业大学学报, 2014, 36(5): 7−12. Wang S L, Zhou J P. Coupling relationship between stand growth and impacting factors based on structural equation model[J]. Journal of Beijing Forestry University, 2014, 36(5): 7−12.
[15] 舒树淼, 赵洋毅, 段旭, 等. 基于结构方程模型的云南松次生林林木多样性影响因子[J]. 东北林业大学学报, 2015, 43(10): 63−67. doi: 10.3969/j.issn.1000-5382.2015.10.013 Shu S M, Zhao Y Y, Duan X, et al. Impact factors of forest diversity in Yunnan pine secondary forest based on structural equation model[J]. Journal of Northeast Forestry University, 2015, 43(10): 63−67. doi: 10.3969/j.issn.1000-5382.2015.10.013
[16] 孜来比·买木提名, 杨华, 赵广亮, 等. 单木竞争指标的研究进展[J]. 西北林学院学报, 2012, 27(6): 152−158. doi: 10.3969/j.issn.1001-7461.2012.06.31 Zilaibi·Mutiming, Yang H, Zhao G L, et al. A review on the competition Indices of individual trees[J]. Journal of Northwest Forestry University, 2012, 27(6): 152−158. doi: 10.3969/j.issn.1001-7461.2012.06.31
[17] Biging G S, Dobbertin M. A comparison of distance-dependent competition measures for height and basal area growth of individual conifer trees[J]. Forest Science, 1992, 38(3): 695−720.
[18] 张晔珵, 张怀清, 陈永富, 等. 基于树冠因子的林木竞争指数研究[J]. 林业科学研究, 2016, 29(1): 80−84. doi: 10.3969/j.issn.1001-1498.2016.01.012 Zhang Y C, Zhang H Q, Chen Y F, et al. Study of tree competition index based on crown feature[J]. Forest Research, 2016, 29(1): 80−84. doi: 10.3969/j.issn.1001-1498.2016.01.012
[19] 刘琪璟. 中国立木材积表[M]. 北京: 中国林业出版社, 2017: 381. Liu Q J. Tree volum tables of China[M]. Beijing: China Forestry Publishing House, 2017: 381.
[20] Cronbach L. Coefficient alpha and the internal structure of tests[J]. Psychometrika, 1951, 16(3): 297−334. doi: 10.1007/BF02310555
[21] 王妍. 基于结构方程模型的林木竞争指标研究[D]. 北京: 北京林业大学, 2014. Wang Y, Tree competition index based on the structural equation model[D]. Beijing: Beijing Forestry University, 2014.
[22] 董灵波, 田栋元, 陈莹, 等. 基于结构方程模型的兴安落叶松天然林更新影响因素[J]. 应用生态学报, 2021, 32(8): 2763−2772. Dong L B, Tian D Y, Chen Y, et al. Clarifying the factors affecting Larix gmelinii forest regeneration based on structural equation model[J]. Chinese Journal of Applied Ecology, 2021, 32(8): 2763−2772.
[23] 曹小玉, 委霞, 赵文菲, 等. 基于结构方程模型的森林健康评价[J]. 生态学杂志, 2021, 40(8): 2635−2647. Cao X Y, Wei X, Zhao W F, et al. Evaluation of forest health based on structural equation model[J]. Chinese Journal of Ecology, 2021, 40(8): 2635−2647.
[24] 李建军, 李际平, 刘素青, 等. 基于Hegyi改进模型的红树林空间结构竞争分析[J]. 中南林业科技大学学报, 2010, 30(12): 23−27. doi: 10.3969/j.issn.1673-923X.2010.12.005 Li J J, Li J P, Liu S Q, et al. The Mangrove spatial structure competitive analysis based on Hegyi improved model[J]. Journal of Central South University of Forestry & Technology, 2010, 30(12): 23−27. doi: 10.3969/j.issn.1673-923X.2010.12.005
[25] 闫旭, 张心艺, 李阳宁, 等. 复层林对闽楠幼树生长、叶片形态和光合特性的影响[J]. 植物科学学报, 2022, 40(4): 553−564. doi: 10.11913/PSJ.2095-0837.2022.40553 Yan X, Zhang X Y, Li Y N, et al. Effects of unevenly aged two-layer mixed forest on growth, leaf morphology, and photosynthetic characteristics of Phoebe bournei (Hemsl.) Yang saplings[J]. Plant Science Journal, 2022, 40(4): 553−564. doi: 10.11913/PSJ.2095-0837.2022.40553
[26] 董雪婷, 张静, 张志东, 等. 树种相互作用、林分密度和树木大小对华北落叶松生产力的影响[J]. 应用生态学报, 2021, 32(8): 2722−2728. Dong X T, Zhang J, Zhang Z D, et al. Effects of tree species interaction, stand density, and tree size on the productivity of Larix principis-rupprechtii[J]. Chinese Journal of Applied Ecology, 2021, 32(8): 2722−2728.
[27] Versace S, Garfì V, Dalponte M, et al. Species interactions in pure and mixed-species stands of silver fir and European beech in Mediterranean mountains[J]. iForest, 2021, 14: 1−11. doi: 10.3832/ifor3476-013
[28] 黄小荣. 广西马尾松林植物功能多样性与生产力的关系[J]. 生物多样性, 2018, 26(7): 690−700. Huang X R. Relationship between plant functional diversity andproductivity of Pinus massoniana plantations in Guangxi[J]. Biodiversity Science, 2018, 26(7): 690−700.
[29] 汪清, 潘萍, 欧阳勋志, 等. 马尾松–木荷不同比例混交林种内和种间竞争强度[J]. 生态学杂志, 2021, 40(1): 49−57. Wang Q, Pan P, Ouyang X Z, et al. Intraspecific and interspecific competition intensity in mixed plantation with different proportion of Pinus massoniana and Schima superba[J]. Chinese Journal of Ecology, 2021, 40(1): 49−57.
[30] 周文嵩. 华北落叶松次生林种内、种间关系及影响机制研究[D]. 北京: 北京林业大学, 2018. Zhou W S. Research on intraspecific and interspecific relationship and impact mechanism of Larix principis-rupprechtii in secondary forests[D]. Beijing: Beijing Forestry University, 2018.
[31] 邹顺, 周国逸, 张倩媚, 等. 1992—2015年鼎湖山季风常绿阔叶林群落结构动态[J]. 植物生态学报, 2018, 42(4): 442−452. Zou S, Zhou G Y, Zhang Q M, et al. Long-term (1992–2015) dynamics of community composition and structure in a monsoon evergreen broad-leaved forest in Dinghushan Biosphere Reserve[J]. Chinese Journal of Plant Ecology, 2018, 42(4): 442−452.
[32] 吴初平, 韩文娟, 江波, 等. 浙江定海次生林内物种丰富度与生物量和生产力关系的环境依赖性[J]. 生物多样性, 2018, 26(6): 545−553. doi: 10.17520/biods.2017320 Wu C P, Han W J, Jiang B, et al. Relationships between species richness and biomass/productivity depend on environmental factors in secondary forests of Dinghai, Zhejiang[J]. Biodiversity Science, 2018, 26(6): 545−553. doi: 10.17520/biods.2017320
[33] 朱锦迪. 浙江省针阔混交林生产力及其结构研究[D]. 杭州: 浙江农林大学, 2021. Zhu J D. Study on the productivity and structure of coniferous and broad-leaved mixed in Zhejiang Province[D]. Hangzhou: Zhejiang A&F University, 2021.
[34] Hans P. Canopy space filling and tree crown morphology in mixed-species stands compared with monocultures[J]. Forest Ecology & Management, 2014, 327: 251−264.
[35] Nyfeler D, Huguenin-Elie O, Suter M, et al. Strong mixture effects among four species in fertilized agricultural grassland led to persistent and consistent transgressive overyielding[J]. Journal of Applied Ecology, 2009, 46(3): 683−691.
计量
- 文章访问数: 301
- HTML全文浏览量: 55
- PDF下载量: 39
