
Seasonal dynamics and influencing factors of multi-scale respiration in Artemisia ordosica community in Mu Us Sandy Land of northern China
-
摘要:目的
比较不同观测尺度呼吸对环境因素的响应,特别是对温度和水分的响应,理解多尺度呼吸作用的影响机制,以期提升跨观测尺度呼吸模型模拟精度。
方法在宁夏盐池选取典型黑沙蒿群落,于2022年5—10月,在固定样地原位连续监测黑沙蒿叶片、土壤与生态系统呼吸速率(即Rl、Rs与Re),拟合呼吸与温度、水分之间的关系,了解多尺度呼吸的季节动态特征及其环境影响因素。
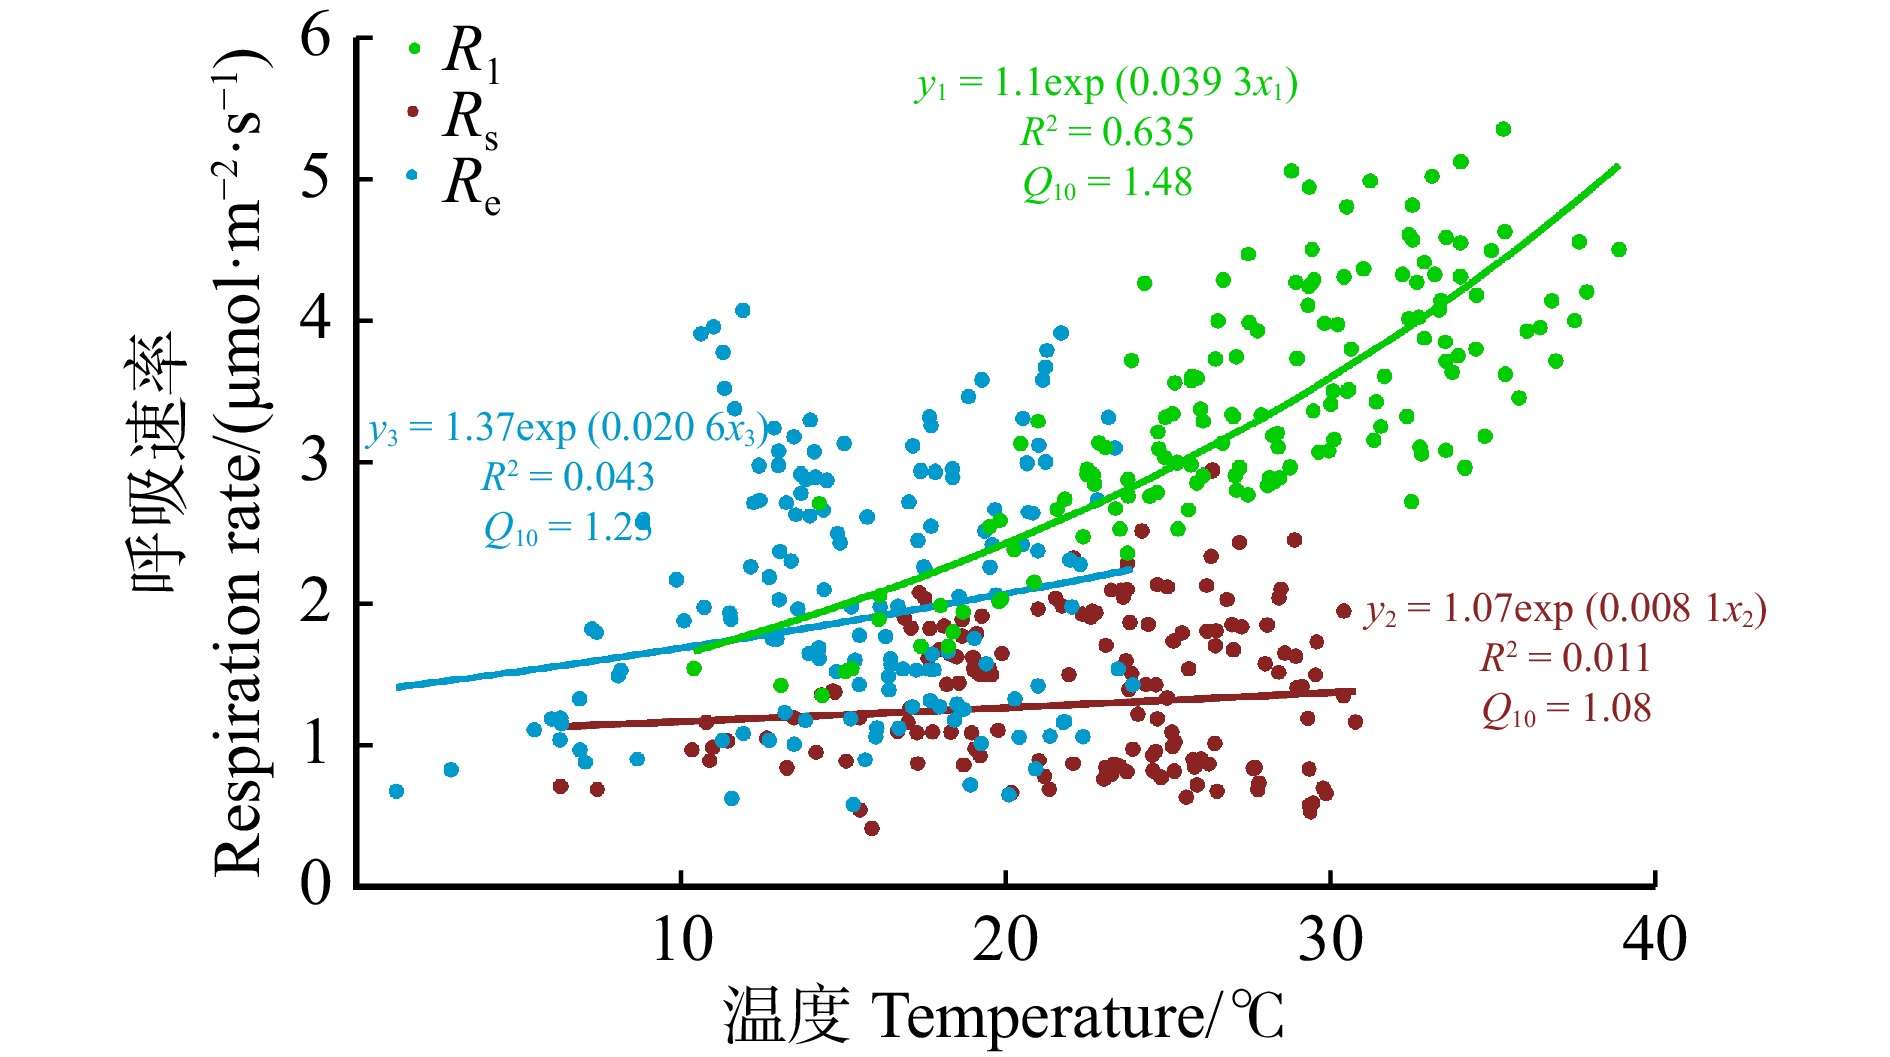
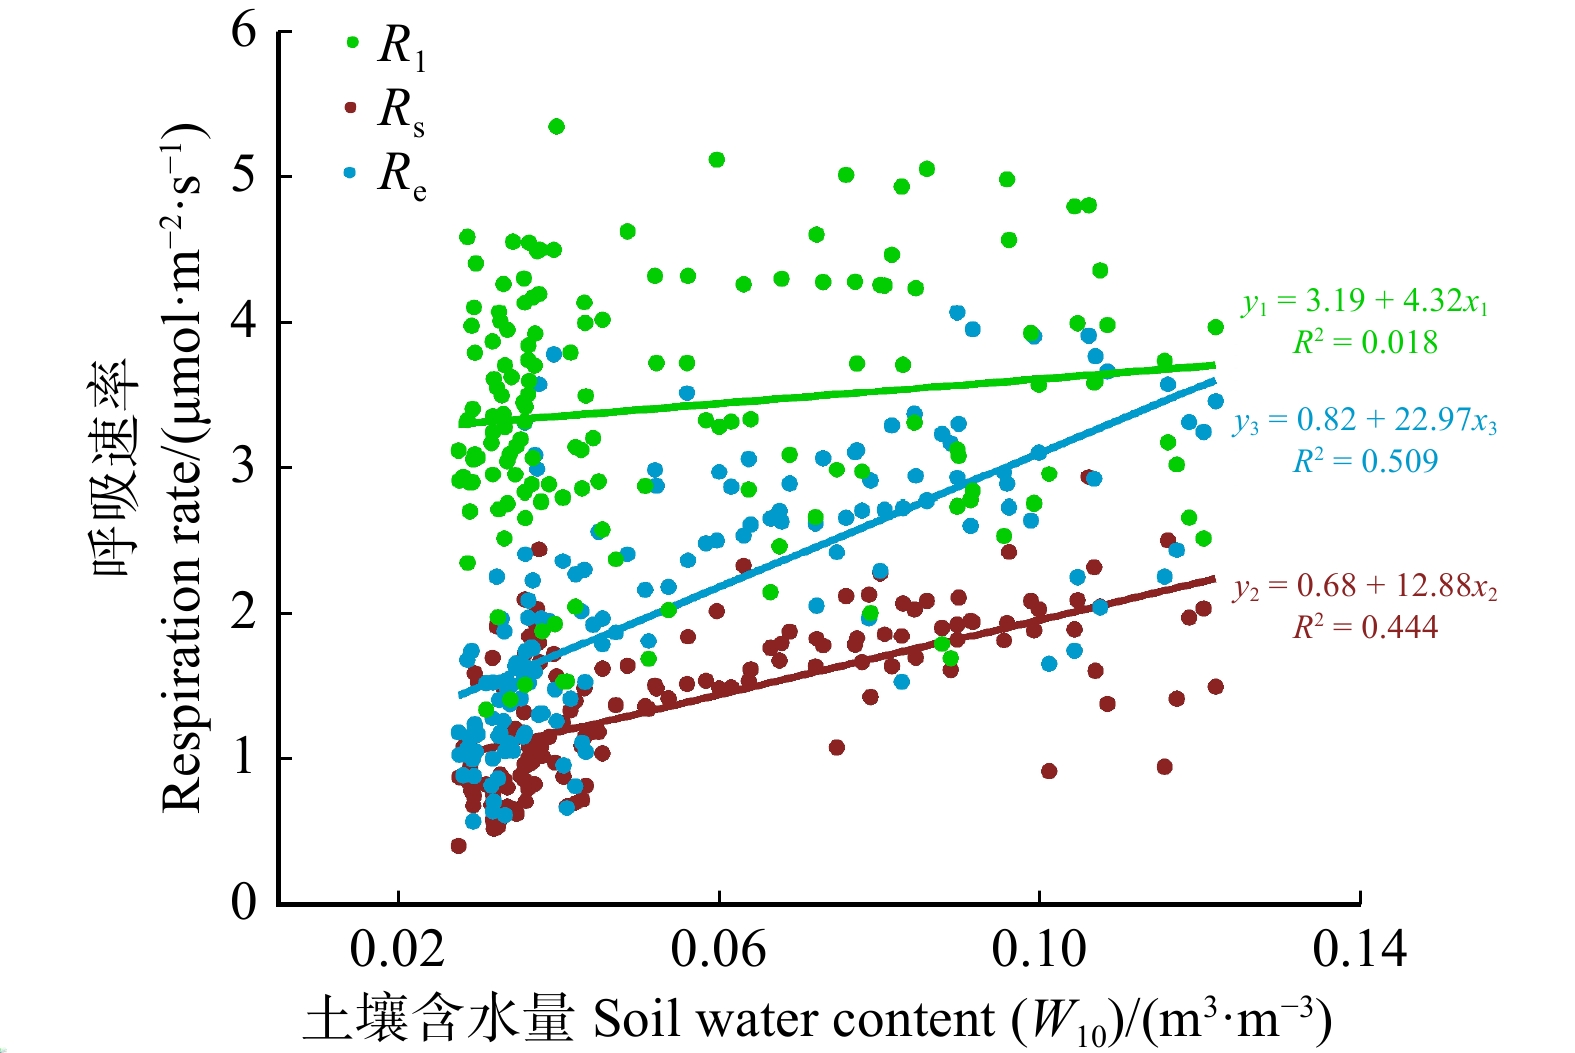
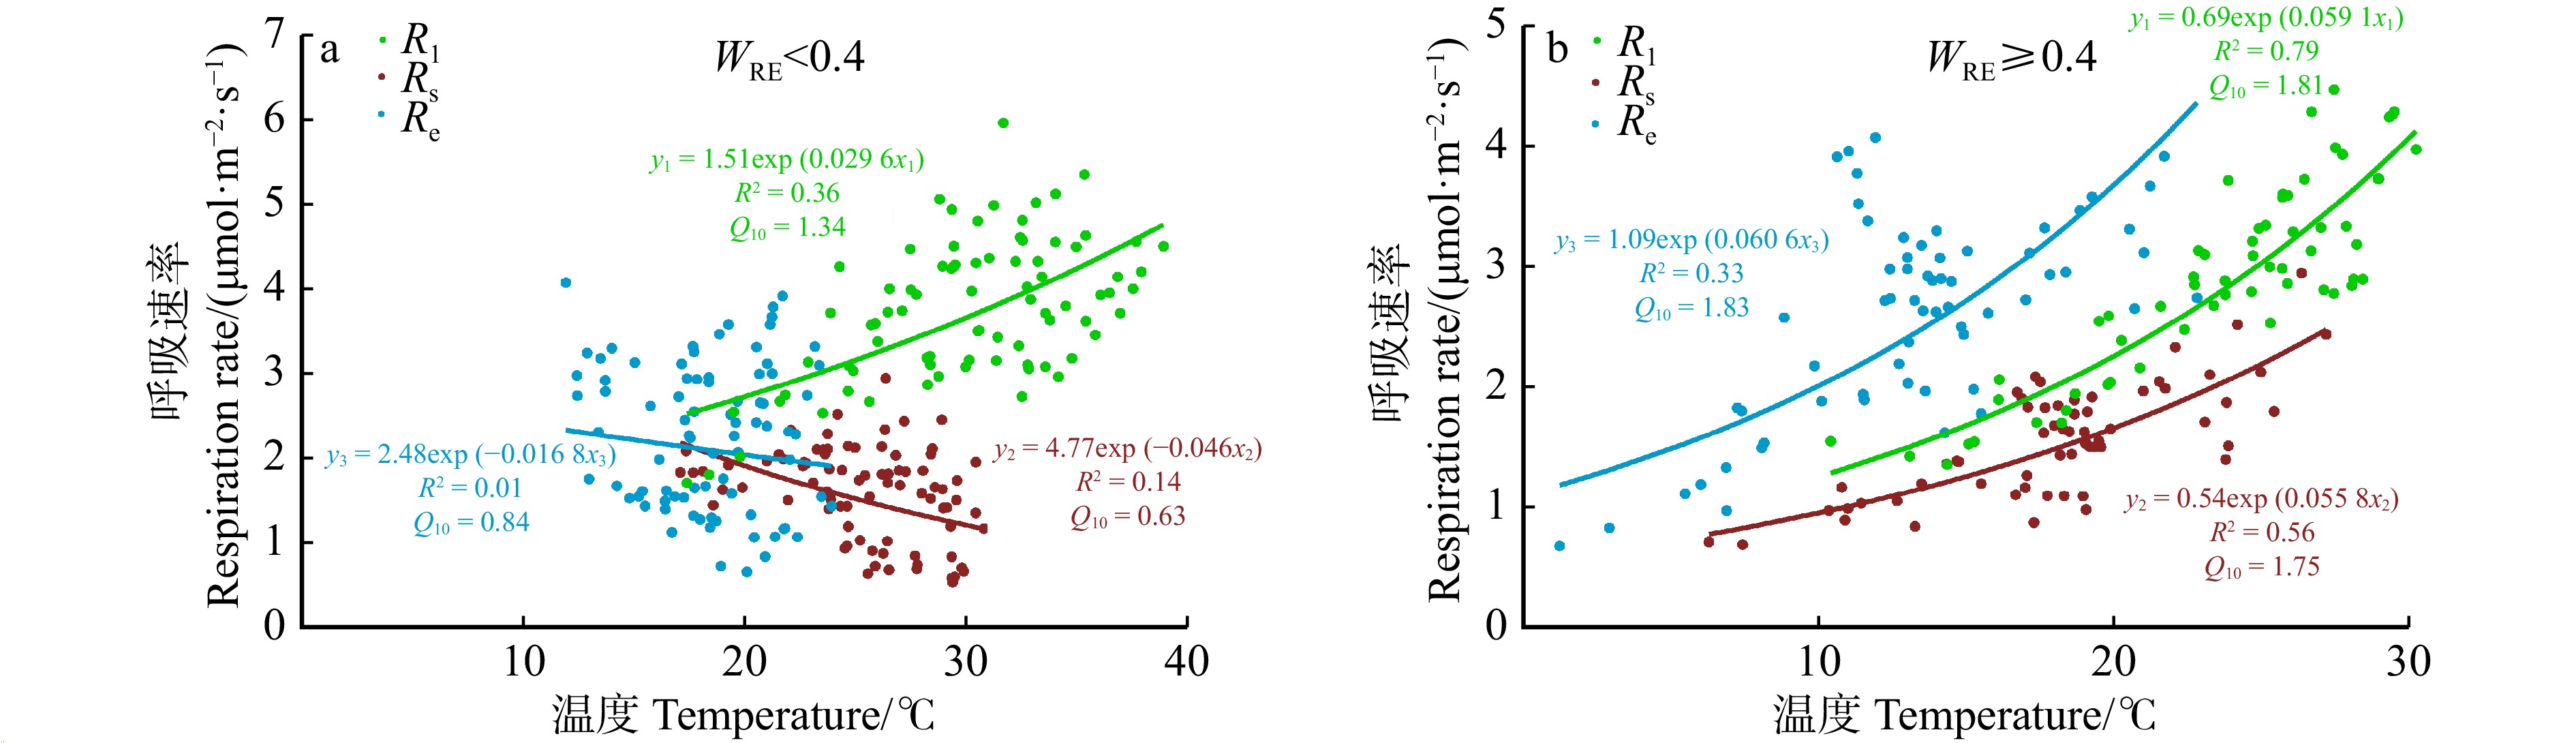
结果(1)观测期内,Rl主要受温度调控(R2为63.5%),温度敏感性(Q10)为1.48,Rl日均值最大为5.96 μmol/(m2·s),出现在7月;Rs和Re季节变化均受水分调控(R2分别为44.4%和50.9%),Q10分别为1.23和1.08,Rs和Re最大日均值均出现在8月,分别为2.94 μmol/(m2·s)和4.07 μmol/(m2·s)。(2)温度–水分双变量经验模型对Rl、Rs和Re的解释能力相较于单变量模型提升程度有限,平均R2分别增加了0.09、0.05和0.02。(3)水分条件是不同观测尺度呼吸温度敏感性是否趋于一致的关键因素。当土壤水分条件较差时(相对土壤含水量WRE < 0.4时),Rl、Rs和Re对温度的响应有显著差异,Q10分别为1.34、0.63和0.84;当土壤水分条件较好时(WRE ≥ 0.4),Rl、Rs和Re对温度的响应趋于一致,Q10约1.8。
结论不同观测尺度呼吸季节变化的调控因素存在差异,而双变量模型对提升不同观测尺度呼吸模拟的精确性作用有限,充分考虑不同观测尺度以及同尺度水分条件的差异是未来准确模拟干旱或半干旱地区呼吸作用的关键。
Abstract:ObjectiveBy comparing the responses of respiration at different observation scales to environmental factors, especially the similarities and differences in temperature and water responses, we aimed to understand the impact mechanism of multi-scale respiration and improve the simulation of cross observation scale respiration models.
MethodThis study selected a typical Artemisia ordosica community in Yanchi, Ningxia of northwestern China as a research site, and conducted continuous observation of Artemisia ordosica leaf, soil, and ecosystem respiration (i.e., Rl, Rs and Re) characteristics from May to October, 2022 using fixed plot measurement and in situ continuous monitoring. By fitting nonlinear and linear equations to the relationship between respiration and temperature and moisture content, we can better understand the seasonal dynamic characteristics of multi-scale respiration and its environmental influencing factors.
Result(1) The study found that during the observation period, the maximum value of Rl was 5.96 μmol/(m2·s), which occurred in July and was primarily regulated by temperature (R2 = 63.5%) with a temperature sensitivity (Q10) of 1.48. The maximum values of both Rs and Re occurred in August, at 2.94 μmol/(m2·s) and 4.07 μmol/(m2·s), respectively, and their seasonal changes were regulated by moisture (R2 of 44.4% and 50.9%, respectively), with Q10 values of 1.23 and 1.08. (2) The explanatory power of temperature moisture bivariate empirical model for Rl, Rs and Re was limited compared with the univariate model, with an average R2 increase of 0.09, 0.05, and 0.02, respectively. (3) Water availability was the key factor influencing whether the temperature sensitivity of different observation scale respiration tends to be consistent. When soil moisture conditions were poor (relative extractable soil water, WRE < 0.4), there were significant differences in the response of Rl, Rs and Re to temperature, with Q10 values of 1.34, 0.63 and 0.84, respectively; when the soil moisture conditions were sufficient (WRE ≥ 0.4), the response of Rl, Rs and Re to temperature tended to be consistent, with Q10 values ≈ 1.8.
ConclusionOur study emphasizes the differences in the regulatory factors of seasonal changes in respiration at different observation scales, while the bivariate model has a limited role in improving the accuracy of respiration simulation at different observation scales. Fully considering the differences in observation scale and water conditions is the key to accurately simulating respiration in arid or semiarid areas in the future.
-
Keywords:
- Artemisia ordosica /
- ecosystems /
- leaf respiration /
- Mu Us Sandy Land /
- temperature sensitivity /
- soil respiration
-
竹材具生长周期短、硬度强、韧性高、可降解的生物性材料。且在现有木材资源不能适应家具产业发展迫切需要的情况下,竹材是取代实木的最理想材料[1],竹集成材作为保持了竹材优异的物理力学性能的竹制家具用材,具有良好的发展前景。众所周知,竹材容易受外界环境如光照、水、微生物等的侵害而发生变色、腐朽[2],竹集成材亦如是。对竹集成材进行表面涂饰是最能够有效保护其性能的方法之一。
以水作为溶剂的水性漆与传统油性漆相比,不含挥发性有机物(volatile organic compounds,VOCs),具有绿色环保、节约资源的特性[3]。伴随着国家环保政策的不断完善和绿色环保理念的普及,水性漆在家具、室内装饰、建筑等领域将逐步替代传统涂料[4]。然而竹集成材水性漆涂饰面临着竹集成材密度大,纹孔少,横向渗透困难等问题[5],使得水性漆漆膜附着力差,竹集成材水性漆涂饰工业化进度缓慢。为了克服这些问题,Lu[6]通过对毛竹表面进行过氧化氢表面预处理的方法,提高了水性漆在毛竹表面的附着力。此外其他研究人员通过使用湿热处理[7-8]、碱液浸泡处理[9]等方法,也在一定程度上提高了竹材表面的润湿性和粗糙度,改善了水性漆等流体在竹材内部的渗透效率,漆膜的附着力由此增强。涂饰工艺对涂料性能的发挥有着重要影响,是涂饰过程中的关键技术环节。但目前有关水性涂饰工艺的研究还着重于水曲柳、杨木等木质材料上[10-12],对竹集成材涂饰工艺研究较少,且未有水性清漆和色漆对竹集成材硬度、附着力等漆膜性能影响方面的研究。
为了解决竹集成材水性涂装这些难题,本研究以家具中最为常用的毛竹集成材为基材,在省去预处理的基础上优化了竹集成材水性涂饰工艺,提高了水性涂饰工艺的效率,系统地探究了竹集成材清漆与色漆涂饰性能的影响及竹集成材水性漆漆膜的附着机理,为竹家具的水性化涂装提升提供理论支持和科学依据。
1. 材料与方法
1.1 材 料
选取含水率为11%的毛竹集成材,制成尺寸为100 mm(长) × 100 mm(宽) × 10 mm(厚)的试样18块,并对试样在室温和湿度为(65 ± 3)%的环境下进行打磨。选用涂料为自制水性底漆和商业水性面漆(分为清漆与色漆两种类型,主要成分为水性聚氨酯树脂,底漆固体含量为39.2%,面漆固体含量为34.6%)。
1.2 基材涂饰
依次用80目、120目、180目和240目砂纸对基材进行顺纹打磨并用羊毛刷除尘。涂饰前底漆与面漆分别添加5% 和8%的去离子水进行调配。调配底漆涂布量为80 g/m2,面漆涂布量为120 g/m2,在室温下均匀地喷涂底漆3遍、面漆1遍,每遍喷涂干燥之后再次顺纹打磨1遍(图1)。涂饰完后基材后在室温下干燥8 h。
1.3 测试方法
将无差别的18个样品分为A、B和C这3组,每组6个,按照字母加数字的方式编号成A1 ~ A6、B1 ~ B6和C1 ~ C6。
1.3.1 漆膜硬度、附着力、光泽度测试
选取A组试样进行漆膜的硬度测试。根据ISO 15184—1998 《色漆和清漆 铅笔法测定漆膜硬度》标准测试。选取B组试样进行漆膜的附着力测定。根据ISO 2409—2013《色漆和清漆交叉切割试验》中的检测标准,按照规定的步骤,使用QFH漆膜划格仪依次对每个试样进行测定。参照ISO 2813—2014《色漆和清漆在20°、60°和85°非金属色漆漆膜镜面光泽的测定》使用60°光泽度仪对C组和对照试样进行光泽度测试。
1.3.2 表面粗糙度测试
参照GB/T 12472—2003《产品几何量技术规范(GPS) 表面结构 轮廓法 木制件表面粗糙度参数及其数值》,使用TR240便携式表面粗糙度仪测试试样的表面粗糙度,将触针的运动转变为电信号,测量出各粗糙度参数。设置取样长度为2.5 mm,为了提高准确率,在每一块试件上选取4 个点测试,并对测试结果进行记录。
1.3.3 色度值测试
使用SP60色差仪按照国际照明委员会CIE标准色度系统对C组试样基材涂饰前后的颜色变化进行定量的度量。CIE由L*、a*、b*这3个数值进行评估。L*表示亮度;a*表示红绿,数值变化由正到负,表示颜色从红(正)到绿(负);b*表示黄蓝,数值变化由正到负,表示颜色从黄(正)到蓝(负)。总色差值ΔE表示颜色知觉差异,数值越小则表示颜色变化越小。ΔE由公式(1)确定:
ΔE=√ΔL∗2+Δa∗2+Δb∗2 (1) 式中:ΔL*、Δa* 和Δb*分别为涂饰前后的L*、a*和b*差值。
1.3.4 扫描电镜(scanning electron microscope,SEM)分析
使用场发射环境扫描电镜(FEG-ESEM,XL30ESEMFEG,FEI Company,USA)观察并记录基材涂饰前后的表面形态。将加速电压设置为7 kV后,着重对涂饰后基材与漆膜界面结合处的形态进行观察。
1.3.5 傅里叶变换红外光谱(Fourier transform infrared spectroscopy,FTIR)分析
用溴化钾压片法分别测定涂饰前后试样的FTIR。设置光谱分辨率为4 cm−1,在500 ~ 4 000 cm−1范围内,利用傅里叶变换红外光谱仪(Nicolet6700傅里叶红外光谱仪,Thermo Scientific, Waltham, USA)扫描得到清漆、色漆、竹集成材、清漆和色漆涂饰后的基材的5种FTIR。测试完成后,将所有5个样品的光谱绘制成图表,分析每个样品的特征峰的变化,并据此探究水性漆与竹集成材的结合机理。
2. 结果与讨论
2.1 漆膜硬度与附着力
漆膜硬度代表了涂饰在基材上的漆膜的机械强度,反映了漆膜对来自外界的碰擦、刺划等机械作用的耐受能力[13]。从表1可以看出:清漆的漆膜硬度为1H,而色漆的漆膜硬度为2H。这是因为漆膜的硬度是由成膜物质的性能所决定的,色漆中含有较高硬度的颜料,因而色漆的硬度优于清漆。但两者的硬度均能够满足GB/T 3324—2017《木家具通用技术条件》中室内装饰、实木地板的使用要求[14]。此外,我们发现清漆和色漆的漆膜硬度均比之前研究的水性漆涂饰水曲柳所得的硬度高[12],这充分说明了水性漆采用喷涂的涂饰工艺能在竹集成材上产生能媲美在木材上的效果。
表 1 水性漆漆膜的硬度与附着力Table 1. Hardness and adhesion of film of waterborne paint清漆 Varnish 色漆 Color paint 试件 Sample 硬度 Hardness 附着力 Adhesion 试件 Sample 硬度 Hardness 附着力 Adhesion A1 1H 0级 Grade 0 B1 2H 1级 Grade 1 A2 1H 0级 Grade 0 B2 2H 1级 Grade 1 A3 1H 0级 Grade 0 B3 2H 1级 Grade 1 A4 1H 0级 Grade 0 B4 2H 1级 Grade 1 A5 1H 0级 Grade 0 B5 2H 1级 Grade 1 A6 1H 0级 Grade 0 B6 2H 1级 Grade 1 平均值 Average value 1H 0级 Grade 0 平均值 Average value 2H 1级 Grade 1 漆膜附着力是指导家具涂装工艺优化方向的关键数据,也是影响漆膜性能的重要指标之一[15-16]。由表1可知:清漆漆膜的附着力比色漆漆膜的附着力更高,可达为最高的0级,这是由于色漆由于含有颜料,其固含量高于清漆,所以清漆具有更高的渗透能力,因而清漆能更好地填充在基材的细胞腔里。从SEM图中也能清晰地看到涂饰前后的差别。在未涂饰基材图(图2a、2b)中可以看到有较大的导管存在基材的横切面上,而纵切面上较多的则是裸露的细胞腔,基材表面裸露的细胞腔为水性漆在基材表面良好的附着性能提供了一定的基础。基材涂饰清漆和色漆后(图2c、2d),沟槽状的细胞腔和细胞胞间层中都有成膜物填充,因而达到较强的附着力。且从图2c、2d中也能看出:因清漆的渗透性能更好,使得在相同涂布量下,色漆的漆膜厚度明显高于清漆。此外,竹集成材水性清漆涂饰的漆膜附着力与之前研究的木材水性漆涂饰的附着力相当[12]。这也再次证明了使用“三低一面”的喷涂涂饰工艺能达到较好的漆膜性能。
2.2 光泽度
漆膜的光反射能力是通过漆膜的光泽度来衡量的,在一定范围内,随着竹材基材的表面光泽度增加,视觉效果变好[17]。涂饰前后基材的光泽度一般区分为垂直竹材纹理的光泽度值(gloss value of vertical bamboo texture,GZT)和平行竹材纹理的光泽度值(gloss value of parallel bamboo texture,GZL)。由图3可得涂饰后试样光泽度明显高于未涂饰试样,这是因为水性漆成膜物的光泽度比竹材自身的光泽度高。清漆涂饰后的平均GZT和GZL分别为19.83和21.24,色漆涂饰后的分别为21.39和22.93,均比未涂饰时提高了5倍以上,大大提升了竹集成材的装饰效果。且色漆因颜料填料含量较高,成膜物质在竹材表面固着占比更多,从而使得色漆光泽度均高于清漆。通过进一步对比发现试样的GZL均高于GZT,这是因为竹材大多数细胞是轴向排列的,在平行纹理方向,大部分细胞被剖开,细胞腔呈沟槽状暴露出来,因此成膜物容易填充到腔径大的细胞腔中;细胞壁的相对含量在垂直纹理方向上较多,因此成膜物很难渗透到具有纳米级孔的细胞壁中,导致平行纹理方向上成膜物的含量高于垂直纹理方向上的含量,因此其光泽度也显著增加[18-19]。
![]() 图 3 基材涂饰前后光泽度GZT为光泽度仪垂直于木材纹理方向时所测得的光泽度值;GZL为光泽度仪平行于木材纹理方向时所测得的光泽度值。 GZT is the glossiness value measured when glossmeter is perpendicular to the direction of wood texture. GZL is the glossiness value measured when glossmeter is parallel to the direction of wood texture.Figure 3. Glossiness of substrate before and after painting
图 3 基材涂饰前后光泽度GZT为光泽度仪垂直于木材纹理方向时所测得的光泽度值;GZL为光泽度仪平行于木材纹理方向时所测得的光泽度值。 GZT is the glossiness value measured when glossmeter is perpendicular to the direction of wood texture. GZL is the glossiness value measured when glossmeter is parallel to the direction of wood texture.Figure 3. Glossiness of substrate before and after painting2.3 表面粗糙度
表面粗糙度是指竹材在加工的过程中表面留下的各种不同程度的微观加工痕迹或不平度,常被用来评价竹材表面的质量,将会直接影响竹材的涂饰效果以及涂料的用量,常用轮廓算数平均偏差Ra、轮廓算数均方偏差Rq、微观不平度十点高度Rz和轮廓最大高度Ry表示[20]。本实验主要采用Ra表征试样的表面粗糙度,Ra的值越小,说明其表面越光滑平整。不同涂饰情况对应试样的表面粗糙度和电镜图见图4和图5。涂饰后的Ra值均小于未涂饰的Ra值,从SEM图也可以清楚地看出基材裸露的细胞腔被水性漆覆盖,表面粗糙度降低。且清漆涂饰后的Ra值比色漆涂饰后的Ra值小。这是因为色漆中含有颜料颗粒(图5b),可能影响成膜的交联程度,这导致涂饰色漆后表面粗糙度高于涂饰清漆后的表面粗糙度。
![]() 图 4 涂饰前后试样表面粗糙度平均值Ra为评定轮廓的算数平均偏差; Rz为微观不平度十点高度,是指在取样长度内5 个最大的轮廓峰高的平均;Rq为评定轮廓的算数均方偏差;Ry为轮廓最大高度,是指在取样长度内,轮廓峰顶线和轮廓谷底线之间的距离。Ra is the arithmetical mean deviation of assessed profile; Rz is the height of ten points of micro unevenness, which refers to the average of five maximum contour peak heights within the sampling length; Rq is the root mean square deviation of the assessed profile; Ry is the maximum height of profile, which refers to the distance between the contour peak line and the contour bottom line within the sampling length.Figure 4. Surface roughness of substrate before and after painting
图 4 涂饰前后试样表面粗糙度平均值Ra为评定轮廓的算数平均偏差; Rz为微观不平度十点高度,是指在取样长度内5 个最大的轮廓峰高的平均;Rq为评定轮廓的算数均方偏差;Ry为轮廓最大高度,是指在取样长度内,轮廓峰顶线和轮廓谷底线之间的距离。Ra is the arithmetical mean deviation of assessed profile; Rz is the height of ten points of micro unevenness, which refers to the average of five maximum contour peak heights within the sampling length; Rq is the root mean square deviation of the assessed profile; Ry is the maximum height of profile, which refers to the distance between the contour peak line and the contour bottom line within the sampling length.Figure 4. Surface roughness of substrate before and after painting2.4 色度值
色差是指两种颜色之间的差异。色差值是色差的数值表达。色差和色差值受涂料成分、涂饰工艺等因素的影响[21]。涂膜前后的色度值变化如图6所示。涂饰清漆前L*值为72.38,涂饰清漆后降低至64.37;a*值由原来的7.03增加到10.12;b*值由24.48增加到30.64。结果表明,涂层后基材表面明度略有下降,红色和黄色指数略有增加。ΔE较小为10.56,说明涂饰清漆前后竹集成材的表面颜色相差不大。这是因为水性清漆不含颜料,在竹集成材表面固化后是透明的,能较好地保持竹集成材本身的颜色。而涂饰色漆后L*值降低至34.74;a*值增加到12.03;b*值降低至18.30。说明涂层后基材表面明度有一定程度的下降,红色和蓝色指数略有增加。ΔE值较大,为38.46,这表明竹集成材表面的色彩特征因色漆中颜料的颜色发生了较大程度的改变。
![]() 图 6 涂饰前后色度值对比L*表示亮度;a*表示红绿;b*表示黄蓝。 L* indicates lightness, a* indicates red and green, and b* indicates yellow and blue.Figure 6. Comparison of chromaticity values before and after painting
图 6 涂饰前后色度值对比L*表示亮度;a*表示红绿;b*表示黄蓝。 L* indicates lightness, a* indicates red and green, and b* indicates yellow and blue.Figure 6. Comparison of chromaticity values before and after painting2.5 FTIR分析
图7显示了各试样的FTIR,可以看出:3 436 cm−1处吸收峰是由−OH伸缩振动引起的,与其他谱线相比,竹材谱线在这一位置的峰值明显最强,且涂饰后色漆和清漆在1 724 cm−1处(C=O的拉伸振动特征峰)的强度分别较纯色漆与清漆小得多,在1 143 cm−1处(酯基中C−O伸缩振动峰)的峰值比竹材谱线的更强,说明水性漆中的极性分子(如羧基、羟基)与基材中的羟基结合后,水性底漆中的羧基与基材中的羟基发生了酯化反应,两者之间形成了氢键使结合更加稳固[22-23]。此外色漆在2 921 cm−1(−CH2反对称伸缩振动峰)、1 724 cm−1(C=O的拉伸振动特征峰)、1 460 cm−1(−CH2弯曲振动峰)、1 143 cm−1(C−O伸缩振动)处的峰值均比清漆所在的峰值高,这是由于色漆中相应的基团的占比比清漆中的高。所以水性底漆除物理结合外,还会与基材发生化学反应,使成膜物能很好地附着在竹集成材表面。
![]() 图 7 水性漆与竹集成材涂饰前后的红外表征Figure 7. Infrared characterization of waterborne paint and bamboo laminated lumber before and after painting
图 7 水性漆与竹集成材涂饰前后的红外表征Figure 7. Infrared characterization of waterborne paint and bamboo laminated lumber before and after painting3. 结 论
本研究所获得的清漆的漆膜硬度为1H,色漆的漆膜硬度为2H。涂饰后,水性漆与竹集成材以机械互锁的物理形式和化学反应结合的形式使成膜物质能很好地附着在基材表面。由于色漆中含有颜料,清漆的附着性能优于色漆,可达最高的0级,与木材水性涂饰的附着性能相当。而颜料颗粒的存在影响了成膜的交联程度,使得色漆的表面粗糙度高于清漆。清漆和色漆涂饰后基材的光泽度提高了5倍以上,且平行纹理方向上的光泽度高于垂直纹理方向上。因色漆含有颜料,清漆涂饰前后总色差值较低,较好地保持了竹集成材本身优美的颜色。因此,本水性涂饰工艺在竹集成材上能获得较好的漆膜性能和较强的附着力,并能在很大程度上提升了竹集成材的装饰效果,为竹材及其制品的水性化涂装提供了重要的理论和技术支持。
-
![]()
图 3 不同观测尺度呼吸对相应温度的响应
Figure 3. Response of respiration at different observation scales to corresponding temperatures
![]()
图 4 不同观测尺度呼吸对水分的响应
Figure 4. Response to water by respiration at different observation scales
![]()
图 5 不同水分条件下不同观测尺度呼吸对温度的响应
WRE. 相对土壤含水量。WRE, Relative soil moisture content.
Figure 5. Response of respiration to temperature at different observation scales under varied moisture conditions
表 1 叶片呼吸单变量和双变量模型
Table 1 Univariate and bivariate models of leaf respiration
模型 Model 叶片呼吸模型
Leaf respiration modela b c d AIC R2 RMSE Q10 R1=ab(Tl−10)/10 1.86 1.39 −155.51 0.54 0.60 Quadratic Rl = aTl2 + bTl + c −0.002 0.25 −1.45 −172.03 0.59 0.57 Logistic Rl = a/(1 + exp(b(c − Tl))) 4.63 0.14 19.21 −174.61 0.60 0.56 Linear Rl = aW10 + b 4.32 3.19 −38.62 0.02 0.88 Exponential Rl = aexp(bW10) 3.20 1.22 −38.49 0.02 0.88 Quadratic Rl = aW102 + bW10 + c −110.80 19.22 2.78 −39.42 0.02 0.88 Logistic Rl = a/(1 + exp(b(c − W10))) 3.65 32.41 −0.04 −39.02 0.02 0.88 Q10 power Rl=ab(Tl−10)/10×W10c 3.08 1.49 0.21 −201.07 0.66 0.51 Logistic power Rl = a/(1 + exp(b(c − Tl))) × W10d 9.87 0.10 23.43 0.19 −212.72 0.69 0.50 Q10 hyperbolic Rl=a(Tl−10)/10×(b+cW10+d/W10) 1.48 1.88 1.59 −0.01 −200.26 0.66 0.52 注:a、b、c和d为模型回归参数;R2.决定系数;RMSE.均方根误差;AIC.赤池的信息准则;T1.叶面温度;W10.10 cm土壤含水量的均值;Rl.叶片呼吸速率。下同。Notes: a, b, c and d are the model regression parameters; R2, coefficient of determination; RMSE, root mean square error; AIC, Akaike’s information guidelines; T1, leaf surface temperature; W10, average value of soil moisture content at 10 cm; Rl, leaf respiration rate. Same as below.  下载: 导出CSV
表 2 土壤呼吸单变量和双变量模型
Table 2 Univariate and bivariate models of soil respiration
模型 Model 土壤呼吸模型
Soil respiration modela b c d AIC R2 RMSE Q10 Rs = ab(Ts − 10)/10 1.24 1.10 −197.07 0.02 0.52 Quadratic Rs = aTs2 + bTs + c −0.004 0.17 −0.39 −206.16 0.07 0.51 Logistic Rs = a/(1 + exp(b(c − Ts))) 1.45 0.31 8.36 −203.49 0.06 0.51 Linear Rs = aW10 + b 12.88 0.68 −284.21 0.44 0.39 Exponential Rs = aexp(bW10) 0.89 7.79 −274.95 0.41 0.40 Quadratic Rs = aW102 + bW10 + c −234.80 44.44 −0.17 −304.96 0.51 0.37 Logistic Rs = a/(1 + exp(b × (c − W10))) 1.93 62.51 0.03 −303.53 0.51 0.37 Q10 power Rs = ab(Ts − 10)/10 × W10c 5.60 1.15 0.53 −298.28 0.50 0.37 Logistic power Rs = a/(1 + exp(b(c−Ts))) × W10d 8.02 0.07 0.59 0.52 −298.36 0.50 0.37 Q10 hyperbolic Rs = a(Ts − 10)/10 × (b + cW10 + d/W10) 1.17 2.24 −2.40 −0.04 −313.64 0.55 0.36 注:Ts.土壤温度;Rs.土壤呼吸速率。下同。Notes: Ts, soil temperature, Rs, soil respiration rate. Same as below.
下载: 导出CSV
表 3 生态系统呼吸单变量和双变量模型
Table 3 Univariate and bivariate models of ecosystem respiration
模型 Model 生态系统呼吸模型
Ecosystem respiration modela b c d AIC R2 RMSE Q10 Re = ab(Ta\_night−10)/10 1.90 1.17 −43.28 0.03 0.86 Quadratic Re = aTa_night2 + bTa_night + c −0.01 0.19 0.52 −48.56 0.06 0.85 Logistic Re = a/(1 + exp(b(c − Ta_night))) 2.17 0.80 6.15 −54.00 0.10 0.84 Linear Re = aW10 + b 22.97 0.82 −147.31 0.51 0.61 Exponential Re = aexp(bW10) 1.23 9.09 −134.68 0.47 0.64 Quadratic Re = aW102 + bW10 + c −381.80 74.29 −0.57 −169.90 0.58 0.57 Logistic Re = a/(1 + exp(b(c − W10))) 2.95 80.06 0.03 −172.76 0.58 0.57 Q10 power Re = ab(Ta\_night−10)/10W10c 12.29 1.03 0.61 −152.79 0.53 0.60 Logistic power Re = a/(1 + exp(b × (c − Ta_night)))W10d 11.79 0.64 4.08 0.58 −162.24 0.56 0.58 Q10 hyperbolic Re = a(Ta\_night−10)/10 × (b + cW10 + d/W10) 1.05 4.21 −4.69 −0.09 −172.71 0.59 0.57 注:Ta_night.夜间空气温度;Re.生态系统呼吸速率。下同。Notes: Ta_night, night air temperature; Re, ecosystem respiration rate. Same as below.
下载: 导出CSV
-
[1] Davidson E A, Janssens I A. Temperature sensitivity of soil carbon decomposition and feedbacks to climate change[J]. Nature, 2006, 440: 165−173. doi: 10.1038/nature04514
[2] Peng S S, Piao S L, Wang T, et al. Temperature sensitivity of soil respiration in different ecosystems in China[J]. Soil Biology and Biochemistry, 2009, 41(5): 1008−1014. doi: 10.1016/j.soilbio.2008.10.023
[3] Zheng Z M, Yu G R, Fu Y L, et al. Temperature sensitivity of soil respiration is affected by prevailing climatic conditions and soil organic carbon content: a trans-China based case study[J]. Soil Biology and Biochemistry, 2009, 41(7): 1531−1540. doi: 10.1016/j.soilbio.2009.04.013
[4] Bond-Lamberty B, Thomson A. Temperature-associated increases in the global soil respiration record[J]. Nature, 2010, 464: 579−582. doi: 10.1038/nature08930
[5] Wang X H, Piao S L, Ciais P, et al. Are ecological gradients in seasonal Q10 of soil respiration explained by climate or by vegetation seasonality?[J]. Soil Biology and Biochemistry, 2010, 42: 1728−1734. doi: 10.1016/j.soilbio.2010.06.008
[6] Mahecha M D, Reichstein M, Carvalhais N, et al. Global convergence in the temperature sensitivity of respiration at ecosystem level[J]. Science, 2010, 329: 838−840. doi: 10.1126/science.1189587
[7] Yvon-Durocher G, Caffrey J M, Cescatti A, et al. Reconciling the temperature dependence of respiration across timescales and ecosystem types[J]. Nature, 2012, 487: 472−476. doi: 10.1038/nature11205
[8] Song B, Niu S L, Luo R S, et al. Divergent apparent temperature sensitivity of terrestrial ecosystem respiration[J]. Journal of Plant Ecology, 2014, 7(5): 419−428. doi: 10.1093/jpe/rtu014
[9] Heskel M A, O’Sullivan O S, Reich P B, et al. Convergence in the temperature response of leaf respiration across biomes and plant functional types[J]. Proceedings of the National Academy of Sciences of the United States of America, 2016, 113(14): 3832−3837.
[10] Wang Y H, Song C, Yu L F, et al. Convergence in temperature sensitivity of soil respiration: evidence from the Tibetan alpine grasslands[J]. Soil Biology and Biochemistry, 2018, 122: 50−59. doi: 10.1016/j.soilbio.2018.04.005
[11] Zhang Z Y, Zhang H Y, Cui Z K, et al. Global consistency in response of terrestrial ecosystem respiration to temperature[J/OL]. Agricultural and Forest Meteorology, 2021, 308−309: 108576[2023−12−23]. https://doi.org/10.1016/j.agrformet.2021.108576.
[12] Xu M, Qi Y. Spatial and seasonal variations of Q10 determined by soil respiration measurements at a Sierra Nevadan forest[J]. Global Biogeochemical Cycles, 2001, 15: 687−696.
[13] Lenton T M, Huntingford C. Global terrestrial carbon storage and uncertainties in its temperature sensitivity examined with a simple model[J]. Global Change Biology, 2003, 9(10): 1333−1352. doi: 10.1046/j.1365-2486.2003.00674.x
[14] Raich J W, Rastetter E B, Melillo J M, et al. Potential net primary productivity in South America: application of a global model[J]. Ecological Applications, 1991, 1(4): 399−429. doi: 10.2307/1941899
[15] Potter C S, Randerson J T, Field C B, et al. Terrestrial ecosystem production: a process model based on global satellite and surface data[J]. Global Biogeochemical Cycles, 1993, 7(4): 811−841. doi: 10.1029/93GB02725
[16] Running S W, Hunt E R. Generalization of a forest ecosystem process model for other biomes, BIOME-BGC, and an application for global-scale models[M]// Ehleringer J R, Field C B. Scaling ecological process from leaf to global. San Diego: Academic Press, 1993: 141−158.
[17] 周文君, 查天山, 贾昕, 等. 宁夏盐池油蒿叶片水分利用效率的生长季动态变化及对环境因子的响应[J]. 北京林业大学学报, 2020, 42(7): 98−105. doi: 10.12171/j.1000-1522.20190206 Zhou W J, Zha T S, Jia X, et al. Dynamics of water use efficiency of Artemisia ordosica leaf in growing season in response to environmental factors in Yanchi, Ningxia of northwestern China[J]. Journal of Beijing Forestry University, 2020, 42(7): 98−105. doi: 10.12171/j.1000-1522.20190206
[18] 陶利波, 于双, 王国会, 等. 封育对宁夏东部风沙区荒漠草原植物群落特征及其稳性的影响[J]. 中国草地学报, 2018, 40(2): 67−74. Tao L B, Yu S, Wang G H, et al. Effects of enclosure on characteristics and stability of vegetation community of desert steppe in sandy area of eastern Ningxia[J]. Chinese Journal of Grassland, 2018, 40(2): 67−74.
[19] 林权虹, 陈胧, 郑禹轩, 等. 植物比叶面积量化: ImageJ软件法与打孔称重法的比较[J]. 首都师范大学学报(自然科学版), 2022, 43(1): 48−55. Lin Q H, Chen L, Zheng Y X, et al. Plant specific leaf area: comparison of Image J software method and disc method[J]. Journal of Capital Normal University (Natural Science Edition), 2022, 43(1): 48−55.
[20] Moffat A M, Papale D, Reichstein M, et al. Comprehensive comparison of gap-filling techniques for eddy covariance net carbon fluxes[J]. Agricultural and Forest Meteorology, 2007, 147(3−4): 209−232. doi: 10.1016/j.agrformet.2007.08.011
[21] Reichstein M, Falge E, Baldocchi D, et al. On the separation of net ecosystem exchange into assimilation and ecosystem respiration: review and improved algorithm[J]. Global Change Biology, 2005, 11(9): 1424−1439. doi: 10.1111/j.1365-2486.2005.001002.x
[22] Lloyd J, Taylor J A. On the temperature dependence of soil respiration[J]. Functional Ecology, 1994, 83(3): 315−323.
[23] Kumagai T, Saitoh T M, Sato Y, et al. Transpiration, canopy conductance and the decoupling coefficient of a lowland mixed dipterocarp forest in Sarawak, Borneo: dry spell effects[J]. Journal of Hydrology, 2004, 287(1−4): 237−251. doi: 10.1016/j.jhydrol.2003.10.002
[24] Nathalie B, Huc R, Granier A, et al. Temperate forest trees and stands under severe drought: a review of ecophysiological responses, adaptation processes and long-term consequences[J]. Annals of Forest Science, 2006, 63: 625−644. doi: 10.1051/forest:2006042
[25] Posada D, Buckley T R. Model selection and model averaging in phylogenetics: advantages of akaike information criterion and bayesian approaches over likelihood ratio tests[J]. Systematic Biology, 2004, 53: 793−808. doi: 10.1080/10635150490522304
[26] Niu S L, Li Z X, Xia J Y, et al. Climatic warming changes plant photosynthesis and its temperature dependence in a temperate steppe of northern China[J]. Environmental and Experimental Botany, 2008, 63(1−3): 91−101. doi: 10.1016/j.envexpbot.2007.10.016
[27] 游桂莹, 张志渊, 张仁铎. 全球陆地生态系统光合作用与呼吸作用的温度敏感性[J]. 生态学报, 2018, 38(23): 8392−8399. You G Y, Zhang Z Y, Zhang Z D. Temperature sensitivity of photosynthesis and respiration in terrestrial ecosystems globally[J]. Acta Ecologica Sinica, 2018, 38(23): 8392−8399.
[28] Wang B, Zha T S, Jia X, et al. Soil moisture modifies the response of soil respiration to temperature in a desert shrub ecosystem[J]. Biogeosciences, 2014, 11: 259−268. doi: 10.5194/bg-11-259-2014
[29] Moinet G Y K, Hunt J E, Kirschbaum M U F, et al. The temperature sensitivity of soil organic matter decomposition is constrained by microbial access to substrates[J]. Soil Biology and Biochemistry, 2018, 116: 333−339. doi: 10.1016/j.soilbio.2017.10.031
[30] Liu P, Zha T S, Jia X, et al. Soil respiration sensitivity to temperature in biocrusted soils in a desert-shrubland ecosystem[J]. Catena, 2020, 191: 104556. doi: 10.1016/j.catena.2020.104556
[31] Jia X, Mu Y, Zha T S, et al. Seasonal and interannual variations in ecosystem respiration in relation to temperature, moisture, and productivity in a temperate semi-arid shrubland[J/OL]. Science of The Total Environment, 2020, 709: 136210[2020−03−20]. https://www.sciencedirect.com/science/article/pii/S0048969719362060.
[32] Wang B, Zha T S, Jia X, et al. Microtopographic variation in soil respiration and its controlling factors vary with plant phenophases in a desert–shrub ecosystem[J]. Biogeosciences, 2015, 12: 5705−5714. doi: 10.5194/bg-12-5705-2015
[33] Wang B, Zha T S, Jia X, et al. Soil water regulates the control of photosynthesis on diel hysteresis between soil respiration and temperature in a desert shrubland[J]. Biogeosciences, 2017, 14: 3899−3908. doi: 10.5194/bg-14-3899-2017
[34] Jia X, Zha T S, Wang S, et al. Canopy photosynthesis modulates soil respiration in a temperate semi-arid shrubland at multiple timescales[J]. Plant and Soil, 2018, 432: 437−450.
[35] Papale D, Reichstein M, Aubinet M, et al. Towards a standardized processing of net ecosystem exchange measured with eddy covariance technique: algorithms and uncertainty estimation[J]. Biogeosciences, 2006, 3(4): 3571−583.
[36] Amthor J S. The McCree-de Wit-Penning de Vries-Thornley respiration paradigms: 30 years later[J]. Annals of Botany, 2000, 86(1): 1−20. doi: 10.1006/anbo.2000.1175
[37] Atkin O K, Tjoelker M G. Thermal acclimation and the dynamic response of plant respiration to temperature[J]. Trends in Plant Science, 2003, 8(7): 343−351. doi: 10.1016/S1360-1385(03)00136-5
[38] 何小燕. 植物叶片呼吸速率及其温度敏感性的时空变化[D]. 开封: 河南大学, 2021. He X Y. Variation in leaf respiration and its temperature sensitivity in plants[D]. Kaifeng: Henan University, 2021.
[39] Högberg P, Nordgren A, Buchmann N, et al. Large-scale forest girdling shows that current photosynthesis drives soil respiration[J]. Nature, 2001, 411: 789−792. doi: 10.1038/35081058
[40] Högberg P, Högberg M N, Göttlicher S G, et al. High temporal resolution tracing of photosynthate carbon from the tree canopy to forest soil microorganisms[J]. New Phytologist, 2008, 177: 220−228. doi: 10.1111/j.1469-8137.2007.02238.x
[41] Mencuccini M, Hölttä T. The significance of phloem transport for the speed with which canopy photosynthesis and belowground respiration are linked[J]. New Phytologist, 2010, 185: 189−203. doi: 10.1111/j.1469-8137.2009.03050.x
[42] Booth B B B, Jones C D, Collins M, et al. High sensitivity of future global warming to land carbon cycle processes[J/OL]. Environmental Research Letters, 2012, 7(2): 024002[2012−06−01]. https://api.semanticscholar.org/CorpusID:92993624.
[43] Pappas C, Fatichi S, Leuzinger S, et al. Sensitivity analysis of a process-based ecosystem model: pinpointing parameterization and structural[J]. Journal of Geophysical Research: Biogeosciences, 2013, 118(2): 505−528. doi: 10.1002/jgrg.20035
[44] Villar R, Held A A, Merino J. Dark leaf respiration in light and darkness of an evergreen and a deciduous plant species[J]. Plant Physiology, 1995, 107(2): 421−427.
[45] 朱义族, 李雅颖, 韩继刚, 等. 水分条件变化对土壤微生物的影响及其响应机制研究进展[J]. 应用生态学报, 2019, 30(12): 4323−4332. Zhu Y Z, Li Y Y, Han J G, et al. Effects of changes in water status on soil microbes and their response mechanism: a review[J]. Chinese Journal of Applied Ecology, 2019, 30(12): 4323−4332.
[46] Heinemeyer A, Wilkinson M, Vargas R, et al. Exploring the “overflow tap” theory: linking forest soil CO2 fluxes and individual mycorrhizosphere components to photosynthesis[J]. Biogeosciences, 2012, 9: 79−95. doi: 10.5194/bg-9-79-2012
[47] Vargas R, Collins S L, Thomey M L, et al. Precipitation variability and fire influence the temporal dynamics of soil CO2 efflux in an arid grassland[J]. Global Change Biology, 2012, 18: 1401−1411. doi: 10.1111/j.1365-2486.2011.02628.x
-
期刊类型引用(2)
1. 谷国泽,宋魁彦. 水性清漆涂饰对皮影表面的装饰效果. 家具. 2025(01): 19-22 .  百度学术
百度学术
2. 钟成龙,侯贤锋,卓光武,高振忠,涂登云,胡传双. 重组竹表面涂饰工艺研究. 竹子学报. 2023(02): 41-47 . 百度学术
其他类型引用(2)


计量
- 文章访问数: 187
- HTML全文浏览量: 27
- PDF下载量: 15
- 被引次数: 4
