
Integrating carbon and timber objective into forest spatial planning management
-
摘要: 以大兴安岭地区塔河林业局盘古林场为例,以模拟退火算法为优化技术,以经济收益为基础,建立能够兼顾森林木材生产、碳储量和经营措施时空分布的多目标规划模型。规划周期由3个10年的分期组成,目标函数包括最大化木材和碳储量贴现净收益、最小化采伐成本,而约束条件则主要涉及最小收获年龄、收获次数、收获均衡以及空间邻接约束等。同时,还评估了一系列碳价格对规划结果的影响。结果表明:由于规划模型中空间和非空间约束的限制,规划期内获得的各种经济收益、木材产量以及碳储量等均随着碳价格的增加呈显著的非线性变化趋势;与碳价格为0元/t时的规划结果相比,当碳价格为我国当前现行碳交易的平均(25元/t)和最高(50元/t)价格时,规划期末的总经济收益分别增加了2.06%和3.91%,但规划期内木材产量和碳储量却无显著差异;如果仅从经济角度考虑,则能够使规划期末单位面积碳储量增加的最低碳价格为1 000元/t。同时,研究结果还表明碳价格虽然显著影响规划期内不同经营措施的采伐面积比例,但规划结果均满足均衡收获约束。Abstract: In this paper, based on the economic effect, a persuasive model for multi-objective forest management planning, which integrated the carbon stock and spatial configurations of management treatments into traditional timber harvest scheduling model, was developed for the Pangu Forest Farm in Great Xing'an Mountains, northeastern China. And the standard version of simulated annealing was employed. The planning cycle was divided into three 10-years periods. The planning formulations were to maximize the discount net present values (NPV) of timber production and carbon stock, while minimize the NPV of harvesting costs and penalty values. The constraints mainly concern the needs of minimum harvest ages, harvest times, even-flow of harvest volume and adjacency constraints, etc. In addition, the effects of a set of carbon prices were evaluated quantificationally on the results of planning. The simulated results showed that the NPVs of total and three sub-objectives (i.e., timber, carbon and spatial configurations of management treatments), as well as the amount of timber harvested and carbon sequestrated, all presented significant non-linear trends with the increases of carbon price. Compared with the carbon price of 0 CNY/t, the total NPVs increased approximately by 2.06% and 3.91% when the mean (25 CNY/t)and highest(50 CNY/t)carbon prices collected from the market of carbon trading were adopted into the planning model, however the differences of timber production and carbon stock were not significant. We further found that the lowest carbon price that could increase the levels of carbon stock per hectare within the whole planning period should be 1 000 CNY/t if it was evaluated purely from the economic perspective. In addition, the results also showed that the percentages of different management treatments assigned in the optimal plans could be affected significantly by the carbon price, anyway all the solutions meet the even-flow constraints of harvest volume.
-
Keywords:
- forest planning /
- carbon stock /
- timber production /
- economic value /
- spatial constraint
-
外来物种入侵问题已经成为全球性的热点问题,引起世界各国政府及科学家的关注。互花米草(Spartina alterniflora)隶属禾本科(Gramineae)、米草属(Spartina),是原产于北美洲中纬度海岸潮间带滩涂的多年生耐盐耐淹高大草本植物[1]。互花米草的快速扩散及其对潮滩的侵占极大程度上改变了原生潮滩生态系统结构,引起潮滩生态系统服务功能的变化。国外较早对北美的旧金山海湾(San Francisco Bay)和Willapa海湾互花米草有性繁殖(种子的活性、扩散、萌发)和无性繁殖两种扩散方式及其入侵机制进行了研究[2-3]。国内对互花米草的研究大体可分为互花米草植物学特征和引种栽培、开发利用(1979—2003年)和入侵机理与特征、入侵对生态系统的危害和解决防治手段等(2003年至今)两个阶段[4]。近年来,有关互花米草入侵对土壤生态系统组分和物质组分的研究较多[5-6],针对互花米草不同入侵阶段的土壤酶活性与土壤理化性质的研究还较为薄弱, 张祥麟等[7]研究表明米草入侵后土壤有机碳、微生物生物量碳、氮含量及蔗糖酶和磷酸酶对滨海湿地土壤退化的反应强烈。黄利东等[8]研究表明,对酶活性起主要限制性作用的物质是有机质,互花米草除增加土壤酶活性外,还促进土壤养分循环和利用。
根据福建省海洋与渔业局资料,2005年闽东沿海互花米草分布面积从2001年测算的66.67 km2增加到100 km2,2011年利用遥感融合影像技术分析得知,福建省沿岸海域互花米草分布面积为99.24 km2,宁德市互花米草分布面积最大,为66.28 km2。互花米草在向南蔓延的过程中不断侵占光滩,与本地植物群落相竞争[9],互花米草造成闽东地区海水养殖业的直接经济损失每年高达7亿~8亿元人民币[10]。目前针对闽东滨海湿地生态系统的研究取得了很多成果[11-15],但从土壤理化性质和酶学角度对互花米草入侵闽东滨海湿地的研究较少,所以,本研究采用空间代替时间的方法,选择闽东滨海湿地互花米草入侵最严重的霞浦县4种群落类型(秋茄红树林群落、秋茄红树林-互花米草共生群落、互花米草群落、光滩)代表互花米草入侵不同阶段,对不同群落类型下的土壤理化性质和土壤酶活性指标进行差异分析,试图从土壤学机理解释互花米草入侵成功的原因,为生态治理互花米草提供理论依据。
1. 研究区概况与研究方法
1.1 研究区概况
闽东是福建省宁德市的俗称,位于福建省东北部(26°18′~27°04′ N、118°32′~120°44′ E),以中亚热带海洋性季风气候为主,年均气温在13.0~20.2 ℃之间,年均降雨量可达2 350 mm,全年无霜期最大可达300 d。闽东径流量丰富,径流量年内分配受季节性降雨制约,有明显的丰枯变化。地貌以山地丘陵为主,其间夹有山间盆地,沿海一带有滨海堆积平原。海岸线曲折绵长、港湾众多,海域辽阔。海岸线长878 km,占福建省海洋渔场总面积的35.63%。海域面积4.6万km2,分布有大量浅海滩涂。闽东滨海湿地是全国少有的大潮差海区,总面积为74 km2,占福建省滨海湿地总面积的10.6%,包括潮间裸滩、养殖场、水域、农田、红树林等。
1.2 研究方法
1.2.1 样地选择与设置
2013年10月,对闽东互花米草入侵最严重的霞浦县(26°44′47″N、119°48′04″E)具代表性的4种群落类型(秋茄红树林群落、秋茄红树林-互花米草共生群落(以下简称“共生群落”)、互花米草群落和光滩(本研究将光滩也视为群落进行叙述))进行调查。具体设置为:1)霞浦县霞塘村:光滩、秋茄红树林群落、互花米草群落,鹅湾村:共生群落。2)无互花米草入侵的群落以秋茄红树林群落为代表;互花米草侵占秋茄红树林群落面积一半左右以共生群落为代表;秋茄红树林群落完全被互花米草侵占的湿地群落称互花米草群落。3)群落类型的划分以现场勘察,计算样地中互花米草占秋茄红树林群落的面积比,结合当地林业部门和居民的走访资料确定。
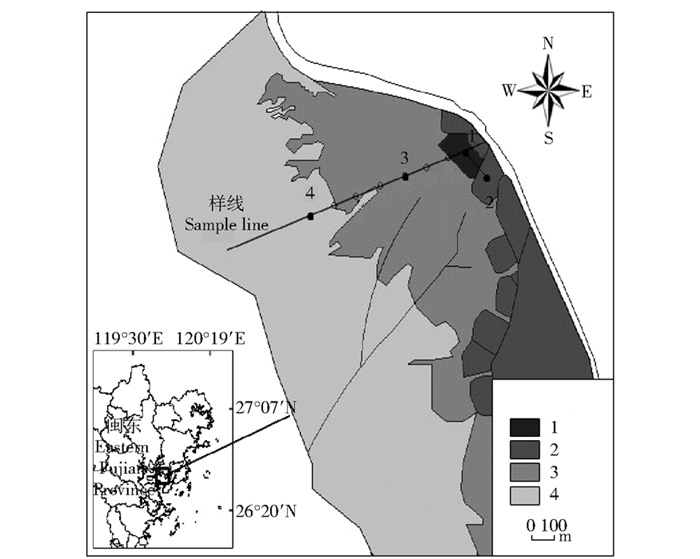
![]() 图 1 闽东滨海湿地采样点位置1.秋茄红树林群落; 2.共生群落;3.互花米草群落;4.光滩。引自文献[11]。Figure 1. Location of sampling sites in the coastal wetland of eastern Fujian Province1, Kandelia candel red wood community; 2, K.candel red wood-Spartina alterniflora symbiosis community; 3, S. alterniflora community; 4, bare beach. Cited from reference [11].
图 1 闽东滨海湿地采样点位置1.秋茄红树林群落; 2.共生群落;3.互花米草群落;4.光滩。引自文献[11]。Figure 1. Location of sampling sites in the coastal wetland of eastern Fujian Province1, Kandelia candel red wood community; 2, K.candel red wood-Spartina alterniflora symbiosis community; 3, S. alterniflora community; 4, bare beach. Cited from reference [11].1.2.2 土壤采样与保存
2013年采用传统的挖掘土壤剖面的方法,对研究区进行土壤取样,分别采集光滩、秋茄红树林群落、共生群落、互花米草群落内的土样,每个研究区内设置大小为5 m×5 m的正方形样地3块,共12块。在每块样地内,随机选取3个点进行挖掘土壤剖面取样,土壤剖面按层次采样时自下而上(与剖面划分、观察和记载相反)分层采取,以免采取上层样品时对下层土壤的混杂污染。在0~60 cm深度内,用小铲刀以20 cm间隔取样,即0~20 cm、20~40 cm、40~60 cm共3层,并在各层最典型的中部采样,放入自封袋,共108袋带回实验室。用体积为100 cm3环刀对各层土壤分别取样,每层做3个重复,共324个环刀样带回实验室测土壤密度和土壤含水率。新鲜土样一部分采用生物冰袋冷藏,带回到室内除去植物残体后迅速过2 mm筛,混匀置于冰箱4 ℃中保存,另一部分带回实验室自然风干,捡去草根等杂物后,磨碎过2 mm筛备用,四分法取少量进一步磨碎过0.15 mm筛,装袋准备土壤养分、土壤酶活性指标测定。
1.2.3 土壤理化性质测定方法
土壤的理化性质采用常规方法测定[16]。土壤有机质采用重铬酸钾密度法;土壤有机碳采用重铬酸钾-外加热法测定;全氮采用元素分析仪测定(VarioMaxCN,Elementar,德国);全P采用氢氧化钠熔融-钼锑抗比色法测定;全K运用氢氧化钠熔融制备待测液,采用TAS-990原子吸收分光光度计测定;pH值采用电位法(水:土=5:1),悬液用pHs-3c型酸度计测定;含水量采用烘干法[17]测定。土壤密度采用环刀法[17]测定。
1.2.4 土壤酶活性
过氧化氢酶采用高锰酸钾滴定法;脲酶采用苯酚钠-次氯酸钠比色法;碱性磷酸酶采用磷酸苯二钠比色法;蔗糖酶采用3,5-二硝基水杨酸显色法[18]。
1.3 数据分析
采用Microsoft Excel 2010对实验数据进行整理和初步计算。采用SPSS(SPSS 20.0 for windows)统计分析软件的方差分析方法对不同群落类型的土壤理化性质、土壤酶活性各指标进行差异显著性分析,运用Pearson相关方法对土壤酶活性和土壤理化性质相关关系进行分析。
2. 结果与分析
2.1 互花米草入侵下土壤理化性质的变化
由图 2可知,4种群落的土壤pH均呈微碱性,土壤pH大小依次为共生群落>光滩>秋茄红树林群落>互花米草群落,土壤全磷含量大小依次为共生群落>秋茄红树林群落>互花米草群落>光滩。土壤含水率和全氮含量大小依次为秋茄红树林群落>共生群落>互花米草群落>光滩。土壤密度大小依次为光滩>互花米草群落>共生群落>秋茄红树林群落。土壤全钾含量大小依次为互花米草群落>光滩>秋茄红树林群落>共生群落。秋茄红树林群落的土壤有机碳和有机质含量最高,且最大值出现在40~60 cm,其余3种群落的土壤有机碳和有机质含量无显著差异。秋茄红树林群落、共生群落和互花米草群落的土壤pH值、土壤密度,随土层加深而增加,全氮、全磷和含水率随土层加深而减少。光滩的土壤密度随土层加深而减少,全氮和含水率随土层加深而增加,pH值和全磷含量随土层加深变化为先增后减,全钾含量随土层加深而先减后增。4种群落的土壤有机碳和有机质与土层深度变化无显著相关,共生群落下土壤pH值随土壤深度增加变化显著(P<0.05),互花米草群落下土壤含水率随土层深度增加而显著减少(P<0.05),共生群落和互花米草群落下土壤密度随土层深度增加显著增加(P<0.05)。
![]() 图 2 互花米草入侵不同阶段各土层土壤理化因子对比不同大写字母表示同一群落下不同土层间差异显著,不同小写字母表示同一土层不同群落间差异显著(单因素方差分析,S-N-K多重比较,P<0.05)。下同。Figure 2. Comparison in soil physical and chemical factors in different soil layers of varied stages under Spartina alterniflora invasionDifferent capital and small letters indicate significant differences among soil layers in the same community and among communities in the same soil layer, respectively(one-way ANOVA, S-N-K multiple comparison, P < 0.05). The same as below.
图 2 互花米草入侵不同阶段各土层土壤理化因子对比不同大写字母表示同一群落下不同土层间差异显著,不同小写字母表示同一土层不同群落间差异显著(单因素方差分析,S-N-K多重比较,P<0.05)。下同。Figure 2. Comparison in soil physical and chemical factors in different soil layers of varied stages under Spartina alterniflora invasionDifferent capital and small letters indicate significant differences among soil layers in the same community and among communities in the same soil layer, respectively(one-way ANOVA, S-N-K multiple comparison, P < 0.05). The same as below.2.2 互花米草入侵下土壤酶活性的变化
从表 1可得,4种群落的土壤蔗糖酶、脲酶和碱性磷酸酶均随土壤深度增加而含量降低。蔗糖酶活性高低依次为共生群落>秋茄红树林群落>互花米草群落>光滩,脲酶含量高低依次为秋茄红树林群落>互花米草群落>共生群落>光滩,碱性磷酸酶活性高低依次为互花米草群落>共生群落>秋茄红树林群落>光滩,过氧化氢酶活性高低依次为共生群落>互花米草群落>光滩>秋茄红树林群落。
表 1 不同群落不同土层土壤酶活性Table 1. Soil enzyme activities in different soil layers of varied communities群落类型
Communitytype土层
Soil layer蔗糖酶
Invertase/(mg·g-1)脲酶
Urease/(ug·g-1)碱性磷酸酶
Alkaline phosphatase/(mg·100 g-1)过氧化氢酶
Catalase/(mL·g-1)光滩Bare beach 0~20 cm 0.037±0.01Ab 27.453±1.15Ab 0.106±0.07Ab 0.454±0.05Aa 20~40 cm 0.028±0.00Ab 22.562±1.17ABb 0.084±0.03ABb 0.484±0.04Aab 40~60 cm 0.027±0.00Ab 19.689±1.26Bb 0.074±0.01Bb 0.454±0.04Ab 秋茄红树林群落Kandelia candel red wood community 0~20 cm 0.093±0.01Aab 41.665±2.37Aa 0.326±0.1Aab 0.440±0.06Aa 20~40 cm 0.073±0.00Bab 30.171±0.75Ba 0.268±0.08Aa 0.411±0.02Ab 40~60 cm 0.064±0.00Ba 23.464±0.72Ca 0.130±0.01Aab 0.400±0.03Ab 共生群落Kandelia candel red wood- Spartina alterniflora symbiosis community 0~20 cm 0.101±0.04Aa 33.295±1.00Ab 0.412±0.08Aa 0.553±0.01Aa 20~40 cm 0.085±0.03Aa 22.517±1.22Ba 0.249±0.04ABab 0.548±0.01Aab 40~60 cm 0.060±0.01Aa 22.424±1.26Bab 0.154±0.02Bab 0.555±0.02Ab 互花米草群落Spartina alterniflora community 0~20 cm 0.080±0.01Aab 31.202±1.47Ab 0.534±0.09Aa 0.548±0.02Aa 20~40 cm 0.059±0.01ABab 29.419±1.62Ab 0.231±0.03Ba 0.476±0.03ABa 40~60 cm 0.044±0.02Bab 19.233±1.56Bab 0.097±0.02Ba 0.419±0.02Ba 2.3 土壤酶活性与土壤理化因子之间相关性分析
由表 2可知,蔗糖酶与脲酶显著正相关,与碱性磷酸酶极显著正相关,与过氧化氢酶没有明显相关性;蔗糖酶与全氮、全磷和含水率呈极显著正相关,与pH值、土壤密度呈极显著负相关;脲酶与碱性磷酸酶、含水率显著正相关,与土壤密度显著负相关;碱性磷酸酶与全磷、含水率显著正相关,与土壤密度显著负相关;过氧化氢酶与理化因子无相关性。说明在闽东滨海红树林湿地,蔗糖酶、脲酶、碱性磷酸酶是主要酶类,在土壤代谢中起着重要作用,可以作为表征土壤肥力的指标。
表 2 土壤酶活性与理化因子间的相关性分析Table 2. Correlation analysis between soil enzyme activity and soil physicochemical factors项目Item 蔗糖酶
Invertase脲酶
Urease碱性磷酸酶
Alkaline phosphatase过氧化氢酶
Catalase蔗糖酶Invertase 1.000 脲酶Urease 0.689* 1.000 碱性磷酸酶Alkaline phosphatase 0.817** 0.700* 1.000 过氧化氢酶Catalase 0.365 0.047 0.489 1.000 有机碳含量Organic carbon content 0.401 0.410 0.118 -0.569 有机质含量Organic content 0.401 0.410 0.118 -0.569 全氮含量Total nitrogen content 0.756** 0.492 0.511 -0.023 全磷含量Total phosphorus content 0.922** 0.553 0.699* 0.353 全钾含量Total potassium content -0.379 0.102 0.021 -0.167 pH值pH value -0.773** -0.505 -0.413 -0.119 土壤密度Soil bulk density -0.902** -0.618* -0.672* -0.075 含水率Moisture content 0.820** 0.582* 0.578* -0.086 注:Pearson相关分析,*和**分别表示在P<0.05和P<0.01水平上相关显著(2-tailed)。Notes: Pearson correlation analysis, *and** indicate the correlation is significant at P<0.05 and P<0.01 levels, respectively (2-tailed). 3. 结论与讨论
研究显示,互花米草入侵增加了土壤密度,降低了土壤pH值、含水率、有机碳、有机质、全氮和全磷的含量。土壤密度大小主要受到土壤有机质含量、土壤结构及植物根系结构的影响,互花米草群落土壤密度较高可能与其植株密度大和根系结构复杂有关。样地土壤pH值的降低,可能是由于互花米草凋落物和根系分泌物中含有酸性物质,改善土壤碱性环境。互花米草群落较低的含水率可能是植物自身对于生长环境的选择导致的。互花米草入侵造成土壤密度和pH值的变化,与加拿大一枝黄花[19]入侵造成的杭州湾湿地围垦区土壤理化性质变化一致。共生群落和互花米草群落土壤有机碳和有机质,相比秋茄红树林,含量降低了一半,表明互花米草入侵很大程度上削弱了红树林湿地的碳汇功能。与何震等[20]报道互花米草短期入侵减少土壤碳库的结果一致,但这与Liao等[21]研究结果表明互花米草入侵增加碳储存的结果不一致。互花米草入侵可造成滨海湿地土壤有机碳出现增加和减少两种变化[14],针对这样的变化进行研究,有助于从土壤学角度对互花米草入侵进行生态防治。互花米草发达的通气组织,改良了土壤通气性,提高了根系周围土壤的溶氧度,而土壤溶氧度的提高,又有利于邻近互花米草植株的生长[5]。这可能是互花米草在盐沼地可以大面积扩张的机理之一。互花米草入侵使全氮含量随土层深度增加而减少,这与曹洪麟等[22]研究结果一致,可能由于互花米草生长对N元素的需求量较大导致[4]。土壤N的增加会显著影响互花米草的生长速率和生物量分配[23]。在氮元素受限制的生境中,互花米草与根际固氮菌的共生关系,可以在一定程度上改善氮的限制,增强互花米草光合作用等生理过程,使互花米草的竞争能力得到提高[5]。李家兵等[24]研究表明,互花米草入侵降低碳氮含量,原因是土壤密度降低,不利于养分存留。除光滩外,样地土壤全磷含量随土层加深而递减,表明全磷在土壤中存在表聚性现象,这与张平[25]的研究结果一致。这些土壤基本理化性质的改变,可能是互花米草入侵机制的一部分。
相关研究结果表明,互花米草入侵能使土壤蔗糖酶、脲酶、碱性磷酸酶、过氧化氢酶的活性得到显著提高[26],本研究显示互花米草入侵使闽东滨海湿地土壤的蔗糖酶、碱性磷酸酶和过氧化氢酶活性提高,降低了土壤脲酶的活性,这与孙炳寅等[27]、黄利东等[8]对互花米草群落土壤酶活性的研究结果类似。互花米草入侵使样地土壤表层过氧化氢酶活性提高,与张祥麟等[7]的互花米草入侵降低过氧化氢酶活性的研究结果不同。研究结果的不同可能是由于样地互花米草群落的土壤处于好氧环境,土壤微生物活动较强,而秋茄红树林地处低洼,土壤受海水长时间浸泡,在厌氧环境中微生物活动和根系分泌物受到影响。多数学者认为入侵植物能通过改变原来植物群落结构和土壤酶活性及养分水平,形成有利于自身生长和扩散的微环境[4]。结合本研究结果,互花米草入侵提高土壤蔗糖酶、脲酶、碱性磷酸酶活性,使土壤提供更多营养元素,可能是互花米草能在盐沼地大面积扩张的机理之一。
大量研究表明,农业土壤和陆地森林土壤酶活性与土壤肥力因素有良好的相关性[7]。本研究结果显示,互花米草入侵降低了红树林湿地土壤肥力,这与王世岩[28]对三江平原退化湿地土壤物理特征变化的研究结果一致。相关分析表明,土壤蔗糖酶与全氮、全磷含量呈极显著正相关,这与孙双红等[29]的研究结果类似。蔗糖酶与含水率呈极显著正相关,脲酶、碱性磷酸酶与含水率显著正相关,这与张鑫等[30]研究认为湖滨湿地不同土壤酶活性与土壤水分显著相关,土壤酶活性受土壤有机碳影响相对较小的结果一致,与牛世全等[31]对沼泽湿地土壤理化因子和酶活性研究结果类似。土壤过氧化氢酶活性与理化因子无相关性,表明针对互花米草的入侵来讲,土壤过氧化氢酶活性不是表征入侵程度的敏感指标。
-
![]()
图 3 总收益、木材收益和碳收益随碳价格的变化
Figure 3. Variations of total economic benefits, timber benefits and carbon benefits along with the change of carbon price
![]()
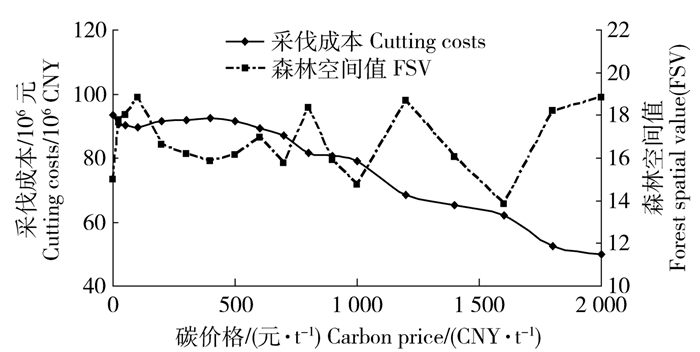
图 4 采伐成本和森林空间值随碳价格的变化
Figure 4. Variations of cutting costs and forest spatial value (FSV) along with the changes of carbon price
![]()
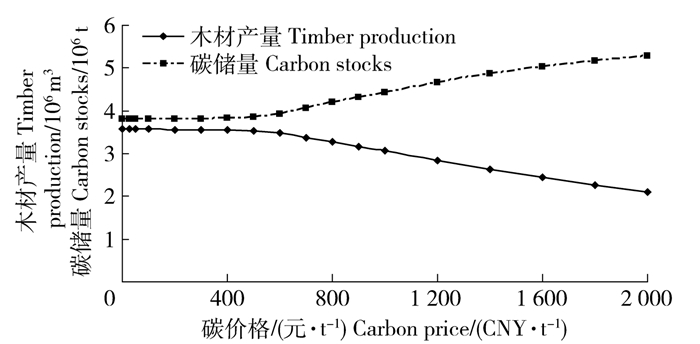
图 5 木材产量和碳储量随碳价格的变化
Figure 5. Variations of timber production and carbon stock along with the changes of carbon price
![]()
图 6 规划期末林地单位面积碳储量随碳价格的变化
虚线表示规划期初单位面积碳储量。
Figure 6. Variations of carbon stocks per hectare at the end of planning period along with the changes of carbon price
Dashed line represents carbon stocks per hectare at the beginning of planning period.
![]()
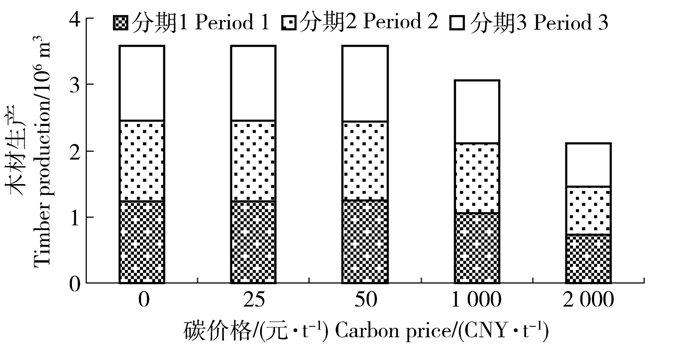
图 7 5种碳价格最优森林经营方案各分期收获蓄积分布
Figure 7. Distribution of harvest volume in each period under the optimal forest management plan with five different carbon prices
表 1 研究区域森林龄级分布结构
Table 1 Age-class distribution of forest in study area
年龄范围/aAge class/year NLG NBP NCF NBF CBF 面积/103 hm2Area/103 ha 比例Percentage/% 面积/103 hm2Area/103 ha 比例Percentage/% 面积/103 hm2Area/103 ha 比例Percentage/% 面积/103 hm2Area/103 ha 比例Percentage/% 面积/103 hm2Area/103 ha 比例Percentage/% 1~20 0.433 0.363 3.317 2.779 0.469 0.393 1.625 1.361 1.342 1.124 21~40 0.382 0.320 5.637 4.722 4.506 3.775 0.537 0.450 1.055 0.884 41~60 4.713 3.948 12.791 10.715 18.686 15.653 4.762 3.989 1.073 0.899 61~80 17.553 14.704 0.431 0.361 11.371 9.525 12.002 10.054 0.133 0.111 81~100 7.168 6.004 1.403 1.175 4.366 3.657 101~120 1.767 1.480 0.125 0.105 0.628 0.526 >120 1.055 0.884 0.007 0.006 0.042 0.035 总计Total 33.071 27.703 22.176 18.577 36.567 30.632 23.962 20.072 3.603 3.018 注:NLG表示天然落叶松林,NBP表示天然白桦林,NCF表示针叶混交林,NBF表示阔叶林,CBF表示针阔混交林。Notes: NLG means natural Larix gmelinii forest, NBP means natural Betula platyphylla forest, NCF means natural coniferous forest, NBF means natural broadleaved forest, CBF means natural coniferous-broadleaved forest.  下载: 导出CSV
表 2 森林规划模型中各变量符号含义
Table 2 Implication of each symbol used in the formulations of forest management planning
符号Symbol 描述Description z 总收益Total benefit i 某个经营单位An arbitrary management unit (or stand) s 某种林型An arbitrary forest type t 某个经营分期An arbitrary planning period T 规划分期总数目Total number of planning period p 贴现率值Discounting rate Thj 第j种择伐活动成本Selective cutting cost of harvest activity j Amax 最大连续采伐面积Maximum continuously cutting area TPL 规划分期的长度Length of planning period Dik 相邻林分i与k的质心距离Centroid distance between adjacency stand i and k HVt 第t规划分期总收获蓄积Total harvest volume in planning period t CS 规划期末林地剩余碳储量Amount of residual carbon stock at the end of planning period NPVcutting 整个规划周期内采伐成本Cutting cost in total planning period NPVtimber, t 第t规划分期木材贴现收益值Discounted net present value of timber production during planning period t Ui 与林分i相邻的所有林分的集合Entire set of all management units adjacent to stand i a 用户设定的森林经营措施过度聚集惩罚值,假设为106元/FSVA penalty function for spatial aggregation harvest using same treatment, which was assumed as 106 CNY/FSV Ageijt 林分i在第t分期被第j种方式采伐后林分的年龄Age of stand i after being cut by treatment j in period t FSV 森林经营措施空间聚集度值,其具体定义参见文献[12] Forest spatial value representing the spatial aggregation degree of forest management activities, refer to literature [12] Xijt, Xkjt 0-1型变量,当Xijt(或Xkjt)=1表示林分i(或k)在第t分期被第j种方式采伐,否则Xijt(或Xkjt)=0A binary variable, which is equal to 1 if stand i was cut by treatment j in period t, and 0 otherwise k 某个与林分i相邻的邻接林分及其邻接林分的邻接林分,呈无限递归形式[11] A stand from a subset of stands adjacency to stand i and the neighbors of stand i, etc, in the form of a recursive function[11] j 某种经营措施An arbitrary management activity M 研究区域总林分数量Total forest quantity of the study area N 候选经营措施数量Number of candidate management activity Pc 碳价格Carbon price in CNY per hectare Ps 林型s的平均木材价格Mean timber price for forest type s Ai, Ak 林分i和k的面积Area of stand i and k FSVgoal FSV目标值Target value for FSV Lik 相邻林分i与k的公共边界长度Common border length between the adjacency stand i and k TCt 第t规划分期采伐成本Cutting costs in planning period t Agemin 假定的最小采伐年龄,因林型差异而显著不同Assumed minimum harvest age, which is significantly different since the variance in forest type NPVcarbon 规划期末林地剩余碳储量贴现收益Discounted net present value of residual carbon stocks at the end of planning period NPVtimber 整个规划周期内木材贴现收益Discounted net present value of timber production in total planning period Si 与林分Ui相邻的所有林分的集合Entire set of all units adjacent to stand Ui b 相邻规划分期内收获蓄积的波动范围,即HVt∈[0.9HVt-1, 1.1HVt+1]Allowed deviation rate of assigned harvest volume between period t and t+1, namely HVt∈[0.9HVt-1, 1.1HVt+1] Vijt 林分i在第t分期采用第j种采伐方式时的收获蓄积Harvest volume of stand i after being cut by treatment j in period t NPVpenatly 规划期内经营方式空间聚集分布的惩罚函数值Penalty function for spatial aggregation of same management activities generated from the strategic plans Rik 0-1型变量,当Rik=1表示林分i与k具有相同的经营措施,否则Rik=0A binary variable, which was equal to 1 if stand i was managed in same way as stand k, and 0 otherwise Cijt 林分i在第t分期采用第j种经营方式后,正常生长至规划期末的林地剩余碳储量Residual carbon stocks at the end of planning horizon for stand i when managed under treatment j during period t 注:天然白桦林、阔叶混交林最小收获年龄假设为41年,天然落叶松林、针叶混交林和针阔混交林均假设为61年。Notes: The minimum harvest age for NBP and NBF was assumed as 41 years, however that for NLG, NCF and CBF was assumed as 61 years in this analysis.
下载: 导出CSV
表 3 5种碳价格最优森林经营方案采伐小班数量和面积统计
Table 3 Statistical values of harvest units and areas under the optimal forest management plans with five different carbon prices
分期Period 采伐方式Cutting way 方案1 Plan 1 方案2 Plan 2 方案3 Plan 3 方案4 Plan 4 方案5 Plan 5 数量Number 面积/hm2Area/ha 数量Number 面积/hm2Area/ha 数量Number 面积/hm2Area/ha 数量Number 面积/hm2Area/ha 数量Number 面积/hm2Area/ha 非林地Non-forest land 280 4 055 280 4 055 280 4 055 280 4 055 280 4 055 无采伐No cutting 33 612 32 594 31 546 406 8 281 1 378 26 763 1 1 3 35 2 45 8 140 185 3 656 568 10 142 1 2 166 3 264 168 3 125 179 3 443 833 14 416 898 15 144 1 3 2 458 40 836 2 461 40 801 2 478 41 074 1 582 25 029 638 10 077 2 1 5 106 1 26 92 2 118 366 7 440 2 2 56 1 184 50 1 039 49 1 070 354 7 705 525 10 415 2 3 1 891 37 448 1 881 37 549 1 851 36 795 1 301 26 470 586 11 460 3 1 13 332 24 644 13 310 95 2 371 310 7 375 3 2 134 3 339 143 3 433 138 3 238 354 7 163 465 10 959 3 3 1 387 32 302 1 375 32 043 1 393 32 737 1 301 22 170 407 9 604 注:方案1~5分别设定碳价格为0、25、50、1 000、2 000元/t;分期列中数字1、2、3分别代表 3个不同的规划分期;方式列中数字1、2、3分别代表 3种不同的择伐强度,即轻度择伐、中度择伐和重度择伐。Notes: Plans 1-5 set the carbon price as 0, 25, 50, 1 000, 2 000 CNY/t, respectively. No. 1,2,3 in period column represent three different planning periods;No. 1,2,3 in cutting way column represent three different intensities of selective cutting, namely light selective cutting (10%), moderate selective cutting (20%) and severe selective cutting (30%).
下载: 导出CSV
-
[1] 徐济德.我国第八次森林资源清查结果及分析[J].林业经济, 2014(3): 6-8. http://www.wanfangdata.com.cn/details/detail.do?_type=perio&id=49171428 XU J D. The 8th forest resources inventory results and analysis in China[J]. Forestry Economics, 2014(3): 6-8. http://www.wanfangdata.com.cn/details/detail.do?_type=perio&id=49171428
[2] Carbon Dioxide Information Analysis Center. World's countries ranked by 2011 total fossil-fuel CO2 emissions from fossil-fuel burning, cement production, and gas flaring[EB/OL].[2016-02-17]. http://cdiac.ornl.gov/.
[3] Sustainable Forestry Initiative Inc. SFI 2015—2019 Forest management standard[R]. Washington D C: Sustainable Forestry Initiative Inc, 2015.
[4] BACKÉUS S, WIKSTROM P, LAMAS T. A model for regional analysis of carbon sequestration and timber production[J]. Forest Ecology and Management, 2005, 216: 28-40. doi: 10.1016/j.foreco.2005.05.059
[5] BOURQUE C P A, NEILSON E T, GRUENWALD C, et al. Optimizing carbon sequestration in commercial forests by integrating carbon management objectives in wood supply modeling[J]. Mitigation and Adaptation Strategies for Global Change, 2007, 12: 1253-1275. doi: 10.1007/s11027-006-9072-3
[6] KELES S, BASKENT E Z. Modeling and analyzing timber production and carbon sequestration values of forest ecosystems: a case study[J]. Polish Journal of Environment Study, 2007, 16(3): 473-479.
[7] 戎建涛, 雷相东, 张会儒, 等.兼顾碳储量和木材生产目标的森林经营规划研究[J].西北林学院学报, 2012, 27(2): 155-162. doi: 10.3969/j.issn.1001-7461.2012.02.32 RONG J T, LEI X D, ZHANG H R, et al. Forest management planning incorporating values of timber and carbon[J]. Journal of Northwest Forestry University, 2012, 27(2): 155-162. doi: 10.3969/j.issn.1001-7461.2012.02.32
[8] KADIOGULLARI A, KELES S, BASKENT E Z, et al. Controlling spatial forest structure with spatial simulation in forest management planning: a case study from Turkey[J]. Sains Malaysiana, 2015, 44(3): 325-336. doi: 10.17576/jsm-2015-4403-03
[9] 成向荣, 虞木奎, 葛乐, 等.不同间伐强度下麻栎人工林碳密度及其空间分布[J].应用生态学报, 2012, 23(5): 1175-1180 http://d.old.wanfangdata.com.cn/Periodical/yystxb201205005 CHENG X R, YU M K, GE L, et al. Carbon density and its spatial distribution in Quercus acutissima plantations under different thinning intensities[J]. Chinese Journal of Applied Ecology, 2012, 23(5): 1175-1180. http://d.old.wanfangdata.com.cn/Periodical/yystxb201205005
[10] 明安刚, 张志军, 谌红辉, 等.抚育间伐对马尾松人工林生物量和碳储量的影响[J].林业科学, 2013, 49(10): 1-6. doi: 10.11707/j.1001-7488.20131001 MING A G, ZHANG Z J, ZHAN H H, et al. Effects of thinning on the biomass and carbon storage in Pinus massoniana plantation[J]. Scientia Silvae Sinicae, 2013, 49(10): 1-6. doi: 10.11707/j.1001-7488.20131001
[11] CHEN B W, GADOW K V. Timber harvest planning with spatial objectives, using the method of simulated annealing[J]. European Journal of Operational Research, 2002, 121: 25-34. doi: 10.1046/j.1439-0337.2002.01041.x
[12] MUARRY A T. Spatial restrictions in harvest scheduling[J]. Forest Science, 1999, 45: 45-52. http://europepmc.org/abstract/AGR/IND22012868
[13] 张会儒, 李凤日, 赵秀海, 等.东北过伐林可持续经营技术[M].北京:中国林业出版社, 2016. ZHANG H R, LI F R, ZHAO X H, et al. Sustainable management and techniques of over-cutting forests in Northeast China[M]. Beijing: China Forestry Publishing House, 2016.
[14] 中国碳交易网.碳K线图[EB/OL][2016-02-17]. http://www.tanpaifang.com/. Website of China Carbon Trading. K curve of carbon[EB/OL].[2016-02-17]. http://www.tanpaifang.com/.
[15] METROPOLIS N, ROSENBLUTH A, ROSENBLUTH M, et al. Equation of state calculations by fast computing machines[J]. Journal of Chemical Physics, 1953, 21: 1087-1101. doi: 10.1063/1.1699114
[16] BASKENT E Z, JORDAN G A. Forest landscape management modeling using simulated annealing[J]. Forest Ecology and Management, 2002, 165: 29-45. doi: 10.1016/S0378-1127(01)00654-5
[17] DONG L B, BETTINGER P, LIU Z G, et al. Spatial forest harvest scheduling for areas involving carbon and timber management goals[J]. Forests, 2015, 6: 1362-1379. doi: 10.3390/f6041362
[18] PAN Y D, BIRDESY R A, FANG J Y, et al. A large and persistent carbon sink in the world's forests[J]. Science, 2011, 333: 988-993. doi: 10.1126/science.1201609
[19] 董利虎.东北林区主要树种及林分类型生物量模型研究[D].哈尔滨: 东北林业大学, 2015. http://www.wanfangdata.com.cn/details/detail.do?_type=degree&id=Y2993544 DONG L H. Developing individual and stand-level biomass equations in northeast China forest area[D]. Harbin: Northeast Forestry University, 2015. http://www.wanfangdata.com.cn/details/detail.do?_type=degree&id=Y2993544
[20] BETTINGER P, BOSTON K, KIN Y H, et al. Landscape-level optimization using tabu search and stand density-related forest management prescriptions[J]. European Journal of Operational Research, 2007, 176: 1265-1282. doi: 10.1016/j.ejor.2005.09.025
-
期刊类型引用(7)
1. 张源源,吴桂海,龙青姨,黄肖,高新生,李维国. 橡胶树三倍体品种的2n雌配子形成途径再鉴定. 热带农业科学. 2025(01): 1-6 .  百度学术
百度学术
2. 齐婉芯,陈婷婷,宋佳力,安新民. 基于转基因741杨与新疆杨杂交创制抗虫非整倍体毛白杨新种质. 北京林业大学学报. 2024(12): 92-102 . 本站查看
3. 周炳秀,刘勇,彭玉信,张劲,赵建松,朱轶超,赵巧玲,王硕,陶靖,孟路. 雄性毛白杨无性系苗期表型和生理变异的早期综合评价. 东北林业大学学报. 2023(11): 1-9 . 百度学术
4. 吴婷,贾瑞冬,杨树华,赵鑫,于晓南,国圆,葛红. 蝴蝶兰多倍体育种研究进展与展望. 园艺学报. 2022(02): 448-462 . 百度学术
5. 李伟强,戴晓港,李小平,李淑娴. 美洲黑杨种质材料倍性鉴定. 南京林业大学学报(自然科学版). 2019(05): 51-58 . 百度学术
6. 王溢,邱彤,韩强,康向阳. 不同2n雌配子来源的青杨杂种三倍体与其亲本蛋白质组差异研究. 北京林业大学学报. 2018(05): 1-9 . 本站查看
7. 张源源,方家林,黄肖,李维国,安泽伟. 橡胶树三倍体的2n配子来源及发生途径鉴定. 南方农业学报. 2018(02): 208-213 . 百度学术
其他类型引用(7)


计量
- 文章访问数: 3280
- HTML全文浏览量: 521
- PDF下载量: 58
- 被引次数: 14
