Evapotranspiration simulated by Penman-Monteith and Shuttleworth-Wallace models over a mixed plantation in the southern foot of the Taihang Mountain, northern China
-
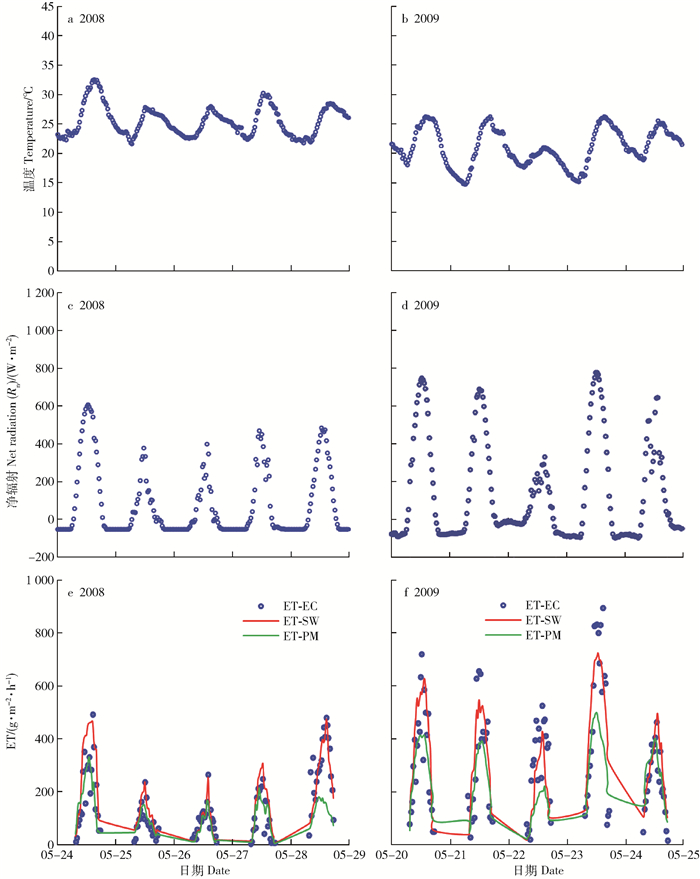
摘要: 蒸散作为陆地生态系统能量平衡和水分循环的一个关键环节,其改变会影响区域气候的变化。森林蒸散模拟研究在评价森林在区域水分循环中的作用具有重要的意义。本文采用Penman-Monteith(P-M)模型和Shuttleworth-Wallace(S-W)模型模拟了太行山南麓栓皮栎-侧柏-刺槐人工混交林的蒸散(ET),对模型模拟的ET与涡度相关法所得的ET进行了比较,评价了P-M模型和S-W模型模拟人工混交林ET的适用性,讨论了这两种模型对各阻力的敏感性。研究结果表明,P-M模型和S-W模型模拟所得的ET的季节变化和日变化类似。S-W模型和P-M模型模拟的ET均低于实测的ET,S-W模型模拟的ET比实测的ET偏低6%,P-M模型模拟的ET比实测值偏低21%,因此,P-M模型模拟的ET偏低更明显。与P-M模型相比,S-W模型模拟的ET与实测值的相关系数、一致性指数(IA)、均方根误差(RMSE)、相对误差(RE)较小。与P-M模型相比,S-W模型模拟的ET与实测值的拟合直线更加趋近1:1线。S-W模型模拟ET的效果优于P-M模型,S-W模型更适合于本研究区人工混交林蒸散的模拟。P-M模型模拟的2009年生长季的ET偏低更明显,将S-W模型模拟的ET分为蒸腾(T)和土壤蒸发(E),其中土壤E与ET比值为11.3%。土壤E约占ET的10%左右。P-M模型模拟ET偏低的原因可能与P-M模型中未考虑土壤表面阻力有关。S-W模型模拟的ET和T对冠层阻力(rsc)最敏感,其次为植物冠层高度至参考高度间的空气动力学阻力(raa),对土壤表面至冠层高度间的空气动力学阻力(ras)相对不敏感;土壤E对土壤表面阻力(rss)最敏感,对rsc最不敏感。P-M模型模拟的ET对rsc最敏感,对空气动力学阻力(ra)敏感性较弱。Abstract: Evapotranspiration (ET) is one of the key processes of terrestrial energy/water transfer and carbon exchange, and it is also an important factor affecting regional climate and global carbon cycle. It is important to simulate ET over forest ecosystem to evaluate the role of forests in surface water cycle. In this paper, the Penman-Monteith (P-M) model and the Shuttleworth-Wallace (S-W) model were used to simulate ET over a mixed plantation in the southern foot of the Taihang Mountain, northern China. The mixed plantation is mainly composed of Quercus variabilis, Platycladus orientalis and Robinia pseudoacacia. In order to evaluate the model applicability, ET simulated by the S-W model and the P-M model was compared with the measured one obtained by the eddy covariance technique. In addition, the sensitivities of P-M and S-W models to their resistance parameters were analyzed and the diurnal and seasonal variations in ET were explored. ET simulated by the S-W model and the P-M model was about 6% and 21% lower than the measured ET, respectively. Compared with the S-W model, ET simulated by the P-M model was less than the measured one. Compared with the P-M model, the correlation coefficient, agreement index, root mean square error, mean absolute error between measured ET and simulated ET by the S-W model were lower. The fitted curve of the relation between ET simulated by the S-W model and measured ET was closer to the 1:1 line than P-M model. Accordingly, ET simulated by the S-W model was higher than P-M model. It was suggested that the S-W model was more suitable for simulating ET in this region, and ET simulated by the P-M model was low. ET simulated by the P-M model and the S-W model was most sensitive to the change of canopy resistance. The second sensitive parameter was the aerodynamic resistance from canopy to reference height for the S-W model, and it was insensitive to the aerodynamic resistance from soil to the canopy. Transpiration and evaporation were most sensitive to the canopy resistance and soil surface resistance, respectively. There were no significant differences between the diurnal and seasonal variations in ET simulated by the S-W model and the P-M model, but the simulation accuracy of the S-W model was higher than P-M model. ET simulated by the P-M model in 2009 was obviously lower than the measured one. The ratio of E to ET was 11.3%, and E accounted for 10% of total ET simulated by the S-W model. Therefore, the possible reason was that soil surface resistance was not taken into account in the P-M model. The reason of the deference between simulated ET by the S-W model and the P-M model and measured ET may be that the empirical coefficients in the models are different for any vegetation types, especially how to choose the suitable resistance parameters. Moreover, meteorological factors are different in varied regions, which will influence the model accuracy. Accordingly, in order to improve the model accuracy, the climate and environment situation in study area should be taken into account to find a suitable resistance parameter of the model.
-
林分结构调整是森林经营的重要内容,林分结构包括树种、胸径、树高、林木个体大小差异等非空间结构,也包括林木分布格局、单木竞争指数等空间结构,能直接或间接影响林分的稳定和发展潜力[1]。合理的林分结构是提高整个森林生态系统结构与功能的关键[2−3],在一定程度上决定着森林的天然更新和演替方向,对森林质量优化和可持续经营具有重要的指导及参考作用。
马尾松(Pinus massoniana)作为亚热带低山丘陵区群落演替的先锋树种,由于其耐旱易存活、繁殖能力强等生态特征,以及速生丰产的高经济效益特点,是南方亚热带荒山造林的主要树种[4−5]。由于马尾松林长期高密度的纯林经营,造成了林地退化、生产力和多样性降低等问题[6−7],严重影响了林地的可持续经营。因此,需要通过间伐和补植等抚育措施,对马尾松林进行阔叶化改造,促进马尾松低效纯林向针阔混交和阔叶混交林演替。
目前,许多学者针对马尾松林改造对林分结构与功能的影响进行了大量研究。马尾松林改造能够改善林分年龄和空间结构,在树种多样性、林分多功能提升等方面成效显著[8−9]。此外,马尾松林改造不仅提高了林分的生长活力和生长量,还能促进林下植被的稳定性和生长发育,有利于提升森林生态系统的结构和功能。人工采伐和抚育管理下的马尾松林林分形成的时间缩短,对林分质量提高有正面影响[10]。林分结构变化的驱动因素是复杂的,特别是间伐等可能破坏现有驱动机制的一些干扰会直接或间接影响林分结构[11]。有研究表明,中度间伐能形成稳定的空间结构,轻度间伐会导致大量幼苗的出现,而重度间伐则会导致局部树种多样性减少[12]。总体上,目前国内外大部分研究均采用结构参数的均值或一元、二元分布等形式量化林分空间结构特征[13−15],而针对马尾松林改造后的林分结构的综合评价仍相对缺乏。此外,阔叶化改造前后树种组成、多样性等指标的变化与林分空间结构的关联机制也尚不明晰,需要进一步深入探讨。
因此,本研究以亚热带典型马尾松次生林不同改造模式的林分为研究对象,主要探究间伐和补植两类改造措施对林分空间和非空间结构的影响,并对不同改造模式的林分结构进行综合评价,分析阔叶化指标与林分结构的关系,从而更加科学合理地评判各类林分改造工程的效果,以期为区域内马尾松林的质量优化和可持续经营提供参考。
1. 研究区概况与研究方法
研究区地处浙江省建德市(29°12′20″ ~ 29°46′27″ N,118°53′46″ ~ 119°45′51″ E),属亚热带季风气候,温暖湿润,多年平均气温16.9 ℃,无霜期254 d,年均降水量1 528 mm,年均蒸发量917.8 mm,年均相对湿度77.7%,年均风速1.65 m/s。土壤主要有黄壤、红壤、岩性土、潮土和水稻土[16],地带性植被为壳斗科(Fagaceae)、樟科(Lauraceae)、金缕梅科(Hamamelidaceae)、木兰科(Magnoliaceae)、冬青科(Aquifoliaceae)、山茶科(Theaceae)等树种组成的常绿阔叶林[17]。
1.1 样地设置与调查
在研究区内选择改造前林分密度、立地条件和龄级基本一致的马尾松林为研究对象,按照马尾松间伐强度和是否补植划分为6类林分改造类型:轻度间伐无补植(light thinning without replanting,LTNP)、中度间伐无补植(moderate thinning without replanting,MTNP)、重度间伐无补植(heavy thinning without replanting,HTNP)、中度间伐补阔(moderate thinning with broadleaf replanting,MTP)、重度间伐补阔(heavy thinning with broadleaf replanting,HTP)、皆伐补阔(clear cut with broadleaf replanting,CCP),各类型样地间伐时间分布在2005—2007年,MTP、CCP补植时间在2010年,HTP补植时间在2015年。补植阔叶树苗均为2年生容器苗(地径 > 1 cm,高度 > 1 m)。
样地调查于2023年7-8月进行。参考吴载璋[18]、谢阳生等[19]及张亚昊等[20]研究中的样地设置方法,根据典型抽样的方法,每类改造林分内随机设置3个20 m × 20 m的标准样地,样地间隔大于30 m,共设置了18个标准样地。记录各林分样地经纬度和海拔、坡度和坡向等地形因子(表1)。每个标准样地划分为16个5 m × 5 m的样方,对样方内的乔木进行每木检尺,记录树种、胸径、树高、冠幅,并标记目标树(马尾松)及4株相邻树,测量每株相邻树与目标树的距离和角度,用于计算林分空间结构指标。
表 1 不同改造林分样地概况Table 1. Overview of sample plots in different transformation stands林分改造模式 经纬度 间伐时间 间伐强度/% 补植树种 林龄/a 坡向 坡度/(°) 轻度间伐无补植(LTNP) 119°29′20″E,29°33′30″N 2005 0 ~ 30 55 东南 40 中度间伐无补植(MTNP) 119°08′09″E,29°25′34″N 2005 30 ~ 60 60 东 35 重度间伐无补植(HTNP) 119°08′08″E,29°25′33″N 2007 > 60 50 东南 40 中度间伐补阔(MTP) 119°31′14″E,29°33′35″N 2005 30 ~ 60 浙江楠 Phoebe chekiangensis、
浙江樟 Cinnamomum chekiangense60 南 35 重度间伐补阔(HTP) 119°13′18″E,29°20′18″N 2007 60 ~ 80 乌桕 Triadica sebifera、
山樱花 Prunus serrulata50 南 40 皆伐补阔(CCP) 119°08′10″E,29°25′43″N 2006 > 80 紫楠 Phoebe sheareri 50 东南 35 1.2 非空间结构指标计算
1.2.1 物种重要值
重要值(IA)是反映树种在林分中优势程度的定量指标,它能够反映树种在林分中的重要性[21]。
IA=RA+RH+RS3 式中:RA 为相对多度,RH 为相对高度,RS 为相对显著度。具体而言,RA 为某树种多度占所有物种多度之和的百分比,RH 为某树种的高度之和占所有物种高度之和的百分比,RS为某树种的胸高断面积之和占所有物种胸高断面积之和的百分比。
1.2.2 物种多样性指数
选用Simpson多样性指数(D)、Pielou均匀度指数(J)、Margalef丰富度指数(H)表示树种多样性水平,后文分别简称为Simpson指数、Pielou指数、Margalef指数。
D=1−S∑t=1P2t J=−S∑t=1PtlnPtlnN H=S−1lnN 式中:S为样地内植物种类总数,N为样地内植物个体总数,Pt为第t个种的个体数(Nt)占样地内所有种个体总数(N)的比值。
1.2.3 林分蓄积量
基于林分内的主要树种,采用二元材积公式计算主要针叶和阔叶树种的单株材积[22−23],所有单株材积累加得到样地蓄积量,最后换算为每公顷蓄积量。
Vm = 0.000 062 341 803 DBH1.855 149 7HE0.956 824 92
Vs = 0.000 058 777 042 DBH1.969 983 1HE0.896 461 57
Vk = 0.000 068 563 4 DBH1.933 221HE0.867 885
式中:Vm、Vs和Vk分别为马尾松、杉木和阔叶树的单株材积,DBH为胸径,HE为树高。
1.3 空间结构指标计算
1.3.1 水平空间结构
采用混交度(Mi)、角尺度(Wi)来描述林分的水平空间结构[24]。
Mi=144∑j=1vij 式中:当目标树i与相邻木j非同种,vij = 1,否则vij = 0。
Wi=144∑j=1zij 式中:当目标树i与相邻木j的夹角α小于标准角α0,zij = 0,否则zij = 1。
1.3.2 垂直空间结构
采用开敞度(Oi)、林层指数(Li)来描述林分的垂直空间结构[24]。
Oi=144∑j=1tij 式中:当Dij ≥ hj − hi,tij = 1,反之tij = 0。其中,hi为目标树i的树高,hj为相邻木j的树高,Dij为目标树i与相邻木j间的距离。
Li=zi3×144∑j=1sij 式中:当目标树i与相邻木j不属同层,sij = 1,否则sij = 0;zi为目标树i所在空间结构单元中林层个数。
1.3.3 林木竞争态势
采用大小比数(Ui)、竞争指数(Ci)来描述林木竞争态势[24]。
Ui=144∑j=1kij 式中:当目标树i胸径小于相邻木j时,kij = 1,否则kij = 0。
Ci=4∑j=1djdi×1Dij 式中:di为目标树i的胸径,dj为相邻木j的胸径。
1.4 林分结构综合评价
1.4.1 指标选取和赋值
综合上述林分空间结构和非空间结构指标,选取10个参数构建综合评价体系。由于不同指标之间存在取值和单位的差异,需要对所选指标进行赋值和标准化处理,参考魏红洋等[25]的研究,各指标具体赋值情况见表2。
表 2 林分结构综合评价指标及赋值情况Table 2. Comprehensive evaluation index and assignment of stand structure指标 评价标准 赋值 解释 A1胸径分布 [1.2,1.7] 1 以林分内相邻径级株数的比值(q)进行量化,天然异龄林分的典型胸径分布为合理状态(q ∈ [1.2,1.7]),同龄林为单峰分布,不完整异龄林为多峰分布 多峰分布 0.5 单峰分布 0 A2树种组成 ≥ 3 1 依据树种与林分的断面积比值计算(十分法),统计大于1成的树种数, ≥ 3表示多优势树种混交林, 2表示混交林,1表述纯林 2 0.5 1 0 A3树种多样性 正向指标 [0,1] 采用Simpson多样性指数表示 A4林分蓄积量 正向指标 [0,1] 反映林分生产力的大小 A5角尺度 < 0.4 0 描述林木个体在水平分布格局上的均匀性,< 0.4为均匀分布,[0.4, 0.5]为随机分布, > 0.5为聚集分布 [0.4,0.5] 1 > 0.5 0.5 A6混交度 正向指标 [0,1] 描述树种的空间隔离程度 A7开敞度 正向指标 [0,1] 反映目标树受相邻木遮蔽程度 A8林层指数 正向指标 [0,1] 反映林层在垂直方向上的复杂性和多样性 A9大小比数 逆向指标 [0,1] 反映林木分化程度大小和个体竞争态势 A10竞争指数 逆向指标 [0,1] 反映林木所承受的竞争压 1.4.2 综合评价方法
选择单位圆综合评价体系法[26]对不同林分类型的结构进行整体性的评价,能够直观展现林分结构的优劣以及各指标的好坏程度。根据综合评价单位圆所围成的图形大小,可以快速准确地确定林分的经营方向,进而开展相应的森林经营措施。依据单位圆评价体系,将林分结构的等级划分为5种(表3)。
表 3 林分结构评价等级Table 3. Evaluation grade of stand structureω值 评价等级 ≥ 0.70 良好 [0.55 ~ 0.70) 较好 [0.30 ~ 0.55) 中等 [0.20 ~ 0.30) 较差 < 0.20 极差 注:ω为林分结构综合评价值。 ω=S1+S2π 式中:ω为林分的结构综合评价值,S1为闭合图形扇形面积之和,S2为闭合图形中三角形面积之和。
1.5 数据处理
采用单因素方差分析(one-way ANOVA)对不同改造林分类型间的树种生长特征、物种多样性指数、蓄积量和空间结构指标的差异进行显著性检验;并采用分组线性回归模型分析了阔叶化指标与林分空间结构的关系。所有统计分析均通过R4.3.2完成。
2. 结果与分析
2.1 不同改造林分的树种组成和多样性
间伐和补阔改变了林分内的树种组成,林分内马尾松的重要值随间伐强度的增加而减小,补阔林分中,补植树种重要值也处在前位(表4)。除皆伐补阔林分(CCP)外,其他改造林分仍以马尾松为最优势树种。CCP补植树种为紫楠(Phoebe sheareri)和杉木(Cunninghamia lanceolata),取代马尾松成为林分内优势树种。就林分内物种多样性而言(图1),轻度间伐无补植林分(LTNP)的Simpson指数显著低于其他林分(P < 0.05),LTNP的Pielou指数显著低于其他林分(P < 0.05)。重度间伐无补植林分(HTNP)的Margalef指数显著高于LTNP、中度间伐补植林分(MTP)与CCP(P < 0.05),LTNP和CCP的Margalef指数最低。说明LTNP和CCP林分中树种组成比较单一,除了林分内优势树种外,只有零星的树种分布,且LTNP林分结构相较于其他改造林分也处于较差状态。
表 4 不同林分改造模式下主要树种的重要值Table 4. Important values of main tree species under different stand transformation modes林分改造模式 更新层物种 重要值/% 重要值累计/% LTNP 马尾松 Pinus massoniana 92.24 96.91 檵木 Loropetalum chinense 2.86 槲栎 Quercus aliena 1.81 MTNP 马尾松 Pinus massoniana 58.90 84.47 杉木 Cunninghamia lanceolata 21.41 浙江楠 Phoebe chekiangensis 4.16 HTNP 马尾松 Pinus massoniana 46.21 81.13 杉木 Cunninghamia lanceolata 27.91 木荷 Schima superba 7.01 MTP 马尾松 Pinus massoniana 68.97 85.71 浙江樟 Cinnamomum chekiangense 9.66 浙江楠 Phoebe chekiangensis 7.08 HTP 马尾松 Pinus massoniana 35.45 71.25 乌桕 Triadica sebifera 21.23 山樱花 Prunus serrulata 14.57 CCP 杉木 Cunninghamia lanceolata 58.80 98.46 紫楠 Phoebe sheareri 37.27 钓樟 Cinnamomum camphora 2.39 注:表中列出每个林分改造类型中重要值排名前3的物种。 2.2 不同改造林分的胸径和树高结构
林分胸径结果(图2a)显示:中度间伐补阔林分(MTP)的马尾松平均胸径为30.20 cm,显著高于其他改造林分(P < 0.05),而各林分改造模式中,皆伐补阔林分(CCP)中其他树种的平均胸径显著高于除重度间伐无补植林分(HTNP)外的其他4个林分,中度间伐补阔林分(MTP)马尾松的平均胸径显著高于其他林分。LTNP中57%的林木胸径处于10 ~ 20 cm,呈“单峰左偏”分布;HTNP和重度间伐补阔(HTP)中分别有48%和80%的林木胸径处于0 ~ 10 cm,林木数量随胸径增加显著降低,呈“倒J型”分布;而MTP、中度间伐无补植(MTNP)和CCP林分的胸径则呈“多峰”结构(图3a)。总体来看,林分中小径阶林木占比随间伐强度增加而增加,这说明间伐对林分更新有促进作用;相同间伐强度下,补植林分与未补植林分相比,大径材阶木更多,说明补植促进了林分内林木个体的生长。
林分树高的结果(图2b)显示:无补植林分中马尾松平均树高在10.96 ~ 16.57 m,补阔林分中MTP马尾松的平均树高为19.71 m,显著高于除HTNP外的其他4个林分(P < 0.05)。LTNP林分中73%的林木高度在10 ~ 15 m之间,林层结构趋向于单层林;MTNP和HTNP林木高度分布区间较广,林层数较多,但高于20 m的林木占比仅为1.12%;而MTP和HTP林层数多,且高于20 m的林木占比达到13.66%;CCP林分中,树高最大值为21 m,低于10 m的林木占比为66%(图3b)。
2.3 不同改造林分的蓄积量
林分蓄积量结果(图4)显示:中度间伐补阔(MTP)林分蓄积量为13.06 m3/hm2,高于其他改造林分,而重度间伐补阔(HTP)林分蓄积量为1.09 m3/hm2,低于其他林分;林分总蓄积量大小顺序为MTP > LTNP > HTNP > CCP > MTNP > HTP。除皆伐补阔(CCP)林分外,其他林分中马尾松蓄积量占比均超过65%,这表明在各林分中马尾松生产力仍处于较高水平。LTNP林分中,马尾松蓄积量占比最多,MTP林分是所有改造林分中马尾松蓄积量和总蓄积量最高的林分,说明中度间伐补植措施促进林分整体生长量作用更加明显。
2.4 不同改造林分的空间结构
在水平空间结构上,不同改造模式之间的角尺度存在显著差异(P < 0.05),LTNP的角尺度最大,CCP最小,但所有林分的角尺度均小于0.4。混交度方面,LTNP显著低于其他改造模式(P < 0.05),其他改造模式之间无显著差异,基本为中高度混交(混交度0.6 ~ 0.8)。在垂直空间结构上,开敞度方面,HTP最高,显著高于MTP(P < 0.05),说明重度间伐补阔后,林分的透光条件得到改善,林木生长的空间更大。林层指数方面,MTP和CCP显著高于除HTNP外的其他改造模式(P < 0.05)。林木分化程度方面,除CCP外,林分的大小比数随间伐强度的增加而降低。林木竞争态势上,LTNP的竞争指数显著高于其他改造模式,HTP和CCP的竞争指数显著低于其他改造模式,林分竞争指数随着间伐强度增加而降低,且补阔林分的竞争指数显著低于未补植林分(图5)。
2.5 不同改造林分的结构综合评价
不同改造模式的林分结构综合评价值ω排序为MTP(0.48) > HTNP(0.36) > CCP(0.33) > HTP(0.31) > MTNP(0.26) > LTNP(0.14)。重度间伐无补植(HTNP)、中度间伐补阔(MTP)、重度间伐补阔(HTP)和皆伐补阔(CCP)的林分结构评价等级都处于中等水平,整体来看,这4类改造模式的林木在水平分布格局上更加均匀(图6)。虽然HTP和CCP的林分蓄积量较低,且HTP林层结构过于单一,CCP基本处于同林龄状态,但综合树种空间隔离程度、竞争态势等指标,其林分结构仍处在中等水平。在中度间伐无补植(MTNP)林分中,经过一定强度间伐后,由于未采取补植措施,林分内自然更新的阔叶树较多,但由于缺乏抚育管理,新生木在与保留木的竞争中处于劣势,不仅影响林分内保留木的生长,还导致胸径分布、林分蓄积量和竞争指数偏低。因此,其林分结构的评价等级为较差。轻度间伐无补植(LTNP)林分内原有的林分结构保留完整,保留木较多且处于同一生长水平,导致其胸径分布、树种组成系数、混交度和林层指数赋值过低。此外,林分内树种单一,整体空间结构分布不均,导致林木个体间竞争激烈,竞争指数赋值过低。因此,其林分结构的评价等级为极差。
2.6 林分结构与阔叶化指标的线性回归
为探究阔叶化指标变化与林分空间结构的关联机制,对林分结构综合评价ω值与林分内阔叶树占比及树种多样性指数进行线性回归(图7)。在未补植林分,阔叶树占比、Simpson指数、Pielou指数和Margalef指数均对ω值有显著正效应(P < 0.05);而在阔叶树补植林分,林分综合结构与阔叶树占比呈负相关,与树种多样性指数均无显著相关性(P > 0.05)。说明马尾松间伐促进了树种组成、多样性的提升,有利于改善林分结构,而当前补植的阔叶树尚处在生长前期和中期阶段,其阔叶化程度和树种多样性对林分结构的影响尚未完全体现。
3. 讨 论
本研究发现马尾松林改造对林分结构,包括空间和非空间结构参数均有显著影响。从非空间结构指标来看,随着间伐强度的增加,马尾松优势度逐渐降低。檵木(Loropetalum chinense)、细齿叶柃(Eurya nitida)等林下自然更新树种迅速占据生态位,其优势度逐渐增加,促进了马尾松纯林向针阔混交林演替[27]。而树种多样性则随着间伐强度增加呈现先增加后降低的趋势,这是因为中度间伐相对于其他间伐强度,林分密度更适中,提高光照和养分供应效率,物种生存的空间和资源更多,能够保证更多物种共存,符合“中度干扰假说”[28−29]。同时,随着间伐强度增加,林分中小径阶林木占比逐渐增加,中度间伐林分胸径结构呈“多峰”分布,重度间伐林分呈“倒J型”分布;从树高结构可以看出,经过间伐和补阔措施后,树高分布更均匀,说明林分由单层同龄林逐渐向异龄复层林转变[30]。这与王懿祥等[22]研究结果类似,马尾松间伐提高了林分内林木个体大小的不一致性。此外,由于马尾松属强喜光树种,间伐后营养空间增大,也促进了马尾松保留木的生长,特别是加快了原优势木的生长[9],因此中度间伐补阔林分蓄积量整体处于最高水平。
在水平空间结构方面,基于邻体效应的林分结构参数能够有效体现林木空间的多维特征[31]。角尺度和混交度作为描述林分水平空间结构的指标,是维持物种多样性和发挥林分多功能生态效益的基础[32]。本研究发现,皆伐补阔林分的角尺度显著低于其他改造林分,且所有林分的角尺度均小于0.4,说明马尾松林在间伐和阔叶树补植后,林木水平分布格局比较均匀。除轻度间伐无补植林分为低混交度外,其他林分均为中高度混交度,即间伐和补阔措施提高了混交度,这与Boivin-Dompierre等[33]和王宇等[34]的研究结果类似,但与吴蒙蒙等[35]的研究结果存在一定差异。林分混交度主要是由林木种类和数量决定[2],轻度间伐林分马尾松保留木较多,树种组成变化较小,而经过中、高强度间伐后,林分中其他劣势树种或者补植的阔叶树得到更多生存空间和资源,这些树种多为散生,增加了树种的隔离程度,提高了林分混交度[36]。总体来看,间伐配合阔叶树补植使得改造林分形成针阔混交林基本结构,虽然补植的阔叶树尚处在生长相对早期阶段,对林分综合结构的影响尚未完全体现,但增加了林分物种多样性和结构复杂性,并发挥了针阔树种的生态互补价值[19]。
在垂直空间结构方面,林分垂直空间结构影响林分内的资源供应、分配以及利用效率[37]。本研究发现,林分开敞度随着间伐强度的提高而增加,重度间伐补阔林分的开敞度高于其他改造林分,且所有改造林分的开敞度均高于0.75。这与刘雪强[38]的研究结果相似,说明马尾松林在间伐后,林分透光度得到显著改善,补植阔叶树种后,林木垂直分布层次也更均匀。而间伐补阔林分的林层指数则随间伐强度的增加呈先增加后降低的趋势,中度间伐补阔和皆伐补阔林分的林层指数高于其他4类改造林分,而重度间伐补阔林分的林层比较单一。这主要因为林层指数与树高直接关联,而重度间伐补阔林分中马尾松保留木很少,补植乌桕(Triadica sebifera)和山樱花(Prunus serrulata)后的恢复时间仅5 ~ 6年,树高结构较单一,林层尚未分化,后期随着恢复时间增加,林木个体间的生长差异不断增大,林层分化会逐渐明显[39]。
林木间的竞争普遍存在,对林分结构的发育演替也有着深刻影响[40]。本研究结果表明,不同马尾松改造林分的大小比数和竞争指数存在显著差异性,随着间伐强度增加,林分的大小比数和竞争指数逐渐减小,且补阔林分的竞争态势要低于未补植林分。这与姜廷山等[41]的研究结果类似,但李建等[42]和王晓荣等[43]研究表明,采伐对林分大小分化程度影响不显著,这可能是因为轻度间伐林分中马尾松数量仍较多,主要存在的是种内竞争,同质的生态位对环境和资源的竞争更激烈[44];而中高强度间伐增加了相邻木之间的距离,减少了林木间的竞争。此外,补植阔叶树与保留马尾松在个体大小和生长活力方面均存在一定差异,从而导致大小比数存在显著差异性。
4. 结 论
马尾松林分改造后的树种组成发生明显变化,补植树种逐渐取代马尾松成为优势种。随着间伐强度增加,林分中小径阶林木占比提高,林分由单层同龄林逐渐向复层异龄林转变。中、重度间伐和阔叶树补植后的林木水平分布格局较均匀,达到了中高度混交状态,林分透光度得到显著改善,林分内竞争态势得到缓解。补阔林分的结构优于未补植林分,马尾松中度间伐补阔(浙江樟Cinnamomum chekiangense、浙江楠Phoebe chekiangensis)后的整体林分结构最佳。因此,应采取适当抚育间伐和补植乡土树种,合理调整、优化林分结构,促进马尾松低效纯林向针阔混交和阔叶混交林演替。本文重点讨论了同一时间尺度下的马尾松林改造后的林分结构,然而间伐和补植对林分的影响是复杂且长期的,不同改造模式下林分结构的动态变化还需持续监测。
-
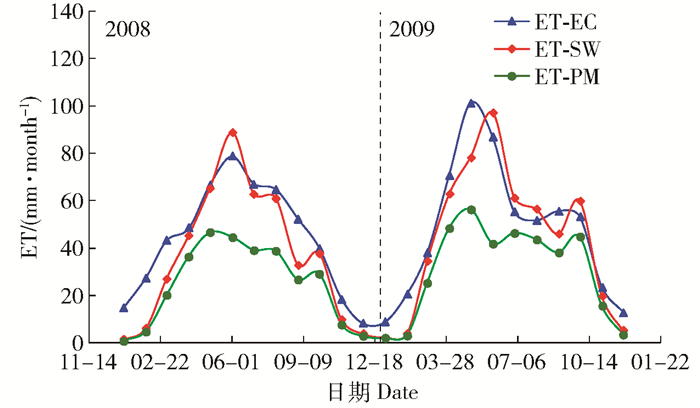
图 1 人工混交林ET的季节变化
ET为蒸散;ET-EC为涡度观测值;ET-SW为S-W模型模拟值;ET-PM为P-M模型模拟值。下同。蒸散为月总蒸散。
Figure 1. Seasonal variations of evapotranspiration in the mixed plantations
ET is evapotranspiration; ET-EC represents ET is measured by eddy covariance system; ET-SW means ET is simulated by the Shuttleworth-Wallace (S-W) model; ET-PM represents ET is simulated by the Penman-Monteith (P-M) model. The same as below. ET is monthly total evapotranspiration.
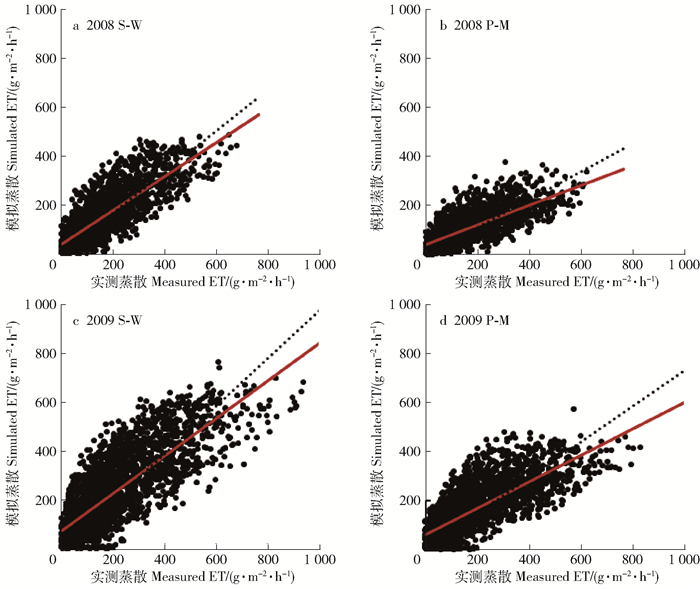
图 3 S-W模型和P-M模型模拟的蒸散与实测值比较
S-W为Shuttleworth-Wallace模型,P-M为Penman-Monteith模型。虚线为1:1线,蒸散模拟值和蒸散实测值线性拟合斜率、相关系数、截距见表 1。
Figure 3. Comparison of evapotranspiration simulated by S-W, P-M models and measured one
S-W is Shuttleworth-Wallace model, P-M is Penman-Monteith model. The dashed line is 1:1 line. The parameters used in fitted equations of simulated and measured ET and significant test were shown in Tab. 1.
表 1 S-W模型和P-M模型模拟蒸散的模拟精度比较
Table 1 Comparison of the simulation accuracy of simulated ET by the S-W model and P-M model
年份
Year模型
Model截距 Intercept/(g·m-2·h-1) 斜率
Slope(k)R RMSE RE MAE IA 2008 S-W 40.95 0.70 0.85** 1.77 -21.50 25.53 0.89 P-M 44.59 0.40 0.82** 1.15 -44.30 52.50 0.76 2009 S-W 74.40 0.77 0.80** 2.82 2.64 140.52 0.90 P-M 62.54 0.54 0. 71** 1.90 -28.40 96.67 0.78 注:S-W模型和P-M模型(y)分别与实测值(x)拟合直线方程(y=ax+b)的系数, R为相关系数; RMSE为均方根误差, RE为相对误差, MAE为平均绝对误差, IA为一致性指数。**表示显著相关(P<0.01)。Notes: the fitted curve of the relation between simulated ET(y) and measured ET(x): y=ax+b, R is correlation coefficient; RMSE is the root mean square error, RE is the relative error, MAE is mean absolute error and IA is the agreement index. ** means significant correlation (P<0.01). 表 2 S-W模型模拟的蒸散(ET)、蒸腾(T)和蒸发(E)对冠层阻力和空气动力学阻力变化±10%敏感性分析
Table 2 Sensitivity analysis of the ±10% change in resistance parameters of simulated ET obtained from S-W model
阻力参数Resistance parameter 调整大小Change in resistance ET/% T/% E/% raa 10% 1.191 1.129 8.008 -10% -1.226 -1.164 -8.052 rac 10% 0.045 0.03 1.684 -10% -0.045 -0.03 -1.684 ras 10% -0.024 0.011 -3.873 -10% 0.031 -0.012 4.693 rsc 10% -7.945 -8.023 0.597 -10% 9.473 9.566 -0.711 rss 10% -0.035 0.047 -9.008 -10% 0.044 -0.056 10.987 注:raa为植物冠层高度至参考高度间的空气动力学阻力, ras为土壤表面至冠层高度间的空气动力学阻力, rac为冠层表面边界层阻力, rss为土壤表面阻力, rsc为冠层气孔阻力。T为蒸腾, E为土壤蒸发。下同。Notes: ras and raa is the aerodynamic resistances from soil to canopy and from canopy to reference height, respectively, rac and rsc are bulk resistances of canopy stomatal and boundary layer, respectively, rss is soil surface resistance, ET is evapotranspiration, T is transpiration, E is soil evaporation. The same below. 表 3 P-M模型模拟的蒸散(ET)对冠层阻力和空气动力学阻力变化±10%时的敏感性分析
Table 3 Sensitivity analysis of evapotranspiration (ET) simulated by the P-M model to the ±10% change in resistance parameters
阻力参数
Resistance parameter调整大小
Change in resistanceET/% ra 10% 1.654 -10% -1.73 rsc 10% -7.367 -10% 8.659 注:ra为空气动力学阻力。Note: ra is the aerodynamic. -
[1] JUNG M, REICHSTRIN M, CIAIS P, et al. Recent decline in the global land evapotranspiration trend due to limited moisture supply[J]. Nature, 2010, 467: 951-954. doi: 10.1038/nature09396
[2] 吕厚荃, 于贵瑞.几种实际蒸散计算方法在土壤水分模拟中的应用[J].资源科学, 2001, 23(6): 85-90. doi: 10.3321/j.issn:1007-7588.2001.06.017 LÜ H Q, YU G R. Application of some actual evapotranspiration models in simulation of soil moisture[J]. Resources Science, 2001, 23(6): 85-90. doi: 10.3321/j.issn:1007-7588.2001.06.017
[3] 徐富安, 赵炳梓, 唐万龙.豫北地区水分生态环境要素演变及其意义[J].土壤学报, 2003, 40(1): 29-36. doi: 10.3321/j.issn:0564-3929.2003.01.004 XU F A, ZHAO B Z, TANG W L. Change of some environmental factors and its ecological significance in north Henan Province, China[J]. Acta Pedologica Sinica, 2003, 40(1): 29-36. doi: 10.3321/j.issn:0564-3929.2003.01.004
[4] 刘勤, 严昌荣, 赵彩霞, 等.黄河流域日潜在蒸散量变化及气象敏感要素分析[J].农业工程学报, 2014, 30(17): 157-166. doi: 10.3969/j.issn.1002-6819.2014.17.021 LIU Q, YAN C R, ZHAO C X, et al. Changes of daily potential evapotranspiration and analysis of its sensitivity coefficients to key climatic variables in Yellow River Basin[J]. Transactions of the Chinese Society of Agricultural Engineering, 2014, 30(17): 157-166. doi: 10.3969/j.issn.1002-6819.2014.17.021
[5] EAMUS D, CLEVERLY J, BOULAIN N, et al. Carbon and water fluxes in an arid-zone Acacia savanna woodland: an analyses of seasonal patterns and responses to rainfall events[J]. Agricultural and Forest Meteorology, 2013, 182-183: 225-238. doi: 10.1016/j.agrformet.2013.04.020
[6] XU M J, WEN X F, WANG H M, et al. Effects of climatic factors and ecosystem responses on the inter-annual variability of evapotranspiration in a coniferous plantation in subtropical China[J/OL]. PLoS ONE, 2014, 9(1): e85593[2017-02-12]. doi: 10.1371/journal.pone.0085593.
[7] TONG X J, ZHANG J S, MENG P, et al. Environmental controls of evapotranspiration in a mixed plantation in North China[J]. International Journal of Biometeorology, 2017, 61(2): 227-238. doi: 10.1007/s00484-016-1205-0
[8] ALLAN R G, PEREIRA L S, RAES D, et al. Crop evapotranspiration: guidelines for computing crop water requirements[M]. Rome: FAO, 1998: 56.
[9] HARGREAVES G H, SAMANI Z A. Reference crop evapotranspiration from temperature[J]. Applied Engineering in Agriculture, 1985, 1(2): 96-99. doi: 10.13031/2013.26773
[10] PRIESTLEY C H B, TAYLOR R J. On the assessment of surface heat flux and evaporation using large-scale parameters[J]. Monthly Weather Review, 2009, 100(2): 81-92. doi: 10.1175-1520-0493(1972)100-0081-OTAOSH-2.3.CO%3b2/
[11] MONTEITH J L, UNSWORTH M. Principles of environmental physics[M]. 2nd ed. London: Butterworth-Heinemann, 1990:286.
[12] 莫兴国, 林忠辉, 刘苏峡.基于Penman-Monteith公式的双源模型的改进[J].水利学报, 2000, 31(5): 6-11. doi: 10.3321/j.issn:0559-9350.2000.05.002 MO X G, LIN Z H, LIU S X. An improvement of the dual-source model based on Penman-Monteith formula[J]. Journal of Hydraulic Engineering, 2000, 31(5): 6-11. doi: 10.3321/j.issn:0559-9350.2000.05.002
[13] ORTEGA-FARIAS S, OLIOSO A, ANTONIOLETTI R, et al. Evaluation of the Penman-Monteith model for estimating soybean evapotranspiration[J]. Irrigation Science, 2004, 23(1): 1-9. doi: 10.1007/s00271-003-0087-1
[14] ZHANG B, KANG S, LI F, et al. Comparison of three evapotranspiration models to Bowen ratio-energy balance method for a vineyard in an arid desert region of northwest China[J]. Agricultural and Forest Meteorology, 2008, 148(10): 1629-1640. doi: 10.1016/j.agrformet.2008.05.016
[15] ZHANG X Y, YU T F, GAO G L, et al. Comparison of three evapotranspiration models with eddy covariance measurements for a Populus euphratica Oliv. forest in an arid region of northwestern China[J]. Journal of Arid Land, 2016, 8(1): 146-156. doi: 10.1007/s40333-015-0017-0
[16] GARDIOL J M, SERIO L A, MAGGIORA A I D. Modelling evapotranspiration of corn (Zea mays) under different plant densities[J]. Journal of Hydrology, 2003, 271(1-4): 188-196. doi: 10.1016/S0022-1694(02)00347-5
[17] LI X Y, YANG P L, REN S M, et al. Modeling cherry orchard evapotranspiration based on an improved dual-source model[J]. Agricultural Water Management, 2010, 98(1): 12-18. doi: 10.1016/j.agwat.2010.07.019
[18] 刘绍民, 孙中平, 李小文, 等.蒸散量测定与估算方法的对比研究[J].自然资源学报, 2003, 18(2): 161-167. doi: 10.3321/j.issn:1000-3037.2003.02.006 LIU S M, SUN Z P, LI X W, et al. A comparative study on models for estimating evapotranspiration[J]. Journal of Natural Resources, 2003, 18(2): 161-167. doi: 10.3321/j.issn:1000-3037.2003.02.006
[19] 李俊, 韩凤明, 同小娟, 等.麦田蒸散模型的改进及其对阻力参数的敏感性分析[J].中国农业气象, 2014, 35(6): 635-643. doi: 10.3969/j.issn.1000-6362.2014.06.005 LI J, HAN F M, TONG X J, et al. Evapotranspiration models for a winter wheat field: the improvements and analyses on their sensitivities to the resistance parameters[J]. Chinese Journal of Agrometeorology, 2014, 35(6): 635-643. doi: 10.3969/j.issn.1000-6362.2014.06.005
[20] ZHOU M C, ISHIDAIRA H, HAPUARACHCHI H P, et al. Estimating potential evapotranspiration using Shuttleworth-Wallace model and NOAA-AVHRR NDVI data to feed a distributed hydrological model over the Mekong River Basin[J]. Journal of Hydrology, 2006, 327(1): 151-173. http://www.wanfangdata.com.cn/details/detail.do?_type=perio&id=934cca5d0361c365516c0356c01bf7c8
[21] 刘远, 周买春, 陈芷菁, 等.基于S-W模型的韩江流域潜在蒸散发的气候和植被敏感性[J].农业工程学报, 2013, 29(10): 92-100. http://d.old.wanfangdata.com.cn/Periodical/nygcxb201310015 LIU Y, ZHOU M C, CHEN Z J, et al. Sensitivity of the potential evapotranspiration to climate and vegetation in Hanjiang River Basin based on S-W Model[J]. Transactions of the Chinese Society of Agricultural Engineering, 2013, 29(10): 92-100. http://d.old.wanfangdata.com.cn/Periodical/nygcxb201310015
[22] ZHAO L W, ZHANG W Z. Evapotranspiration of an oasis-desert transition zone in the middle stream of Heihe River, Northwest China[J]. Journal of Arid Land, 2014, 6(5): 529-539. doi: 10.1007/s40333-014-0061-1
[23] 沈竞, 张弥, 肖薇, 等.基于改进S-W模型的千烟洲人工林蒸散组分拆分及其特征[J].生态学报, 2016, 36(8): 2164-2174. http://www.cnki.com.cn/article/cjfdtotal-stxb201608007.htm SHEN J, ZHANG M, XIAO W, et al. Modeling evapotran-spiration and its components in Qianyanzhou plantation based on modified SW model[J]. Acta Ecologica Sinica, 2016, 36(8) : 2164-2174. http://www.cnki.com.cn/article/cjfdtotal-stxb201608007.htm
[24] JIANG C, NIE Z, MU X M, et al. Potential evapotranspiration change and its attribution in the Qinling Mountains and surrounding area, China, during 1960-2012[J]. Journal of Water and Climate Change, 2016, 7 (3): 526-541. doi: 10.2166/wcc.2016.110
[25] 刘佳, 同小娟, 张劲松, 等.太阳辐射对黄河小浪底人工混交林净生态系统碳交换的影响[J].生态学报, 2014, 34(8): 2118-2127. http://d.old.wanfangdata.com.cn/Periodical/stxb201408024 LIU J, TONG X J, ZHANG J S, et al. Impacts of solar radiation on net ecosystem carbon exchange in a mixed plantation in the Xiaolangdi Area[J]. Acta Ecologica Sinica, 2014, 34(8): 2118-2127. http://d.old.wanfangdata.com.cn/Periodical/stxb201408024
[26] 同小娟, 张劲松, 孟平, 等.华北低丘山地人工林生态系统净碳交换与气象因子的关系[J].生态学报, 2009, 29(12): 6638-6645. doi: 10.3321/j.issn:1000-0933.2009.12.040 TONG X J, ZHANG J S, MENG P, et al. Relationship between net ecosystem carbon exchange and meteorological factors in a plantation in the hilly area of the North China[J]. Acta Ecologica Sinica, 2009, 29(12): 6638-6645. doi: 10.3321/j.issn:1000-0933.2009.12.040
[27] WEBB E K, PEARMAN G I, LEUNING R. Correction of flux measurements for density effects due to heat and water vapour transfer[J]. Quarterly Journal of the Royal Meteorological Society, 2010, 106: 85-100. https://academic.oup.com/jpe
[28] PATTEY E, STRACHAN I B, DESJARDINS R L, et al. Measuring nighttime CO2 flux over terrestrial ecosystems using eddy covariance and nocturnal boundary layer methods[J]. Agricultural and Forest Meteorology, 2002, 113(1-4): 145-158. doi: 10.1016/S0168-1923(02)00106-5
[29] 朱治林, 孙晓敏, 袁国富, 等.中国通量网(ChinaFLUX)夜间CO2涡度相关通量数据处理方法研究[J].中国科学(D辑地球科学), 2006, (增刊1): 34-44. http://www.cnki.com.cn/Article/CJFDTOTAL-JDXK2006S1003.htm ZHU Z L, SUN X M, YUAN G F, et al. Analysis the CO2 eddy covariance flux data at night in China's flux network (China FLUX)[J]. Science in China (Ser.D Earth Sciences), 2006, (Suppl.1): 34-44. http://www.cnki.com.cn/Article/CJFDTOTAL-JDXK2006S1003.htm
[30] NOILHAN J, PLANTON S. A simple parameterization of land surface for meteorological models[J]. Monthly Weather Review, 1989, 117(3): 536-549. doi: 10.1175/1520-0493(1989)117 < 0536:ASPOLS > 2.0.CO; 2
[31] VERMA S B, BALDOCCHI D D, ANDERSON D E, et al. Eddy fluxes of CO2, water vapor, and sensible heat over a deciduous forest[J]. Boundary-Layer Meteorology, 1986, 36(1): 71-91. doi: 10.1007-BF00117459/
[32] SHUTTLEWORTH W J, WALLACE J S. Evaporation from sparse crops-an energy combination theory[J]. Quarterly Journal of the Royal Meteorological Society, 2007, 111: 839-855. doi: 10.1002/qj.49711146910
[33] STANNARD D I. Comparison of Penman-Monteith, Shuttle-Wallace, and modified Priestley-Taylor evapotranspiration model for wildland vegetation in semiarid rangeland[J]. Water Resources Research, 1993, 29(5): 1379-1392. doi: 10.1029/93WR00333
[34] DOUGLAS E M, JACOBS J M, SUMNER D M, et al. A comparison of models for estimating potential evapotranspiration for Florida land cover types[J]. Journal of Hydrology, 2009, 373(3): 366-376. http://www.wanfangdata.com.cn/details/detail.do?_type=perio&id=9446a6b2dbcff13227667ef51caceccd
[35] FARAHANI H J, AHUJA L R. Evapotranspiration of partial canopy/residue-covered fields[J]. Transactions of the Asae, 1996, 39(6): 2051-2064. doi: 10.13031/2013.27708
[36] 郭映.应用Shuttleworth-Wallace双源模型对玉米蒸散的研究[D].兰州: 兰州大学, 2015. http://cdmd.cnki.com.cn/Article/CDMD-10730-1015354997.htm GUO Y. Estimation of actual evapotranspiration of maize field using Shuttleworth-Wallace model[D]. Lanzhou: Lanzhou University, 2015. http://cdmd.cnki.com.cn/Article/CDMD-10730-1015354997.htm
[37] 贾红, 胡继超, 张佳宝, 等.应用Shuttleworth-Wallace模型对夏玉米农田蒸散的估计[J].灌溉排水学报, 2008, 27(4): 77-80. http://d.old.wanfangdata.com.cn/Periodical/ggps200804022 JIA H, HU J C, ZHANG J B, et al. Estimation of evapotranspiration during the maize growing season using the Shuttleworth-Wallace model[J]. Journal of Irrigation and Drainage, 2008, 27(4): 77-80. http://d.old.wanfangdata.com.cn/Periodical/ggps200804022
[38] FISHER J B, DEBIASE T A, QI Y, et al. Evapotranspiration models compared on a Sierra Nevada forest ecosystem[J]. Environmental Modelling & Software, 2005, 20(6): 783-796. http://www.wanfangdata.com.cn/details/detail.do?_type=perio&id=b8e68a2c77caef4e5deadde93d2b850f
[39] BARTON I J. A parameterization of the evaporation from no saturated surfaces[J]. Journal of Applied Meteorology, 2010, 18(1): 43-47. http://agris.fao.org/agris-search/search.do?recordID=US19810590936
[40] AMATYA D M, HARRISON C A. Grass and forest potential evapotranspiration comparison using five methods in the atlantic coastal plain[J]. Journal of Hydrologic Engineering, 2016, 21(5): 1-13. http://www.wanfangdata.com.cn/details/detail.do?_type=perio&id=5bf97f6b8b8f65f2d40b5137d4fdd948
[41] 程根伟, 余新晓, 赵玉涛, 等.贡嘎山亚高山森林带蒸散特征模拟研究[J].北京林业大学学报, 2003, 25(1): 23-27. doi: 10.3321/j.issn:1000-1522.2003.01.006 CHENG G W, YU X X, ZHAO Y T, et al. Evapotranspiration simulation of subalpine forest area in Gongga Mountain[J]. Journal of Beijing Forestry University, 2003, 25(1): 23-27. doi: 10.3321/j.issn:1000-1522.2003.01.006
[42] 李璐, 李俊, 同小娟, 等.不同冠层阻力公式在玉米田蒸散模拟中的应用[J].中国生态农业学报, 2015, 23(8): 1026-1034. http://d.old.wanfangdata.com.cn/Periodical/stnyyj201508013 LI L, LI J, TONG X J, et al. Application of different canopy resistance models in summer maize evapotranspiration simulation[J]. Chinese Journal of Eco-Agriculture, 2015, 23(8): 1026-1034. http://d.old.wanfangdata.com.cn/Periodical/stnyyj201508013


 下载:
下载:


