
Dynamics and simulation of leaf area index for Artemisia ordosica community in the Mu Us Desert of northwestern China
-
摘要:目的本研究以毛乌素沙地灌木油蒿群落为研究对象,研究如何快速、准确、连续地获取油蒿群落LAI,获取长期连续的LAI数据对研究生态系统过程与环境变化间的相互关系具有重要意义。方法本文采用原位连续监测和野外试验的方法,于2013和2014年每年4—10月使用LAI-2000冠层分析仪定期测定油蒿群落LAI,同时利用太阳辐射传感器和光量子传感器测得的辐射数据计算地面观测NDVI(NDVIground)并获取同期遥感MODIS NDVI(NDVIMODIS)。用LAI数据分析油蒿叶面积群落指数的季节动态,并与归一化积温、NDVIground和NDVIMODIS分别建立经验模型,得到最优油蒿群落LAI模拟模型。结果油蒿群落LAI在整个生长季内的变化与物候具有一致性,整体上随时间呈现单峰型变化趋势,4—8月末油蒿持续生长,LAI稳定增大,8月份达到峰值,2013年为1.09m2/m2,2014年为1.33m2/m2。9月初至9月中旬油蒿冠层结构趋于稳定,LAI变化较小;9月下旬油蒿叶片开始枯黄掉落,LAI迅速下降。经验证,利用NDVIground模拟荒漠地区油蒿群落LAI效果最优(R2=0.76, P < 0.01)。结论在荒漠地区简单测量NDVI并使用本文研究模型,可以快速、无破坏地获取长期连续可靠的LAI数据,研究结果对理解和预测荒漠生态系统对全球气候变化的响应具有重要意义。Abstract:ObjectiveOur objective here was to rapidly and accurately obtain long-term continuous LAI for Artemisia ordosica communities in the Mu Us Desert of northwestern China, which is of great importance for understanding the relationship between ecosystem processes and environmental changes.MethodWe measured LAI in a typical A. ordosica community using the LAI-2000 canopy analyzer (LI-COR, USA) from April to October in the growing season of 2013 and 2014, and obtained MODIS NDVI (NDVIMODIS) data for the same periods. Ground-based NDVI (NDVIground) was calculated from incident and reflected solar radiation and photosynthetically active radiation, which were measured by radiation sensors mounted on a tower in the center of the community. LAI measurements were used to examine seasonal changes and construct LAI models. Normalized effective accumulated temperature, NDVIground and NDVIMODIS were used to construct optimal LAI model for the community.ResultThe seasonal dynamics was consistent with the phenophases of A. ordosica and showed a hump-shaped pattern. LAI increased from April to late August, reached a peak in August (1.09 and 1.33m2/m2 in 2013 and 2014, respectively), remained relatively stable from early September to mid-September, and rapidly declined from late September due to the defoliation of A. ordosica. The optimal LAI model was NDVIground (R2=0.76, P < 0.01).ConclusionOur results indicate that long-term continuous LAI estimates for A. ordosica communities in the Mu Us Desert can be easily obtained using NDVI measurements and the model. The model can be used to understand and predict ecological impacts of climate change.
-
Keywords:
- Artemisia ordosica /
- leaf area index /
- accumulated temperature /
- NDVI
-
光能利用效率(LUE)是指植被通过光合作用将吸收的单位光合有效辐射转换成干物质的效率[1-2]。它不仅是植物光合作用的重要生态学概念,也是利用遥感参数模型在区域尺度监测植被生产力的关键参数。光能利用率的变化能够对植被有机物的积累过程产生直接影响。光能资源与水肥等资源相比,具有无限制性、瞬时性、不可存储性等特点,因此,在一定时空范围内,植被对光能的截获吸收和利用能力的高低直接决定了生态系统的生产潜力[2]。当前,LUE广泛应用于不同尺度陆地生态系统总初级生产力(GPP)或净初级生产力(NPP)模型估算,和全球碳循环的研究中[3-6]。一些模型的比较研究表明,基于LUE的遥感模型模拟的全球净初级生产力(NPP)的平均值与其他参考模型的平均值有很大差异[7]。模型模拟结果的不确定性主要来自植被光合作用吸收的光合有效辐射和LUE[7]两个方面。此外,由于参数本身的观测和尺度变化带来的不确定性,以及模型的建立和运用范围的扩大,对结果的认识将有很大的不确定性。因此,了解LUE的生理生态基础,对于优化LUE模型和评价模型的可靠性具有重要的意义[8]。目前,对光能利用效率的研究大多集中在农田、草地和森林生态系统中[9-11],对荒漠生态系统LUE的变化特征以及影响因子的调节机理的认识非常有限[9]。因此,不同的时间尺度上环境因子对荒漠生态系统光能利用率的作用强度还需要根据实际的观测数据进一步研究探索。
已有学者研究了不同尺度(叶片、个体、种群)碳循环过程的时间动态及其调控机理,其中LUE作为量化辐射能在群落尺度上的行为参数,已受到广泛关注。研究表明在生长季保证养分充足且没有水分胁迫的条件下,LUE是一个常数[12],同时也有研究证明LUE随着植被生长发育而改变[4,9],不同植被类型的光能利用效率具有明显的时空差异[5,9]。不同时间尺度上,影响LUE的主要环境因子也有差异在不同时间尺度上其环境影响因子也变现的各不相同。在昼夜尺度上,LUE主要受到辐射、温度等[13-14]影响;季节时间尺度上,LUE主要受到LAI、温度、养分元素等[15-16]影响。
由于观测尺度的不同,光能利用效率的计算方法也各不相同。包括叶片尺度上常采用叶片光合作用仪观测法[17-18],群落尺度上常采用生物量收获发和涡度协方差方法[3],生态系统尺度上采用遥感观测法和模型反演法等[5,19]。叶片观测法一般用于控制实验,用于探究植物叶片光合作用光响应的机理过程,LUE用表观量子速率表示。生物量收获法破坏性大且耗费大量的人力物力,一般多用于农作物的研究,其缺点是不能反应短时期(小时或者日尺度)LUE的变化。遥感观测法和模型反演多用于长时间序列的大尺度研究。涡度协方差方法被许多科研工作者用来直接测量大面积生态系统物质和能量通量,而不扰动下垫面。同时,也为研究区域生态系统尺度的光合特征参数提供了途径,为估算GPP提供了一种方法,为提高区域尺度光能利用效率的准确度提供参考。涡度协方差法在时空尺度上可以与卫星遥感尺度转换相关联,使得从冠层尺度到景观水平估算LUE成为可能。
油蒿(Artemisia ordosica)广泛分布于中国西北干旱与半干旱地区,是荒漠灌木生态系统的建群种。现已有大量关于油蒿的光合作用和灌木生态系统碳水耦合的研究[20-21],但是关于油蒿灌木荒漠LUE的季节动态变化及其对环境因子响应的研究相对较少。本文运用涡度协方差方法对宁夏盐池毛乌素沙地油蒿灌木荒漠进行了全年的连续性监测,结合同步观测的气象因子,分析油蒿灌木荒漠光能利用效率在日尺度和季节尺度的变化特征及其对环境因子的响应,了解油蒿灌木荒漠光能资源利用机理,为荒漠生态系统的永续管理和沙区植被恢复提供科学参考依据。
1. 研究区概况
该研究区于宁夏盐池毛乌素沙地生态系统国家定位观测研究站(37°42′31″ N、107°13′47″ E,海拔1 560 m)。位于毛乌素沙地南缘,是黄土高原向鄂尔多斯台地、半干旱区向干旱区、干草原区向荒漠草原区、农区向牧区过渡的重要生态交错带,属于典型中温带大陆性季风气候[22-23]。多年平均空气温度8.1 ℃(1954—2004年),全年无霜期165 d。年均降雨量287 mm,其中62%集中在7—10月之间[20],年平均潜在蒸发散为2 024 mm。该区主要由活动沙丘、半固定沙丘和固定沙丘组成。主要土壤类型为灰钙土,土壤有机质含量在0.5% ~ 0.8%之间,土壤pH值在7.5 ~ 8.5之间,在土壤层1 m深度范围内的土壤总氮含量为0.15 g/kg[21]。研究区主要植被为油蒿灌木。
2. 研究方法
2.1 CO2通量和微气象因子观测
涡度相关观测系统以高度为4.2 m的观测塔为载体,主要观测仪器包括三维超声风速仪(WindMasterTM Pro,Gill Instruments Ltd,Lymington,England)和CO2/H2O闭路红外气体分析仪(IGRA;model LI-7200,LI-COR Biosciences,Lincoln,NE,USA)。
微气象数据测量仪器均设立在4.2 m的通量塔上,辐射数据由净辐射仪(CNR-4,Kipp and Zonen,Delft,the Netherlands)测量,空气温度由空气温湿度传感器(HMP45C,Campbell Scientific Ltd,USA)测量。土壤温度由安装在通量观测塔周围的土壤温度传感器(Campbell-109,Campbell Scientific Ltd,USA)测量,土壤热通量由分布在通量塔周围的5块10 cm深的土壤热通量板(HFP01,Campbell Scientific Ltd,USA)测量,土壤体积含水量分别用10、30、70和120 cm深的土壤温湿度探头(ECH2O-5TE,Decagon Devices,USA)测量,降雨量由翻斗式雨量筒(TE525MM,Campbell Scientific Inc.,USA)测量。涡度协方差系统的数据和微气象数据用CR3000(Campbell Scientific Ltd,USA)数据采集器以10 Hz频率记录,并生成30 min的平均值。
2.2 LAI与养分元素的测定
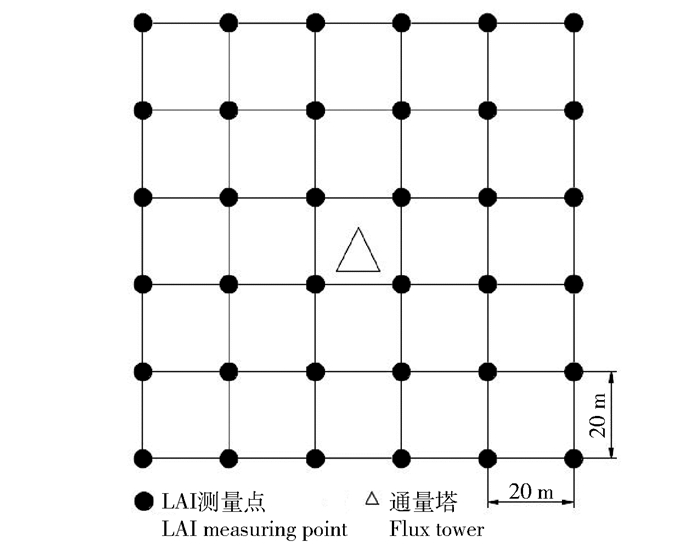
在通量塔贡献区内设置100 m × 100 m的样地,沿样地东西方向和南北方向每隔20 m设置1条样线,样地内共设置12条样线。每两条样线相交点为叶面积指数测量点,共36个点。2014年4—10月,用LAI-2000冠层分析仪每隔1周对油蒿灌木荒漠的LAI进行一次测定。样地叶面积指数计算公式为LAI = ΣLAIi/36,式中:i为第i个测量点[22]。
2014年4月,选取10个10 m × 10 m小样方,每个小样方分别选取油蒿5株,每隔一周从每株植物上取10片叶子,带回实验室,杀青并烘至恒量,将每株油蒿的取样叶子充分混合研磨,制成供试品。每隔15 d在小样方中用土钻取0 ~ 30 cm层土样,共3次重复,将每层土壤样品均匀混合并带回实验室。自然风干后,用2 mm筛过筛,制成土样进行试验。叶氮含量和土壤全氮含量均采用凯氏定氮法测定[23]。
2.3 数据处理
生态系统净碳交换(NEE)被定义为公式(1)[24]:
NEE=Fc+Fs+Vc (1) 式中:Fc是通量观测塔测得的植被上部CO2交换量,Fs是测得的冠层内部储存通量,Vc是指垂直和水平平流效应的通量。该研究区域有着均匀分布的植被下垫面,因此Vc可忽略不计。对于低矮的冠层Fs接近于0,因此Fs可忽略不计[20]。因此,
NEE=Fc (2) 本研究所用数据从2014年1月1日至2014年12月31日,期间由于仪器故障等造成36.12%数据缺失。通过剔除异常值[25]、旋转二次坐标轴[26]、消除传感器延时影响[27]、频率响应校正[28]等方法来对10 Hz数据进行了校正和质量控制。由于在夜间稳定条件下涡流不明显,导致计算出的NEE值低于夜间实际CO2通量值,因此夜间NEE(NEEnight)数据应通过摩擦风速(u*)控制和筛选,剔除掉u* < 0.18 m/s的数据[22]。经筛选后得到47.7%的有效数据,然后用5倍标准差方法剔除掉异常值。缺失数据按照时长进行插补:不足2 h的数据间隙一般采用线性插值,对于2 h ~ 7 d的数据间隔,使用邻近7 d相同时段的观测平均值,对于大于7 d的数据缺口,采用Michaelis-Menten(3)和Lloyd-Taylor方程(4)通过区分白天和晚上的NEE和Re进行插值[29-30],通过公式(5)计算出生态系统的NEP和GEP:
NEPnight=Re10Q10(Ts−10)/10 (3) NEEday=αPARAmax (4) {\rm{NEP}} = - {\rm{NEE}},\;{\rm{GEP}} = {\rm{NEP}} + {R_{\rm{e}}} (5) 式中:NEPnight为夜间生态系统净交换量,等于夜间生态系统的呼吸值Re(μmol/(m2·s)),Ts为10 cm 深的土壤温度(℃),Re10是Ts = 10 ℃时生态系统的呼吸值(μmol/(m2·s)),Q10是生态系统的呼吸敏感因子(μmol/(m2·s))。NEEday是白天生态系统净交换量(μmol/(m2·s)),α是表观量子效率(μmol/μmol),PAR是光合有效辐射,Amax是最大光合同化速率(μmol/(m2·s)),Rd是白天生态系统平均呼吸速率(μmol/(m2·s))。因为夜间测量出的NEE值就是生态系统夜间的呼吸值(自养呼吸和异养呼吸),因此通过公式(3)将Re与Q10的参数确定出来,根据白天的土壤温度计算出白天的生态系统呼吸值,考虑到植物的光合参数会受到物候和季节变化影响,因此在进行拟合和插补工作时应分别按月进行。gs运用彭曼公式计算得到:
g_{\rm{s}} = \frac{{\lambda E {\text{γ}} {g_{\rm{a}}}}}{{{\rm{\Delta }}\left( {{R_{\rm{n}}} - G} \right) - \lambda E\left( {{\rm{\Delta }} + {\text{γ}} } \right) + \rho {C_{\rm{p}}}{\rm{VPD}}{g_{\rm{a}}}}} (6) 式中:λ为汽化潜热(J/ kg);E为测量的ET值(kg/(m2· s));γ为干湿度常数(kPa/K,通常用0.066 5 kPa/℃表示);∆为饱和蒸气压差和温度之间的斜率关系(kPa/K);ga为空气动力学导度(mm/s);Cp为空气的比热容(J/(kg·K));ρ为干空气密度(kg/m3);VPD是大气饱和水汽压差(kPa);Rn是净辐射(W/m2);G是土壤热通量(W/m2)。
\frac{1}{{{g_a}}} = \frac{u}{{{u^{*2}}}} + 6.2{u^{* - 0.67}} (7) 式中:u为冠层风度;u*为测量风速。
归一化植被指数(NDVI)的计算公式[31]:
{\rm{NDVI}} = \frac{{{{{R}}_{{\rm{NIR}}}} - {R_{{\rm{VIS}}}}}}{{{R_{{\rm{NIR}}}} + {R_{{\rm{VIS}}}}}} (8) 式中:RNIR表示近红外辐射(700 ~ 3 000 nm),RVIS表示可见光辐射(380 ~ 780 nm),本文分别用太阳辐射和光合有效辐射表示RNIR和RVIS。NDVI选用了每天11:00—14:00的辐射数据计算而得[32]。
LUE的估算结果很大程度上取决于GEP和PAR间的线性或非线性(例如直角双曲线方程)关系[33-34]。目前广泛使用的光能利用效率是指太阳辐射利用400 ~ 700 nm波长(PAR,μmol/(m2·s))范围内的光合有效辐射和植物通过吸收光合有效辐射将光能转化成生物量的速率。目前LUE的估算方法很多,但是在生态系统尺度上LUE的定义为:
{\rm{LUE}} = \frac{{{\rm{GEP}}}}{{{\rm{APAR}}}} (9) 式中:GEP为总生态系统生产力(g/(m2·d)),APAR为吸收光合有效辐射(MJ/(m2·d)),本文用散射PAR(PARdif)来代替吸收光合有效辐射[35-37]。
为研究生长季内(5—10月)不同时期LUE的主要影响因子,本文分析了GEP和LUE与环境因子之间的相关性。数据统计与分析使用Matlab2014(Version 7.12.0.,The Math Works,Natick,MA,USA),作图使用OriginPro-2015完成。
3. 结果与分析
3.1 环境因子与LUE的日变化
环境因子与LUE的日变化特征如图1所示。生长季内每日平均Ta的变化范围为11.0 ~ 28.4 ℃,每日平均Ts变化范围为8 ~ 29 ℃,VPD变化范围为0.8 ~ 2.1 kPa。VPD和Ta的最低值出现在08:00,最高值出现在16:00;Ts出现明显滞后现象,最低值出现在上午10:00左右,最高值出现在下午18:00左右;gs有一个单峰,峰值稳定在14:00左右,昼夜平均变化范围为0 ~ 4.2 mm/s。PAR呈现出明显的单峰,其中峰值稳定在14:00左右。GEP呈现出单峰趋势,其中7、8月峰值在12:00左右稳定,其余月份的峰值在10:00—16:00之间稳定,中午11:00的时候达到每日最大值,总体变化趋势表现为7月 > 8月 > 6月 > 9月 > 10月 > 5月;LUE在06:00—14:00逐渐减小,14:00—19:00逐渐增大,在14:00的时候达到每日最低值(0.000 8 ~ 0.002 4 μmol/μmol),整体的变化趋势表现为9月 > 8月 > 7月 > 6月 > 5月 > 10月。
![]() 图 1 环境因子、GEP和LUE昼夜变化趋势Ta.空气温度;Ts.10 cm深土壤温度;VPD.饱和水汽压差;gs.气孔导度;PARtot.总入射光合有效辐射;PARdif.散射光合有效辐射;GEP.生态系统总生产力;LUE.光能利用效率。下同。Ta, air temperature; Ts, soil temperature of 10 cm depth; VPD, vapor pressure deficit; gs, stomatal conductance; PARtot, total incident photosynthetically active radiation; PARdif, diffuset photosynthetically active radiation; GEP, gross ecosystem productivity; LUE, light use efficiency. The same below.Figure 1. Mean diurnal variation in environmental factors and gross ecosystem production(GEP)and light use efficiency
图 1 环境因子、GEP和LUE昼夜变化趋势Ta.空气温度;Ts.10 cm深土壤温度;VPD.饱和水汽压差;gs.气孔导度;PARtot.总入射光合有效辐射;PARdif.散射光合有效辐射;GEP.生态系统总生产力;LUE.光能利用效率。下同。Ta, air temperature; Ts, soil temperature of 10 cm depth; VPD, vapor pressure deficit; gs, stomatal conductance; PARtot, total incident photosynthetically active radiation; PARdif, diffuset photosynthetically active radiation; GEP, gross ecosystem productivity; LUE, light use efficiency. The same below.Figure 1. Mean diurnal variation in environmental factors and gross ecosystem production(GEP)and light use efficiency3.2 环境因子与LUE的季节变化
图2为2014年生长季环境因子和生物因子的季节变化。油蒿灌木的日平均气温变化范围为3.4 ~ 27.6 ℃,日平均土壤温度变化范围为8.5 ~ 28.6 ℃。NDVI的变化范围为0.2 ~ 0.4。PAR从春季到夏季逐渐增加,随后降低,峰值出现在6月9日(56.6 mol/(m2·d))。年降雨总量341.9 mm,观测期降雨具有明显的季节变异,月累计降雨量9月(76.2 mm) > 7月(74.9 mm) > 8月(67.1 mm) > 6月(43.5 mm) > 10月(26.8 mm) > 5月(5.3 mm),在5月前的累计降雨量仅36.6 mm,降雨集中在7、8、9这3个月。VPD季节变化明显,在6月达到最大值,总体表现为夏季高、冬季低,变化范围为0.05 ~ 2.8 kPa。
![]() 图 2 环境和生物因子季节动态变化图NDVI. 归一化植被指数;LAI. 叶面积指数;leaf_N. 叶片N含量;soil_N. 土壤N含量;SWC10、SWC30、SWC70分别表示10、30、70 cm土壤含水量。下同。NDVI, normalized differential vegetation index; LAI, leaf area index. leaf_N, leaf N content; soil_N, soil N content. SWC10, SWC30, SWC70, represent 10, 30, 70 cm soil water content, respectively. The same below.Figure 2. Seasonal dynamics of environmental factors and biological factors
图 2 环境和生物因子季节动态变化图NDVI. 归一化植被指数;LAI. 叶面积指数;leaf_N. 叶片N含量;soil_N. 土壤N含量;SWC10、SWC30、SWC70分别表示10、30、70 cm土壤含水量。下同。NDVI, normalized differential vegetation index; LAI, leaf area index. leaf_N, leaf N content; soil_N, soil N content. SWC10, SWC30, SWC70, represent 10, 30, 70 cm soil water content, respectively. The same below.Figure 2. Seasonal dynamics of environmental factors and biological factorsGEP在7月达到最大值(图3),此时油蒿进入完全展叶期,叶面积指数达到最大,光合速率增加并达到最大,因此在7月生态系统总初级生产力达到最大值。PAR在5月达到最大值,此时油蒿处于展叶期,LAI迅速增大(图2)并随着生长季呈现递增的趋势,由于7月份以后PAR的下降速率比GEP的下降速率大,从而导致LUE在9月份达到最大值0.002 5 g/MJ,月平均LUE介于0.000 9 ~ 0.002 5 g/MJ之间,平均值为0.002 g/MJ(图3)。8月份的总生态系统生产力总值达到最大23.19 g/(m2·d)(图4),对应的LUE月总值在9月份达到最大值0.179 g/MJ,出现这种不对等增长趋势的原因主要是由于辐射的变化所导致的(图4)。
![]() 图 3 光合有效辐射、GEP和LUE季节动态变化图Figure 3. Seasonal dynamics of photosynthetically active radiation, gross ecosystem production (GEP) and light use efficiency (LUE)
图 3 光合有效辐射、GEP和LUE季节动态变化图Figure 3. Seasonal dynamics of photosynthetically active radiation, gross ecosystem production (GEP) and light use efficiency (LUE)![]() 图 4 GEP、LUE月变化Figure 4. Monthly sum dynamics of gross ecosystem production (GEP) and light use efficiency (LUE)
图 4 GEP、LUE月变化Figure 4. Monthly sum dynamics of gross ecosystem production (GEP) and light use efficiency (LUE)3.3 季节尺度上油蒿GEP和LUE对环境因子的响应
GEP与Ta、Ts和降雨量之间呈现出较好的正相关关系(图5),随着温度的增加,GEP呈现明显的递增趋势,降雨量的增加也会提高GEP的大小,SWC对GEP的变化有着72%的贡献率。随着Nsoil含量的增大,LUE表现出先减小后增大的趋势,在Nsoil达到0.24 g/kg时达到最低,Nsoil对LUE的变化有着90%的贡献率,LUE的变化还随着gs的增大呈现先减小后增大的趋势,gs对LUE的变化有着64%的贡献率,LUE的季节变化主要受到Nsoil和gs的影响。
![]() 图 5 环境因子对GEP与LUE的影响Figure 5. Relationship between light use efficiency and environmental factors at seasonal scale
图 5 环境因子对GEP与LUE的影响Figure 5. Relationship between light use efficiency and environmental factors at seasonal scale4. 讨 论
4.1 LUE的日变化以及对环境因子的响应
生长季(5—10月)LUE昼夜变化基本保持一致,呈现出先减小后增大的趋势,在14:00达到最小值,这与呼伦贝尔贝加针茅草甸草原生态系统中的光能利用效率的昼夜变化趋势基本一致[34]。LUE的昼夜变化一般受GEP和PAR昼夜变化的驱动,其中GEP的昼夜变化趋势为先增大后趋于稳定最后变小,而PAR的昼夜变化是先增大后减小的单峰趋势,并在14:00点时PAR达到最大值。光合作用是植物生长和物质积累的基础,其中光是光合作用的主导因子[38],午后高PAR常常限制植物光合作用,从而导致在昼夜尺度上LUE的变化与GEP的变化趋势正好相反。此外,夏季LUE的昼夜变化也受生态系统冠层导度(gs)的影响,夏季植物在中午时遭受高温、高辐射胁迫,此时gs达到最小,引起气孔关闭,空气阻力增加,光合作用受阻导致叶片光合速率降低[39-40],从而降低了生态系统LUE。
4.2 LUE的季节变化以及对环境因子的响应
研究区油蒿灌木荒漠光能利用效率动态随着环境变化和植被本身的生理特征的变化而变得复杂,但是LUE有着显著的季节动态特征。LUE的季节变化呈现出先增加后下降的单峰趋势,在9月份达到最大值0.002 5 g/MJ,10月份达到最低值0.000 9 g/MJ。这与内蒙古荒漠草原的光能利用效率的变化趋势一致,在8月份达到最大值0.355 g/MJ,同时最低值出现在4月份0.219 g/MJ[41]。卫亚星等[42]对青海省稀疏灌木的研究发现LUE介于0.026 ~ 0.049 g/MJ之间,最大值出现在7月份。由于7、8月份是植被的生长旺季,水热条件充足,植被覆盖率最大,此时植被的累积光物质质量也较多,吸收光合有效辐射量最大,LUE达到最大值。
植物冠层光合作用主要受冠层吸收的太阳辐射控制,植被叶片在截获入射太阳光合有效辐射进行光合作用时也具有光保护机制。植被在环境胁迫条件下(如极端高温、水分或养分亏缺、高光强等)通过降低光合作用效率[43]实现光保护过程。氮元素不仅参与植物光合作用而且是维持植物生长的重要元素,与生物圈的演替和发展紧密相关[37],Green等[15]证实了冠层总氮含量与光能利用效率之间存在显著正相关性。在低覆盖率的地表,降雨会增加土壤含水量,改变Ts,通过影响PAR[24,41]从而改变LUE的大小。VPD会通过影响植被叶片的伸展、改变叶片气孔导度从而改变光合速率来影响LUE的变化。在本研究区域内已经被证实VPD会通过影响该生态系统的碳交换过程[44],同时土壤水分的补给不足会限制半干旱草原和灌木生态系统的生产力[44-45],从而导致LUE降低。苏培玺等[46]对荒漠植物梭梭(Haloxylon ammodendron)和沙拐枣(Calligonum mongolicum)的光合作用过程研究发现,在水分条件好时光合速率明显增大,LUE明显提高。
朱文泉等[39]结合遥感数据、气象数据和实测NPP数据,系统的模拟了中国典型植被的最大光能利用效率LUEmax,得到中国灌木类型的最大光能利用效率为0.429 g/MJ。本文估算出的光能利用效率值远远低于前人的研究,可能与荒漠生态系统较小的生产力、较大的辐射值紧密相关。实际光能利用效率与环境条件的关系非常复杂,植被类型、地理位置、气候条件、植被营养状况(叶氮含量)和植被生长阶段都会影响光能利用效率的变化。
5. 结 论
本文通过研究油蒿灌木荒漠光能利用效率的昼夜和季节动态变化,明确了在不同时间尺度上LUE的主要影响因子。
(1) 在日尺度上,LUE呈现出先降低后增加的趋势,在14:00时达到最低值;LUE的日变化主要受gs和PAR的影响。
(2) 在季节尺度上,LUE呈现出先增加后降低的趋势,在9月份达到最大值,LUE的季节变化主要受土壤N含量和gs的影响。
研究还发现,LUE的大小主要取决于GEP与PAR的比值关系,在长时间尺度上通过增加土壤的养分元素,可以提高植被的光合生产能力,从而提高光能利用效率。此外,本研究主要集中在季节和生态系统尺度上,对于毛乌素沙地油蒿灌木荒漠的最大光能利用效率的定量研究还应结合卫星遥感数据与当地多年的地面实测数据相结合进行多时空多尺度的研究。
-
![]()
图 1 LAI测量样地及测量点布设
Figure 1. Deployment of LAI sampling quadrats and measurement points
![]()
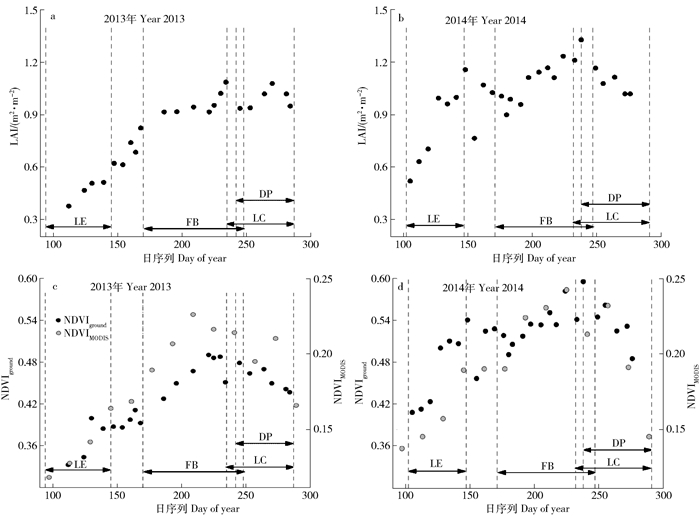
图 2 毛乌素沙地油蒿叶面积指数及归一化植被指数的季节动态
NDVIground.地面观测NDVI Ground-based NDVI; NDVIMODIS.遥感MODIS NDVI Remote sensing MODIS NDVI;LE.展叶期Leaf expansion stage; FB.开花结果期Flowering and bearing stage; LC.变色期Leaf coloration stage; DP.凋落期Defoliation stage
Figure 2. Seasonal variations of LAI and NDVI in Artemisia ordosica in Mu Us Desert
![]()
图 3 2013年使用不同方法建立的油蒿群落叶面积指数模拟模型
Figure 3. LAI simulation models of Artemisia ordosica community established by different methods in 2013
![]()
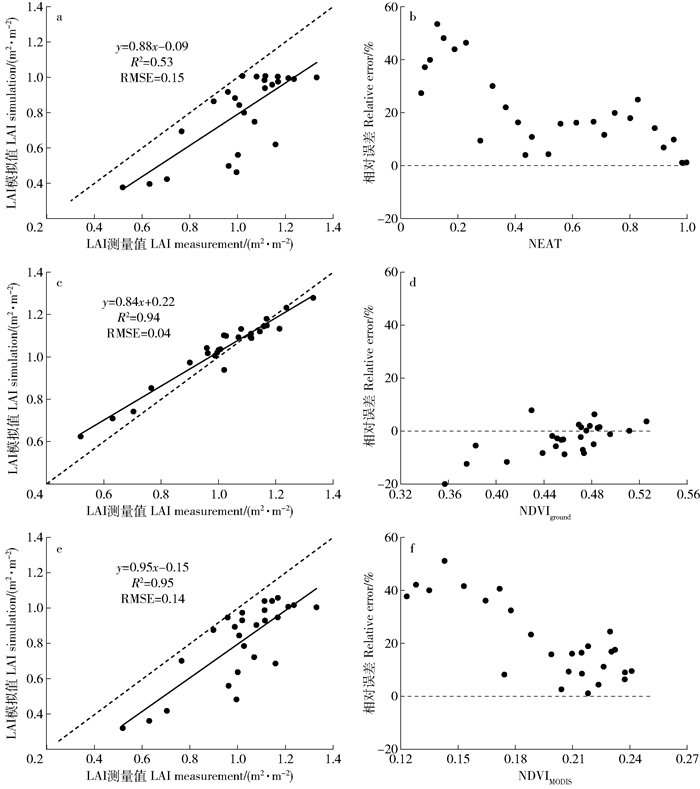
图 4 2014年不同方法油蒿群落叶面积指数模拟值与实测值的比较和相对误差
a、b为积温模拟法;c、d为地面观测NDVI模拟法;e、f为遥感反演法。
Figure 4. Comparison and relative error between simulated and measured LAI of Artemisia ordosica community in 2014
a and b, normalized effective accumulated temperature; c and d, ground-based NDVI; e and f, remote sensing retrieval.
表 1 2013和2014年油蒿群落物候期
Table 1 Phenophases of Artemisia ordosica community in 2013 and 2014
年份
Year展叶期
Leaf expansion period开花结果期
Flowering and bearing period变色期
Leaf coloration period凋落期
Defoliation period2013 94~145 170~248 235~287 242~287 2014 102~147 171~247 232~291 238~291 数据为一年中的第几天。Note: data is the ordinal date in a year.  下载: 导出CSV
表 2 不同方法模拟油蒿LAI的结果
Table 2 Simulated results of Artemisia ordosica LAI by different methods
模拟方法Simulation method 拟合方程Model expression R2 RMSE AIC 积温模拟法Simulation by NEAT LAI=0.63NEAT+0.47 0.83 0.09 -103.90 LAI=0.54exp(0.72NEAT) 0.77 0.10 -97.56 LAI=0.27ln(NEAT)+1.04 0.93 0.07 -123.77 LAI=1.07NEAT0.36 0.91 0.07 -118.80 LAI=1.01/(1+exp(0.97-6.03NEAT)) 0.95 0.05 -132.36 LAI=1.00/(1+exp(0.82-4.76NEAT-2.82NEAT2)) 0.95 0.05 -132.65 地面观测NDVI模拟法
Simulation by NDVIgroundLAI=4.32NDVIground-0.92 0.74 0.11 -90.07 LAI=0.10exp(5.10NDVIground) 0.69 0.12 -86.02 LAI=1.69ln(NDVIground)+2.37 0.76 0.11 -91.37 LAI=5.38NDVIground2.08 0.72 0.12 -88.03 遥感反演法
Simulation by remote sensing retrievalLAI=5.87NDVIMODIS-0.34 0.82 0.09 -103.05 LAI=0.20exp(7.07NDVIMODIS) 0.77 0.11 -97.35 LAI=1.10ln(NDVIMODIS)+2.62 0.84 0.09 -106.04 LAI=7.78NDVIMODIS1.39 0.81 0.10 -101.45 注:所有模型均通过0.01水平的显著性检验。Note: all models were examined by a significance test of 0.01 level.
下载: 导出CSV
表 3 不同植被基于NDVI的LAI估算模型
Table 3 LAI estimation models based on NDVI for different vegetation species
植被
Vegetation species模型方程
Model expressionR2 小麦Triticum aestivum LAI=exp(2.77-0.52/NDVI) 0.96 玉米Zea mays LAI=3.20NDVI+0.53 0.65 水稻Oryza sativa LAI=1.06NDVI+1.05 0.99 杨树Populus L. LAI=0.48exp(2.89NDVI) 0.51 草地Grassland LAI=1.42NDVI-0.09 0.62 LAI=0.13exp(NDVI/0.31) 0.59
下载: 导出CSV
-
[1] Chen J M, Black T A. Defining leaf area index for non-flat leaves[J]. Plant, Cell & Environment, 1992, 15(4):421-429. doi: 10.1111-j.1365-3040.1992.tb00992.x/
[2] 王龑, 田庆久, 王琦, 等.杨树林全生长期LAI遥感估算模型适用性[J].生态学报, 2016, 36(8):2210-2216. http://d.old.wanfangdata.com.cn/Periodical/stxb201608012 Wang Y, Tian Q J, Wang Q, et al. Study on the applicability of leaf area index estimation model in an aspen forest over a growth period[J]. Acta Ecologica Sinica, 2016, 36(8):2210-2216. http://d.old.wanfangdata.com.cn/Periodical/stxb201608012
[3] Bonan G B. Land-atmosphere interactions for climate system models:coupling biophysical, biogeochemical, and ecosystem dynamical processes[J]. Remote Sensing of Environment, 1995, 51(1):57-73. doi: 10.1016/0034-4257(94)00065-U
[4] Veroustraete F, Patyn J, Myneni R B. Estimating net ecosystem exchange of carbon using the normalized difference vegetation index and an ecosystem model[J]. Remote Sensing of Environment, 1996, 58(1):115-130. doi: 10.1016/0034-4257(95)00258-8
[5] 赵传燕, 沈卫华, 彭焕华.祁连山区青海云杉林冠层叶面积指数的反演方法[J].植物生态学报, 2009, 33(5):860-869. doi: 10.3773/j.issn.1005-264x.2009.05.004 Zhao C Y, Shen W H, Peng H H. Methods for determining canopy leaf area index of Picea crassifolia forest in Qilian Mountains, China[J]. Chinese Journal of Plant Ecology, 2009, 33(5):860-869. doi: 10.3773/j.issn.1005-264x.2009.05.004
[6] 曾小平, 赵平, 饶兴权, 等.鹤山丘陵3种人工林叶面积指数的测定及其季节变化[J].北京林业大学学报, 2008, 30(5):33-38. http://j.bjfu.edu.cn/article/id/8743 Zeng X P, Zhao P, Rao X Q, et al. Measurement of leaf area index of three plantations and their seasonal changes in Heshan hilly land[J]. Journal of Beijing Forestry University, 2008, 30(5):33-38. http://j.bjfu.edu.cn/article/id/8743
[7] Xiao Z Q, Liang S L, Jiang B. Evaluation of four long time-series global leaf area index products[J]. Agricultural and Forest Meteorology, 2017, 246:218-230. doi: 10.1016/j.agrformet.2017.06.016
[8] Ryu Y, Sonnentag O, Nilson T, et al. How to quantify tree leaf area index in an open savanna ecosystem:a multi-instrument and multi-model approach[J]. Agricultural and Forest Meteorology, 2010, 150(1):63-76. doi: 10.1016/j.agrformet.2009.08.007
[9] Bréda N J J. Ground-based measurements of leaf area index:a review of methods, instruments and current controversies[J]. Journal of Experimental Botany, 2003, 54(392):2403-2417. doi: 10.1093/jxb/erg263
[10] 刘志理, 金光泽.光学仪器法测定叶面积指数季节变化的误差分析[J].林业科学, 2016, 52(9):11-21. http://d.old.wanfangdata.com.cn/Periodical/lykx201609002 Liu Z L, Jin G Z. Bias analysis of seasonal changes of leaf area index derived from optical methods[J]. Scientia Silvae Sinicae, 2016, 52(9):11-21. http://d.old.wanfangdata.com.cn/Periodical/lykx201609002
[11] 温一博, 常颖, 范文义.基于MISR数据大兴安岭地区叶面积指数反演及尺度转换验证研究[J].北京林业大学学报, 2016, 38(5):1-10. doi: 10.13332/j.1000-1522.20150204 Wen Y B, Chang Y, Fan W Y. Algorithm for leaf area index inversion in the Great Xing' an Mountains using MISR data and spatial scaling for the validation[J]. Journal of Beijing Forestry University, 2016, 38(5):1-10. doi: 10.13332/j.1000-1522.20150204
[12] She W W, Zhang Y Q, Qin S G, et al. Habitat effect on allometry of a xeric shrub (Artemisia ordosica Krasch) in the Mu Us Desert of northern China[J]. Forests, 2015, 6(12):4529-4539. doi: 10.3390/f6124385
[13] 阎伟, 宗世祥, 骆有庆, 等.逐步回归模型在油蒿钻蛀性害虫预测中的应用[J].北京林业大学学报, 2009, 31 (3): 140-144. http://j.bjfu.edu.cn/article/id/8580 Yan W, Zong S X, Luo Y Q, et al. Application of stepwise regression model in predicting the movement of Artemisia ordosica boring insects[J]. Journal of Beijing Forestry University, 2009, 31(3): 140-144. http://j.bjfu.edu.cn/article/id/8580
[14] 张军, 黄永梅, 焦会景, 等.毛乌素沙地油蒿群落演替的生理生态学机制[J].中国沙漠, 2007, 27(6):977-983. http://www.wanfangdata.com.cn/details/detail.do?_type=perio&id=zgsm200706012 Zhang J, Huang Y M, Jiao H J, et al. Ecophysiological characteristics of Artemisia ordosica community succession in Mu Us Sandy grassland[J]. Journal of Desert Research, 2007, 27(6):977-983. http://www.wanfangdata.com.cn/details/detail.do?_type=perio&id=zgsm200706012
[15] 张德魁, 王继和, 马全林, 等.油蒿研究综述[J].草业科学, 2007, 24(8):30-35. doi: 10.3969/j.issn.1001-0629.2007.08.006 Zhang D K, Wang J H, Ma Q L, et al. Summary of Artemisia ordosica studies[J]. Pratacultural Science, 2007, 24(8):30-35. doi: 10.3969/j.issn.1001-0629.2007.08.006
[16] 张军红, 吴波, 雷雅凯, 等.毛乌素沙地油蒿植株形态与结构特征分析[J].西南林业大学学报, 2011, 31(5):6-9. doi: 10.3969/j.issn.2095-1914.2011.05.002 Zhang J H, Wu B, Lei Y K, et al. Analysis of Artemisia ordosica plant morphology and structure characteristics in Mu Us Sandland[J]. Journal of Southwest Forestry University, 2011, 31(5):6-9. doi: 10.3969/j.issn.2095-1914.2011.05.002
[17] Xie J, Zha T S, Jia X, et al. Irregular precipitation events in control of seasonal variations in CO2 exchange in a cold desert-shrub ecosystem in northwest China[J]. Journal of Arid Environments, 2015, 120:33-41. doi: 10.1016/j.jaridenv.2015.04.009
[18] 唐思凌, 贾昕, 郭建斌, 等.沙蒿(Artemisia ordosica)叶面积指数的测定及模拟[J].生态学杂志, 2014, 33(2):547-554. http://d.old.wanfangdata.com.cn/Periodical/stxzz201402040 Tang S L, Jia X, Guo J B, et al. Measuring and modeling leaf area index for Artemisia ordosica[J]. Chinese Journal of Ecology, 2014, 33(2):547-554. http://d.old.wanfangdata.com.cn/Periodical/stxzz201402040
[19] 孔德胤, 杨松, 黄淑琴, 等.河套地区玉米叶面积指数的动态模拟[J].中国农业气象, 2014, 35(3): 281-286. doi: 10.3969/j.issn.1000-6362.2014.03.007 Kong D Y, Yang S, Huang S Q, et al. Dynamic simulation of maize leaf area index in Hetao region[J]. Chinese Journal of Agrometeorology, 2014, 35(3):281-286. doi: 10.3969/j.issn.1000-6362.2014.03.007
[20] Huemmrich K F, Black T A, Jarvis P G, et al. High temporal resolution NDVI phenology from micrometeorological radiation sensors[J/OL]. Journal of Geophysical Research:Atmospheres, 1999, 104(D22):27935-27944[2017-06-13]. http://onlinelibrary.wiley.com/doi/10.1029/1999JD900164/citedby.
[21] Wilson T B, Meyers T P. Determining vegetation indices from solar and photosynthetically active radiation fluxes[J]. Agricultural and Forest Meteorology, 2007, 144(3):160-179. http://d.old.wanfangdata.com.cn/NSTLQK/NSTL_QKJJ021944193/
[22] 杜占池, 杨宗贵, 崔骁勇.内蒙古典型草原地区5类植物群落叶面积指数的比较研究[J].中国草地学报, 2001, 23(5):13-18. http://d.old.wanfangdata.com.cn/Periodical/zgcd200105003 Du Z C, Yang Z G, Cui X Y. A comparative study on leaf area index of five plant communities in typical steppe region of Inner Mongolia[J]. Chinese Journal of Grassland, 2001, 23(5):13-18. http://d.old.wanfangdata.com.cn/Periodical/zgcd200105003
[23] Huang L, Zhang Z S, Li X R. Sap flow of Artemisia ordosica and the influence of environmental factors in a revegetated desert area:Tengger Desert, China[J]. Hydrological Processes, 2010, 24(10):1248-1253. https://www.researchgate.net/publication/229927469_Sap_flow_of_Artemisia_ordosica_and_the_influence_of_environmental_factors_in_a_revegetated_desert_area_Tengger_Desert_China
[24] Xiao B, Hu K L. Moss-dominated biocrusts decrease soil moisture and result in the degradation of artificially planted shrubs under semiarid climate[J]. Geoderma, 2017, 291:47-54. doi: 10.1016/j.geoderma.2017.01.009
[25] Asner G P, Scurlock J M O, Hicke J A. Global synthesis of leaf area index observations:implications for ecological and remote sensing studies[J]. Global Ecology and Biogeography, 2003, 12(3):191-205. doi: 10.1046/j.1466-822X.2003.00026.x
[26] 邵璞, 曾晓东. CLM3.0-DGVM中植物叶面积指数与气候因子的时空关系[J].生态学报, 2011, 31(16):4725-4731. http://d.old.wanfangdata.com.cn/Periodical/gyqx200803001 Shao P, Zeng X D. Spationtemporal relationship of leaf area index simulated by CLM3.0-DGVM and climatic factors[J]. Acta Ecologica Sinica, 2011, 31(16):4725-4731. http://d.old.wanfangdata.com.cn/Periodical/gyqx200803001
[27] 麻雪艳, 周广胜.春玉米最大叶面积指数的确定方法及其应用[J].生态学报, 2013, 33(8):2596-2603. http://d.old.wanfangdata.com.cn/Periodical/stxb201308031 Ma X Y, Zhou G S. Method of determining the maximum leaf area index of spring maize and its application[J]. Acta Ecologica Sinica, 2013, 33(8):2596-2603. http://d.old.wanfangdata.com.cn/Periodical/stxb201308031
[28] Wang Q, Adiku S, Tenhunen J, et al. On the relationship of NDVI with leaf area index in a deciduous forest site[J]. Remote Sensing of Environment, 2005, 94(2):244-255. doi: 10.1016/j.rse.2004.10.006
[29] Bertram A, Clasen A, Kleinschmit B, et al. Estimation of the seasonal leaf area index in an alluvial forest using high-resolution satellite-based vegetation indices[J/OL]. Remote Sensing of Environment, 2014, 141:52-63[2017-06-21]. http://www.sciencedirect.com/science/article/pii/S0034425713003866.
[30] Street L E, Shaver G R, Williams M, et al. What is the relationship between changes in canopy leaf area and changes in photosynthetic CO2 flux in arctic ecosystems?[J]. Journal of Ecology, 2007, 95(1):139-150. doi: 10.1111/jec.2007.95.issue-1
[31] Maire G L, François C, Soudani K, et al. Forest leaf area index determination:a multiyear satellite-independent method based on within-stand normalized difference vegetation index spatial variability[J]. Journal of Geophysical Research:Biogeosciences, 2006, 111(G2): 1967-1970. http://cn.bing.com/academic/profile?id=f8035fbb83829f900cae2b5bb00b54d9&encoded=0&v=paper_preview&mkt=zh-cn
[32] Schleppi P, Thimonier A, Walthert L. Estimating leaf area index of mature temperate forests using regressions on site and vegetation data[J]. Forest Ecology and Management, 2011, 261(3):601-610. doi: 10.1016/j.foreco.2010.11.013
[33] 张学艺, 李剑萍, 官景得, 等.两种叶面积指数动态模拟方法的对比研究[J].国土资源遥感, 2011, 23(3):43-47. http://d.old.wanfangdata.com.cn/Periodical/gtzyyg201103008 Zhang X Y, Li J P, Guan J D, et al. A comparative study of two dynamic simulated methods for spring wheat leaf area index in Ningxia irrigation area[J]. Remote Sensing for Land & Resources, 2011, 23(3):43-47. http://d.old.wanfangdata.com.cn/Periodical/gtzyyg201103008
[34] 刘珺, 庞鑫, 杜灵通.夏玉米叶面积指数遥感反演研究[J].农业机械学报, 2016, 47(9):309-317. http://d.old.wanfangdata.com.cn/Periodical/nyjxxb201609042 Liu J, Pang X, Du L T. Study on leaf area index inversion of summer maize using remote sensing[J]. Transaction of the Chinese Society for Agricultural Machinery, 2016, 47(9):309-317. http://d.old.wanfangdata.com.cn/Periodical/nyjxxb201609042
[35] 彭虓, 张树文.基于NDVI与LAI的水稻生长状况研究[J].东北测绘, 2002, 25(4):16-19. doi: 10.3969/j.issn.1672-5867.2002.04.010 Peng X, Zhang S W. Research on rice growth status based on NDVI and LAI[J]. Northeast Surveying and Mapping, 2002, 25(4):16-19. doi: 10.3969/j.issn.1672-5867.2002.04.010
[36] Fan L, Gao Y, Brück H, et al. Investigating the relationship between NDVI and LAI in semi-arid grassland in Inner Mongolia using in-situ measurements[J]. Theoretical and Applied Climatology, 2009, 95(1-2):151-156. doi: 10.1007/s00704-007-0369-2
[37] López-Serrano F R, García-Morote A, Andrés-Abellán M, et al. Site and weather effects in allometries:a simple approach to climate change effect on pines[J]. Forest Ecology and Management, 2005, 215(1-3):251-270. doi: 10.1016/j.foreco.2005.05.014
[38] Wang X P, Fang J Y, Tang Z Y, et al. Climatic control of primary forest structure and DBH-height allometry in Northeast China[J]. Forest Ecology and Management, 2006, 234(1):264-274. doi: 10.1016-j.foreco.2006.07.007/
[39] Maestre F T, Salguerogómez R, Quero J L. It is getting hotter in here:determining and projecting the impacts of global environmental change on drylands[J]. Philosophical Transactions of the Royal Society of London, 2012, 367:3062-3075. doi: 10.1098/rstb.2011.0323


计量
- 文章访问数: 2623
- HTML全文浏览量: 505
- PDF下载量: 62
