
A comparative analysis on hyperspectral land-cover classification based on frequency spectrum and spectral characteristics
-
摘要:目的频谱作为物质的能量特征进行地物的识别是可行的。本文针对国内外利用频谱进行地物分类尤其是森林植被分类研究的匮乏,探索频谱的地物识别潜力,将高光谱影像的光谱曲线转化为频谱进行地物识别研究。方法以福建将乐林场为研究区,利用国产环境小卫星高光谱影像(HJ-1A HSI)和同时成像的多光谱影像(CCD),通过能量分离变换的方法对高光谱和多光谱进行融合,获取高空间分辨率的高光谱影像;然后,将融合影像的光谱曲线转化到频率域,进而获取频谱;通过“频谱距离”对研究区进行地物分类,并将分类结果与光谱角填图(SAM)分类结果进行比较。结果在频域中植被类别和非植被类别的低阶幅度谱具有明显的可分性,频谱方法提高了马尾松、杉木和阔叶林的制图精度,对于光谱特征相似的不同森林植被具有更好的区分能力;非植被类别在1阶谐波的频谱容易区分, 植被类别需要用前7次谐波的幅度谱进行区分,随着频率的增大,频谱变化趋于相似,并且非植被类别在频域的能量累计速度高于植被类别;与SAM的分类结果比较发现,基于频谱的分类方法总体分类精度为84.19%,比SAM分类结果总体精度提高0.7%。结论利用频谱信息可以降低光谱曲线上噪声的影响,保留类别的重要区别信息,提高地类的分类精度,因此利用频域中的频谱进行地类识别具有可行性。Abstract:ObjectiveFrequency spectrum as an energy feature of matter can be used to differentiate ground object recognition. However, the study for classification by frequency spectrum is scanty at home and abroad, especially for forest vegetation classification research. This study explored the potential of frequency spectrum in identifying the objects by converting optical spectrum of image into frequency spectrum.MethodFor exploring frequency spectrum in land-cover classification, the optical spectrum was converted to frequency spectrum to classify based on the fused hyperspectral images from domestic HJ-1A HSI and CCD data by CN Spectral Sharpening in farmland of Jiangle County, Sanming City of Fujian Province, southern China. Then the distance was developed to differentiate the objects based on the obtained frequency spectrum. The classification result based on frequency spectrum was compared with spectral angle mapping (SAM) based on spectrum space.ResultThe study result showed that the separability was clear among frequency spectrum of different ground objects. The frequency spectrum of the vegetation was significantly different with frequency spectrum of non-vegetation classed, and the spectrum of different tree species can also be differentiated in the low frequency region. The precisions for Pinus massoniana, Cunninghamia lanceolata and broadleaved forest were improved based on the FSSM method. The non-vegetation classes can be distinguished using frequency spectrum of first order harmonic. The vegetation classes can be distinguished using frequency spectrum from one to seven harmonic. However, the frequency spectrum for all objects tends to be similar with the increase of frequency. And the energy accumulated speed was faster for non-vegetation classes. Compared with SAM result, the overall classification precision from frequency spectrum method increased by 0.7%, which was 84.19%.ConclusionThe comparison results from frequency spectrum of different land types and classification results indicated that the frequency spectrum can be efficiently applied to identify objects. This method can reduce the influence of the noise from spectrum curve and keep the important distinction information between the classes. So, the frequency spectrum can be used for object identification.
-
-
![]()
图 1 研究区位置和外业调查点分布图
Figure 1. Location of the study area and points of field investigation
![]()
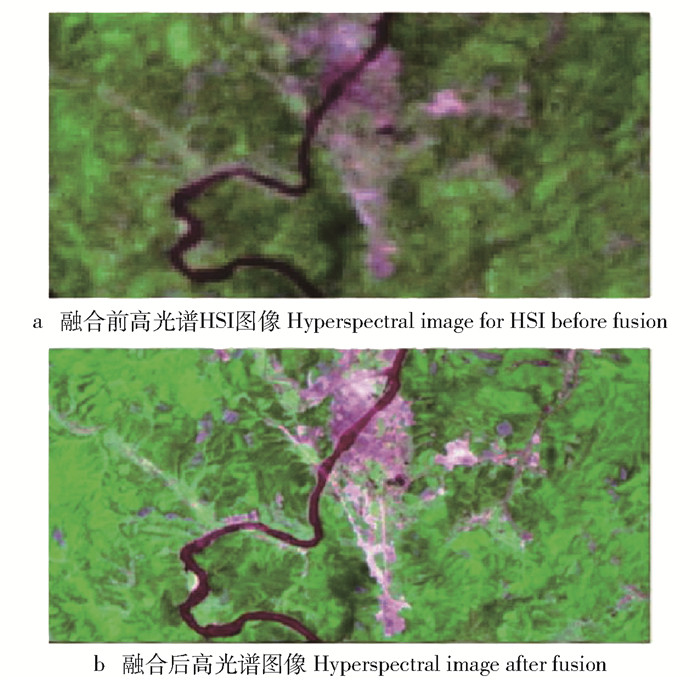
图 2 HSI高光谱和CCD图像通过能量分离变换前后假彩色图像的对比图(波段41、100和68)
Figure 2. Comparison between HSI image and fusion image based on CN spectral sharpening (band 41, 100 and 68)
![]()
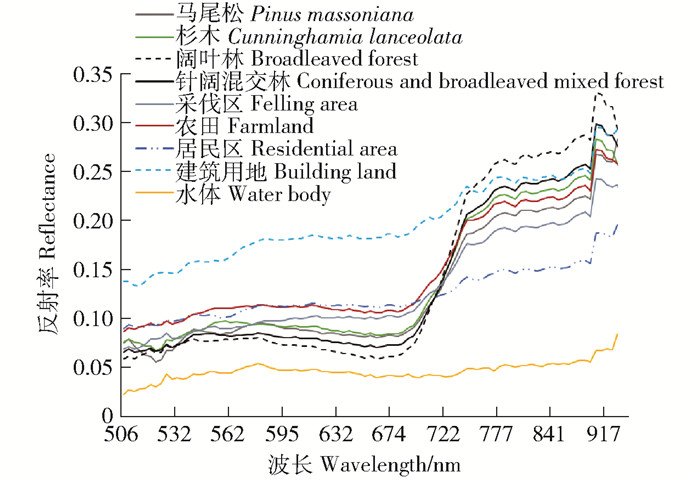
图 3 9种地物类型参考光谱曲线
Figure 3. Reference spectra curves of nine ground objects in study area
![]()
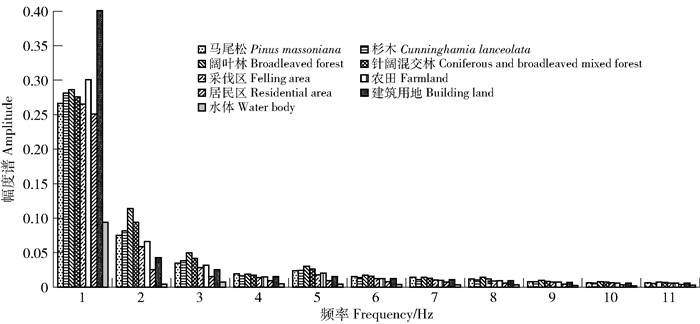
图 4 9种地物类型参考光谱曲线的频谱分布
Figure 4. Distribution of frequency spectrum of reference spectra curves of nine ground objects in study area
![]()
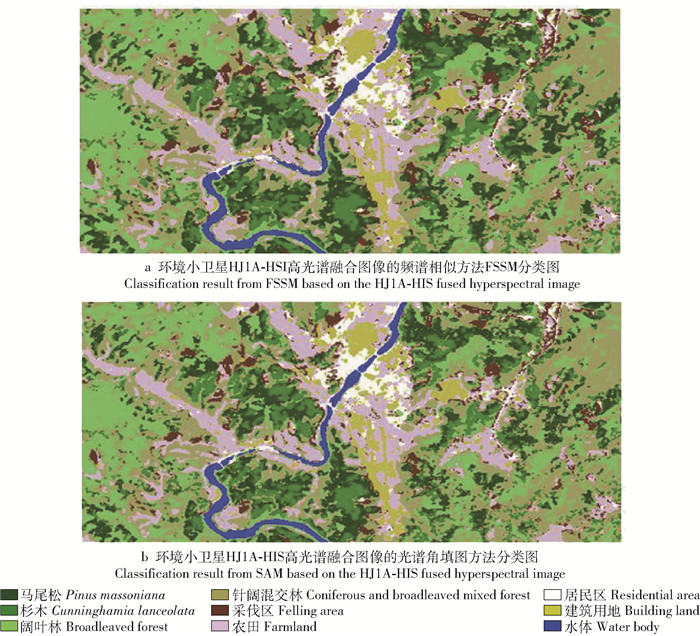
图 5 研究区HSI高光谱融合影像的FSSM和SAM分类结果图
Figure 5. Comparison of FSSM and SAM classification results of HSI hyperspectral fusion image in the study area
表 1 频谱能量累计大于99%的频率位置和相应值
Table 1 Frequency positions and corresponding energy values of frequency spectrum with contribution of >99% of cumulative energy
类别Class 能量分布Energy distribution 频率位置Frequency location 马尾松Pinus massoniana 0.991 303 7 杉木Cunninghamia lanceolata 0.991 191 6 阔叶林Broadleaved forest 0.991 401 7 针阔混交林Coniferous and broadleaved mixed forest 0.990 910 6 采伐区Felling area 0.991 289 5 农田Farmland 0.992 764 5 居民区Residential area 0.992 986 3 建筑用地Building land 0.993 080 3 水体Water body 0.990 448 5  下载: 导出CSV
表 2 HSI高光谱融合图像的SAM和FSSM分类误差矩阵
Table 2 Error matrix from SAM and FSSM based on the HJ1A-HSI fused hyperspectral image
类别Class SAM FSSM 生产者精度Producer accuracy(PA)/% 使用者精度User accuracy(UA)/% 生产者精度Producer accuracy(PA)/% 使用者精度User accuracy(UA)/% 马尾松Pinus massoniana 83.5 81.1 85.4 81.5 杉木Cunninghamia lanceolata 61.5 81.6 63.1 82.0 阔叶林Broadleaved forest 82.7 78.2 86.5 75.0 针阔混交林Coniferous and broadleaved mixed forest 78.6 65.7 75.0 71.2 采伐区Felling area 93.6 100.0 93.6 100.0 农田Farmland 100.0 91.1 95.0 91.1 居民区Residential area 91.7 81.5 95.7 91.7 建筑用地Building land 82.5 93.3 87.5 93.3 水体Water body 92.6 100.0 92.6 100.0 整体分类精度Overall classification accuracy 83.49% 84.19% 整体Kappa系数Overall Kappa coefficient 0.807 8 0.815 8
下载: 导出CSV
-
[1] 王珂, 顾行发, 余涛, 等.基于频谱相似性的高光谱遥感图像分类方法[J].中国科学(技术科学), 2013, 43(4): 407-416. http://www.wanfangdata.com.cn/details/detail.do?_type=perio&id=zgkx-ce201304008 Wang K, Gu X F, Yu T, et al. Classification of hyperspectral remote sensing images using frequency spectrum similarity[J]. Scientia Sinica (Technologica), 2013, 43(4): 407-416. http://www.wanfangdata.com.cn/details/detail.do?_type=perio&id=zgkx-ce201304008
[2] Thenkabail P S, Enclona E A, Ashton M S, et al. Hyperion, IKONOS, ALI, and ETM+ sensors in the study of African rainforests[J]. Remote Sensing of Environment, 2004, 90(1): 23-43. doi: 10.1016/j.rse.2003.11.018
[3] 李娜, 李咏洁, 赵慧洁, 等.基于光谱与空间特征结合的改进高光谱数据分类算法[J].光谱学与光谱分析, 2014, 34(2): 526-531. doi: 10.3964/j.issn.1000-0593(2014)02-0526-06 Li N, Li Y J, Zhao H J, et al. An improved classification approach based on spatial and spectral features for hyperspectral data[J]. Spectroscopy and Spectral Analysis, 2014, 34(2): 526-531. doi: 10.3964/j.issn.1000-0593(2014)02-0526-06
[4] 张帆, 杜博, 张良培, 等.一种结合波段分组特征和形态学特征的高光谱图像分类方法[J].计算机科学, 2014, 41(12): 275-279. doi: 10.11896/j.issn.1002-137X.2014.12.059 Zhang F, Du B, Zhang L P, et al. Band grouping based hyperspectral image classification using mathematical morphology and support vector machines[J]. Computer Science, 2014, 41(12): 275-279. doi: 10.11896/j.issn.1002-137X.2014.12.059
[5] 浦瑞良, 宫鹏, 约翰R.米勤.美国西部黄松叶面积指数与高光谱分辨率CASI数据的相关分析[J].环境遥感, 1993, 8(2): 112-125. Pu R L, Gong P, Miqin J R, et al. Correlating leaf area index of Ponderosa pine with hyperspectral CASI data[J]. Remote Sensing of Environment China, 1993, 8(2): 112-125.
[6] Dian Y Y, Li Z Y, Pang Y. Spectral and texture features combined for forest tree species classification with airborne hyperspectral imagery[J]. Journal of the Indian Society of Remote Sensing, 2015, 43(1): 101-107. http://www.wanfangdata.com.cn/details/detail.do?_type=perio&id=b6f347e54ac90834031b325496a20dab
[7] Ghiyamat A, Shafri H Z M, Mahdiraji G A, et al. Airborne hyperspectral discrimination of tree species with different ages using discrete wavelet transform[J]. International Journal of Remote Sensing, 2015, 36(1): 318-342. doi: 10.1080/01431161.2014.995272
[8] 柴颖, 阮仁宗, 傅巧妮.高光谱数据湿地植被类型信息提取[J].南京林业大学学报(自然科学版), 2015, 39(1): 181-184. http://d.old.wanfangdata.com.cn/Periodical/njlydxxb201501033 Chai Y, Ruan R Z, Fu Q N. Extraction of wetland vegetation information using hyperspectral image data[J]. Journal of Nanjing Forestry University (Natural Sciences Edition), 2015, 39(1): 181-184. http://d.old.wanfangdata.com.cn/Periodical/njlydxxb201501033
[9] 李双, 徐新良, 付颖.基于高光谱影像的三江源区不同退化程度高寒草甸分类研究[J].遥感技术与应用, 2015, 30(1): 50-57. http://d.old.wanfangdata.com.cn/Periodical/ygjsyyy201501007 Li S, Xu X L, Fu Y. A study on classification of different degradation level alpine meadows based on hyperpectral image data in three-river headwater region[J]. Remote Sensing Technology and Application, 2015, 30(1): 50-57. http://d.old.wanfangdata.com.cn/Periodical/ygjsyyy201501007
[10] 童庆禧, 唐川, 励惠国.腾冲航空遥感试验推陈出新[J].地球信息科学, 1999(1): 67-75. doi: 10.3969/j.issn.1560-8999.1999.01.017 Tong Q X, Tang C, Li H G. A creative action:the second experiment of Teng Chong aerial remote sensing[J]. Geo-information Science, 1999(1): 67-75. doi: 10.3969/j.issn.1560-8999.1999.01.017
[11] 顾娟, 李新, 黄春林.基于时序MODIS NDVI的黑河流域土地覆盖分类研究[J].地球科学进展, 2010, 25(3): 317-326. http://d.old.wanfangdata.com.cn/Periodical/dqkxjz201003010 Gu J, Li X, Huang C L. Land cover classification based on time series MODIS NDVI data in Heihe River Basin[J]. Advances of Earth Science, 2010, 25(3): 317-326. http://d.old.wanfangdata.com.cn/Periodical/dqkxjz201003010
[12] 除多, 边巴次仁, 王伟, 等.利用离散傅立叶变换分析拉萨地区植被季节变化特征[J].山地学报, 2010, 28(5): 579-585. doi: 10.3969/j.issn.1008-2786.2010.05.011 Chu D, Bianbaciren, Wang W, et al. Vegetation ponologies in Lhasa area using the discrete fourier transform[J]. Journal of Mountain Science, 2010, 28(5): 579-585. doi: 10.3969/j.issn.1008-2786.2010.05.011
[13] 李慧静, 包玉海, 包刚, 等.基于modis-Ndvi的内蒙古植被变化遥感监测[J].测绘科学, 2009, 34(5): 25-27, 51. http://d.old.wanfangdata.com.cn/Thesis/Y1302124 Li H J, Bao Y H, Bao G, et al. RS monitoring of vegetation change in Inner Mongolia based on MODIS-NDVI[J]. Science of Surveying and Mapping, 2009, 34(5): 25-27, 51. http://d.old.wanfangdata.com.cn/Thesis/Y1302124
[14] 汪权方, 李家永.基于时序ndvi数据的鄱阳湖流域常绿覆被季节性变化特征[J].长江流域资源与环境, 2008, 17(6): 866-871. doi: 10.3969/j.issn.1004-8227.2008.06.008 Wang Q F, Li J Y. Seasonal variation of evergreen land coverage in Poyang Lake watershed using multi-temporal SPOT4-vegetation data[J]. Resources and Environment in the Yangtze Basin, 2008, 17(6): 866-871. doi: 10.3969/j.issn.1004-8227.2008.06.008
[15] 章志都, 梁冠巍, 董建文, 等.基于植被分布因子主成分分析的福建省植被区划[J].东北林业大学学报, 2010, 38(3): 61-65. doi: 10.3969/j.issn.1000-5382.2010.03.018 Zhang Z D, Liang G W, Dong J W, et al. Vegetation regionalization for Fujian Province based on principal component analysis of factors affectiong vegetation distribution[J]. Journal of Northeast Forestry University, 2010, 38(3): 61-65. doi: 10.3969/j.issn.1000-5382.2010.03.018
[16] 郭芬芬, 范建容, 汤旭光, 等.基于HJ-1A高光谱数据的藏北高原草地分类方法对比[J].遥感信息, 2013, 28 (1): 77-82, 88. doi: 10.3969/j.issn.1000-3177.2013.01.016 Guo F F, Fan J R, Tang X G, et al. Comparison of methods for grassland classification based on HJ-1A hyperspectral image data in North Tibet[J]. Remote Sensing Information, 2013, 28(1): 77-82, 88. doi: 10.3969/j.issn.1000-3177.2013.01.016
[17] 万华伟, 王昌佐, 李亚, 等.基于高光谱遥感数据的入侵植物监测[J].农业工程学报, 2010, 26(增刊2): 59-63. http://www.cnki.com.cn/Article/CJFDTOTAL-HWYJ200701003.htm Wan H W, Wang C Z, Li Y, et al. Monitoring an invasive plant using hyperspectral remote sensing data[J]. Transactions of the Chinese Society of Agricultural Engineering, 2010, 26(Suppl.2): 59-63. http://www.cnki.com.cn/Article/CJFDTOTAL-HWYJ200701003.htm
[18] 杨可明, 刘飞, 孙阳阳, 等.谐波分析光谱角制图高光谱影像分类[J].中国图象图形学报, 2015, 20(6): 836-844. http://d.old.wanfangdata.com.cn/Periodical/zgtxtxxb-a201506014 Yang K M, Liu F, Sun Y Y, et al. Classification algorithm of hyperspectral imagery by harmonic analysis and spectral angle mapping[J]. Journal of Image and Graphics, 2015, 20(6): 836-844. http://d.old.wanfangdata.com.cn/Periodical/zgtxtxxb-a201506014
[19] 张莹, 张晓丽, 王书涵, 等.福建将乐林场主要树种冠层光谱反射特征分析[J].西北农林科技大学学报(自然科学版), 2016, 44(2): 83-89, 96. http://d.old.wanfangdata.com.cn/Periodical/xbnydxxb201602012 Zhang Y, Zhang X L, Wang S H, et al. Spectral reflectance characteristics of canopies of main tree species in Jingle Forest Farm in Fujian[J]. Journal of Northwest A & F University (Natural Science Edition), 2016, 44(2): 83-89, 96. http://d.old.wanfangdata.com.cn/Periodical/xbnydxxb201602012
[20] Congalton R G. A review of assessing the accuracy of classifications of remotely sensed data[J]. Remote Sensing of Environment, 1991, 37(1): 35-46. doi: 10.1016/0034-4257(91)90048-B
-
期刊类型引用(2)
1. 苏岫,王祥,宋德瑞,李飞,杨正先,张浩. 基于改进光谱角法的红树林高分遥感分类方法研究. 海洋环境科学. 2021(04): 639-646 .  百度学术
百度学术
2. 陈冀岱,牛树奎. 多时相高分辨率遥感影像的森林可燃物分类和变化分析. 北京林业大学学报. 2018(12): 38-48 . 本站查看
其他类型引用(3)

计量
- 文章访问数: 2849
- HTML全文浏览量: 393
- PDF下载量: 138
- 被引次数: 5
