
Individual tree mortality model for hybrid larch young plantations based on mixed effects
-
摘要:目的利用固定间隔期复测数据,运用不同方法建立杂种落叶松人工幼龄林单木枯损模型,为确定杂种落叶松合理的经营措施和推广应用提供依据。方法基于2003—2015年黑龙江省江山娇实验林场48块样地的复测数据,通过Logistic模型,利用全子集法和最大似然估计构建杂种落叶松单木枯损模型。使用列联表分析和分类率-阈值散点图,确定枯损模型预估时的最佳阈值。引入随机参数,构建样地水平广义线性混合模型。模型估计方法为自适应积分最大似然估计,模型筛选指标为Akaike信息标准(AIC)、贝叶斯信息标准(BIC)以及-2倍对数似然值。通过计算绝对平均偏差(Bias),绘制ROC曲线以及模型预估枯损率与实际枯损率直方图对两种模型的预测结果进行评价比较。结果包含单木(林木胸径,DBH;胸径平方,DBH2)、林分(林分断面积,BA)、竞争(大于对象木树木断面积之和变形,BALD)3个水平变量组合的单木枯损模型拟合效果最佳。杂种落叶松枯损主要发生在小径阶且相对竞争较大时。单木枯损概率随DBH增加逐渐减小,随BALD、BA增加而逐渐增加。最佳阈值有效提高了模型预估效果,方差-协方差结构为无结构矩阵(UN)时,四参数混合模型的拟合结果最佳,其预估的林分枯损率更接近实际林分枯损率。结论混合模型能够更有效地描述和预估杂种落叶松的单木枯损。阈值分析是提高二分类模型预测准确性的有效方法。杂种落叶松作为速生树种,幼龄时期应适时进行抚育间伐以减少枯损发生的概率。
-
关键词:
- 杂种落叶松人工林 /
- 单木枯损模型 /
- 广义线性模型(GLM) /
- 广义线性混合模型(GLMM) /
- 最佳阈值
Abstract:ObjectiveTo study the individual tree mortality of hybrid larch young plantations, using fixed intervals re-measured data and different methods to establish hybrid larch (Larix kaempferi × Larix olgensis) individual tree mortality model, this paper aims to provide the basis for the determination of sustainable management and promotion of hybrid larch.MethodBased on the re-measured data of the 48 permanent sample plots from 2003 to 2015 in Jiangshanjiao Experimental Forest Farm in Heilongjiang Province of northeastern China, the Logistic model was used to predict the probability of individual tree mortality by the method of all sub-set and maximum likelihood estimation. Contingency table analysis, scatter plot of classification rate and threshold were used to determine the best threshold when the model estimated. Adding random parameter at plot level aims to make the mixed model with maximum likelihood estimation based on adaptive quadrature. Selected criteria of models were Akaike information criterion (AIC), Bayesian information criterion (BIC) and negative double of logarithmic likelihood ratio. The model test criteria was the absolute average deviation (Bias). The ROC curve and histogram was used for prediction of mortality rate of the models and actual mortality rate was drawn to examine the performance of model.ResultThe results showed that the best fitting result appeared when the model contained the combination of individual level (DBH, DBH2), stand level (stand basal area, BA) and competition level (deformation of basal area of the trees greater than the subject tree, BALD). The mortality of the hybrid larch occurred when the DBH class was small, and competition was more intensive. The probability of individual mortality decreased with the increase of DBH, and increased with the increase of BALD and BA.The optimal threshold improved the prediction effect of the model. When the unstructured matrix was the variance-covariance structure, four random parameters of the mixed model had the best fitting result. The prediction of mortality rate of mixed model was closer to the actual mortality rate.ConclusionMixed model is more effective to describe individual tree mortality for hybrid larch. Threshold analysis is an effective method to improve the prediction accuracy of the dichotomous model. Hybrid larch is fast-growing species and thinning treatment should be appropriately implemented to reduce the probability of tree mortality in young forests. -
黄栌(Cotinus coggygria)属漆树科(Anacardia-ceae)黄栌属落叶灌木或小乔木,喜光,耐寒。原产于中国西南、华北和浙江,南欧、叙利亚、伊朗、巴基斯坦及印度北部也有分布[1]。树姿优美,秋冬时叶片颜色变红,是中国重要的观赏树种,同时叶片含有芳香油[2],可做调香原料。木材还是制作家具或用于雕刻的原料,也可从中提取黄色的工业染料。另外,黄栌的枝叶具有清湿热、镇痛疼、活血化瘀和降压等功效[3],有着重要的生态和经济价值。
光合作用的变化是植物对环境条件变化产生的适应性应答机制,可直接反映出植物能量吸收固定的能力[4-5],它为植物能量物质产生奠定基础,是决定植株生长状况的主要因素。合理的施肥用量不仅能使植物体内养分利用率最大化,还能有效增强光合能力,提高植物抗逆能力。已有研究表明,氮磷钾是植物生长和生理代谢的重要基础物质,合理施肥能提高植物叶片蛋白质合成以及碳水化合物转移,还能通过调节气孔开闭及酶活性影响光合作用[6]。熊靓等[7]研究表明,配方施肥能提高竹叶花椒(Zanthoxylum armatum)叶片净光合速率(Pn)和光能利用效率(LUE),且氮磷钾三因素配施条件下叶片Pn和 LUE日平均值均比氮磷、氮钾和磷钾两因素配施条件下的高,进一步表明氮磷钾配施能使植物叶片更均衡地吸收营养元素。另外,氮磷钾配施还能提高叶片叶绿素含量,延长绿叶功能期,而叶绿素含量能够通过影响植株叶片组织衰老进程和酶分解程度[8],引起叶片光合特性和光合产物累积量的变化,从而对植株的物质累积及生长发育产生影响。王虎兵等[9]研究表明,合理施肥对番茄(Lycopersicum esculentum)植株Pn、气孔导度(Gs)、蒸腾速率(Tr)影响显著,同时发现叶片氮磷钾含量与叶绿素含量和Pn呈显著正相关关系,最终改善植株对养分的吸收、累积和分配,更有利于后期产量的形成。因此,研究植物光合特性对不同施肥配比的响应特征,对于探讨氮磷钾配比对植物生长发育的影响及指导栽培管理具有重要意义。
关于黄栌叶片光合特性在干旱胁迫[10-11]、不同光环境[12]和不同温湿度[13] 等方面的响应已有报道,而土壤是植物生长的基础,土壤肥力质量直接影响植物光合能力,其中矿质元素氮磷钾是植物生长的三要素,而合理的氮磷钾肥比例和用量配施,能满足植物养分需求,保持较高的叶片生理活性,提高光合效能,达到维持植株长势强健的目的。目前关于土壤养分对黄栌叶片光合作用的影响了解很少。为此,本研究开展氮磷钾三因素三水平正交试验,采用盆栽法初步探讨不同氮磷钾肥配施方案对黄栌叶片光合作用的调控效应,以期为黄栌的养分管理提供理论依据。
1. 研究区概况与研究方法
1.1 研究区概况
研究地位于西南大学后山试验园(106°25′54″ E、29°47′56″ N),海拔227 m。属亚热带季风性湿润气候,雨量充沛,年平均气温18.2 ℃,8月最高气温44.3 ℃,1月最低气温−3.1 ℃。年均日照时数1 368 h,无霜期336 d,年均降水量1 345 mm,土壤类型为紫色土。土壤理化性质为有机质11.40 g/kg,pH值7.65,全氮0.10 g/kg,全磷0.93 g/kg,全钾4.19 g/kg,碱解氮76.55 mg/kg,有效磷16.67 mg/kg,速效钾84.79 mg/kg。
1.2 试验设计
本试验采用露天盆栽方式(栽培土壤选自试验园),2017年10月将3年生黄栌实生苗植于规格为30 cm × 40 cm(直径 × 高)的控根容器。2018年3月选择长势基本相同的黄栌,根据植物生长发育需肥规律按照单位面积进行折算,采用氮磷钾三因素三水平正交设计,以不施肥为空白对照,共10个处理,每个处理重复8次,具体施肥量见表1。采用穴施的方式,分别于2018年3、5和7月按总施肥量的37.5%、25%和37.5%比例施入。
表 1 黄栌施肥处理的试验方案Table 1. Test scheme of fertilization treatment for Cotinus coggygria处理
Treatment配施组合
Combined fertilizer
application全年施肥量/(g·株−1)
Annual fertilizer amount/(g·plant−1)N P2O5 K2O T1 N1P1K1 0 0 4 T2 N1P2K2 0 10 8 T3 N1P3K3 0 20 12 T4 N2P1K2 6 0 8 T5 N2P2K3 6 10 12 T6 N2P3K1 6 20 4 T7 N3P1K3 12 0 8 T8 N3P2K1 12 10 4 T9 N3P3K2 12 20 8 T10 N0P0K0 0 0 0 1.3 测定指标及方法
1.3.1 光合参数日变化测定
于2018年8月中旬,选择连续的晴朗无云天气,采用Li-6800便携式光合作用测量仪进行黄栌叶片光合日变化的测定。每个处理选择5株长势基本一致、生长健壮的黄栌,选取无病斑的3 ~ 5片成熟叶进行连续3 d的测定,并做好标记。测定Pn、Tr、Gs,同时记录光合有效辐射(PAR)、大气温度(Ta)、CO2浓度(Ca)和相对湿度(RH)等环境因子,测定时间为07:00—19:00,每2 h测定1次,每次测定记录6组数值。LUE采用叶片Pn与PAR的比值[14]。
1.3.2 光响应曲线测定
于2018年8月中旬,选择连续的晴朗无云天气,选取光合参数日变化标记的叶片,采用Li-6800便携式光合测量仪在09:00—11:00进行光响应曲线测定。光合仪的红蓝光源设定叶室中光合有效辐射强度分别为1 800、1 500、1 200、1 000、800、600、400、200、150、100、50、0 μmol/(m2·s),测定过程中,将叶室温度控制在25 ℃,相对湿度控制在60%,CO2浓度为400 μmol/mol。光响应曲线采用叶子飘[15]提出的非直角双曲线模型进行拟合并得到表观量子效率(AQY)、最大净光合速率(Pnmax)、光饱和点(LSP)、光补偿点(LCP)和暗呼吸速率(Rd)。
1.3.3 光合色素含量测定
光合参数测定完成后,立即摘下叶片带回实验室,采用V(丙酮)∶V(乙醇) = 2∶1的混合液浸提比色法测定叶绿素a(Chl a)、叶绿素b(Chl b)、总叶绿素(Chl s)和类胡萝卜素(Car)含量[16]。
1.3.4 叶面积的测定
使用YMJ-C型号智能叶面积测量系统(浙江托普云农科技股份有限公司)测定叶面积。
1.4 数据处理
采用Excel 2010 软件进行数据统计,SPSS 22.0 软件进行显著性差异分析(Duncan法进行多重比较),冗余分析(RDA)反映氮磷钾肥与黄栌叶片光合特性的关系。运用 Origin 2018 进行图表制作,Canoco 5.0 进行冗余分析。
2. 结果与分析
2.1 环境因子日变化
测定光合参数日变化时的环境因子日变化结果如图1所示。从07:00左右开始,Ta和PAR逐渐上升,在11:00左右达到最大值,分别是41.3 ℃和1 127.79 μmol/(m2·s),之后逐渐下降。Ca日变化幅度不明显,在11:00左右达最低值(385.69 μmol/mol)。RH从07:00—11:00逐渐下降,11:00—13:00基本稳定,13:00—15:00急速下降,在15:00左右达最低值(48.78%),之后维持在相对稳定水平。
2.2 氮磷钾配施对黄栌叶片光合色素和叶面积的影响
各处理Chl a、Chl b、Chl s和Car含量存在一定差异(见图2)。除T1、T2和T7外,其余处理的Chl s含量显著高于对照(P < 0.05),其中T5、T6和T8较高,分别是对照的1.67、1.67和1.84倍。T5、T6和T8的Car含量分别是对照的1.88、2.09和1.83倍。各处理叶面积大小如图3所示,T5和T7的叶面积显著高于T10(P < 0.05),分别是对照的2.10和2.29倍。
![]() 图 2 不同氮磷钾配施处理对黄栌光合色素含量的影响不同字母表示差异显著(P < 0.05)。下同。Different letters mean significant differences (P < 0.05). The same below.Figure 2. Effects of combined application of N, P and K on photosynthetic pigment content of C. coggygria
图 2 不同氮磷钾配施处理对黄栌光合色素含量的影响不同字母表示差异显著(P < 0.05)。下同。Different letters mean significant differences (P < 0.05). The same below.Figure 2. Effects of combined application of N, P and K on photosynthetic pigment content of C. coggygria![]() 图 3 不同氮磷钾配施处理对黄栌叶面积的影响Figure 3. Effects of combined application of N, P and K on leaf area of C. coggygria
图 3 不同氮磷钾配施处理对黄栌叶面积的影响Figure 3. Effects of combined application of N, P and K on leaf area of C. coggygria2.3 氮磷钾配施对黄栌叶片光合参数日变化的影响
2.3.1 氮磷钾配施对黄栌叶片Pn日变化的影响
不同氮磷钾配施下黄栌叶片Pn日变化的趋势大致相同。由图4可知,各处理均呈双峰型曲线,分别在09:00左右和13:00左右出现了峰值,两峰值的平均值分别为14.439和17.198 μmol/(m2·s);在11:00左右出现了光合午休现象,平均值为11.987 μmol/(m2·s)。除T2外,其余处理的Pn日平均值显著高于对照(P < 0.05)(表2),其中T5、T6和T9较高,分别比对照提高了28.44%、28.89%和31.45%。
![]() 图 4 不同氮磷钾配施处理对黄栌叶片光合参数日变化的影响Figure 4. Effects of combined application of N,P,K on diurnal variations of photosynthetic parameters in leaves of C. coggygria表 2 不同氮磷钾配施下黄栌叶片光合参数日平均值Table 2. Daily average values of photosynthetic parameters of C. coggygria under different combined applications of N, P and K
图 4 不同氮磷钾配施处理对黄栌叶片光合参数日变化的影响Figure 4. Effects of combined application of N,P,K on diurnal variations of photosynthetic parameters in leaves of C. coggygria表 2 不同氮磷钾配施下黄栌叶片光合参数日平均值Table 2. Daily average values of photosynthetic parameters of C. coggygria under different combined applications of N, P and K处理 Treatment Pn/(μmol·m−2·s−1) Tr/(mmol·m−2·s−1) Gs/(mol·m−2·s−1) LUE/% T1 7.654 ± 0.202b 2.776 ± 0.169c 0.114 ± 0.010d 2.314 ± 0.161c T2 6.949 ± 0.202c 3.132 ± 0.091b 0.134 ± 0.007cd 3.048 ± 0.079a T3 7.794 ± 0.150b 3.092 ± 0.833b 0.121 ± 0.014d 2.385 ± 0.040c T4 7.602 ± 0.225b 3.290 ± 0.147b 0.143 ± 0.007bc 2.688 ± 0.072b T5 8.802 ± 0.225a 3.497 ± 0.148a 0.151 ± 0.012b 2.735 ± 0.131b T6 8.833 ± 0.196a 3.606 ± 0.125a 0.129 ± 0.004d 2.323 ± 0.161c T7 7.476 ± 0.151b 3.069 ± 0.109b 0.141 ± 0.009c 3.177 ± 0.047a T8 7.943 ± 0.186b 3.385 ± 0.833b 0.147 ± 0.010b 2.597 ± 0.115b T9 9.008 ± 0.177a 3.644 ± 0.103a 0.158 ± 0.005a 3.218 ± 0.072a T10 6.853 ± 0.614c 3.319 ± 0.183b 0.148 ± 0.008b 2.002 ± 0.160d 2.3.2 氮磷钾配施对黄栌叶片Tr日变化的影响
不同氮磷钾配施下黄栌叶片Tr日变化的趋势大致相同(图4),呈现出单峰型曲线变化,从07:00—11:00随时间延长逐渐上升,在11:00左右达峰值(平均值为7.006 mmol/(m2·s))后,11:00—19:00随时间延长逐渐下降。T5、T6和T9的Tr日平均值显著高于对照(P < 0.05)(表2),分别提高了5.36%、8.65%和9.79%;T1显著低于对照(P < 0.05),降低了16.36%。
2.3.3 氮磷钾配施对黄栌叶片Gs日变化的影响
Gs的日变化曲线与Pn相似(图4)。各处理均呈双峰型曲线,分别在09:00左右和13:00左右出现了峰值,两峰值的总平均值分别为0.237和0.251 mol/(m2·s)。在11:00左右出现了谷值(平均值为0.209 mol/(m2·s))。T9的Gs日平均值最高,显著高于对照(P < 0.05)(表2),提高了4.05%;T1、T2、T3、T6和T7显著低于对照(P < 0.05),分别降低了22.97%、9.46%、18.24%、12.84%和4.73%。
2.3.4 氮磷钾配施对黄栌叶片LUE日变化的影响
不同氮磷钾配施下黄栌叶片LUE日变化的变化趋势大致相同(图4)。07:00—11:00左右呈逐渐下降趋势,在11:00左右降至谷值(平均值为1.071%),除T3、T4和T7外,其余处理在11:00—13:00的LUE值逐渐上升,之后至15:00左右略微下降,15:00—17:00又小幅提升,而T3、T4和T7在11:00—17:00随时间延长LUE值逐渐上升,在17:00—19:00,所有处理的LUE值变化缓慢,与17:00左右相比几乎持平;所有施肥处理均显著高于对照(P < 0.05)(表2),其中T2、T7和T9的LUE日平均值较高;分别提高了52.25%、58.69%和60.74%。
2.4 氮磷钾配施对黄栌叶片光合−光响应的影响
本研究采用叶子飘[15]推荐的方法绘制光响应曲线(图5),随着光照强度(PAR)的增加Pn也随之升高。尤其在PAR < 200 μmol/(m2·s)时,各配施处理的黄栌叶片Pn随PAR呈近似直线增加趋势,达到600 μmol/(m2·s)后,Pn升高幅度明显减小,逐渐趋于平缓,符合植物对PAR变化的相应规律。由表3可知,除T2和T4 外,其余处理的AQY显著低于对照(P < 0.05);除T1、T2和T7外,其余处理的Pnmax与对照差异显著(P < 0.05);T3、T8和T9的LSP显著高于对照(P < 0.05),除T1外,其余处理的LCP与对照差异显著(P < 0.05);T2、T5和T9的Rd显著高于对照(P < 0.05),T1显著低于对照(P < 0.05)。
![]() 图 5 不同氮磷钾配施处理下的黄栌叶片的光合-光响应曲线Figure 5. Photosynthesis-light response curves of C. coggygria leaves under different combined applications of N,P and K表 3 不同氮磷钾配施下黄栌叶片光合-光响应参数Table 3. Phtosynthesis-light response parameters of C. coggygria leaves under different combined applications of N, P and K
图 5 不同氮磷钾配施处理下的黄栌叶片的光合-光响应曲线Figure 5. Photosynthesis-light response curves of C. coggygria leaves under different combined applications of N,P and K表 3 不同氮磷钾配施下黄栌叶片光合-光响应参数Table 3. Phtosynthesis-light response parameters of C. coggygria leaves under different combined applications of N, P and K处理 Treatment AQY/(μmol·m−2·s−1) Pnmax/(μmol·m−2·s−1) LSP/(μmol·m−2·s−1) LCP/(μmol·m−2·s−1) Rd/(μmol·m−2·s−1) T1 0.047 ± 0.003d 6.515 ± 0.251d 1 110.258 ± 60.836c 14.325 ± 0.800d 0.634 ± 0.191d T2 0.069 ± 0.003ab 6.705 ± 0.212d 1 166.762 ± 28.746c 28.196 ± 2.212b 1.643 ± 0.211ab T3 0.063 ± 0.003bc 7.604 ± 0.407c 1 208.546 ± 73.310b 26.258 ± 1.986b 1.514 ± 0.171bc T4 0.069 ± 0.003ab 7.624 ± 0.202c 1 038.744 ± 44.339d 20.807 ± 1.600b 1.262 ± 0.191c T5 0.062 ± 0.003bc 9.285 ± 0.295b 1 045.167 ± 19.850d 27.366 ± 1.975b 1.523 ± 0.206b T6 0.059 ± 0.003c 10.846 ± 0.113a 1 142.211 ± 41.416c 28.954 ± 2.165b 1.507 ± 0.207bc T7 0.067 ± 0.003b 6.866 ± 0.215d 1 028.514 ± 19.836d 21.514 ± 1.643c 1.257 ± 0.203c T8 0.050 ± 0.003d 8.018 ± 0.216c 1 232.757 ± 60.396b 25.881 ± 0.851b 1.179 ± 0.149c T9 0.065 ± 0.003bc 11.206 ± 0.277a 1 596.117 ± 22.237a 33.284 ± 2.582a 1.817 ± 0.160a T10 0.074 ± 0.003a 6.412 ± 0.197d 1 072.515 ± 11.667cd 15.419 ± 0.949d 1.010 ± 0.085c 2.5 氮磷钾与光合特征参数的冗余分析
由表4可知,前两个排序轴解释了2组变量特征的71.84%,它们的累计解释量达96.33%,说明排序结果可信,能较好地解释2组变量的关系。由图6可知,氮磷钾对黄栌叶片光合特征参数具有重要影响,其中肥料贡献率大小依次为磷肥 > 氮肥 > 钾肥,其中磷对光合色素(Chl s和Car)的影响大,同时与Pn、Pnmax和LSP正相关程度大。氮钾对LUE的影响大,同时LUE与LCP、Tr和Gs正相关程度大。
表 4 氮磷钾与黄栌光合特征参数的RDA分析Table 4. RDA analysis of photosynthetic characteristic parameters of C. coggygria with N, P and K统计
Statistic特征值
Eigenvalue累计解释变量
Cumulative explaviation
variable/%解释拟合累积变量
Explaining the fitting
cumulative variable/%轴1 Axis 1 0.571 2 57.12 71.60 轴2 Axis 2 0.147 1 71.84 90.05 轴3 Axis 3 0.079 4 79.78 100.00 轴4 Axis 4 0.165 6 96.33 ![]() 图 6 氮磷钾与黄栌叶片光合特性参数的 RDA 排序图Figure 6. RDA diagram of photosynthetic parameters of C. coggygria with N, P and K
图 6 氮磷钾与黄栌叶片光合特性参数的 RDA 排序图Figure 6. RDA diagram of photosynthetic parameters of C. coggygria with N, P and K2.6 氮磷钾对黄栌叶片光合日变化的综合分析
利用隶属函数分析法,对不同氮磷钾下黄栌叶片光合日变化进行综合分析。由表5可知,综合值排序最高的3个处理依次是T9(N3P3K2)、T7(N3P1K3)和T8(N3P2K1),其中T9的 Pn、Tr、Gs和LUE隶属度均显著高于对照(P < 0.05),分别是对照的1.79、2.02、3.10和2.49倍。
表 5 氮磷钾配施下黄栌光合日变化的模糊综合质量评价与排序Table 5. Evaluation and sequencing of diurnal variations of photosynthesis of C. coggygria to combined fertilization of N, P and K处理 Treatment Pn Tr Gs LUE 综合值 Comprehensive value 排序 Sort T1 0.46 ± 0.05b 0.60 ± 0.07cde 0.68 ± 0.07abc 0.60 ± 0.03b 2.34 5 T2 0.20 ± 0.12c 0.62 ± 0.09cd 0.77 ± 0.08ab 0.12 ± 0.06d 1.71 8 T3 0.23 ± 0.04c 0.46 ± 0.04de 0.52 ± 0.07bcd 0.85 ± 0.03a 2.06 7 T4 0.89 ± 0.04a 0.41 ± 0.05de 0.43 ± 0.04cde 0.35 ± 0.06c 2.08 6 T5 0.58 ± 0.04b 0.68 ± 0.04bc 0.75 ± 0.09ab 0.54 ± 0.05b 2.55 4 T6 0.87 ± 0.04a 0.16 ± 0.08e 0.18 ± 0.10e 0.34 ± 0.06c 1.55 10 T7 0.42 ± 0.03b 0.90 ± 0.05a 0.65 ± 0.09abc 0.94 ± 0.02a 2.91 2 T8 0.48 ± 0.04b 0.78 ± 0.07abc 0.81 ± 0.12ab 0.63 ± 0.05b 2.7 3 T9 0.95 ± 0.04a 0.87 ± 0.06ab 0.93 ± 0.05a 0.97 ± 0.03a 3.72 1 T10 0.53 ± 0.03b 0.43 ± 0.04de 0.30 ± 0.14de 0.39 ± 0.02c 1.65 9 3. 讨 论
本研究发现不同氮磷钾配施下的黄栌叶片Pn和Gs均呈双峰型曲线,分别在09:00左右和13:00左右出现了峰值,在11:00左右出现了午休现象(图4),说明黄栌叶片光合因子日变化趋势的主导因子是基因型,而土壤中的氮磷钾营养因子对其无明显影响。一般认为,植物叶片Pn日变化出现午休现象的原因与气孔导度降低和叶片光合作用能力有关,前者是因为Gs下降或关闭阻碍了CO2的供应,后者是因为叶片中光合色素含量少致使Pn降低[17],本研究中Gs在11:00左右降低,阻止了大气中CO2的供应。环境因子中的PAR和Ta在11:00左右达最大值(图1),可能是强光和高温的共同作用使光合关键酶−Rubisco酶活性受抑制,导致光合速率减小[18]。本研究还发现Tr呈单峰型曲线,在11:00左右达到峰值(图4),而Pn和Gs却在 11:00左右出现峰值,表明其Pn日变化除受气孔限制外,更主要的是受非气孔限制[19]。气孔蒸腾是主要的水分散失形式,调节着植物体内的水分平衡,可能是在外界环境Ta过高、PAR强度过大时,叶片通过增大蒸腾速率降低叶片温度,刺激了气孔,为避免过量失水Gs降低,此时可能以角质层蒸腾的方式进行蒸腾作用,使光合速率明显下降[19-20]。
叶绿素和类胡萝卜素可以捕获光能并将能量传递到光反应中心产生化学能[21],通过合理配施氮磷钾肥对增加黄栌叶片光合色素含量、提高叶片Pn具有重要作用。氮是叶绿素的主要成分,施氮可直接影响植物体内叶绿素和光合酶类的合成与活性,通过合成叶绿素和增加酶数量提高植物Pn[22];磷和钾能促进植物叶绿素合成,影响植物体内多种光合酶活性,并参与电子传递和植物能量代谢,在ATP反应中起关键作用,影响着光合产物的合成、运输及转化[23]。邱佳妹等[24]的研究发现,氮肥和钾肥是影响麦冬(Ophiopogon japonicas)幼苗叶片光合色素含量的主要因素,磷肥对麦冬幼苗叶片的光合色素含量无显著影响,与本研究结果不一致。本研究发现,氮磷钾肥对黄栌叶片中叶绿素和类胡萝卜素含量的贡献率表现为磷肥 > 氮肥 > 钾肥(图6),其中,T5(N2P2K3)、T6(N2P3K1)和T8(N3P1K1)显著提高了黄栌叶片叶绿素和类胡萝卜素含量(图2),进而使黄栌叶片光合能力显著提高(如表2中Pn和表3中Pnmax明显高于其他处理)。这是由于土壤养分条件和研究对象对养分的吸收、转化和利用能力不同造成的,邱佳妹等[24]的研究栽培基质为蛭石和珍珠岩,主要营养物质是磷、钙和钾,麦冬为多年生草本植物,其幼苗在开始生长时对氮肥的需求量大,秋冬时需施磷肥,而蛭石中的磷素能为其生长提供必要养分,造成后期施用磷肥对光合色素含量的影响不显著。而本研究中黄栌为落叶灌木,对土壤的养分需求量大于草本植物,本研究盆栽土壤中有效磷含量较低(16.67 mg/kg),所以施加磷肥产生的效应会较大。另外,T3(N1P3K3)中磷施加量为最高水平(20 g/株),而光合能力却提高不明显,可能是因为在氮磷钾肥配施情况下,在氮肥处于低水平时,阻碍了黄栌植株体内叶绿素的合成,减弱了叶片的光合能力[25]。
氮磷钾配施对叶片光合特征参数也具有显著影响。罗凡等[26]研究发现单施磷肥可显著提高春季茶树新梢叶片Tr,氮磷钾配施可显著增加叶片Tr和Gs。杨腾等[27]研究发现,氮肥能显著提高文冠果(Xanthoceras sorbifolia)幼苗的Pnmax、AQY和LSP,进而增强光能转化效率和利用范围,促进幼苗生长。本研究发现磷对Pn、Pnmax和LSP影响大,可能是磷肥提高了黄栌叶片中Rubisco酶活性,让其在高光照条件下仍能继续光合作用,促使光饱和点升高,光反应时间更长,积累更多光合产物[28]。氮钾对LUE的影响大,一方面是氮和钾配施量大的处理T5(N2P2K3)和T7(N3P1K3)(见图3)叶面积显著高于对照,说明氮肥和钾肥能增加叶面积,接收更多太阳能供植物利用[29]。另一方面,钾不仅促进植株对氮元素的吸收和转运,还提高植物叶片对光能的利用能力[30]。此外,LUE与LCP、Tr和Gs正相关程度大,是因为植物通过调节叶片气孔导度提高叶肉细胞的光合活性,而LCP反映了植物对弱光的利用能力,LCP越低,说明黄栌对07:00和19:00时的弱光利用能力越强[31]。因此,通过合理施肥来调节植物养分供应状况也是促进黄栌叶片Pn、Pnmax、LSP和LUE的关键。
4. 结 论
本试验范围内,氮磷钾配施能有效促进黄栌叶片光合色素合成,进而显著促进黄栌的光合能力。其中,肥料贡献率表现为磷肥 > 氮肥 > 钾肥,T9的光合日变化参数值(Pn、Tr、Gs和LUE)和光响应参数值(Pnmax、LSP、LCP和Rd)较高。综合分析结果表明T9(氮肥施用量12 g/株,磷肥施用量20 g/株,钾肥施用量8 g/株)是本试验最优处理,进一步说明磷肥对提高黄栌叶片光合色素含量起重要作用,进而显著提高其光合能力,该结论可为黄栌的栽培管理提供科学参考。
-
![]()
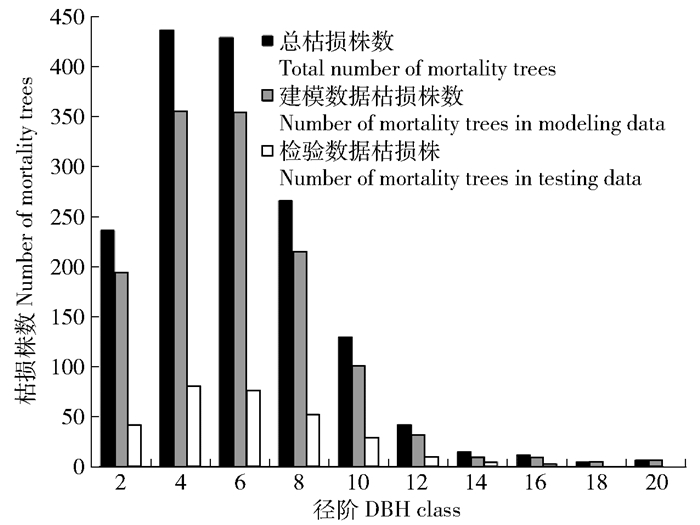
图 1 杂种落叶松人工幼龄林不同径阶枯损株数分布
Figure 1. Distribution for the number of mortality trees in different DBH classes of hybrid larch young plantations
![]()
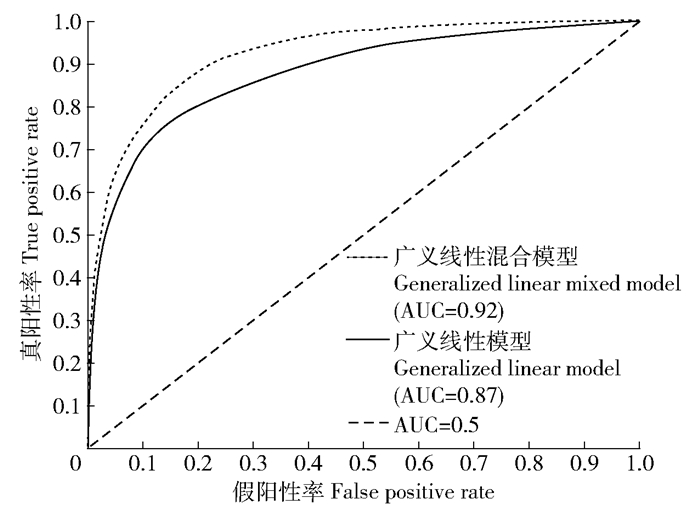
图 2 广义线性模型与广义线性混合模型ROC曲线比较
Figure 2. Comparison of the ROC curve between generalized linear model and generalized linear mixed model
![]()
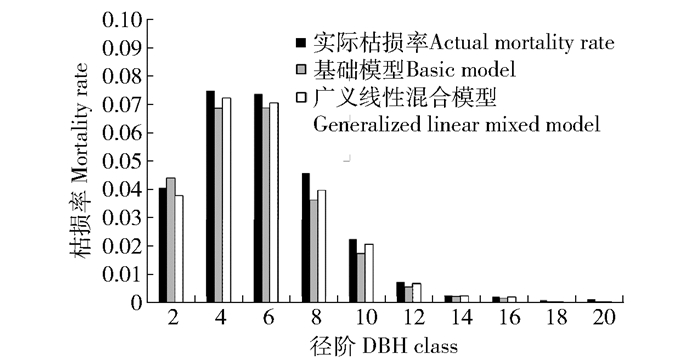
图 3 广义线性模型、广义线性混合模型预测枯损率与实际枯损率比较
Figure 3. Comparison of the actual mortality rate in the result of generalized linear model and generalized linear mixed model predicted
![]()
图 4 杂种落叶松人工幼龄林枯损模型阈值点与分类率关系
Figure 4. Relationship of classification rate and threshold for the mortality model of hybrid larch young plantations
表 1 杂种落叶松人工幼龄林基本因子统计表
Table 1 Statistics of basic characteristics about hybrid larch young plantations
数据类别
Data class样地数
Sample plot number(N)林分平均胸径
Mean DBH(Dg)/cm林分平均高
Mean stand height(H)/m林分断面积/
(m2·hm-2)
Stand basal area (BA)/
(m2·ha-1)每公顷存活株数/
(株·hm-2)
Living tree number per hectare(NHAL)/
(plant·ha-1)存活树木蓄积/
(m3·hm-2)
Living tree volume per hectare(VOLL)/
(m3·ha-1)每公顷枯死株数/
(株·hm-2)
Dead tree number per hectare(NHAD)/
(plant·ha-1)枯死树木蓄积/
(m3·hm-2)
Dead tree volume per hectare(VOLD)/
(m3·ha-1)建模数据
Modeling data40 3.07~15.12
(13.29±2.67)2.41~14.12
(8.95±2.41)2.05~38.74
(19.49±8.39)1775~4875
(2707±758)6.19~200.82
(95.60±4.65)0~1100
(71±119)0~14.19
(0.89±2.08)检验数据
Testing data8 4.33~14.56
(13.16±2.67)2.44~14.08
(8.81±2.44)3.92~34.66
(19.90±8.59)1642~4275
(2633±627)10.27~184.18
(98.10±5.18)0~475
(50±88)0~10.99
(0.63±1.96)注:括号内为平均值±标准差。Note: that in bracket is the mean value ± standard deviation.  下载: 导出CSV
表 2 阈值检验指标计算公式描述
Table 2 Formula description for the threshold test index
检验指标Testing index 缩写Abbreviation 公式Formula 真阳性率/灵敏度True positive rate/sensitivity TPR TPR=TP/(TP+FN) 假阴性率False negative rate FNR FNR=FN/(TP+FN)=1-TPR 真阴性率/特异度True negative rate/specificity TNR TNR=TN/(FP+TN) 假阳性率False positive rate FPR FPR=FP/(FP+TN)=1-TNR 错误分类率Mistake classification rate MCR MCR=FPR+FNR 正确分类率Accuracy classification rate ACR ACR=(TP+TN)/(TP+TN+FP+FN)
下载: 导出CSV
表 3 杂种落叶松人工幼龄林不同间隔期建模结果
Table 3 Modeling results with different intervals for hybrid larch young plantations
间隔期/a Interval/year AUC 1 0.856 2 0.861 3 0.870 4 0.836 5 0.845
下载: 导出CSV
表 4 杂种落叶松人工幼龄林全子集模型筛选结果
Table 4 Results of model selection with All-sets for hybrid larch young plantations
模型编号
Model No.变量Variable AIC BIC -2倍对数似然值
-2 log likelihoodAUC VIF 1 BALD 7170.6 7186.2 7166.6 0.795 2.71 2 NHAL BALD 7053.3 7061.5 7033.2 0.806 2.86 3 DBH DBH2 BALD 6903.7 6934.8 6895.7 0.826 3.16 4 DBH DBH2 BALD BA 6804.3 6843.3 6794.3 0.870 4.43 5 DBH DBH2 NHAL BALD RD 6932.9 6923.7 6918.2 0.865 4.60 6 DBH DBH2 BA NHAL BALD DBA 6931.3 6939.7 6932.5 0.852 4.87 7 DBH DBH2 BA NHAL BALD DBA RD 6921.3 6918.8 6912.3 0.852 5.26 8 DBH DBH2 BA NHAL BAL BALD RD DBA 6885.1 6879.2 6875.3 0.854 6.02 注:DBH为林木胸径,BAL指所有大于对象木的树木断面积之和,BALD为BAL与DBH的变形,RD为相对直径, DBA为胸径和林分断面积之比,BA为林分断面积,NHAL为每公顷存活株数。下同。Notes: DBH, tree diameter at breast height; BAL, sum of stand basal area of all greater than object wood; BALD, transformation of BAL and DBH; RD, relative diameter; DBA, ratio of DBH to stand basal area; BA, stand basal area; NHAL, NHAL is number of living trees per hectare. The same below.
下载: 导出CSV
表 5 杂种落叶松人工幼龄林Logistic广义线性模型参数估计
Table 5 Parameter estimation for Logistic generalized linear model of hybrid larch young plantations
变量Variable 参数Parameter 自由度Freedom 估计值
Estimated value标准误差SD Wald χ2 P 截距Intercept b0 1 -2.5321 0.2282 123.0760 < 0.0001 DBH b1 1 -0.6185 0.0648 90.9819 < 0.0001 DBH2 b2 1 0.0260 0.0030 74.1734 < 0.0001 BALD b3 1 0.3411 0.0338 101.9940 < 0.0001 BA b4 1 0.0238 0.0205 15.3487 < 0.0001
下载: 导出CSV
表 6 杂种落叶松人工幼龄林广义线性混合模型模拟
Table 6 Simulation of the Logistic generalized linear mixed model of hybrid larch young plantations
模型编号
Model No.参数个数
Number of parameters随机参数
Random parameter筛选指标
Screening criteriab0 b1 b2 b3 b4 AIC BIC -2倍对数似然值
-2 log likelihood1 5 6804.30 6843.30 6794.30 2 6 ▲ 6313.60 6323.74 6301.60 3 6 ▲ 6282.87 6293.00 6270.87 4 6 ▲ 6420.65 6430.78 6408.65 5 6 ▲ 6523.29 6533.43 6511.29 6 6 ▲ 6392.90 6403.03 6380.90 7 8 ▲ ▲ 6240.89 6254.40 6224.89 8 8 ▲ ▲ 6247.94 6261.45 6231.94 9 8 ▲ ▲ 6259.96 6273.47 6243.96 10 8 ▲ ▲ 6235.31 6248.83 6219.31 11 8 ▲ ▲ 6259.53 6273.04 6243.53 12 8 ▲ ▲ 6281.58 6295.09 6265.58 13 8 ▲ ▲ 6215.97 6212.46 6210.46 14 8 ▲ ▲ 6349.88 6363.40 6333.88 15 11 ▲ ▲ ▲ 6284.48 6292.93 6274.48 16 11 ▲ ▲ ▲ 6203.66 6212.10 6193.66 17 11 ▲ ▲ ▲ 6205.95 6214.40 6195.95 18 11 ▲ ▲ ▲ 6208.55 6217.00 6198.55 19 11 ▲ ▲ ▲ 6214.05 6222.50 6204.05 20 11 ▲ ▲ ▲ 6225.70 6234.14 6215.70 21 11 ▲ ▲ ▲ 6271.29 6279.73 6261.29 22 11 ▲ ▲ ▲ 6242.72 6251.17 6232.72 23 15 ▲ ▲ ▲ ▲ 6203.10 6211.54 6193.10 23 15 ▲ ▲ ▲ ▲ 6204.59 6213.03 6194.59 24 15 ▲ ▲ ▲ ▲ 6207.70 6216.14 6197.70 25 15 ▲ ▲ ▲ ▲ 6186.54 6194.98 6176.54 26 20 ▲ ▲ ▲ ▲ ▲ 6236.21 6244.32 6226.13 注:▲表示包括这个随机参数;b0、b1、b2、b3、b4分别为截矩、DBH、DBH2、BALD、BA的模型参数。Notes:▲ means it is included in the random parameters; b0, b1, b2, b3, b4 are model parameters of intercept, DBH, DBH2, BALD, BA.
下载: 导出CSV
表 7 基于不同方差-协方差结构的模型比较
Table 7 Comparison of model based on different variance-covariance structures
模型编号
Model No.方差-协方差结构
Variance-covariance structure参数个数
Number of parametersAIC BIC -2倍对数似然值
-2 log likelihoodPearson χ2 25 无结构矩阵Unstructured matrix(UN) 15 6186.54 6194.98 6176.54 0.93 对角矩阵Diagonal matrix(VC) 9 6270.39 6285.59 6252.39 0.88 复合矩阵Compound symmetry(CS) 7 6362.29 6374.11 6348.29 0.91 一阶自回归结构First-order autoregressive(AR(1)) 16 6221.74 6225.09 6211.44 0.92 一阶移动平移结构First-order moving-average(MA(1)) 一阶自回归移动平均结构 First-order autoregressive moving-average(ARMA(1, 1))
下载: 导出CSV
表 8 杂种落叶松人工幼龄林枯损模型拟合与检验结果
Table 8 Fitting and testing results of mortality model of hybrid larch young plantations
固定参数Fixed parameter 基础模型Basic model 混合模型Mixed model b0 -2.5321 -2.6368 b1 -0.6185 -1.4545 b2 0.0260 0.0392 b3 0.3411 0.3456 b4 0.0238 0.0522 随机效应方差-协方差结构Random effect variance-covariance structure(G) [0.2297−0.00340.0851−0.0945−0.00340.0001−0.00010.00120.0851−0.00010.0357−0.0373−0.09450.0012−0.03730.0405] Pearson χ2 1.36 0.93 AUC 0.8701 0.9178 Wald χ2 < 0.0001 < 0.0001 Bias 5.375 1.375
下载: 导出CSV
表 9 杂种落叶松人工幼龄林枯损模型阈值预测列联表分析
Table 9 Confusion matrix of the hybrid larch mortality model for four cut points
列联表分析
Confusion matrix实际变量分类Actual variety classification Positive 0=枯损Dead Negative 1=存活Living 预测变量分类
Classification of predicted varietyPositive
0=枯损DeadTPR 83.6%(A=0.08) FPR 17.4%(A=0.08) 82.3%(B=0.06) 17.9%(B=0.06) 32.4%(C=0.5) 0.8%(C=0.5) 86.1%(D=0.1) 10%(D=0.1) Negative
1=存活LivingFNR 16.4%(A=0.08) TNR 82.6%(A=0.08) 17.7%(B=0.06) 82.1%(B=0.06) 67.6%(C=0.5) 99.2%(C=0.5) 13.9%(D=0.1) 90.0%(D=0.1) 注:A、B、C、D为阈值点。Note:A, B, C, D are threshold points.
下载: 导出CSV
表 10 杂种落叶松人工幼龄林枯损模型不同阈值预测分类率
Table 10 Classification of the hybrid larch young plantation mortality model for four cut points
阈值Threshold ACR MCR A=0.08 82.9% 33.7% B=0.06 82.1% 35.7% C=0.5 81.2% 68.4% D=0.1 88.9% 23.9% 注:ACR(正确分类率):正确预测枯损与存活株数占总株数比率; MCR(错误分类率):假阳性率与假阴性率之和。Notes:ACR(accurate classification rate): correctly predicting the ratio of mortality and living trees to total trees; MCR(misclassification rate): the sum of false positive rate and false negative rate.
下载: 导出CSV
-
[1] Lee Y. Predicting mortality for even-aged stands of lodgepole pine[J]. Forestry Chronicle, 1971, 47(1): 29-32. doi: 10.5558/tfc47029-1
[2] Monserud R A. Simulation of forest tree mortality[J]. Forest Science, 1976, 22(4): 438-444. http://www.wanfangdata.com.cn/details/detail.do?_type=perio&id=27cd8e1c01b09035a0e01da9c977b662
[3] Dobbertin M, Biging G S. Using the non-parametric classifier CART to model forest tree mortality[J]. Forest Science, 1998, 44(4): 507-516. http://cn.bing.com/academic/profile?id=ef7fa14c88e4a482568ef57ea1be12d4&encoded=0&v=paper_preview&mkt=zh-cn
[4] Lutz J A, Halpern C B.Tree mortality during early forest development: a long-term study of rates, causes, and consequences[J]. Ecological Monographs, 2006, 76(2): 257-275. doi: 10.1890/0012-9615(2006)076[0257:TMDEFD]2.0.CO;2
[5] Yang Y, Titus S J, Huang S. Modeling individual tree mortality for white spruce in Alberta[J]. Ecological Modelling, 2003, 163(3): 209-222. doi: 10.1016/S0304-3800(03)00008-5
[6] Monserud R A, Sterba H. Modeling individual tree mortality for Austrian forest species[J]. Forest Ecology & Management, 1999, 113(2-3): 109-123. doi: 10.1016-S0378-1127(98)00419-8/
[7] 杜纪山.落叶松林木枯损模型[J].林业科学, 1999, 35(2): 45-49. doi: 10.3321/j.issn:1001-7488.1999.02.008 Du J S. Tree mortality model of Larix[J]. Scientia Silvae Sinicae, 1999, 35(2): 45-49. doi: 10.3321/j.issn:1001-7488.1999.02.008
[8] Weiskittel A R, Hann D W, Kershaw J A J, et al. Forest growth and yield modeling[J]. Forest Growth & Yield Modeling, 2002, 7(2): 223-233. http://d.old.wanfangdata.com.cn/NSTLQK/NSTL_QKJJ0232426386/
[9] Das A J. Quantifying tree mortality risk and spatial pattern in a temperate conifer forest[D]. Reston: Dissertations & Theses-Gradworks, 2007.
[10] Yao X H, Titus S J, Macdonald S E. A generalized logistic model of individual tree mortality for aspen, white spruce, and lodgepole pine in Alberta mixedwood forests[J]. Canadian Journal of Forest Research, 2001, 31(2): 283-291. http://www.wanfangdata.com.cn/details/detail.do?_type=perio&id=9fe599164cdf0846f343e8293ace69d1
[11] Eid T, Tuhus E. Models for individual tree mortality in Norway[J]. Forest Ecology & Management, 2001, 154(1-2): 69-84. http://cn.bing.com/academic/profile?id=571ec877488116f8bfa6b0d0333f35af&encoded=0&v=paper_preview&mkt=zh-cn
[12] Temesgen H, Mitchell S J. An individual-tree mortality model for complex stands of southeastern British Columbia[J]. Western Journal of Applied Forestry, 2005, 20(2): 101-109. http://www.wanfangdata.com.cn/details/detail.do?_type=perio&id=d393e9e477757794c57b3388500f6856
[13] Adame P, Río M D, Cañellas I. Modeling individual-tree mortality in Pyrenean oak (Quercus pyrenaica Willd.) stands[J]. Annals of Forest Science, 2010, 67(8): 810. doi: 10.1051/forest/2010046
[14] Holzwarth F, Kahl A, Bauhus J, et al. Many ways to die-partitioning tree mortality dynamics in a near-natural mixed deciduous forest[J]. Journal of Ecology, 2013, 101(1): 220-230. doi: 10.1111/jec.2012.101.issue-1
[15] 向玮, 雷相东, 刘刚, 等.近天然落叶松云冷杉林单木枯损模型研究[J].北京林业大学学报, 2008, 30(6): 90-98. doi: 10.3321/j.issn:1000-1522.2008.06.014 Xiang W, Lei X D, Liu G, et al. Individual tree mortality models for semi-natural larch-spruce-fir forests in Jilin Province, northeastern China[J]. Journal of Beijing Forestry University, 2008, 30(6): 90-98. doi: 10.3321/j.issn:1000-1522.2008.06.014
[16] Hamilton D A. Extending the range of applicability of an individual tree mortality model[J]. Canadian Journal of Forest Research, 1990, 20(8): 1212-1218. doi: 10.1139/x90-160
[17] Misir M, Misir N, Yavuz H. Modeling individual tree mortality for crimean pine plantations[J]. Journal of Environmental Biology, 2007, 28(2): 167-172. http://www.wanfangdata.com.cn/details/detail.do?_type=perio&id=Open J-Gate000001523294
[18] Hamilton D A, Edwards B M. Modeling the probability of individual tree mortality[Stand development][D]. Ogden: Usda Forest Service Research Paper Int, 1976.
[19] 王济川, 郭志刚.Logistic回归模型:方法与应用[M].北京:高等教育出版社, 2001. Wang J C, Guo Z G. Logistic regression models: methods and application[M]. Beijing:Higher Education Press, 2001.
[20] King S L, Bennett K P, List S. Modeling noncatastrophic individual tree mortality using logistic regression, neural networks, and support vector methods[J]. Computers & Electronics in Agriculture, 2000, 27(1-3): 401-406. http://d.old.wanfangdata.com.cn/NSTLQK/NSTL_QKJJ0212219198/
[21] Ma Z H, Peng C, Li W Z, et al. Modeling individual tree mortality rates using marginal and margianl and random effects regression modes[J]. Natural Resource Modeling, 2013, 26(2): 131-153. doi: 10.1111/j.1939-7445.2012.00124.x
[22] Schabenberger O, Pierce F J.Contemporary statistical models for the plant and soil science[M]. Boca Raton: CRC Press, 2001.
[23] Mailly D, Gaudreault M, Picher G, et al. A comparison of mortality rates between top height trees and average site trees[J]. Annals of Forest Science, 2009, 66(2): 202. doi: 10.1051/forest/2008084
[24] 姜立春, 李凤日.混合效应模型在林业建模中的应用[M].北京:科学出版社, 2014. Jiang L C, Li F R. Application of mixed effects models in forestry modeling[M]. Beijing:Science Press, 2014.
[25] Groom J D, Hann D W, Temesgen H. Evaluation of mixed-effects models for predicting Douglas-fir mortality[J]. Forest Ecology & Management, 2012, 276(4): 139-145. http://www.wanfangdata.com.cn/details/detail.do?_type=perio&id=7f010da15b139343e4aa55271e527d2f
[26] Timilsina N, Staudhammer C L. Individual tree mortality model for slash pine in Florida: a mixed modeling approach[J]. Southern Journal of Applied Forestry, 2012, 36(4): 211-219. doi: 10.5849/sjaf.11-026
[27] 王涛, 董利虎, 李凤日.杂种落叶松人工幼龄林林分枯损规律及枯损模型[J].东北林业大学学报, 2017, 45(5): 39-43. doi: 10.3969/j.issn.1000-5382.2017.05.008 Wang T, Dong L H, Li F R. Mortality of stand trees for hybrid larch young plantation in Heilongjiang[J]. Journal of Northeast Forestry University, 2017, 45(5): 39-43. doi: 10.3969/j.issn.1000-5382.2017.05.008
[28] Hein S, Weiskittel A R. Cutpoint analysis for models with binary outcomes: a case study on branch mortality[J]. European Journal of Forest Research, 2010, 129(4): 585-590. doi: 10.1007/s10342-010-0358-3
[29] 祖笑锋, 倪成才, Gorden Nigh, 等.基于混合效应模型及EBLUP预测美国黄松林分优势木树高生长过程[J].林业科学, 2015, 51(3): 25-33. http://d.old.wanfangdata.com.cn/Periodical/lykx201503004 Zu X F, Ni C C, Gorden N, et al. Based on mixed-effects model and empirical best linear unbiased predictor to predict growth profile of dominant height[J]. Scientia Silvae Sinicae, 2015, 51(3): 25-33. http://d.old.wanfangdata.com.cn/Periodical/lykx201503004
[30] Müller J, Hothorn T. Maximally selected two-sample statistics as a new tool for the identification and assessment of habitat factors with an application to breeding-bird communities in oak forests[J]. European Journal of Forest Research, 2004, 123(3): 219-228. doi: 10.1007/s10342-004-0035-5
[31] Hosmer D W, Lemeshow S. Applied logistic regression[M]. New York:John Wiley & Sons, 2000.
[32] Bravooviedo A, Sterba H, Mdel R, et al. Competition-induced mortality for Mediterranean Pinus pinaster Ait. and P. sylvestris L.[J]. Forest Ecology & Management, 2006, 222(1): 88-98. https://www.sciencedirect.com/science/article/pii/S0378112705006079
[33] Chen H, Fu S, Roberta M, et al. Relative size and stand age determine Pinus banksiana mortality[J]. Forest Ecology & Management, 2008, 255(12): 3980-3984. http://d.old.wanfangdata.com.cn/NSTLQK/NSTL_QKJJ0210058055/
[34] Crecente-campo F, Marshall P, Rodríguezsoalleiro R. Modeling non-catastrophic individual-tree mortality for Pinus radiata plantations in northwestern Spain[J]. Forest Ecology & Management, 2009, 257(6): 1542-1550. http://www.wanfangdata.com.cn/details/detail.do?_type=perio&id=52aa55cb3afb30a45744cd02c3cf07a6
[35] Bolker B M, Brooks M E, Clark C J, et al. Generalized linear mixed models: a practical guide for ecology and evolution[J]. Trends in Ecology & Evolution, 2009, 24(3): 127-135. http://cn.bing.com/academic/profile?id=e34c66cac76c514a9d459aa122d42bcd&encoded=0&v=paper_preview&mkt=zh-cn
[36] 张含国, 张成林, 兰士波, 等.落叶松杂种优势分析及家系选择[J].南京林业大学学报(自然科学版), 2005, 29(3): 69-72. doi: 10.3969/j.issn.1000-2006.2005.03.017 Zhang H G, Zhang C L, Lan S B, et al. The analysis and selection for families of hybrid larch[J]. Journal of Nanjing Forestry University(Natural Sciences Edition), 2005, 29(3): 69-72. doi: 10.3969/j.issn.1000-2006.2005.03.017
[37] 杨书文, 鞠永贵, 张世英, 等.落叶松杂种优势的研究[J].东北林业大学学报, 1985, 13(1): 30-36. http://d.old.wanfangdata.com.cn/Periodical/lykj201306004 Yang S W, Jin Y G, Zhang S Y, et al. Research on larch hybrid vigor[J]. Journal of Northeast Forestry University, 1985, 13(1): 30-36. http://d.old.wanfangdata.com.cn/Periodical/lykj201306004
-
期刊类型引用(10)
1. 袁玉虹,何天友. 氮磷钾配比施肥对短葶山麦冬生长及有效成分的影响. 九江学院学报(自然科学版). 2024(01): 123-128 .  百度学术
百度学术
2. 王晓荣,胡兴宜,龚苗,付甜,庞宏东,杨佳伟. 长江中下游地区28个常见乡土树种幼苗光合固碳能力比较. 湖北农业科学. 2023(01): 112-117 . 百度学术
3. 汤靖文,李晨晞,彭政淋,苏嘉熙,卫星. 氮磷钾肥对水曲柳雌雄株叶片光合生理及化学计量特征的影响. 森林工程. 2023(02): 30-38+46 . 百度学术
4. 景娜,高玉红,张巧霞,文明,徐鹏,崔政军,吴兵,剡斌,王一帆. 氮肥运筹对旱地胡麻同化物形成及籽粒产量的调控效应. 生态学杂志. 2023(07): 1644-1652 . 百度学术
5. 李川,王玉书,黄小辉. 钙、镁缺乏对核桃生长和光合特性的影响. 福建林业. 2023(04): 38-41 . 百度学术
6. 黄小辉,吴焦焦,魏立本,王玉书,冯大兰,张宏. 不同缺素条件下核桃幼苗的生长和生理变化. 北京林业大学学报. 2023(09): 33-41 . 本站查看
7. 尹梦雅,李志辉,杨艳,李昌珠,汤玉喜,唐洁,秦平书,吴兴华. 施肥对黄栀子幼苗生长与光合特性的影响. 东北林业大学学报. 2022(05): 32-36 . 百度学术
8. 唐新瑶,亢亚超,梁喜献,马道承,王凌晖. 氮磷钾配比施肥对观光木幼苗生理与光合特性的影响. 西北林学院学报. 2022(04): 37-42 . 百度学术
9. 李林珂,王一诺,薛潇,张文,吴焦焦,高岚,谭星,荣星宇,段儒蓉,刘芸. 黄栌光合和呈色特性对重庆阴雨天气的响应. 南京林业大学学报(自然科学版). 2022(05): 95-103 . 百度学术
10. 高恩婷,曾庆扬,谷战英,卢雨析,李扬,冯楠可,熊荟璇,张春来,曾乐景. 不同间作模式对山苍子光合特性及其栽培土壤水分和养分的影响. 经济林研究. 2022(04): 61-71 . 百度学术
其他类型引用(16)


计量
- 文章访问数: 2275
- HTML全文浏览量: 536
- PDF下载量: 54
- 被引次数: 26
