
Establishment of the flowering phenological model of Xanthoceras sorbifolium based on accumulated temperature
-
摘要:目的建立不同地区及不同类型的文冠果物候模型,为文冠果的经营活动和旅游管理提供理论依据。方法以北京市大东流苗圃文冠果3个遗传类型:白花类型及“金冠霞帔”“匀冠锦霞”两个文冠果新品种为研究对象,于2017年进行了花期表型调查与物候的观测,结合全国文冠果主要分布区的8个省份15个地点白花文冠果初花期、盛花期、末花期的观测数据,应用中国气象数据网上共享气象数据,对花性状与3个开花物候期进行了时间和空间尺度上的分析。结果(1)3个不同花色遗传类型开花先后顺序为白花类型、“金冠霞帔”“匀冠锦霞”,物候期差异显著或极显著,花序生长随0、3、5、7、10 ℃积温的变化与Logistic生长模型拟合结果较好;花朵数随时间和积温的变化与二次多项式模型拟合较好;(2)各个地区之间同一积温指数各物候期所需积温相差不大,不同积温指数所需积温有显著性差异;不同积温指数和不同物候时期都对物候所需积温影响差异极显著,两个因素交互作用影响差异极显著;(3)5 ℃积温指数(即温暖指数)与物候期日序具有高度相关性,可用于花期预测;(4)白花类型文冠果3个物候期5 ℃积温的日序与经纬度、海拔呈极显著的多元线性回归关系,各观测地点日序的回归模拟值与观测值单因素方差分析证实该回归模型可用于花期预测;(5)用克里金插值法,采用上述预测模型,绘制白花文冠果3个开花物候期的时空分布图。结论基于5 ℃积温指数(即温暖指数)建立的积温模型可用于文冠果花期预测。Abstract:Objective Establishing different regions and different types of phenology model aims to provide theoretical basis for tourism and business activity management.Method We choose the three genetic types of the Dadongliu Nursery Garden in Beijing, i.e., the white flower; the new varieties as ‘Jinguanxiapei’ and ‘Junguanjinxia’ as the research objects and performed the observation of flowering phenotypes in 2017. Referring to the observed data of the early flowering stage, the full flowering stage and late flowering stage of the white yellowhorn in 15 different locations of 8 provinces in main distribution area of Xanthoceras sorbifolium, we used the sharing meteorological data from the Chinese meteorological data website to analyze floral traits and three flowering phenology periods in different space-time scales.Result (1) The flowering sequences of three different genetic types of yellowhorn, i.e., the white flower, " Jinguanxiapei” and " Junguanjinxia” as well as the differences in phenological period were significant or extremely significant. In addition, the changes of inflorescence growth with 0, 3, 5, 7, and 10 ℃ accumulative temperature fit the Logistic growth model better and the number of flowers changed with time and accumulative temperature fit the quadratic polynomials better. (2) The required accumulated temperature for each phenology in different locations with same accumulated temperature index showed no difference, the required accumulated temperature in different accumulated temperature index showed significant difference. However, both accumulated temperature index and phenology showed significant influence on required accumulated temperature and there was a significant difference on interaction between them. (3) The 5 ℃ cumulative temperature index (the warmth index) was highly correlated with the phenological date and could be used for flowering prediction. (4) The 5 ℃ accumulated temperature date of three flowering phenologies of white flowers showed an extremely significant multivariable regression relationship with longitude, latitude and altitude. The one-way ANOVO and simulated values at different observation sites confirmed that this regression model could be used for flowering prediction. (5) The Krisking model can be used to draw the space-time distribution maps of the three flowering phenologies of the white flower yellowhorn.Conclusion The flowering phenological model of Xanthoceras sorbifolium based on 5 ℃ cumulative temperature index (the warmth index) can be used to predict flowering period.
-
-
![]()
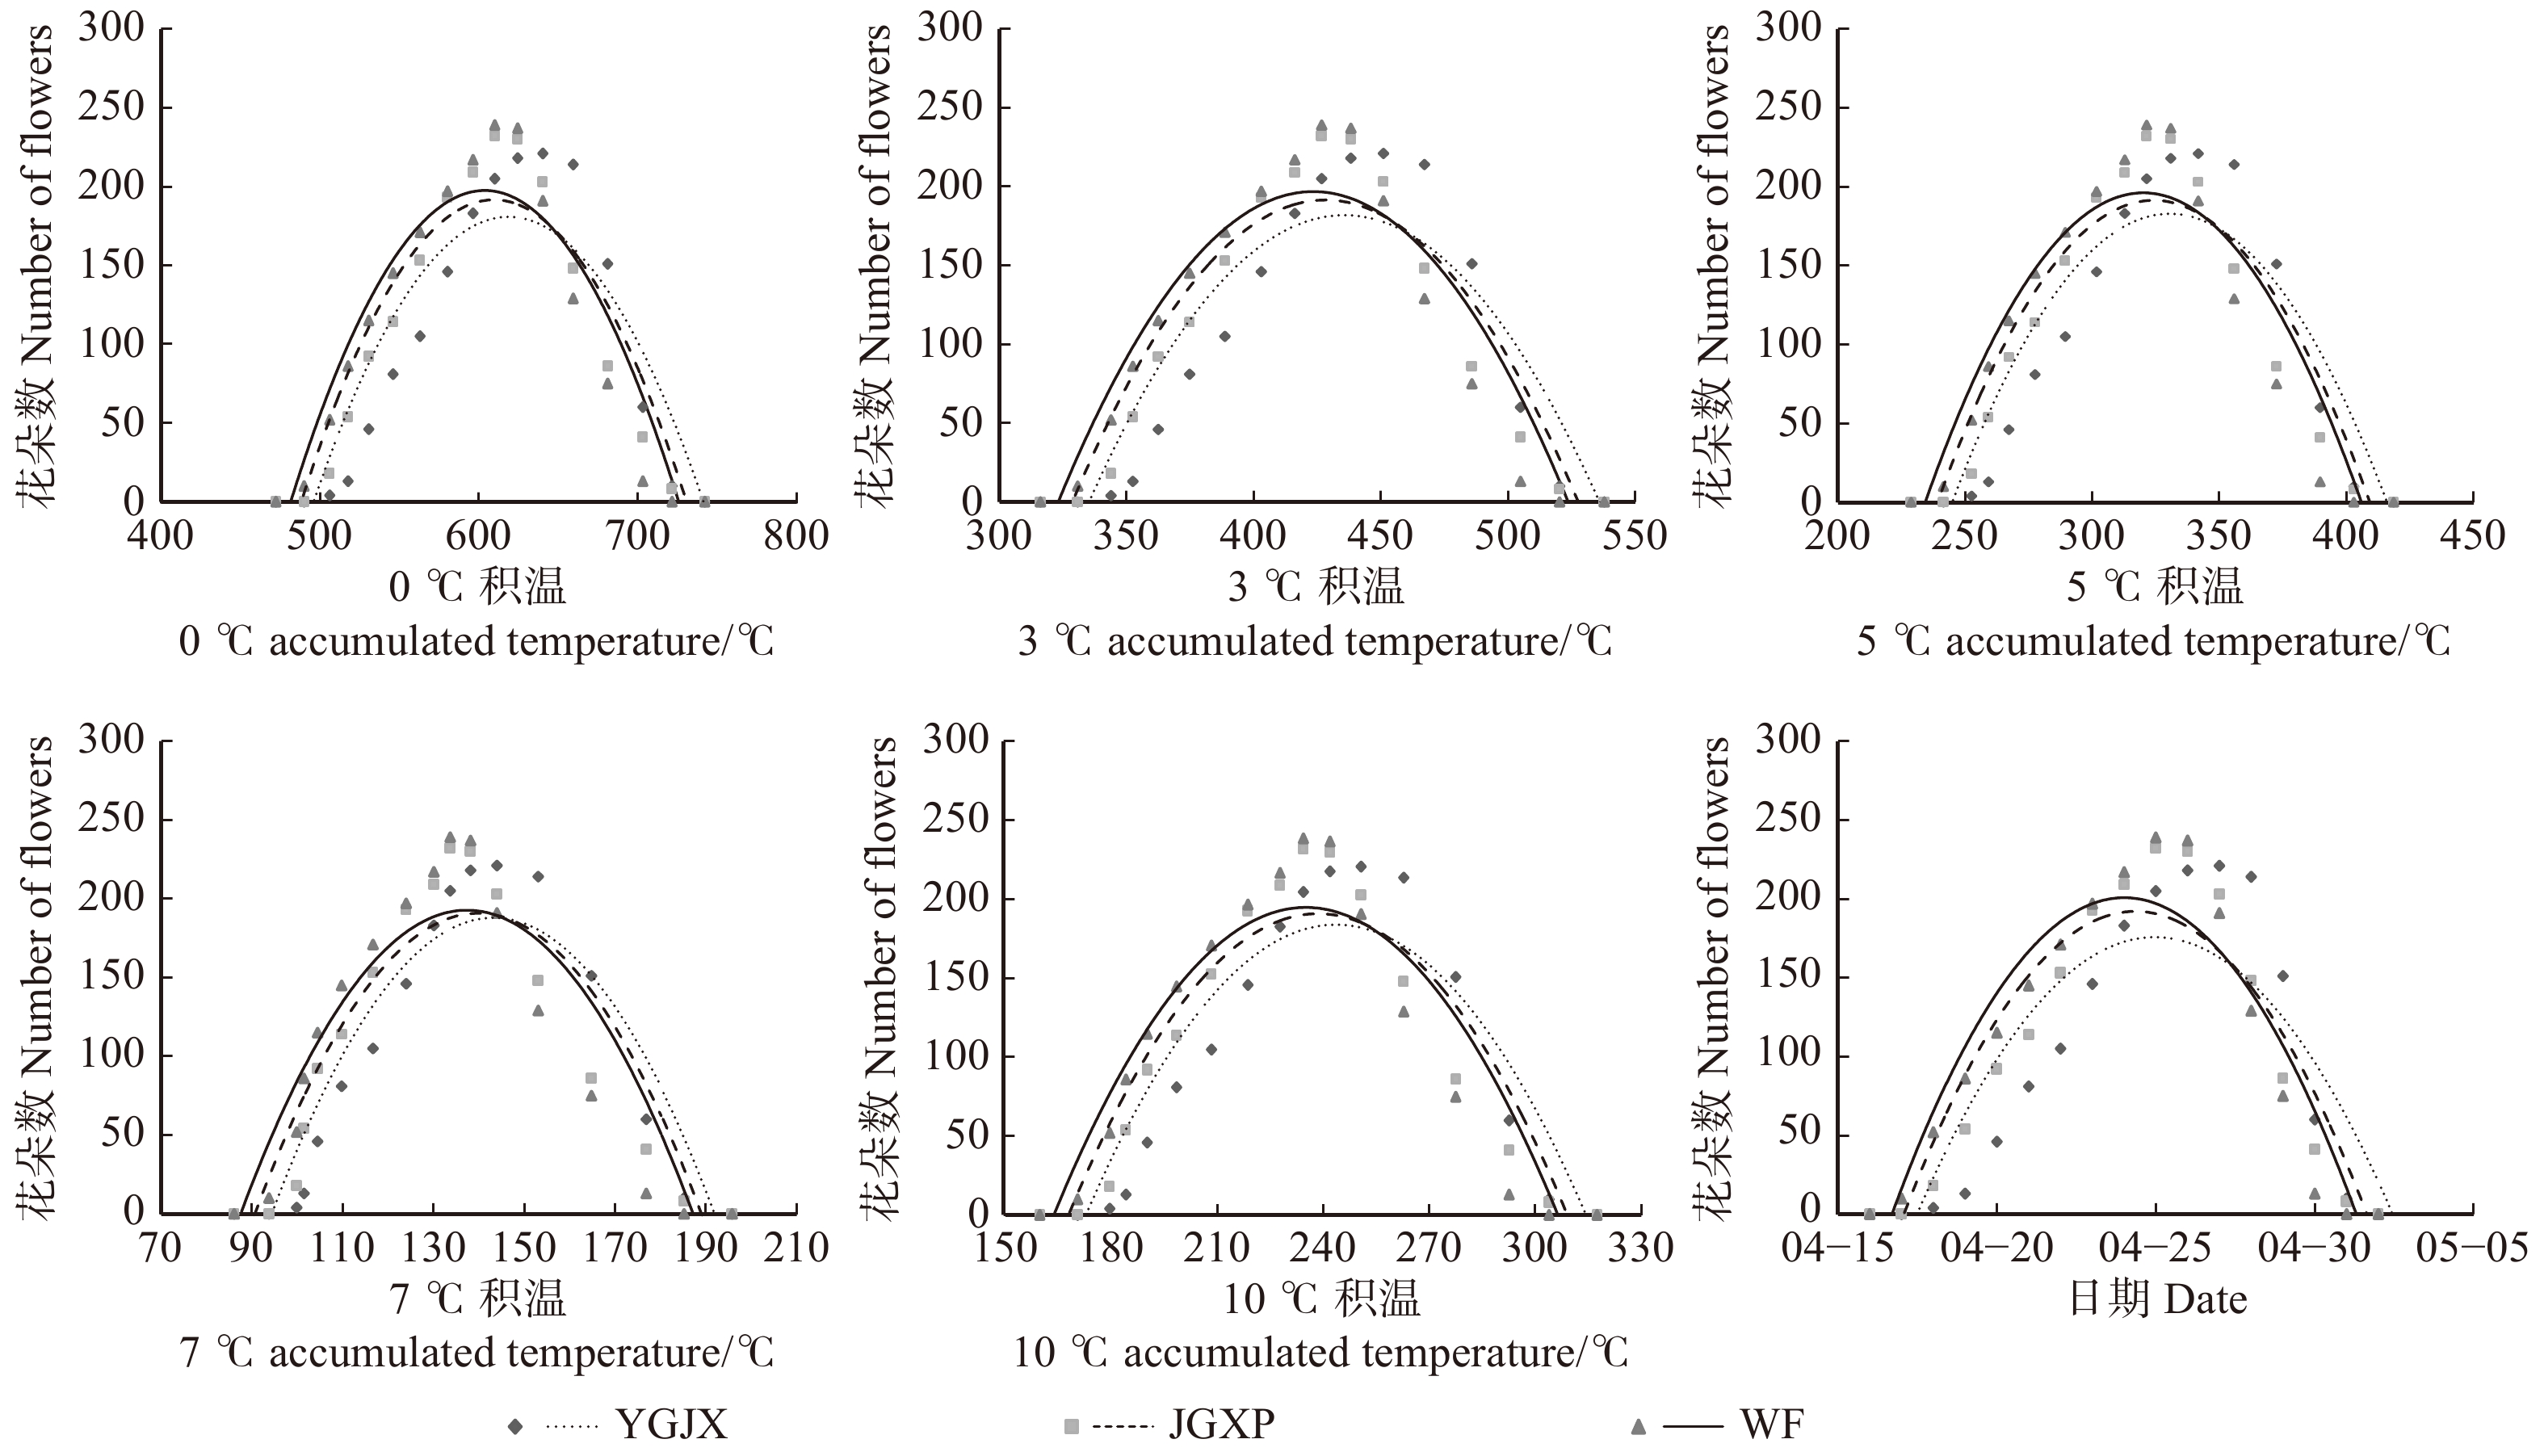
图 2 不同花色文冠果花朵数与积温和日期的拟合曲线
Figure 2. Change of flower numbers for yellowhorn and its coeerlation and linear fitting with accumulated temperature and date
![]()
图 3 不同花色花序长度随积温和时间变化的Logistic模型
Figure 3. Change of inflorescence length for yellowhorn and its coeerlation and linear fitting with accumulated temperature and day number
![]()
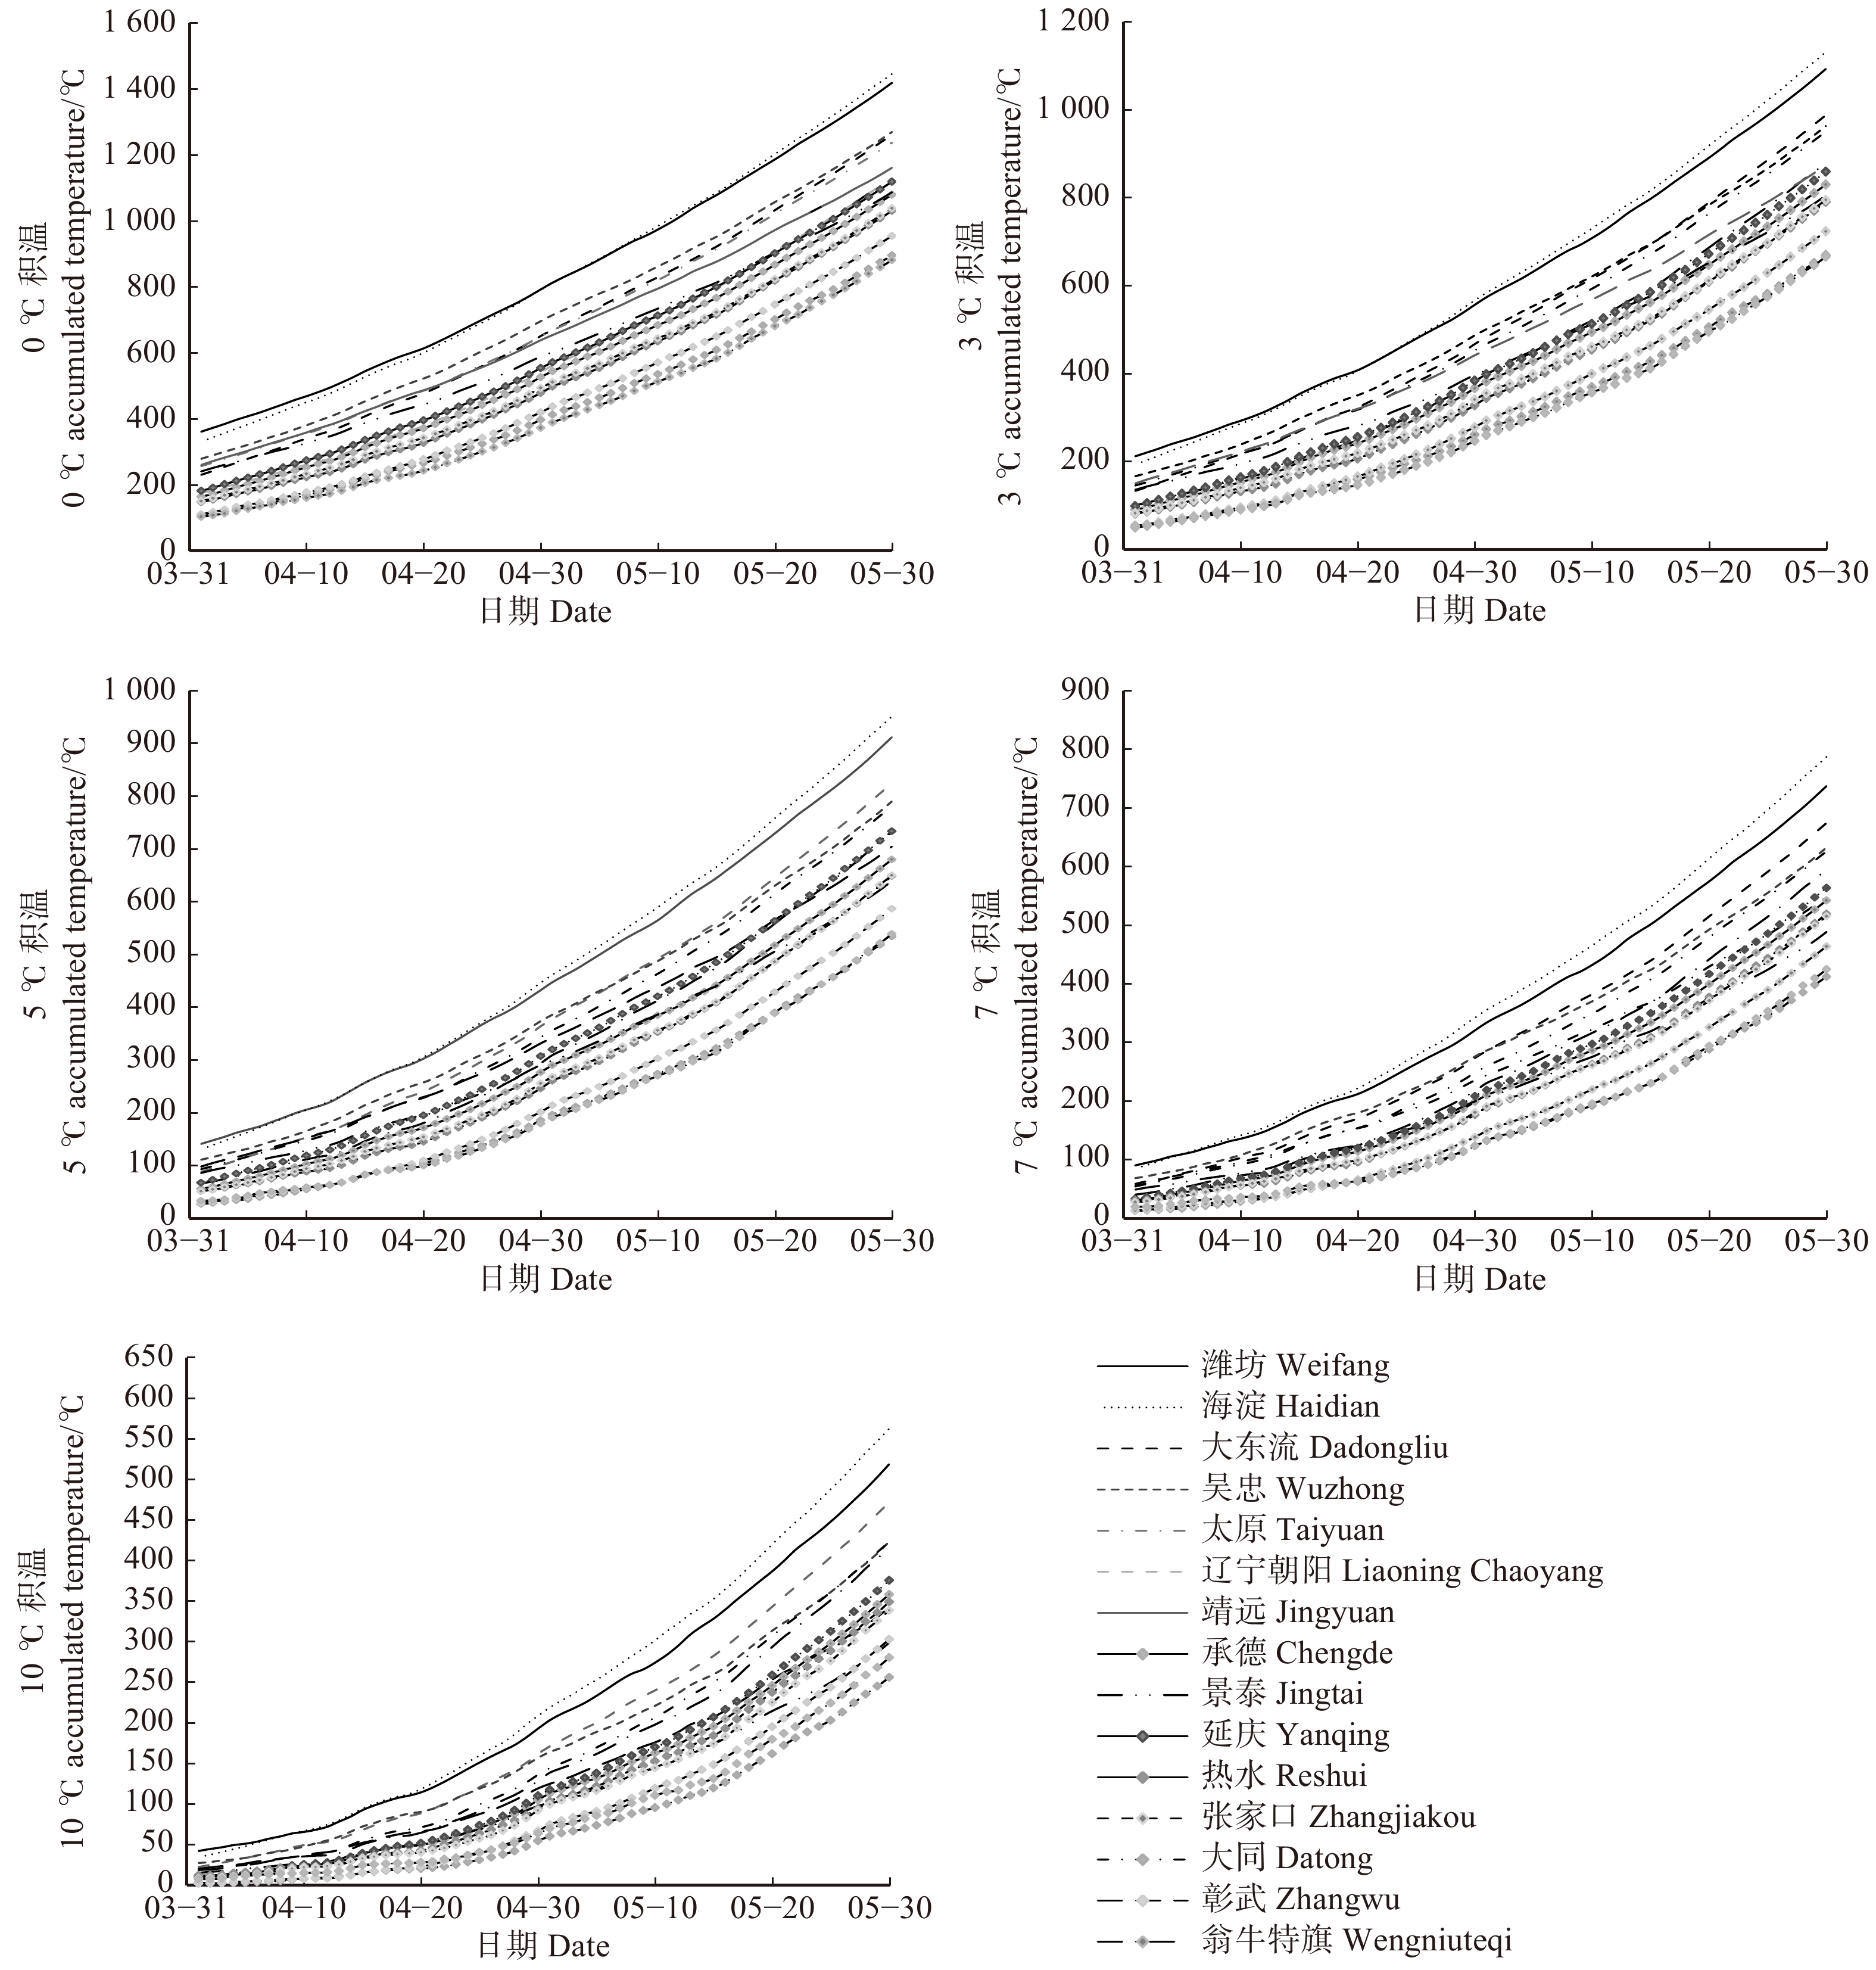
图 4 15个地区5年平均各积温线
Figure 4. 5-year average accumulated temperature for the 15 districts
![]()
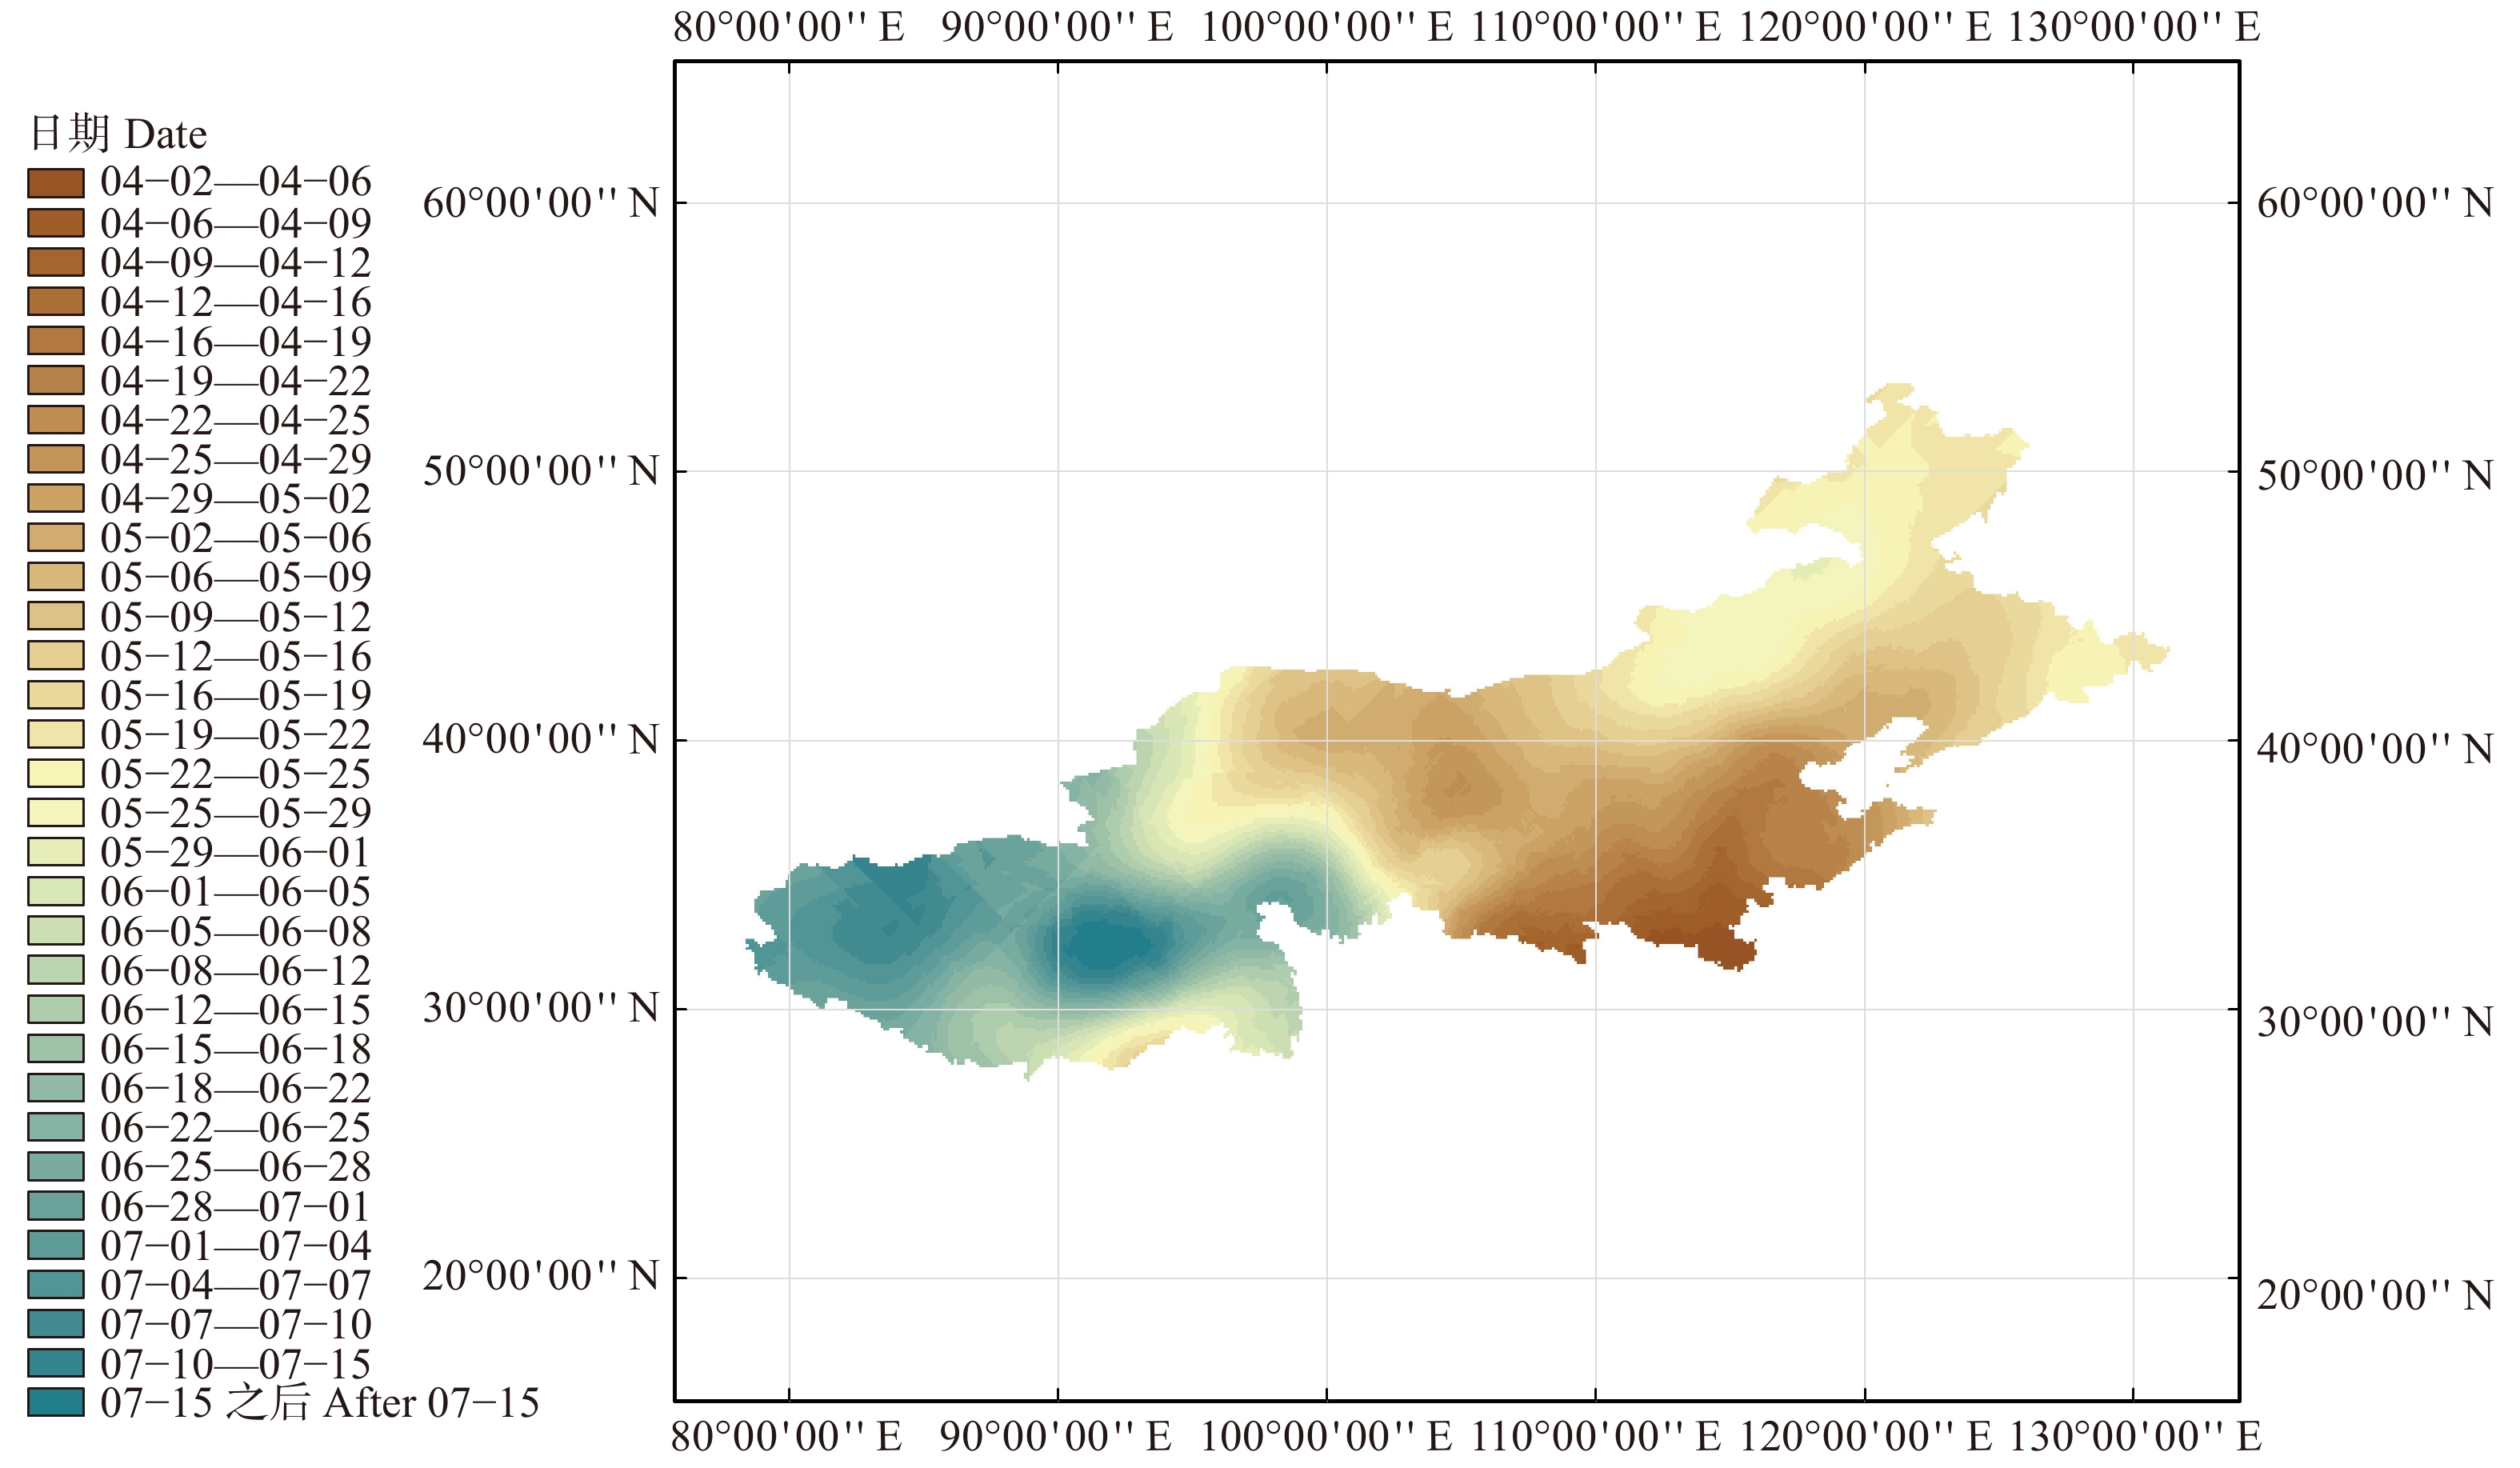
图 5 全国文冠果初花期时空分布预测
Figure 5. Prediction of spatial and temporal distribution of early blooming period of yellowhorn
![]()
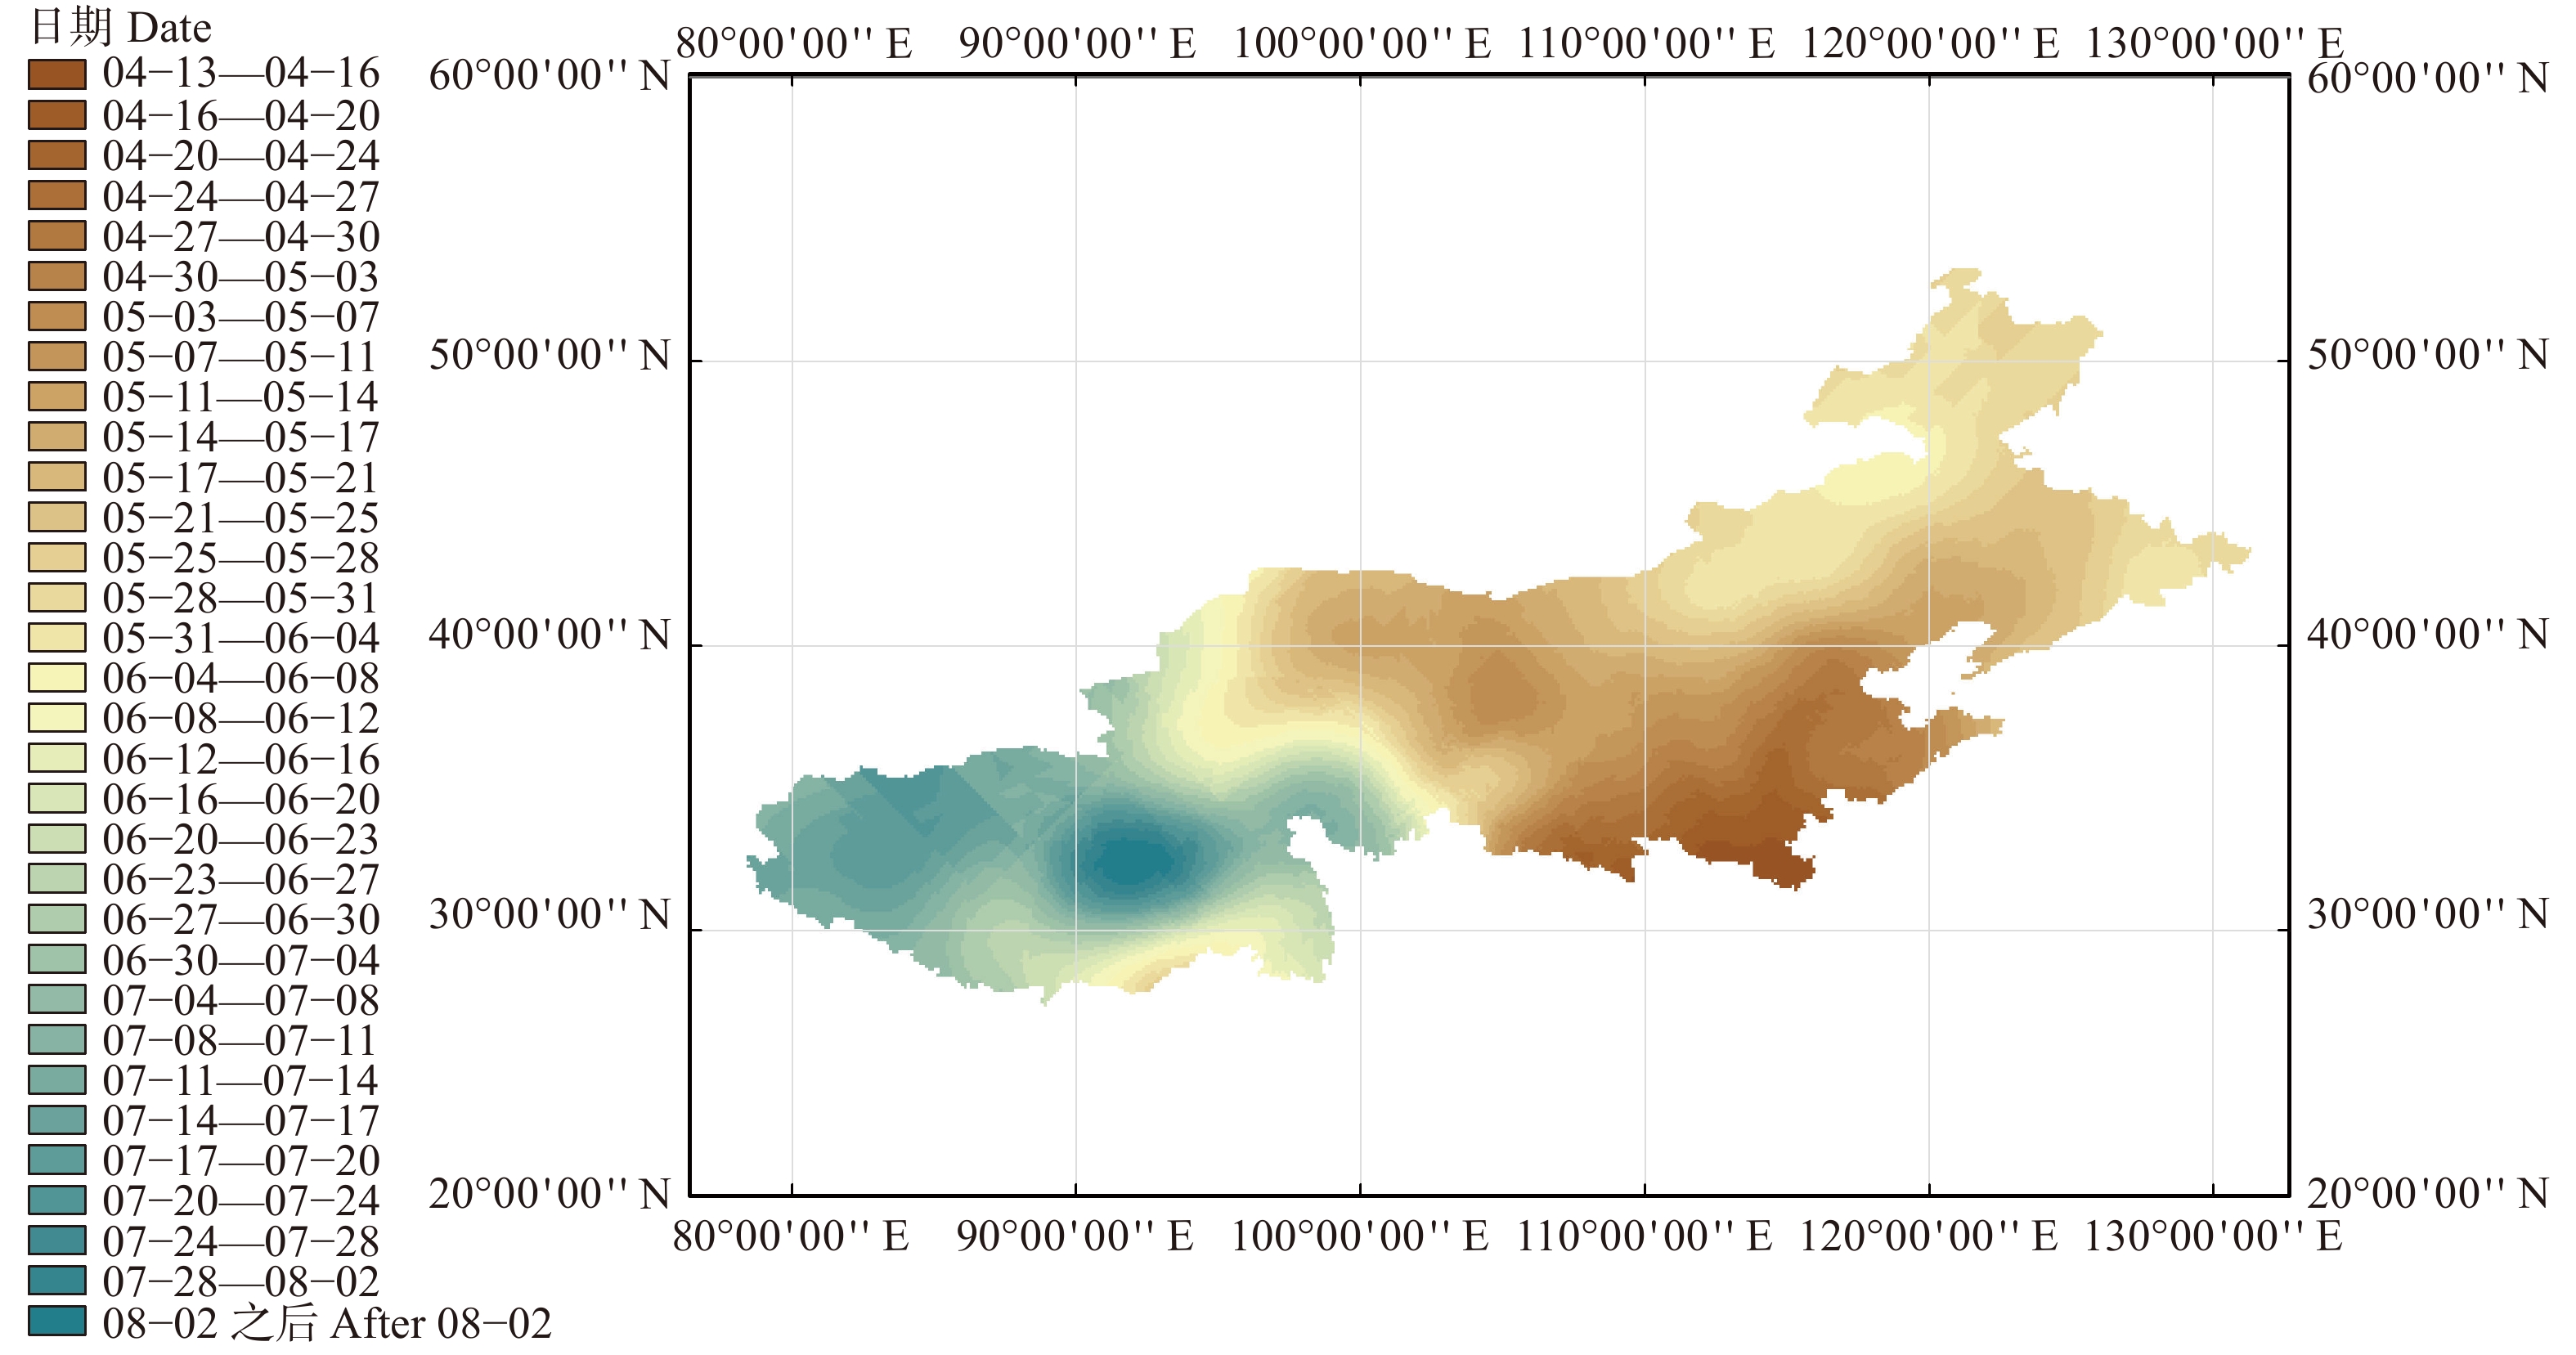
图 6 全国文冠果盛花期时空分布预测
Figure 6. Prediction of spatial and temporal distribution of full blossom period of yellowhorn
![]()
图 7 全国文冠果末花期时空分布预测
Figure 7. Prediction of spatial and temporal distribution of final flowering period of yellowhorn
表 1 3种类型文冠果平均开花物候期及多重比较
Table 1 Average flowering time of three types of yellowhorn and multiple comparisons
物候期
Phenological phase类型
Type平均日序
Average day number初花期 Early blooming period YGJX 19.78 ± 1.30a JGXP 18.33 ± 0.50a WF 17.78 ± 0.97b 盛花期 Full blossom period YGJX 20.67 ± 1.41a JGXP 21.33 ± 10.00ab WF 22.22 ± 1.09b 末花期 Final flowering period YGJX 29.33 ± 0.71a JGXP 30.11 ± 0.78b WF 30.67 ± 0.50b 注:YGJX.‘匀冠锦霞’;JGXP.‘金冠霞帔’;WF.白花。不同小写字母表示差异显著(P < 0.05),日序用连续变量表示(从4月1日记起,4月1日记为1,4月2日记为2,⋯,以此类推)。Notes: YGJX, Xanthoceras sorbifolium cv.‘Yunguanjinxia’; JGXP, X. sorbifolium cv. ‘Jinguanxiapei’; WF, white flower. Different lowercases mean significant difference at P < 0.05 level, and the day number is represented by continuous variables (starting from April 1st, April 1st is recorded as 1, April 2nd is recorded as 2,⋯, and so on).  下载: 导出CSV
表 2 不同花色文冠果花朵数变化与积温和时间的二次多项式模型
Table 2 A quadratic polynomial model of variation and accumulation of temperature and time of different flower colors of yellowhorn
自变量
Independent
variable因变量
Dependent
variable参数 Parameter 模型 Model 系数a
Coefficient a系数b
Coefficient b常数A
Constant A方程
EquationF Sig. 0 ℃ YGJX 14.883** − 0.012** − 4 422.569 Y = 14.833t − 0.012t2 − 4 422.569 28.877 ** JGXP 15.91** − 0.013** − 4 656.348 Y = 15.91t − 0.013t2 − 4 656.348 49 ** WF 16.013** − 0.013** − 4 635.468 Y = 16.013t − 0.013t2 − 4 635.468 50 ** 3 ℃ YGJX 15.736** − 0.018** − 3 244.867 Y = 15.736t − 0.018t2 − 3 244.867 31.147 ** JGXP 17.581** − 0.019** − 3 357.824 Y = 17.581t − 0.019t2 − 3 357.824 48.844 ** WF 17.579** − 0.02** − 3 312.383 Y = 17.579t − 0.02t2 − 3 312.383 47.917 ** 5 ℃ YGJX 17.517 − 0.025 − 2 545.662 Y = 17.517t − 0.025t2 − 2 545.662 33.347 ** JGXP 17.175 − 0.026 − 2 592.188 Y = 17.175t − 0.026t2 − 2 592.188 48.079 ** WF 17.066 − 0.027 − 2 534.785 Y = 17.066t − 0.027t2 − 2 534.785 45.434 ** 7 ℃ YGJX 22.581 − 0.079 − 1 428.913 Y = 22.581t − 0.079t2 − 1 428.913 43.388 ** JGXP 22.107 − 0.079 − 1 354.315 Y = 22.107t − 0.079t2 − 1 354.315 38.497 ** WF 21.334 − 0.078 − 1 272.325 Y = 21.334t − 0.078t2 − 1 272.325 31.853 ** 10 ℃ YGJX 17.918 − 0.037 − 1 997.914 Y = 17.918t − 0.037t2 − 1 997.914 36.444 ** JGXP 18.305 − 0.038 − 1 991.451 Y = 18.305t − 0.038t2 − 1 991.451 46.206 ** WF 18.036 − 0.038 − 1 924.551 Y = 18.036t − 0.038t2 − 1 924.551 41.657 ** 日序 Day number YGJX 156.854 − 3.142 − 1 782.115 Y = 156.854t − 3.142t2 − 1 782.115 19.782 ** JGXP 176.402 − 3.622 − 1 955.656 Y = 176.402t − 3.622t2 − 1 955.656 42.735 ** WF 180.808 − 3.766 − 1 969.161 Y = 180.808t − 3.766t2 − 1 969.161 52.779 ** 注:**表示在P < 0.01水平上差异显著。下同。Notes: ** means significant difference at P < 0.01 level. The same below.
下载: 导出CSV
表 3 不同花色文冠果花序长度变化与积温和时间的Logistic模型
Table 3 Logistic model of inflorescence length for yellowhorn and its coeerlation and linear fitting with accumulated temperature and date
自变量
Independent
variable因变量
Dependent
variable参数 Parameters 模型 Model 常数A
Constant A系数k
Coefficient k系数B
Coefficient B方程
EquationF Sig. 0 ℃ YGJX 195.96 0.018** 1 564.74* Y = 195.96/(1 + 1 564.74e^(− 0.018t)) 456.664 ** JGXP 223.45 0.034** 861 289.14 Y = 223.45/(1 + 861 289.14e^(− 0.034t)) 148.733 ** WF 207.075 0.022** 10 988.85 Y = 207.075/(1 + 10 988.85e^(− 0.022t)) 509.331 ** 3 ℃ YGXP 195.96 0.022** 372.91* Y = 195.96/(1 + 372.91e^(− 0.022t)) 462.891 ** JGXP 223.45 0.042** 55 810.21* Y = 223.45/(1 + 55 810.21e^(− 0.042t)) 153.248 ** WF 207.075 0.027** 1 783.95* Y = 207.075/(1 + 1 783.95e^(− 0.027t)) 512.382 ** 5 ℃ YGJX 195.96 0.026** 141.29** Y = 195.96/(1 + 141.29e^(− 0.026t)) 465.164 ** JGXP 223.45 0.05** 8 765.72* Y = 223.45/(1 + 8 765.72e^(− 0.05t)) 156.395 ** WF 207.075 0.033** 521.62* Y = 207.075/(1 + 521.62e^(− 0.033t)) 510.585 ** 7 ℃ YGJX 195.96 0.033** 61.14** Y = 195.96/(1 + 61.14e^(− 0.033t)) 461.41 ** JGXP 223.45 0.062** 1 776.65* Y = 223.45/(1 + 1 776.65e^(− 0.062t)) 160.364 ** WF 207.075 0.041** 180.36** Y = 207.075/(1 + 180.36e^(− 0.041t)) 499.611 ** 10 ℃ YGJX 195.96 0.049** 24.50** Y = 195.96/(1 + 24.50e^(− 0.049t) ) 411.135 ** JGXP 223.45 0.094** 311.04* Y = 223.45/(1 + 311.04e^(− 0.094t)) 166.454 ** WF 207.075 0.063** 56.32** Y = 207.075/(1 + 56.32e^(− 0.063t)) 427.489 ** 日序 Day number YGJX 195.96 0.274** 30.96** Y = 195.96/(1 + 30.96e^(− 0.274t)) 397.143 ** JGXP 223.45 0.523** 468.13* Y = 223.45/(1 + 468.13e^(− 0.523t)) 132.709 ** WF 207.075 0.348** 76.20** Y = 207.075/(1 + 76.20e^(− 0.348t)) 451.133 ** 注:*表示在P < 0.05水平上差异显著。Note: * means significant difference at P < 0.05 level.
下载: 导出CSV
表 4 观测地区不同年份不同积温单因素方差分析
Table 4 One-way ANOVA result of diversity of accumulated temperature in different years
积温类别
Accumulated temperature自由度 df 单因素方差分析
One-way ANOVA显著度
Significance组间 Between groups 组内 Within group 0 ℃ 4 4 570 29.681 ** 3 ℃ 4 4 570 34.593 ** 5 ℃ 4 4 570 37.117 ** 7 ℃ 4 4 570 34.035 ** 10 ℃ 4 4 570 21.727 **
下载: 导出CSV
表 5 15个地区各开花物候期所需积温
Table 5 Average accumulated temperature in different phenological periods of yellowhorn
积温
Accumulated temperature物候期
Phenological period观测数
Number平均值 ± 标准差
Mean ± SD/℃最大值
Max./℃最小值
Min./℃变异系数
CV/℃平均值
Mean/℃0 ℃ 初花期 Early blooming period 15 508.13 ± 26.55 540.8 454.4 5.23 590.63 ± 13.33a 盛花期 Full blossom period 15 557.57 ± 26.98 590.4 500.8 4.84 末花期 Final flowering period 15 706.19 ± 30.44 745.4 642.1 4.31 3 ℃ 初花期 Early blooming period 15 347.71 ± 18.10 372.6 311.9 5.2 415.21 ± 10.79b 盛花期 Full blossom period 15 388.15 ± 18.86 415 349.3 4.86 末花期 Final flowering period 15 509.77 ± 23.14 548.2 463.6 4.54 5 ℃ 初花期 Early blooming period 15 257.36 ± 13.19 276.2 234.7 5.1 314.86 ± 61.41c 盛花期 Full blossom period 15 291.80 ± 14.38 312.6 266.1 4.93 末花期 Final flowering period 15 395.42 ± 20.15 428.3 362.4 5.1 7 ℃ 初花期 Early blooming period 15 179.67 ± 10.70 193.8 160.1 6 227.17 ± 51.04d 盛花期 Full blossom period 15 208.11 ± 11.90 224.2 189 5.72 末花期 Final flowering period 15 293.73 ± 19.40 322 263.6 6.6 10 ℃ 初花期 Early blooming period 15 88.19 ± 10.57 107 67.2 1.2 120.74 ± 36.20e 盛花期 Full blossom period 15 107.63 ± 10.80 126.5 88.6 1 末花期 Final flowering period 15 166.39 ± 18.42 196.4 138 1.11
下载: 导出CSV
表 6 白花文冠果不同地区开花所需积温的单因素方差分析
Table 6 One-way ANOVA result of diversity district for the accumulated temperature of flowering phenophase
项目 Item SS df MS F P 组间 Between groups 53 516.518 14 3 822.608 0.119 1.000 组内 Within group 6 751 560.268 210 32 150.287 总计 Total 6 805 076.786 224
下载: 导出CSV
表 7 白花文冠果的不同物候期和积温指数的双因素方差分析
Table 7 Two-way ANOVA result of diversity type of accumulated temperature and flowering phenophase district for the accumulated temperature of flowering phenophase
因子 Factor SS df MS F P R2 积温类型 Accumulated temperature 5 837 033.32 4 1 459 258.33 3 933.08 < 0.01 0.988 物候期 Phenological period 774 916.82 2 387 458.41 1 044.30 < 0.01 积温类型 × 物候期 Accumulated temperature × phenological period 67 720.14 8 8 465.02 22.82 < 0.01 误差 ERR 77 914.51 210 371.02 总计 Total 31 815 551.69 225 修正后总计 Total after correction 6 757 584.79 224
下载: 导出CSV
表 8 开花日序与各积温相关性分析
Table 8 Analysis of correlation between flowering day number and accumulated temperature
指标
Factor日序
Day number0 ℃积温
0 ℃ accumulated temperature3 ℃积温
3 ℃ accumulated temperature5 ℃积温
5 ℃ accumulated temperature7 ℃积温
7 ℃ accumulated temperature10 ℃积温
10 ℃ accumulated temperature日序
Day number1 0 ℃积温
0 ℃ accumulated temperature− 0.948** 1 3 ℃积温
3 ℃ accumulated temperature− 0.955** 0.996** 1 5 ℃积温
5 ℃ accumulated temperature− 0.956** 0.985** 0.995** 1 7 ℃积温
7 ℃ accumulated temperature0.969** 0.982** 0.995** 1 10 ℃积温
10 ℃ accumulated temperature− 0.915** 0.948** 0.960** 0.975** 0.983** 1 注:**表示在P < 0.01水平上显著。Notes: ** means significant difference at P < 0. 01 level.
下载: 导出CSV
表 9 日序与积温逐步回归模型排除的变量
Table 9 Flowering day number and variables excluded from accumulated temperature stepwise regression model
积温
Accumulated temperature系数β
Coefficient βt检验
t test显著性
Sig.偏相关
Partial correlation共线性统计 Collinearity statistics 容差
Tolerance方差膨胀因子
VIF最小容差
Min tolerance0 ℃ − 0.206 − 0.388 0.705 − 0.111 0.03 32.818 0.03 3 ℃ − 0.398 − 0.426 0.678 − 0.122 0.01 102.301 0.01 7 ℃ 0.829 0.961 0.356 0.267 0.011 92.487 0.011 10 ℃ 0.462 1.159 0.269 0.317 0.049 20.381 0.049
下载: 导出CSV
表 10 日序与积温逐步回归模型检验
Table 10 The test of the day number of flowering and accumulated temperature stepwise regression model
积温 Accumulated temperature 系数 Coefficient 方程 Equation 系数 Coefficient 值 Value t P F P R2 5 ℃ k 42.580 22.892 0 111.9 <0.001 0.896 a − 0.215 − 10.578 0
下载: 导出CSV
表 11 全国地区文冠果初花期日序与经纬度海拔回归模型
Table 11 The day number and latitude and longitude elevation regression model of early flowering stage of Xanthoceras sorbifolium in China
时期
Phenological period参数 Parameters 模型 Model 系数a
Coefficient a系数b
Coefficient b系数c
Coefficient c常数A
Constant A方程
EquationF Sig. 初花期
Early blooming period− 0.215** 0.07** 0.01** 113.922** y = − 0.215x1 + 0.07x2 + 0.01x3 + 113.922 55.906 ** 盛花期
Full blossom period− 0.221** 0.072** 0.011** 117.651** y = − 0.221x1 + 0.072x2 + 0.011x3 + 117.651 57.777 ** 末花期
Final flowering period− 0.243** 0.079** 0.011** 127.007** y = − 0.243x1 + 0.079x2 + 0.011x3 + 127.007 66.2 ** 注:x1表示纬度,x2表示经度,x3表示海拔。Notes: x1, latitude; x2, longitude; x3, altitude.
下载: 导出CSV
-
[1] 吴征镒, 孙航, 周浙昆, 等. 中国植物区系中的特有性及其起源和分化[J]. 云南植物研究, 2005, 27(6):577−604. doi: 10.3969/j.issn.2095-0845.2005.06.001 Wu Z Y, Sun H, Zhou Z K, et al. Origin and differentiation of endemism in the Flora of China[J]. Acta Botanica Yunnanica, 2005, 27(6): 577−604. doi: 10.3969/j.issn.2095-0845.2005.06.001
[2] 王荷生. 华北植物区系的演变和来源[J]. 地理学报, 1999, 54(3):213−223. doi: 10.3321/j.issn:0375-5444.1999.03.003 Wang H S. The evolution and sources of in north China ’s flora[J]. Acta Geographica Sinca, 1999, 54(3): 213−223. doi: 10.3321/j.issn:0375-5444.1999.03.003
[3] 毕泉鑫, 蔡龙, 马兴华, 等. 中国特有能源植物文冠果的遗传学及产业化[J]. 中国野生植物资源, 2011, 30(5):49−55. Bi Q X, Cai L, Ma X H, et al. Review on genetics and industrialization of Xanthoceras sorbifolia, an indigenous energy species in China[J]. Chinese Wild Plant Resources, 2011, 30(5): 49−55.
[4] 戚建华, 姚增玉. 文冠果的生殖生物学与良种繁育研究进展[J]. 西北林学院学报, 2012, 27(3):91−96. doi: 10.3969/j.issn.1001-7461.2012.03.19 Qi J H, Yao Z Y. Review on reproductive biology, propagation and breeding of Xanthoceras sorbifolia[J]. Journal of Northwest Forestry University, 2012, 27(3): 91−96. doi: 10.3969/j.issn.1001-7461.2012.03.19
[5] 马芳, 王俊, 王姮, 等. 文冠果树花部形态与开花物候的研究[J]. 北方园艺, 2014(22):80−84. Ma F, Wang J, Wang H, et al. Study on floral characters and flowering phenology in Xanthoceras sorbifolia Bunge[J]. Northern Horticulture, 2014(22): 80−84.
[6] 马利苹, 王力华, 阴黎明, 等. 乌丹地区文冠果生物学特性及物候观测[J]. 应用生态学报, 2008, 19(12):2583−2587. Ma L P, Wang L H, Yin L M, et al. Biology and phenology of Xanthoceras sorbifolia in Wudan area[J]. Chinese Journal of Applied Ecology, 2008, 19(12): 2583−2587.
[7] 高媛, 贾黎明, 苏淑钗, 等. 无患子物候及开花结果特性[J]. 东北林业大学学报, 2015, 43(6):34−40. doi: 10.3969/j.issn.1000-5382.2015.06.007 Gao Y, Jia L M, Su S C, et al. Phenology and blossom-fruiting characteristics of Sapindus mukorossi[J]. Journal of Northeast Forestry University, 2015, 43(6): 34−40. doi: 10.3969/j.issn.1000-5382.2015.06.007
[8] 汪智军, 张东亚, 卓立. 准噶尔盆地南缘文冠果物候与气温变化的关系[J]. 经济林研究, 2013, 31(1):102−105. Wang Z J, Zhang D Y, Zhuo L. Relationship of phenology in Xanthoceras sorbifolia Bunge and temperature variation in southern Junggar Basin[J]. Nonwood Forest Research, 2013, 31(1): 102−105.
[9] Hopkins A D. Bioclimaties: a science of life and climate relations[M].Washington: United States Government Printing Office, 1938: 188.
[10] 徐相明, 顾品强, 陈丛敏, 等. 莎车巴旦姆物候期对气象条件的响应及花期预测模型[J]. 应用生态学报, 2016, 27(2):421−428. Xu X M, Gu P Q, Chen C M, et al. Response of phenophase to meteorological conditions and flowering forecast model on Amygdalus communis in Shache County, Xinjiang, China[J]. Chinese Journal of Applied Ecology, 2016, 27(2): 421−428.
[11] Chuine I, Yiou P, Viovy N, et al. Historical phenology: grape ripening as a past climate indicator[J]. Nature, 2004, 432: 289−290. doi: 10.1038/432289a
[12] 王焕炯, 戴君虎, 葛全胜. 1952—2007年中国白蜡树春季物候时空变化分析[J]. 中国科学(地球科学), 2012, 42(5):701−710. Wang H J, Dai J H, Ge Q S. The spatiotemporal characteristics of spring phenophase changes of Fraxinus chinensis in China from 1952 to 2007[J]. Scientia Sinica (Terrae), 2012, 42(5): 701−710.
[13] 孔冬冬, 张强, 黄文琳, 等. 1982—2013年青藏高原植被物候变化及气象因素影响[J]. 地理学报, 2017, 72(1):39−52. Kong D D, Zhang Q, Huang W L, et al. Vegetation phenology change in Tibetan Plateau from 1982 to 2013 and its related meteorological factors[J]. Acta Geographica Sinica, 2017, 72(1): 39−52.
[14] Morin X, Viner D, Chuine I. Tree species range shifts at a continental scale: new predictive insights from a process-based model[J]. Journal of Ecology, 2008, 96(4): 784. doi: 10.1111/jec.2008.96.issue-4
[15] Morin X, Lechowicz M J, Augspurger C, et al. Leaf phenology in 22 North American tree species during the 21st century[J]. Global Change Biology, 2010, 15(4): 961−975.
[16] Ge Q, Wang H, Dai J. Simulating changes in the leaf unfolding time of 20 plant species in China over the twenty-first century[J]. International Journal of Biometeorology, 2014, 58(4): 473−484. doi: 10.1007/s00484-013-0671-x
[17] 徐琳, 陈效逑, 杜星. 中国东部暖温带刺槐花期空间格局的模拟与预测[J]. 生态学报, 2013, 33(12):3584−3593. Xu L, Chen X Q, Du X. Simulation and prediction of spatial patterns of Robinia pseudoacacia flowering dates in eastern China ’s warm temperate zone[J]. Acta Ecologica Sinica, 2013, 33(12): 3584−3593.
[18] 李荣平, 周广胜, 王笑影, 等. 不同物候模型对东北地区作物发育期模拟对比分析[J]. 气象与环境学报, 2012, 28(3):25−30. doi: 10.3969/j.issn.1673-503X.2012.03.005 Li R P, Zhou G S, Wang X Y, et al. Comparative analysis of simulation on crop development stage using different phenological models in Northeast China[J]. Journal of Meteorology and Environment, 2012, 28(3): 25−30. doi: 10.3969/j.issn.1673-503X.2012.03.005
[19] 戴君虎, 王焕炯, 葛全胜. 近50年中国温带季风区植物花期春季霜冻风险变化[J]. 地理学报, 2013, 68(5):593−601. doi: 10.7605/gdlxb.2013.05.047 Dai J H, Wang H J, Ge Q S. Changes of spring frost risks during the flowering period of woody plants in temperate monsoon area of China over the past 50 years[J]. Acta Geographica Sinica, 2013, 68(5): 593−601. doi: 10.7605/gdlxb.2013.05.047
[20] Peñuelas J, Filella I. Responses to a Warming World[J]. Science, 2001, 294: 793−795. doi: 10.1126/science.1066860
[21] 张厚瑄, 张翼. 中国活动积温对气候变暖的相应[J]. 地理学报, 1994, 49(1):27−36. doi: 10.3321/j.issn:0375-5444.1994.01.004 Zhang H X, Zhang Y. Preliminary discussion on the response of active accumulated temperature of China to climate warming[J]. Acta Geographica Sinca, 1994, 49(1): 27−36. doi: 10.3321/j.issn:0375-5444.1994.01.004
[22] Yim Y J, Kira T. Distribution of forest vegetation and climate in the Korean Peninsula: (I) distribution of some indices of thermal climate[J]. Japanese Journal of Ecology, 1975, 26(5): 77−88.
[23] Abbaspour M, Jafari M J, Mansouri N, et al. Thermal comfort evaluation in Tehran metro using relative warmth index[J]. International Journal of Environmental Science & Technology, 2008, 5(3): 297−304.
[24] 徐文铎. 吉良的热量指数及其在中国植被中的应用[J]. 生态学杂志, 1985(3):35−39. Xu W D. Kira’s temperature indices and their application in the study of vegetation[J]. Chinese Journal of Ecology, 1985(3): 35−39.
[25] Wang H, Zhang B, Zhao C, et al. The spatio-temporal characteristics of temperature change in recent 57 years in Northern China[J]. Progress in Geography, 2009, 28(4): 643−650.
[26] Xia N H, Gadek P A. Sapindaceae[M]//Wu Z Y, Raven P H. Flora of China: Tomus 12. Beijing: Science Press; St. Louis: Missouri Botanical Garden Press, 2007: 5−24.
[27] Ranjitkar S, Xu J, Shrestha K K, et al. Ensemble forecast of climate suitability for the Trans-Himalayan Nyctaginaceae species[J]. Ecological Modelling, 2014, 282: 18−24. doi: 10.1016/j.ecolmodel.2014.03.003
[28] Wang Q, Huang Y, Wang Z, et al. Fruit shape and reproductive self and cross compatibility for the performance of fruit set in an and romonoecious species: Xanthoceras sorbifolium Bunge[J]. Tree Genetics & Genomes, 2017, 13(6): 116.
[29] 李典谟, 马祖飞, 等. 展望数学生态学与生态模型的未来[J]. 生态学报, 2000, 20(6):1083−1089. doi: 10.3321/j.issn:1000-0933.2000.06.029 Li D M, Ma Z F, et al. Prospect of mathematical ecology and ecological modeling[J]. Acta Ecologica Sinica, 2000, 20(6): 1083−1089. doi: 10.3321/j.issn:1000-0933.2000.06.029
[30] 王烁, 董利虎, 李凤日. 人工长白落叶松枝条存活模型[J]. 北京林业大学学报, 2018, 40(1):57−66. Wang L, Dong L H, Li F R. Branch survival models of planted Larix olgensis tree[J]. Journal of Beijing Forestry University, 2018, 40(1): 57−66.
[31] Gerstmann H, Doktor D, Gläßer C, et al. PHASE: a geostatistical model for the Kriging-based spatial prediction of crop phenology using public phenological and climatological observations[J]. Computers & Electronics in Agriculture, 2016, 127: 726−738.
[32] Robertson G P. Geostatistics in ecology: interpolating with known variance[J]. Ecology, 1987, 68(3): 744−748. doi: 10.2307/1938482
[33] Legendre P, Fortin M J. Spatial pattern and ecological analysis[J]. Vegetatio, 1989, 80(2): 107−138. doi: 10.1007/BF00048036
[34] Burrough P A. GIS and geostatistics: Essential partners for spatial analysis[J]. Environmental & Ecological Statistics, 2001, 8(4): 361−377.
[35] García-Mozo H, Galán C, Vázquez L. The reliability of geostatistic interpolation in olive field floral phenology[J]. Aerobiologia, 2006, 22(2): 95−106. doi: 10.1007/s10453-006-9026-y
[36] 国家气象局. 农业气象观测规范[M]. 北京: 气象出版社, 1993. China Meteorological Administration. Observation criterion of agricultural meteorology[M]. Beijing: China Meteorological Press, 1993.
[37] 赵曦阳, 张志毅. 毛白杨种内杂交无性系苗期生长模型的构建[J]. 北京林业大学学报, 2013, 35(5):15−21. Zhao X Y, Zhang Z Y. Model construction of seedling growth for hybrid clones of Populus tomentosa[J]. Journal of Beijing Forestry University, 2013, 35(5): 15−21.
-
期刊类型引用(0)
其他类型引用(4)


计量
- 文章访问数: 2437
- HTML全文浏览量: 826
- PDF下载量: 68
- 被引次数: 4
