
Impacts of land use change on ecosystem service value in Bashang Area of Hebei Province, northern China
-
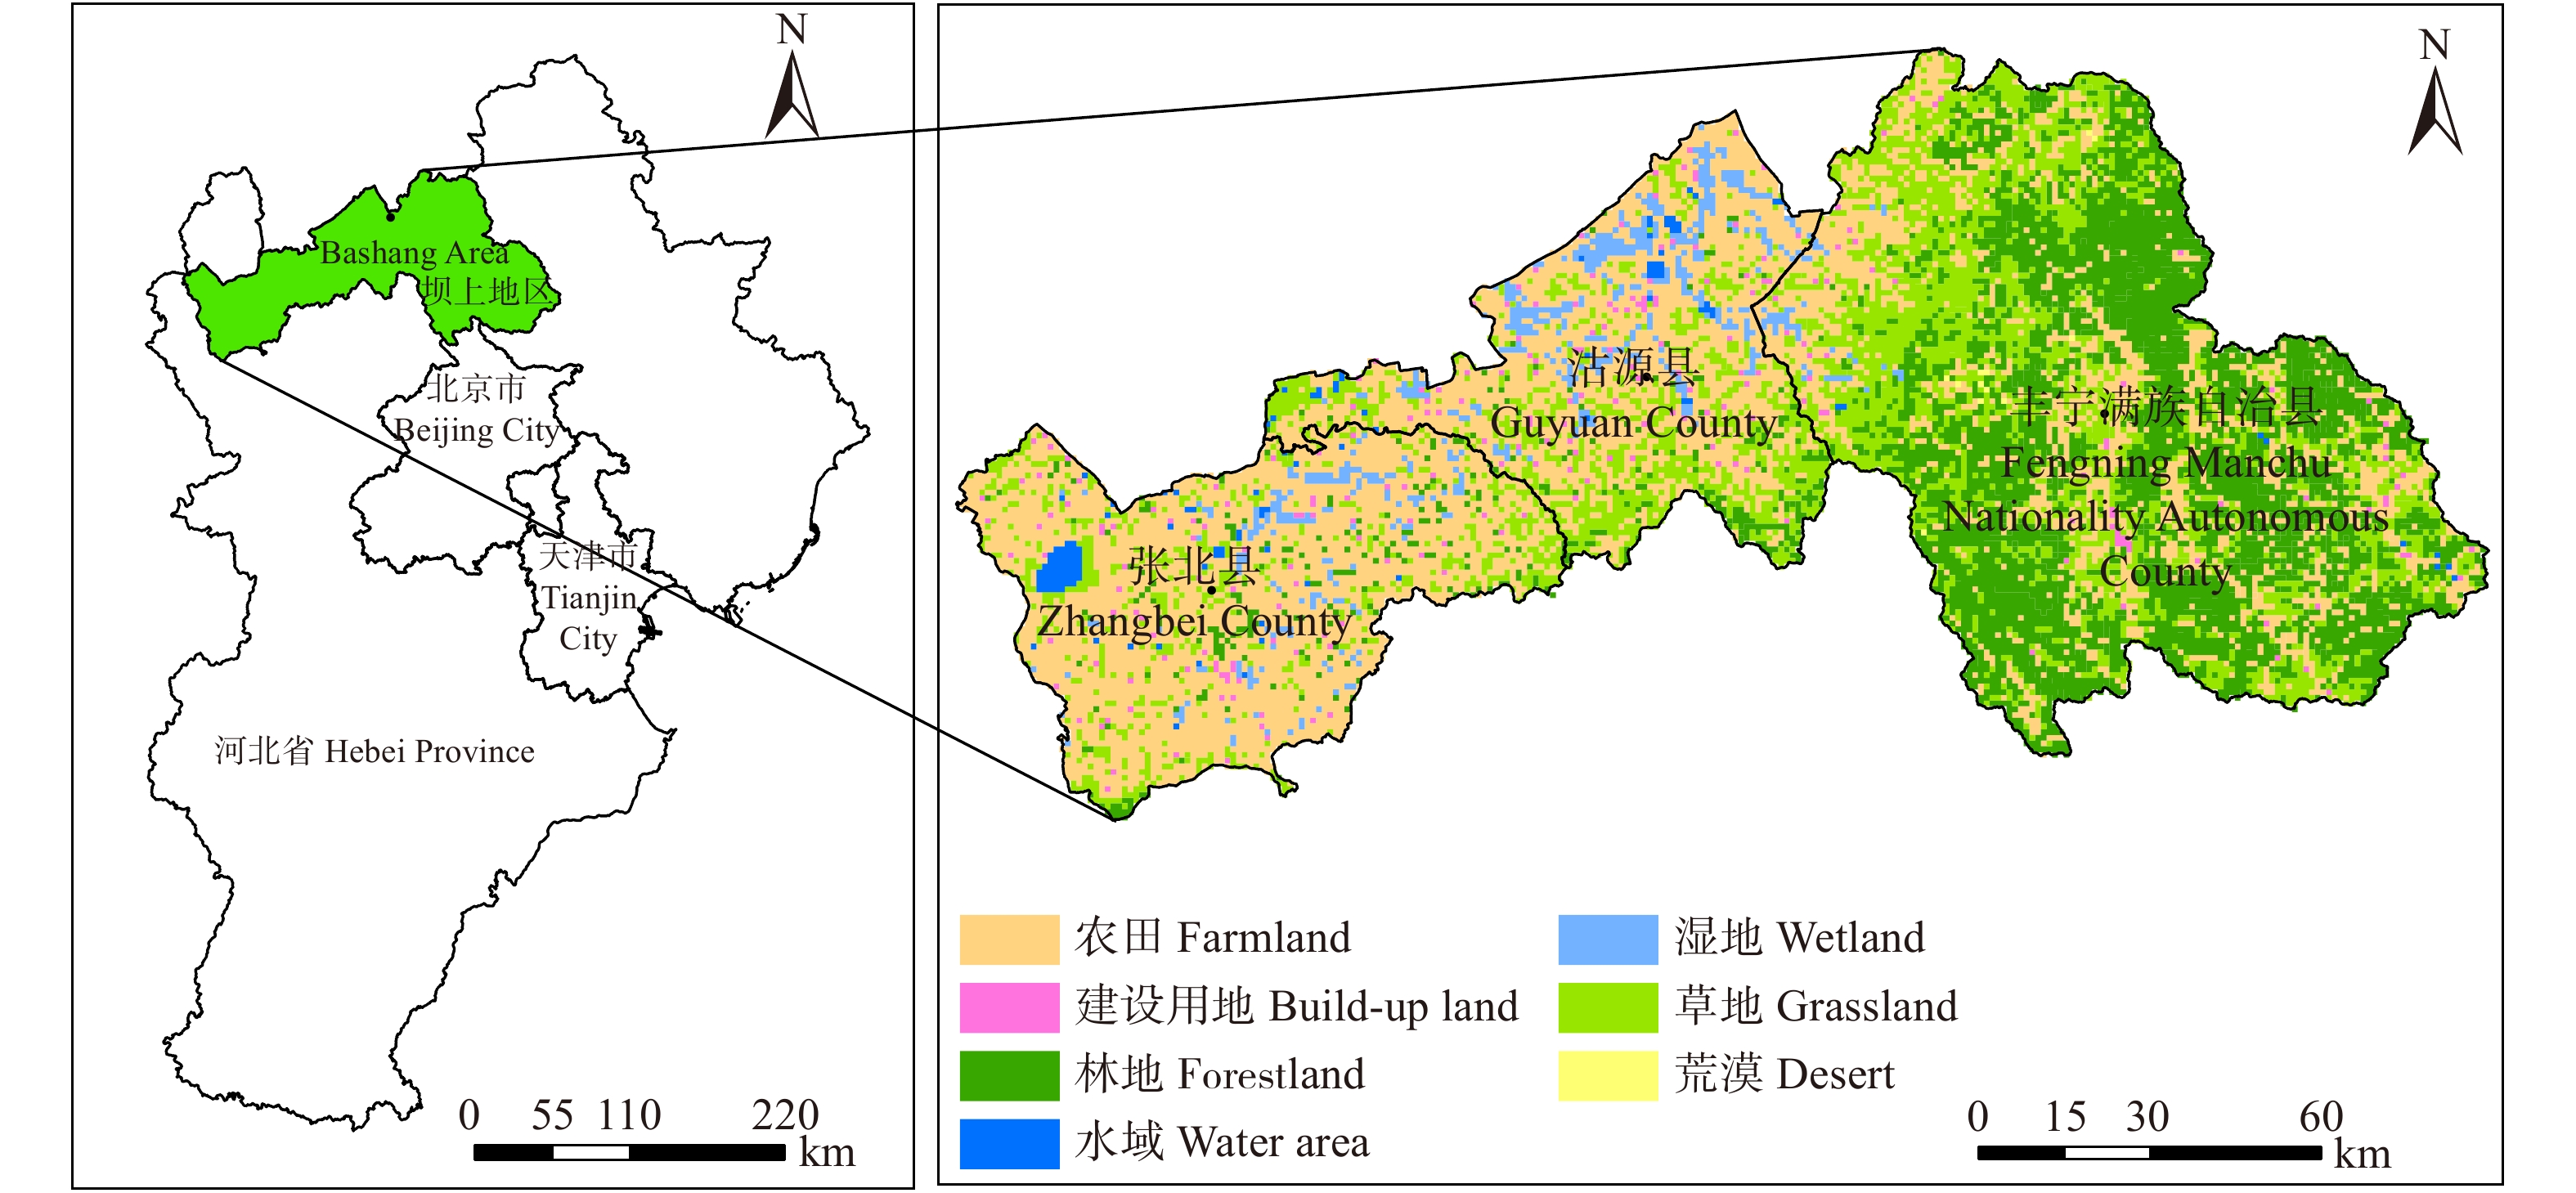
摘要:目的定量研究土地利用背景下生态系统服务价值的时空变化特征,旨在正确认识不同生态系统服务功能对土地利用变化的响应机制,为坝上区域土地利用格局优化与生态经济协调发展提供参考。方法本文以河北坝上张北、沽源、丰宁3县为研究对象,采用GIS空间分析方法,分析了2000年以来土地利用时空动态变化特征,并在此基础上利用陆地生态系统服务价值估算模型评估了生态系统服务价值及其对土地利用变化的响应,进而探讨了该地区生态与经济发展的协调性。结果(1)2000—2015年坝上地区湿地、草地面积逐渐减少,分别减少28、26 km2,建筑用地面积持续增加,共增加24 km2,其他土地利用面积稍有增加;草地和湿地主要向农田转移,建筑用地的增加主要来自于农田、湿地的转移。(2)坝上地区生态系统服务价值总体上呈“西低东高”的趋势,低值区主要位于张北西部,而高值区主要位于丰宁南部燕山森林区;15年间,坝上地区85.92%的区域生态系统服务价值呈增加态势,生态系统服务总价值共增加334.83亿元,其中,气候调节服务价值增加最多,增加了90.44亿元,土壤保持、水文调节、水资源供给价值先增后减;草地、森林和湿地对生态系统服务总价值的贡献率在85%以上,对生态系统服务的影响最大。(3)坝上地区人均生态系统服务价值逐渐增加,生态经济协调度为0.09,处于潜在危机区,坝上地区的生态经济系统具有潜在的危险性。结论坝上地区生态系统服务价值逐渐提高,但对坝上生态系统服务功能起重要贡献作用的草地和湿地退化明显,经济发展仍受生态压力的制约,生态环境仍然脆弱。Abstract:ObjectiveBy quantitatively studying the temporal and spatial variation characteristics of ecosystem service value under the background of land use, this paper aims to correctly understand the response mechanism of different ecosystem service functions to land use change, and provide a scientific basis for the optimization of land use pattern and coordinated development of ecological economy in the Bashang Area, Hebei Province of northern China.MethodTaking Zhangbei, Guyuan and Fengning counties as research objects, this paper uses mathematical model to analyze the temporal and spatial dynamics of land use since 2000. Based on this, the ecosystem service value was evaluated by the estimation method of land ecosystem service value, and its response to land use change was analyzed. Then the coordination of ecological and economic development in the Bashang Area was explored.ResultThe results showed that: (1) during the study period, the built-up land in the Bashang Area increased by 24 km2, while wetland and grassland reduced by 28 and 26 km2, respectively. The reduced grasslands and wetlands were mainly converted into farmland, and the increase in built-up land mainly comes from farmland and wetlands. (2) Land use change led to the change of ecological environment in the research area and influenced the ecosystem service value. The ecosystem service value in the Bashang Area is generally high in the west and low in the east. The low value area is mainly located in the western part of Zhangbei, and the high value area is located in the Yanshan forest in the south of Fengning. In the past 15 years, the ecosystem services value in 85.92% of the Bashang Area had been increased, with a total increase of 33.483 billion RMB. Among them, the value of climate regulation services increased the most, increasing by 9.044 billion RMB, while soil conservation, hydrological regulation and water supply value both rose first and then decreased; the ecosystem service value was mainly provided by the grassland, forestland, and wetland, and their contribution rate was over 85%, which had the greatest impact on the value of ecosystem services in the Bashang Area. (3) Although the per capita ecosystem service value has gradually increased in the Bashang area, the eco-economic coordination degree was 0.09. This shows that the ecological economic system in the Bashang area is potentially dangerous.ConclusionsThe ecosystem service value in the Bashang Area has gradually increased, but the grassland and wetland playing an important role in the ecological service function have been degraded. The economic development is still constrained by ecological pressure, and the ecological environment is still fragile.
-
Keywords:
- land use /
- ecosystem service value /
- Bashang /
- eco-economic harmony index (EEH)
-
竹材具生长周期短、硬度强、韧性高、可降解的生物性材料。且在现有木材资源不能适应家具产业发展迫切需要的情况下,竹材是取代实木的最理想材料[1],竹集成材作为保持了竹材优异的物理力学性能的竹制家具用材,具有良好的发展前景。众所周知,竹材容易受外界环境如光照、水、微生物等的侵害而发生变色、腐朽[2],竹集成材亦如是。对竹集成材进行表面涂饰是最能够有效保护其性能的方法之一。
以水作为溶剂的水性漆与传统油性漆相比,不含挥发性有机物(volatile organic compounds,VOCs),具有绿色环保、节约资源的特性[3]。伴随着国家环保政策的不断完善和绿色环保理念的普及,水性漆在家具、室内装饰、建筑等领域将逐步替代传统涂料[4]。然而竹集成材水性漆涂饰面临着竹集成材密度大,纹孔少,横向渗透困难等问题[5],使得水性漆漆膜附着力差,竹集成材水性漆涂饰工业化进度缓慢。为了克服这些问题,Lu[6]通过对毛竹表面进行过氧化氢表面预处理的方法,提高了水性漆在毛竹表面的附着力。此外其他研究人员通过使用湿热处理[7-8]、碱液浸泡处理[9]等方法,也在一定程度上提高了竹材表面的润湿性和粗糙度,改善了水性漆等流体在竹材内部的渗透效率,漆膜的附着力由此增强。涂饰工艺对涂料性能的发挥有着重要影响,是涂饰过程中的关键技术环节。但目前有关水性涂饰工艺的研究还着重于水曲柳、杨木等木质材料上[10-12],对竹集成材涂饰工艺研究较少,且未有水性清漆和色漆对竹集成材硬度、附着力等漆膜性能影响方面的研究。
为了解决竹集成材水性涂装这些难题,本研究以家具中最为常用的毛竹集成材为基材,在省去预处理的基础上优化了竹集成材水性涂饰工艺,提高了水性涂饰工艺的效率,系统地探究了竹集成材清漆与色漆涂饰性能的影响及竹集成材水性漆漆膜的附着机理,为竹家具的水性化涂装提升提供理论支持和科学依据。
1. 材料与方法
1.1 材 料
选取含水率为11%的毛竹集成材,制成尺寸为100 mm(长) × 100 mm(宽) × 10 mm(厚)的试样18块,并对试样在室温和湿度为(65 ± 3)%的环境下进行打磨。选用涂料为自制水性底漆和商业水性面漆(分为清漆与色漆两种类型,主要成分为水性聚氨酯树脂,底漆固体含量为39.2%,面漆固体含量为34.6%)。
1.2 基材涂饰
依次用80目、120目、180目和240目砂纸对基材进行顺纹打磨并用羊毛刷除尘。涂饰前底漆与面漆分别添加5% 和8%的去离子水进行调配。调配底漆涂布量为80 g/m2,面漆涂布量为120 g/m2,在室温下均匀地喷涂底漆3遍、面漆1遍,每遍喷涂干燥之后再次顺纹打磨1遍(图1)。涂饰完后基材后在室温下干燥8 h。
1.3 测试方法
将无差别的18个样品分为A、B和C这3组,每组6个,按照字母加数字的方式编号成A1 ~ A6、B1 ~ B6和C1 ~ C6。
1.3.1 漆膜硬度、附着力、光泽度测试
选取A组试样进行漆膜的硬度测试。根据ISO 15184—1998 《色漆和清漆 铅笔法测定漆膜硬度》标准测试。选取B组试样进行漆膜的附着力测定。根据ISO 2409—2013《色漆和清漆交叉切割试验》中的检测标准,按照规定的步骤,使用QFH漆膜划格仪依次对每个试样进行测定。参照ISO 2813—2014《色漆和清漆在20°、60°和85°非金属色漆漆膜镜面光泽的测定》使用60°光泽度仪对C组和对照试样进行光泽度测试。
1.3.2 表面粗糙度测试
参照GB/T 12472—2003《产品几何量技术规范(GPS) 表面结构 轮廓法 木制件表面粗糙度参数及其数值》,使用TR240便携式表面粗糙度仪测试试样的表面粗糙度,将触针的运动转变为电信号,测量出各粗糙度参数。设置取样长度为2.5 mm,为了提高准确率,在每一块试件上选取4 个点测试,并对测试结果进行记录。
1.3.3 色度值测试
使用SP60色差仪按照国际照明委员会CIE标准色度系统对C组试样基材涂饰前后的颜色变化进行定量的度量。CIE由L*、a*、b*这3个数值进行评估。L*表示亮度;a*表示红绿,数值变化由正到负,表示颜色从红(正)到绿(负);b*表示黄蓝,数值变化由正到负,表示颜色从黄(正)到蓝(负)。总色差值ΔE表示颜色知觉差异,数值越小则表示颜色变化越小。ΔE由公式(1)确定:
ΔE=√ΔL∗2+Δa∗2+Δb∗2 (1) 式中:ΔL*、Δa* 和Δb*分别为涂饰前后的L*、a*和b*差值。
1.3.4 扫描电镜(scanning electron microscope,SEM)分析
使用场发射环境扫描电镜(FEG-ESEM,XL30ESEMFEG,FEI Company,USA)观察并记录基材涂饰前后的表面形态。将加速电压设置为7 kV后,着重对涂饰后基材与漆膜界面结合处的形态进行观察。
1.3.5 傅里叶变换红外光谱(Fourier transform infrared spectroscopy,FTIR)分析
用溴化钾压片法分别测定涂饰前后试样的FTIR。设置光谱分辨率为4 cm−1,在500 ~ 4 000 cm−1范围内,利用傅里叶变换红外光谱仪(Nicolet6700傅里叶红外光谱仪,Thermo Scientific, Waltham, USA)扫描得到清漆、色漆、竹集成材、清漆和色漆涂饰后的基材的5种FTIR。测试完成后,将所有5个样品的光谱绘制成图表,分析每个样品的特征峰的变化,并据此探究水性漆与竹集成材的结合机理。
2. 结果与讨论
2.1 漆膜硬度与附着力
漆膜硬度代表了涂饰在基材上的漆膜的机械强度,反映了漆膜对来自外界的碰擦、刺划等机械作用的耐受能力[13]。从表1可以看出:清漆的漆膜硬度为1H,而色漆的漆膜硬度为2H。这是因为漆膜的硬度是由成膜物质的性能所决定的,色漆中含有较高硬度的颜料,因而色漆的硬度优于清漆。但两者的硬度均能够满足GB/T 3324—2017《木家具通用技术条件》中室内装饰、实木地板的使用要求[14]。此外,我们发现清漆和色漆的漆膜硬度均比之前研究的水性漆涂饰水曲柳所得的硬度高[12],这充分说明了水性漆采用喷涂的涂饰工艺能在竹集成材上产生能媲美在木材上的效果。
表 1 水性漆漆膜的硬度与附着力Table 1. Hardness and adhesion of film of waterborne paint清漆 Varnish 色漆 Color paint 试件 Sample 硬度 Hardness 附着力 Adhesion 试件 Sample 硬度 Hardness 附着力 Adhesion A1 1H 0级 Grade 0 B1 2H 1级 Grade 1 A2 1H 0级 Grade 0 B2 2H 1级 Grade 1 A3 1H 0级 Grade 0 B3 2H 1级 Grade 1 A4 1H 0级 Grade 0 B4 2H 1级 Grade 1 A5 1H 0级 Grade 0 B5 2H 1级 Grade 1 A6 1H 0级 Grade 0 B6 2H 1级 Grade 1 平均值 Average value 1H 0级 Grade 0 平均值 Average value 2H 1级 Grade 1 漆膜附着力是指导家具涂装工艺优化方向的关键数据,也是影响漆膜性能的重要指标之一[15-16]。由表1可知:清漆漆膜的附着力比色漆漆膜的附着力更高,可达为最高的0级,这是由于色漆由于含有颜料,其固含量高于清漆,所以清漆具有更高的渗透能力,因而清漆能更好地填充在基材的细胞腔里。从SEM图中也能清晰地看到涂饰前后的差别。在未涂饰基材图(图2a、2b)中可以看到有较大的导管存在基材的横切面上,而纵切面上较多的则是裸露的细胞腔,基材表面裸露的细胞腔为水性漆在基材表面良好的附着性能提供了一定的基础。基材涂饰清漆和色漆后(图2c、2d),沟槽状的细胞腔和细胞胞间层中都有成膜物填充,因而达到较强的附着力。且从图2c、2d中也能看出:因清漆的渗透性能更好,使得在相同涂布量下,色漆的漆膜厚度明显高于清漆。此外,竹集成材水性清漆涂饰的漆膜附着力与之前研究的木材水性漆涂饰的附着力相当[12]。这也再次证明了使用“三低一面”的喷涂涂饰工艺能达到较好的漆膜性能。
2.2 光泽度
漆膜的光反射能力是通过漆膜的光泽度来衡量的,在一定范围内,随着竹材基材的表面光泽度增加,视觉效果变好[17]。涂饰前后基材的光泽度一般区分为垂直竹材纹理的光泽度值(gloss value of vertical bamboo texture,GZT)和平行竹材纹理的光泽度值(gloss value of parallel bamboo texture,GZL)。由图3可得涂饰后试样光泽度明显高于未涂饰试样,这是因为水性漆成膜物的光泽度比竹材自身的光泽度高。清漆涂饰后的平均GZT和GZL分别为19.83和21.24,色漆涂饰后的分别为21.39和22.93,均比未涂饰时提高了5倍以上,大大提升了竹集成材的装饰效果。且色漆因颜料填料含量较高,成膜物质在竹材表面固着占比更多,从而使得色漆光泽度均高于清漆。通过进一步对比发现试样的GZL均高于GZT,这是因为竹材大多数细胞是轴向排列的,在平行纹理方向,大部分细胞被剖开,细胞腔呈沟槽状暴露出来,因此成膜物容易填充到腔径大的细胞腔中;细胞壁的相对含量在垂直纹理方向上较多,因此成膜物很难渗透到具有纳米级孔的细胞壁中,导致平行纹理方向上成膜物的含量高于垂直纹理方向上的含量,因此其光泽度也显著增加[18-19]。
![]() 图 3 基材涂饰前后光泽度GZT为光泽度仪垂直于木材纹理方向时所测得的光泽度值;GZL为光泽度仪平行于木材纹理方向时所测得的光泽度值。 GZT is the glossiness value measured when glossmeter is perpendicular to the direction of wood texture. GZL is the glossiness value measured when glossmeter is parallel to the direction of wood texture.Figure 3. Glossiness of substrate before and after painting
图 3 基材涂饰前后光泽度GZT为光泽度仪垂直于木材纹理方向时所测得的光泽度值;GZL为光泽度仪平行于木材纹理方向时所测得的光泽度值。 GZT is the glossiness value measured when glossmeter is perpendicular to the direction of wood texture. GZL is the glossiness value measured when glossmeter is parallel to the direction of wood texture.Figure 3. Glossiness of substrate before and after painting2.3 表面粗糙度
表面粗糙度是指竹材在加工的过程中表面留下的各种不同程度的微观加工痕迹或不平度,常被用来评价竹材表面的质量,将会直接影响竹材的涂饰效果以及涂料的用量,常用轮廓算数平均偏差Ra、轮廓算数均方偏差Rq、微观不平度十点高度Rz和轮廓最大高度Ry表示[20]。本实验主要采用Ra表征试样的表面粗糙度,Ra的值越小,说明其表面越光滑平整。不同涂饰情况对应试样的表面粗糙度和电镜图见图4和图5。涂饰后的Ra值均小于未涂饰的Ra值,从SEM图也可以清楚地看出基材裸露的细胞腔被水性漆覆盖,表面粗糙度降低。且清漆涂饰后的Ra值比色漆涂饰后的Ra值小。这是因为色漆中含有颜料颗粒(图5b),可能影响成膜的交联程度,这导致涂饰色漆后表面粗糙度高于涂饰清漆后的表面粗糙度。
![]() 图 4 涂饰前后试样表面粗糙度平均值Ra为评定轮廓的算数平均偏差; Rz为微观不平度十点高度,是指在取样长度内5 个最大的轮廓峰高的平均;Rq为评定轮廓的算数均方偏差;Ry为轮廓最大高度,是指在取样长度内,轮廓峰顶线和轮廓谷底线之间的距离。Ra is the arithmetical mean deviation of assessed profile; Rz is the height of ten points of micro unevenness, which refers to the average of five maximum contour peak heights within the sampling length; Rq is the root mean square deviation of the assessed profile; Ry is the maximum height of profile, which refers to the distance between the contour peak line and the contour bottom line within the sampling length.Figure 4. Surface roughness of substrate before and after painting
图 4 涂饰前后试样表面粗糙度平均值Ra为评定轮廓的算数平均偏差; Rz为微观不平度十点高度,是指在取样长度内5 个最大的轮廓峰高的平均;Rq为评定轮廓的算数均方偏差;Ry为轮廓最大高度,是指在取样长度内,轮廓峰顶线和轮廓谷底线之间的距离。Ra is the arithmetical mean deviation of assessed profile; Rz is the height of ten points of micro unevenness, which refers to the average of five maximum contour peak heights within the sampling length; Rq is the root mean square deviation of the assessed profile; Ry is the maximum height of profile, which refers to the distance between the contour peak line and the contour bottom line within the sampling length.Figure 4. Surface roughness of substrate before and after painting2.4 色度值
色差是指两种颜色之间的差异。色差值是色差的数值表达。色差和色差值受涂料成分、涂饰工艺等因素的影响[21]。涂膜前后的色度值变化如图6所示。涂饰清漆前L*值为72.38,涂饰清漆后降低至64.37;a*值由原来的7.03增加到10.12;b*值由24.48增加到30.64。结果表明,涂层后基材表面明度略有下降,红色和黄色指数略有增加。ΔE较小为10.56,说明涂饰清漆前后竹集成材的表面颜色相差不大。这是因为水性清漆不含颜料,在竹集成材表面固化后是透明的,能较好地保持竹集成材本身的颜色。而涂饰色漆后L*值降低至34.74;a*值增加到12.03;b*值降低至18.30。说明涂层后基材表面明度有一定程度的下降,红色和蓝色指数略有增加。ΔE值较大,为38.46,这表明竹集成材表面的色彩特征因色漆中颜料的颜色发生了较大程度的改变。
![]() 图 6 涂饰前后色度值对比L*表示亮度;a*表示红绿;b*表示黄蓝。 L* indicates lightness, a* indicates red and green, and b* indicates yellow and blue.Figure 6. Comparison of chromaticity values before and after painting
图 6 涂饰前后色度值对比L*表示亮度;a*表示红绿;b*表示黄蓝。 L* indicates lightness, a* indicates red and green, and b* indicates yellow and blue.Figure 6. Comparison of chromaticity values before and after painting2.5 FTIR分析
图7显示了各试样的FTIR,可以看出:3 436 cm−1处吸收峰是由−OH伸缩振动引起的,与其他谱线相比,竹材谱线在这一位置的峰值明显最强,且涂饰后色漆和清漆在1 724 cm−1处(C=O的拉伸振动特征峰)的强度分别较纯色漆与清漆小得多,在1 143 cm−1处(酯基中C−O伸缩振动峰)的峰值比竹材谱线的更强,说明水性漆中的极性分子(如羧基、羟基)与基材中的羟基结合后,水性底漆中的羧基与基材中的羟基发生了酯化反应,两者之间形成了氢键使结合更加稳固[22-23]。此外色漆在2 921 cm−1(−CH2反对称伸缩振动峰)、1 724 cm−1(C=O的拉伸振动特征峰)、1 460 cm−1(−CH2弯曲振动峰)、1 143 cm−1(C−O伸缩振动)处的峰值均比清漆所在的峰值高,这是由于色漆中相应的基团的占比比清漆中的高。所以水性底漆除物理结合外,还会与基材发生化学反应,使成膜物能很好地附着在竹集成材表面。
![]() 图 7 水性漆与竹集成材涂饰前后的红外表征Figure 7. Infrared characterization of waterborne paint and bamboo laminated lumber before and after painting
图 7 水性漆与竹集成材涂饰前后的红外表征Figure 7. Infrared characterization of waterborne paint and bamboo laminated lumber before and after painting3. 结 论
本研究所获得的清漆的漆膜硬度为1H,色漆的漆膜硬度为2H。涂饰后,水性漆与竹集成材以机械互锁的物理形式和化学反应结合的形式使成膜物质能很好地附着在基材表面。由于色漆中含有颜料,清漆的附着性能优于色漆,可达最高的0级,与木材水性涂饰的附着性能相当。而颜料颗粒的存在影响了成膜的交联程度,使得色漆的表面粗糙度高于清漆。清漆和色漆涂饰后基材的光泽度提高了5倍以上,且平行纹理方向上的光泽度高于垂直纹理方向上。因色漆含有颜料,清漆涂饰前后总色差值较低,较好地保持了竹集成材本身优美的颜色。因此,本水性涂饰工艺在竹集成材上能获得较好的漆膜性能和较强的附着力,并能在很大程度上提升了竹集成材的装饰效果,为竹材及其制品的水性化涂装提供了重要的理论和技术支持。
-
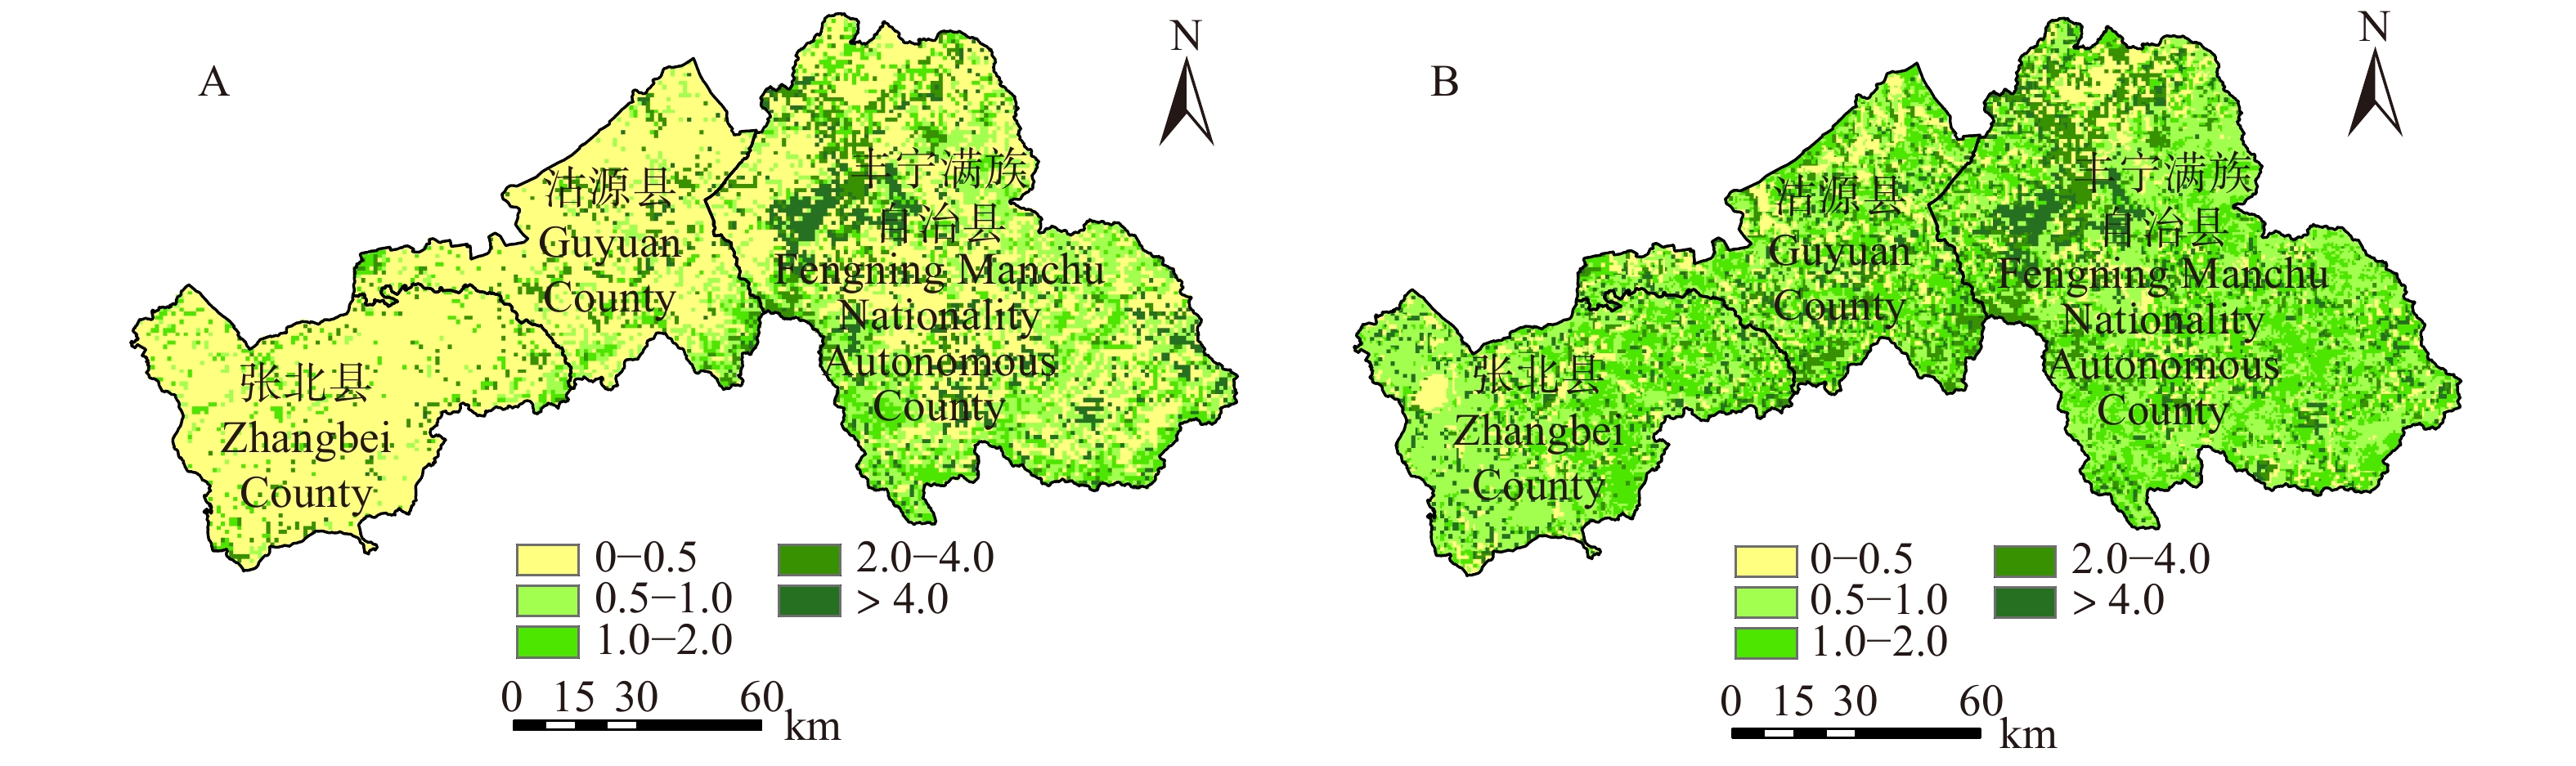
![]()
图 2 2000年(A)和2015年(B)生态系统服务价值基础当量净初级生产力调整系数
Figure 2. NPP adjustment coefficient of ecosystem service value (ESV) in 2000 (A) and 2015 (B)
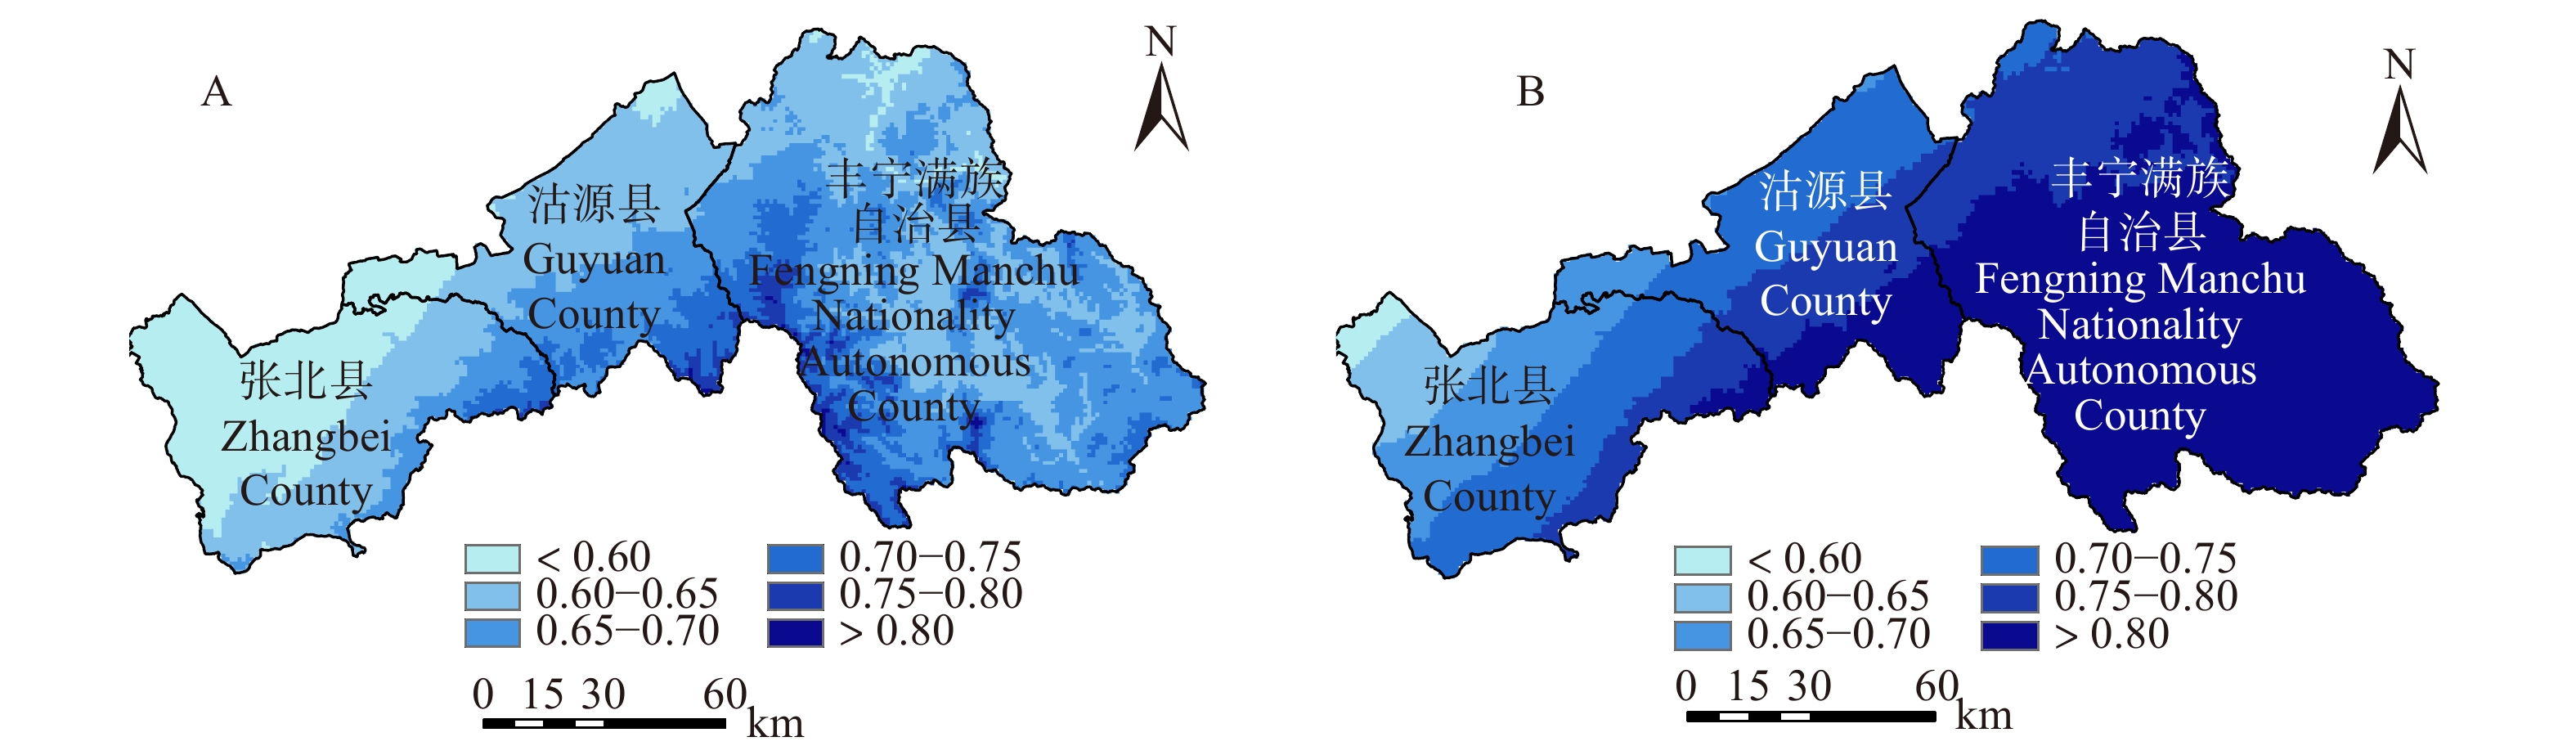
![]()
图 3 2000年(A)和2015年(B)生态系统服务价值基础当量降水量调整系数
Figure 3. Precipitation adjustment coefficient of ESV in 2000 (A) and 2015 (B)
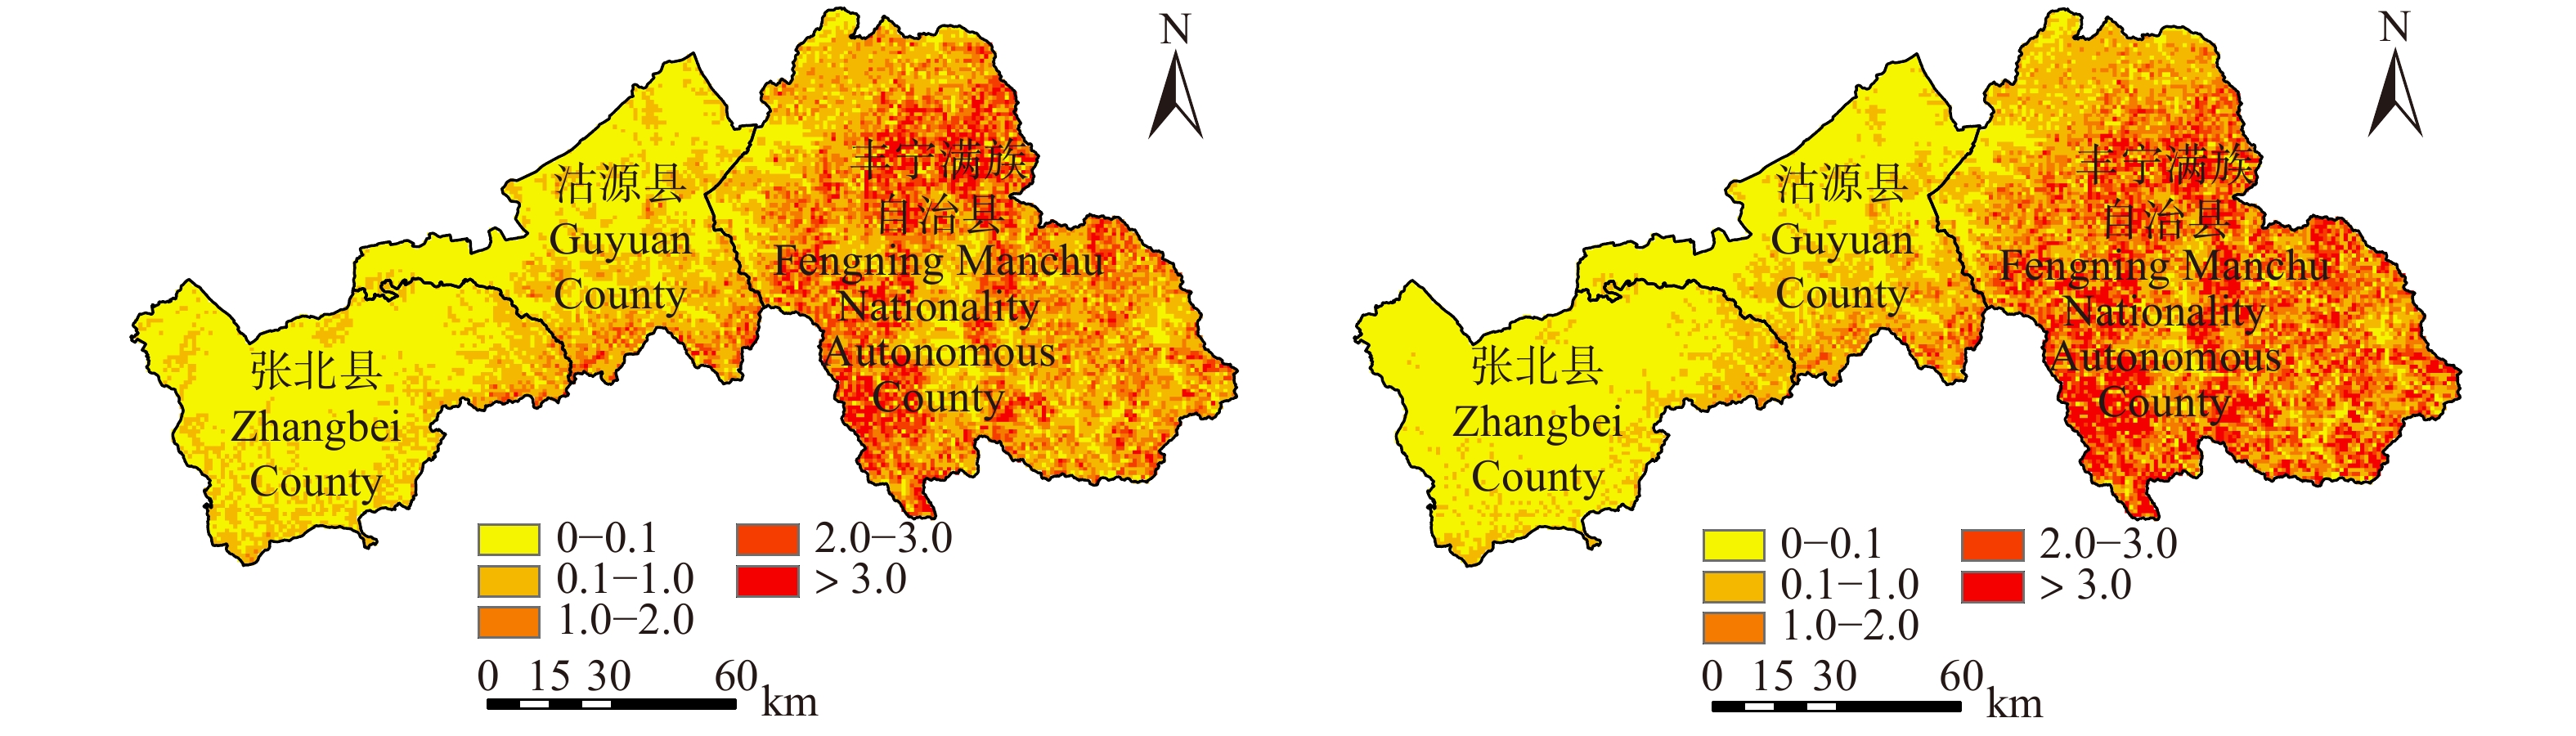
![]()
图 4 2000年(A)和2015年(B)生态系统服务价值基础当量土壤保持量调整系数
Figure 4. Soil conservation adjustment coefficient of ESV in 2000 (A) and 2015 (B)
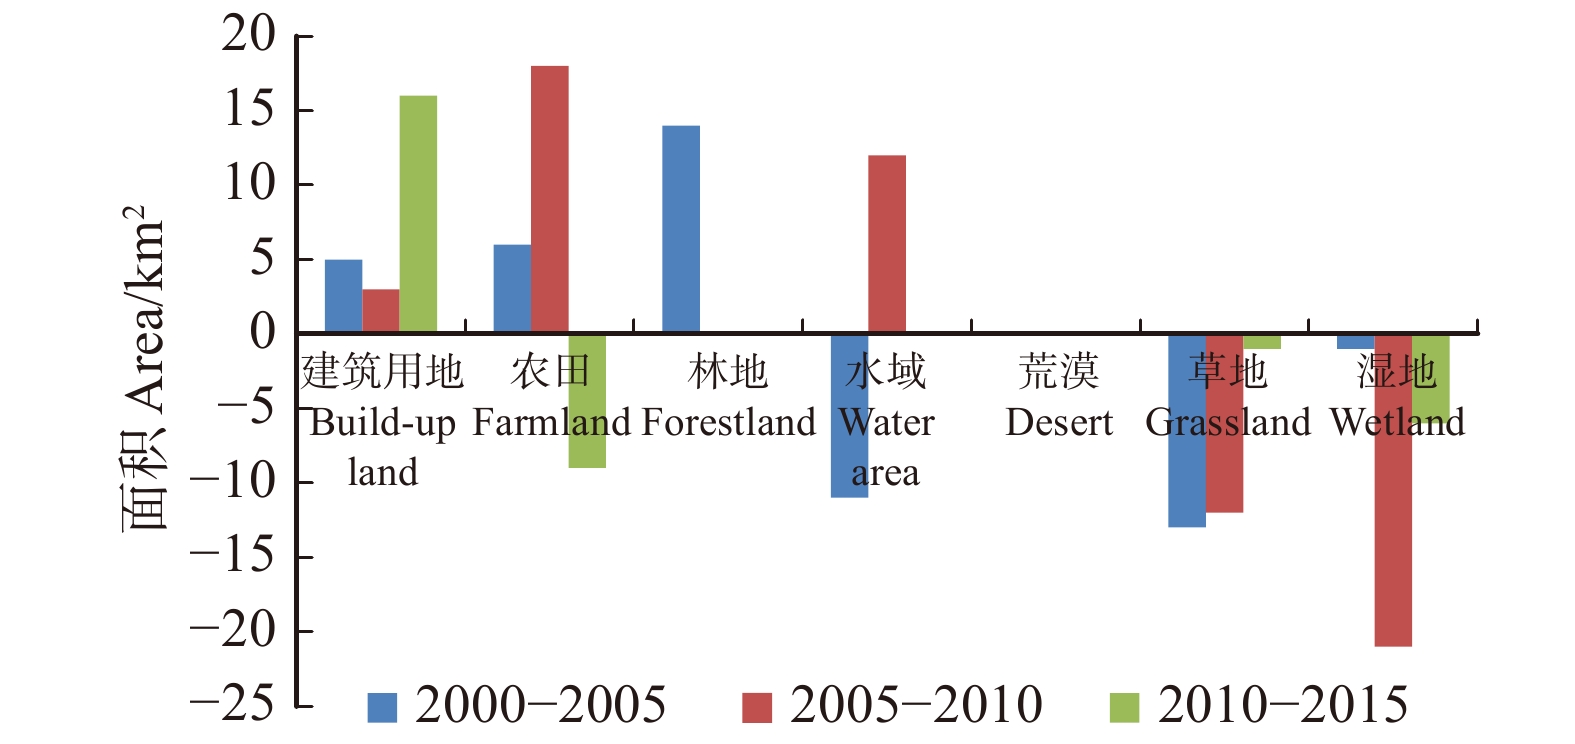
![]()
图 5 2000—2015年河北坝上土地利用类型面积变化
Figure 5. Changes of land use type in Bashang Area from 2000 to 2015
![]()
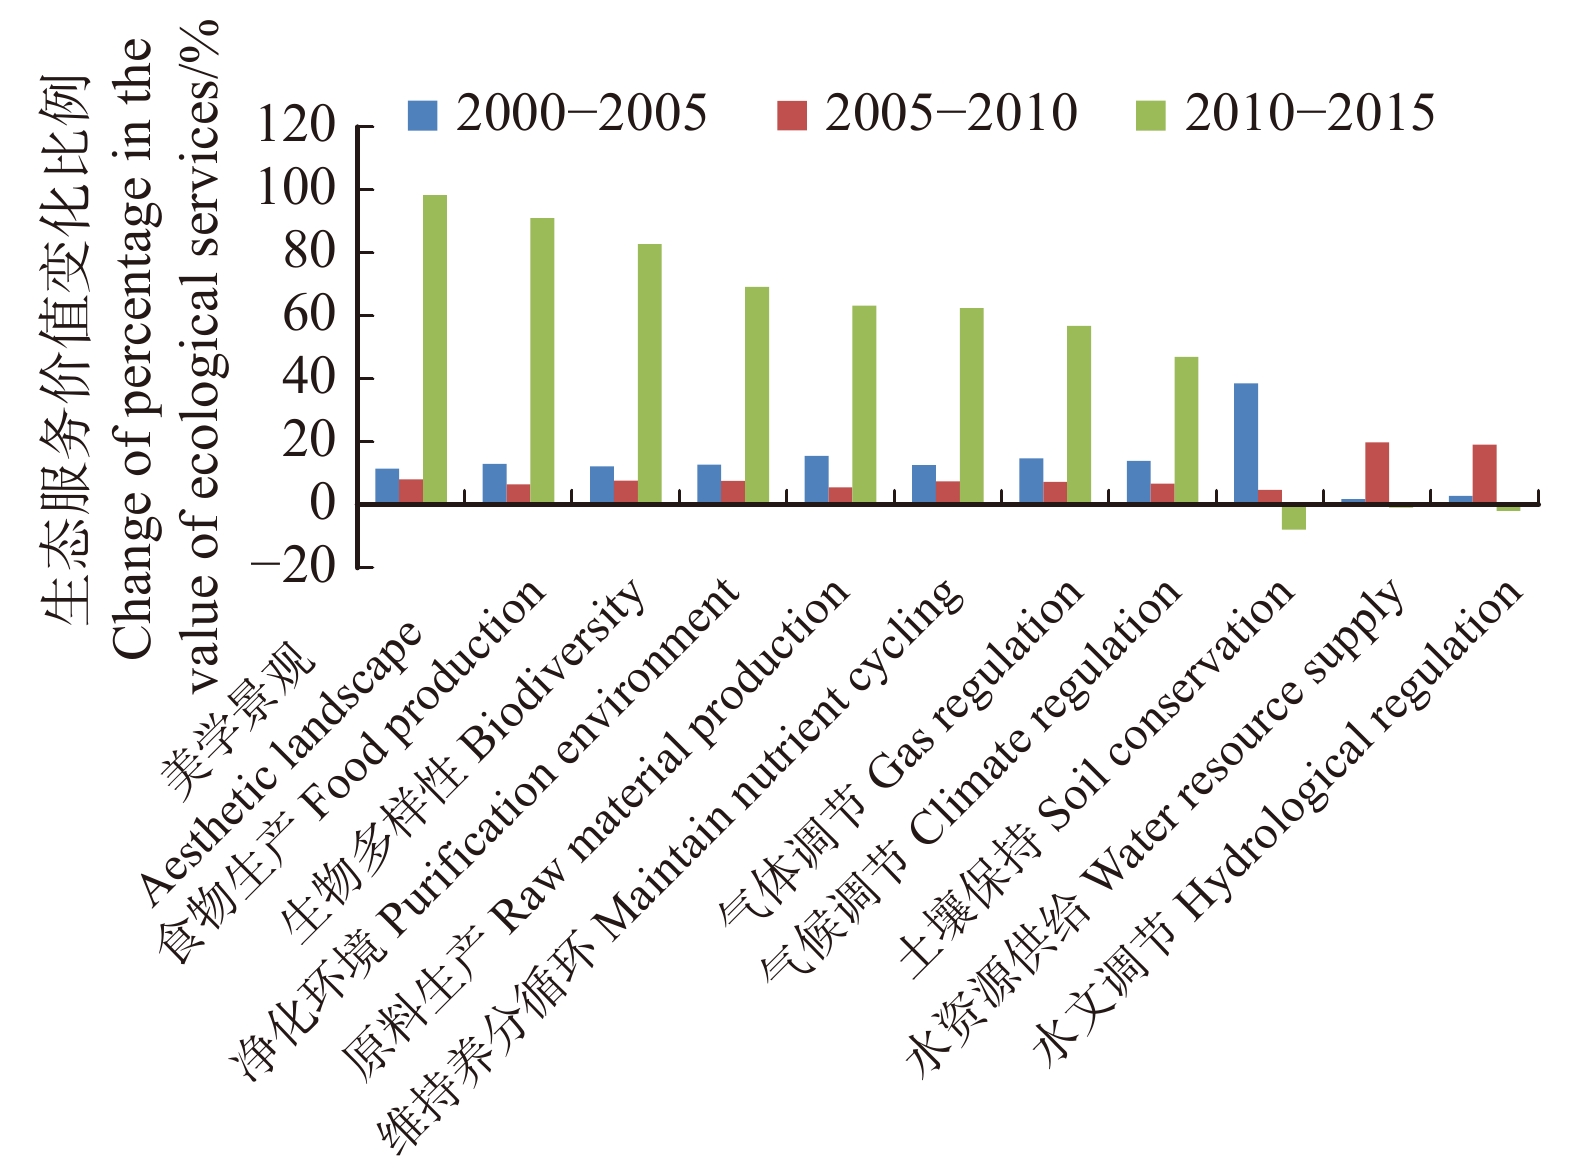
图 6 2000—2015年坝上地区各类生态系统服务的价值变化
Figure 6. Changes in value of various types of ecosystem services in Bashang Area from 2000 to 2015
![]()
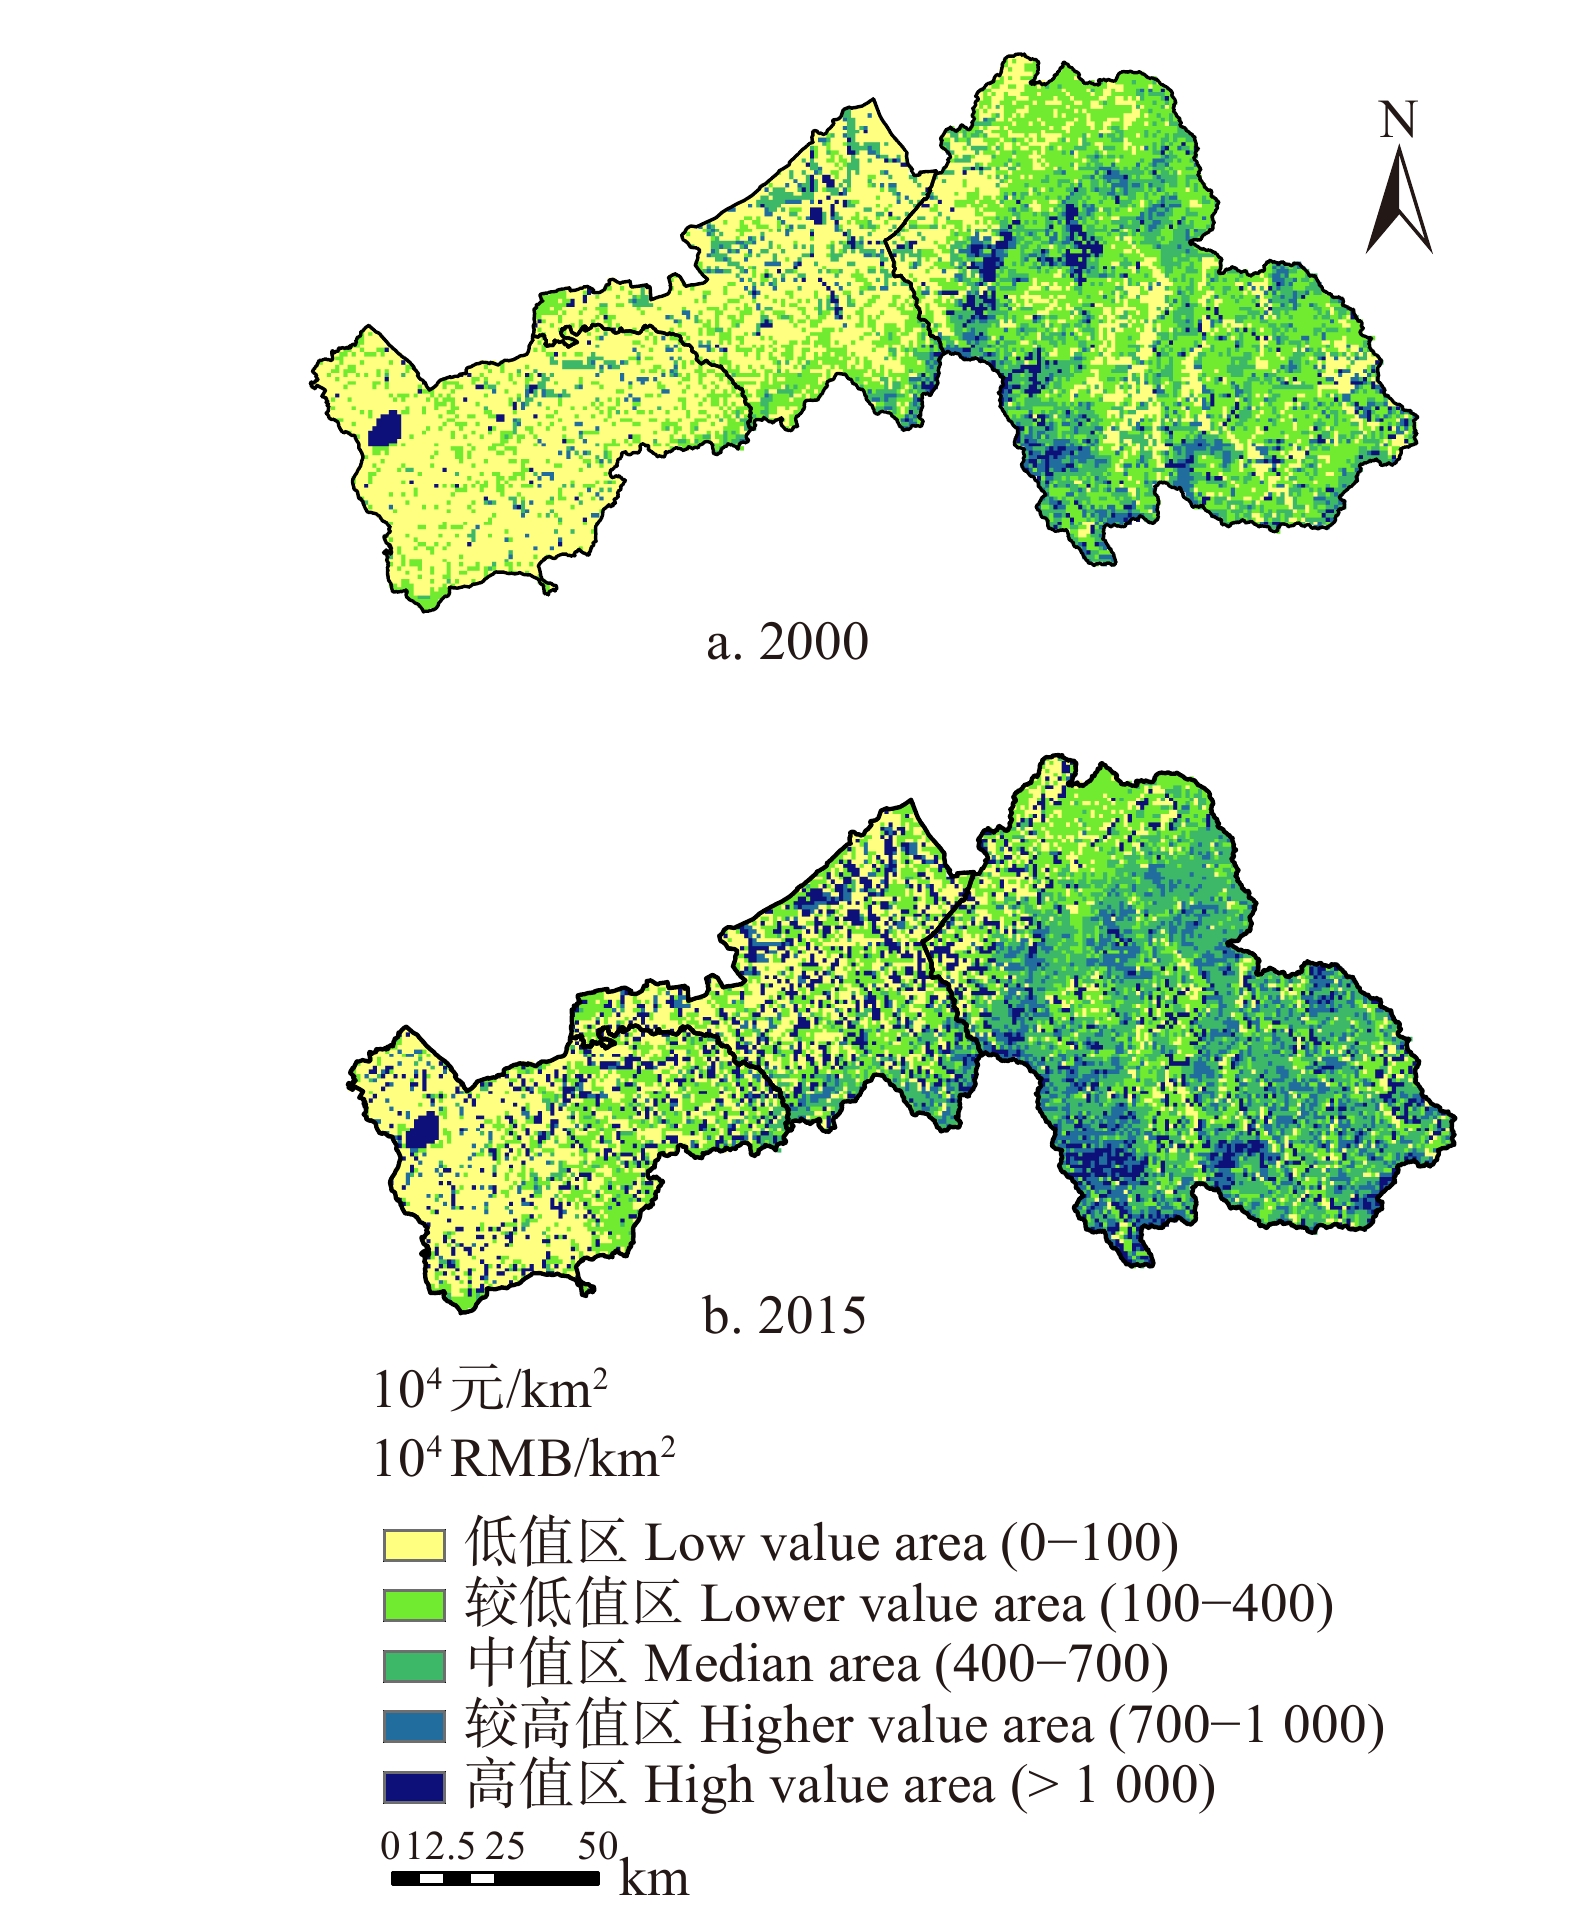
图 7 2000—2015年河北坝上生态系统服务价值空间分布图
Figure 7. Spatial distribution of ecosystem service value of Bashang Area from 2000 to 2015
![]()
图 8 2000—2015年河北坝上生态系统服务价值变化图
Figure 8. Spatial variation of ecosystem service value in the Bashang Area from 2000 to 2015
表 1 2000—2015年河北坝上土地利用类型面积变化
Table 1 Changes of land use type in Bashang Area from 2000 to 2015
类型 Type 2000−2005 2005−2010 2010−2015 2000−2015 面积变化Variation of
area /km2变化比例Variance ratio/% 面积变化Variation of area/km2 变化比例Variance ratio/% 面积变化Variation of area/km2 变化比例Variance ratio/% 面积变化Variation of area/km2 变化比例Variance ratio/% 建筑用地
Build-up land5 1.31 3 1.28 16 6.75 24 10.48 农田
Farmland6 0.09 18 0.26 − 9 − 0.13 15 0.22 林地
Forestland14 0.31 0 0.00 0 0.00 14 0.31 水域
Water area− 11 − 7.64 12 9.02 0 0.00 1 0.69 荒漠
Desert0 0.00 0 0.00 0 0.00 0 0.00 草地
Grassland− 13 − 0.32 − 12 − 0.29 − 1 − 0.02 − 26 − 0.63 湿地
Wetland− 1 − 0.16 − 21 − 3.32 − 6 − 0.98 − 28 − 4.42 注:此处的湿地是指沼泽地,水域包括河渠、湖泊、水库坑塘、滩地和冰川积雪。下同。Notes: the wetland here refers to the marshland, and the water area includes river canals, lakes, reservoir pits, beaches and glacial snow.Same as below.  下载: 导出CSV
表 2 2000—2015年坝上土地利用类型转移矩阵
Table 2 Land use type transfer matrix in Bashang Area from 2000 to 2015
km2 年份
Year类型
Type2015 农田
Farmland林地
Forestland草地
Grassland湿地
Wetland建筑用地
Build-up land荒漠
Desert水域
Water area2000 农田 Farmland 6 800 16 0 2 16 0 0 林地 Forestland 2 4 568 0 0 1 0 0 草地 Grassland 22 1 4 079 0 0 0 3 湿地 Wetland 25 0 0 604 3 0 2 建筑用地 Build-up land 0 0 0 0 229 0 0 荒漠 Desert 0 0 0 0 0 12 0 水水域 Water area 0 0 4 0 0 0 140
下载: 导出CSV
表 3 2000—2015年河北坝上生态系统服务价值及其变化
Table 3 Value of ecosystem services and its changes in Bashang Area during 2000−2015
类型
Type2000 ESV/108 元
2000 ESV/108 RMB2005 ESV/108 元
2005 ESV/108 RMB2010 ESV/108 元
2010 ESV/108 RMB2015 ESV/108 元
2015 ESV/ 108 RMB2000—2015年变化量/108 元
Variation of ESV in 2000−2015/108 RMB2000—2015年变化比例
Variance ratio in 2000−2015/%农田 Farmland 28.97 34.51 37.81 63.64 34.67 119.72 林地 Forestland 179.03 244.26 236.27 284.09 105.06 58.68 草地 Grassland 205.43 211.13 247.24 313.22 107.79 52.47 湿地 Wetland 45.85 43.19 52.96 128.97 83.12 181.26 荒漠 Desert 0.02 0.04 0.03 0.21 0.19 853.15 水域 Water area 31.84 27.72 39.72 45.85 14.01 43.98 合计Total 491.14 560.85 614.03 835.98 344.84 70.21
下载: 导出CSV
表 4 2000—2015年坝上不同服务功能的价值统计
Table 4 Value statistics of different ecosystem services in the Bashang Area during 2000−2015
生态系统服务
Ecosystem service生态系统服务价值/108元
Ecosystem service value/108 RMB生态系统服务价值变化比例
Variance ratio in ecosystem service value/%2000 2005 2010 2015 2000−2005 2005−2010 2010−2015 2000−2015 食物生产 Food production 12.88 14.56 15.51 29.62 13.00 6.50 91.04 56.52 原料生产 Raw material production 14.40 16.64 17.57 28.69 15.60 5.57 63.26 49.79 水资源供给 Water resource supply 9.77 9.95 11.92 11.81 1.83 19.83 − 0.94 17.27 气体调节 Gas regulation 44.80 51.40 55.16 86.52 14.70 7.31 56.85 48.22 气候调节 Climate regulation 114.82 130.88 139.68 205.26 14.00 6.72 46.95 44.06 净化环境 Purification environment 37.50 42.31 45.53 77.06 12.80 7.62 69.25 51.33 水文调节 Hydrological regulation 114.61 117.84 140.42 137.83 2.83 19.16 − 1.85 16.85 土壤保持 Soil conservation 66.80 92.60 96.98 89.37 38.60 4.72 − 7.84 25.26 维持养分循环 Maintain nutrient cycling 4.74 5.34 5.73 9.32 12.60 7.44 62.50 49.12 生物多样性 Biodiversity 48.70 54.64 58.88 107.62 12.20 7.75 82.80 54.75 美学景观 Aesthetic landscape 22.12 24.66 26.65 52.87 11.50 8.06 98.38 58.16 合计 Total 491.14 560.84 614.04 835.98 14.20 9.49 36.14 41.25
下载: 导出CSV
表 5 2000—2015年生态系统服务价值分级统计
Table 5 Grading statistics of ecosystem service value for Bashang Area during 2000−2015
生态系统服务价值/(104元·km− 2)
Ecosystem service value/(104 RMB·km− 2)2000 2015 2000−2015 面积
Area/km2比例
Percentage/%面积
Area/km2比例
Percentage/%面积
Area/km2比例
Percentage/%低值区 Low value area (0−100) 6 875 41.59 4 326 26.17 − 2 549 − 15.42 较低值区 Lower value area (100−400) 5 188 31.38 4 383 26.51 − 805 − 4.87 中值区 Median area (400−700) 2 794 16.90 3 487 21.09 693 4.19 较高值区 Higher value area (700−1 000) 989 5.98 2 024 12.24 1 035 6.26 高值区 High value area (> 1 000) 686 4.15 2 312 13.98 1 626 9.84 注:比例均为占研究区总面积的比例 。Note: the percentage all means the percentage in the total study area.
下载: 导出CSV
表 6 2000—2015年坝上生态经济协调度变化
Table 6 Changes in EEH in Bashang Area from 2000 to 2015
年份 Year Sr Qr EEH 2000−2005 15.44% 119.49% 0.13 2005−2010 7.37% 106.29% 0.07 2010−2015 34.24% 81.75% 0.42 2000−2015 66.39% 722.92% 0.09 注:GDP、人口数据来源于2001、2006、2011、2016年河北经济年鉴。Note: the GDP and population data come from the Hebei Province Economic Yearbook in 2001, 2006, 2011, 2016.
下载: 导出CSV
-
[1] 赵海凤.四川省森林生态系统服务价值计量与分析[D]. 北京: 北京林业大学, 2014. Zhao H F. The value of forest ecosystem services accounting and analysis in Sichuan, China[D]. Beijing: Beijing Forestry University, 2014.
[2] 王兵. 生态连清理论在森林生态系统服务功能评估中的实践[J]. 中国水土保持学报, 2016, 14(1):1−11. Wang B. Practice of theory of ecological continuous inventory system in the evaluation of forest ecosystem services function[J]. Science of Soil and Water Conservation, 2016, 14(1): 1−11.
[3] 高渐飞, 熊康宁. 喀斯特石漠化生态系统服务价值对生态治理的响应: 以贵州花江峡谷石漠化治理示范区为例[J]. 中国农业生态学报, 2015, 23(6):775−784. Gao J F, Xiong K N. Ecosystem service value responses to ecological control in Karst region: a case study of Huajiang Gorge Demonstration Area of Rocky Desertification Control in Guizhou[J]. Chinese Journal of Eco-Agriculture, 2015, 23(6): 775−784.
[4] 苏海霞, 马礼, 郭万翠. 坝上沽源县土地利用变化对生态系统服务价值的影响[J]. 干旱地区农业研究, 2008(4):196−200. Su H X, Ma L, Guo W C. Effects of land use change on values of ecosystem services of Guyuan County[J]. Agriculture Research in the Arid Areas, 2008(4): 196−200.
[5] 丁彬, 李学明, 孙学晖, 等. 经济发展模式对乡村生态系统服务价值保育和利用影响: 以鲁中山区三个村庄为例[J]. 生态学报, 2016, 36(10):3033−3052. Ding B, Li X M, Sun X H, et al. Impact of economic development model on ecosystem service value: A case study of three mountain villages in Middle Shandong, China[J]. Acta Ecologica Sinica, 2016, 36(10): 3033−3052.
[6] Costanza R, d ’Arge R, de Groot R S, et al. The value of the world’s ecosystem services and natural capital[J]. Nature, 1997, 387: 253−260. doi: 10.1038/387253a0
[7] 欧阳志云, 王如松, 赵景柱. 生态系统服务功能及其生态经济价值评价[J]. 应用生态学报, 1999, 10(5):635−640. doi: 10.3321/j.issn:1001-9332.1999.05.034 Ouyang Z Y, Wang R S, Zhao J Z. Ecosystem services and their economic valuation[J]. Chinese Journal of Applied Ecology, 1999, 10(5): 635−640. doi: 10.3321/j.issn:1001-9332.1999.05.034
[8] 谢高地, 甄霖, 鲁春霞, 等. 一个基于专家知识的生态系统服务价值化方法[J]. 自然资源学报, 2008, 23(5):911−919. doi: 10.3321/j.issn:1000-3037.2008.05.019 Xie G D, Zhen L, Lu C X, et al. Expert knowledge based valuation method of ecosystem service in China[J]. Journal of Natural Resources, 2008, 23(5): 911−919. doi: 10.3321/j.issn:1000-3037.2008.05.019
[9] 谢高地, 张彩霞, 张雷明, 等. 基于单位面积价值当量因子的生态系统服务价值化方法改进[J]. 自然资源学报, 2015, 30(8):1243−1254. doi: 10.11849/zrzyxb.2015.08.001 Xie G D, Zhang C X, Zhang L M, et al. Improvement of the evaluation method for ecosystem service value based on per unit area[J]. Journal of Natural Resources, 2015, 30(8): 1243−1254. doi: 10.11849/zrzyxb.2015.08.001
[10] 陈彧, 李江风, 徐佳. 基于GWR的湖北省社会经济因素对生态服务价值的影响[J]. 中国土地科学, 2015, 29(6):89−96. Chen Y, Li J F, Xu J. The impact of socio-economic factors on ecological service value in Hubei Province: a geographically weighted regression approach[J]. China Land Science, 2015, 29(6): 89−96.
[11] 柴仲平, 王雪梅, 蒋平安. 石河子市土地利用变化及其对绿洲生态系统服务功能影响分析[J]. 干旱区资源与环境, 2010, 24(10):19−24. Chai Z P, Wang X M, Jiang P A. Impact of land use type change on ecosystem service function in Shihezi oasis[J]. Journal of Arid Land Resources and Environment, 2010, 24(10): 19−24.
[12] 孙慧兰, 陈亚宁, 李卫全, 等. 新疆伊犁河流域草地类型特征及其生态服务价值研究[J]. 中国沙漠, 2011, 31(5):1273−1277. Sun H L, Chen Y N, Li W Q, et al. Study on types and ecological service values of grassland in the Ili River Basin, Xinjiang, China[J]. Journal of Desert Research, 2011, 31(5): 1273−1277.
[13] 彭建刚, 周月明, 安文明, 等. 奇台绿洲荒漠交错带生态系统服务功能价值评估研究[J]. 新疆农业科学, 2010, 47(8):1665−1670. doi: 10.6048/j.issn.1001-4330.2010.08.035 Peng J G, Zhou Y M, An W M, et al. Assessment on Functional Value of Ecosystem Service in Oasis and Desert Criss—cross Zone in Qitai Region[J]. Xinjiang Agricultural Sciences, 2010, 47(8): 1665−1670. doi: 10.6048/j.issn.1001-4330.2010.08.035
[14] 毛欢. 区域土地利用/覆被变化及其生态系统服务价值响应研究: 以四川省江油市为例[D]. 成都: 四川师范大学, 2015. Mao H. Research on regional land use/cover change and its ecosystem service value response: a case study of Jiangyou City in Sichuan Province[D]. Chengdu: Sichuan Normal University, 2015.
[15] 武爱彬, 赵艳霞. 坝上高原生态用地时空格局演变与生态系统服务价值分析[J]. 农业工程学报, 2017, 33(2):283−290. doi: 10.11975/j.issn.1002-6819.2017.02.039 Wu A B, Zhao Y X. Analysis of ecological land pattern evolution and ecosystem service value in Bashang Plateau[J]. Transactions of the Chinese Society of Agricultural Engineering, 2017, 33(2): 283−290. doi: 10.11975/j.issn.1002-6819.2017.02.039
[16] 孙丕苓, 许月卿, 刘庆果, 等. 环京津贫困带土地利用多功能性的县域尺度时空分异及影响因素[J]. 农业工程学报, 2017, 33(15):283−292. Sun P L, Xu Y Q, Liu Q G, et al. Spatiotemporal differentiation and driving factors of multi-functionality of land use in county scale in poverty belt around Beijing and Tianjin[J]. Transactions of the Chinese Society of Agricultural Engineering, 2017, 33(15): 283−292.
[17] 孙丕苓. 生态安全视角下的环京津贫困带土地利用冲突时空演变研究[D]. 北京: 中国农业大学, 2017. Sun P L. Temporal and spatial evolution of land use conflict in the poverty belt around Beijing-Tianjin from the perspective of ecological security[D]. Beijing: China Agricultural University, 2017.
[18] 孙洪艳. 河北省坝上土地荒漠化机制及生态环境评价[D]. 北京: 中国地质大学, 2005. Sun H Y. Study on Mechanism of Desertification and Evaluation of Ecologic Environment in Bashang, Hebei Province[D]. Beijing: China University of Geosciences, 2005.
[19] 刘纪远, 张增祥, 庄大方, 等. 20世纪90年代中国土地利用变化时空特征及其成因分析[J]. 地理研究, 2003, 22(1):1−12. doi: 10.3321/j.issn:1000-0585.2003.01.001 Liu J Y, Zhang Z X, Zhuang D F, et al. A study on the spatial-temporal dynamic changes of land- use and driving forces analyses of China in the 1990s[J]. Geographical Research, 2003, 22(1): 1−12. doi: 10.3321/j.issn:1000-0585.2003.01.001
[20] Liu J Y, Liu M L, Zhuang D F, et al. Study on spatial pattern of land-use change in China during 1995−2000[J]. Science in China Series D: Earth Sciences, 2003, 46(4): 373−384.
[21] Liu J Y, Zhang Z X, Xu X L, et al. Spatial patterns and driving forces of land use change in China during the early 21stcentury[J]. Journal of Geographical Sciences, 2010, 20(4): 483−494. doi: 10.1007/s11442-010-0483-4
[22] Liu J Y, Kuang W H, Zhang Z X, et al. Spatiaotemporal characteristics, patterns and causes of landuse changes in China since the late 1980s[J]. Journal of Geographical Sciences, 2014, 24(2): 195−210. doi: 10.1007/s11442-014-1082-6
[23] Liu W C, Liu J Y, Kuang W H, et al. Examining the influence of the implementation of Major Function-oriented Zones on built-up area expansion in China[J]. Journal of Geographical Sciences, 2017, 27(6): 643−660. doi: 10.1007/s11442-017-1398-0
[24] 刘纪远, 宁佳, 匡文慧, 等. 2010-2015年中国土地利用变化的时空格局与新特征[J]. 地理学报, 2018, 73(5):789−802. Liu J Y, Ning J, Kuang W H, et al. Spatio-temporal patterns and characteristics of land-use change in China during 2010-2015[J]. Acta Geographica Sinica, 2018, 73(5): 789−802.
[25] 中国科学院资源环境科学数据中心. http://www.resdc.cn/. Chinese Academy of Sciences Resource and Environmental Science Data Center. http://www.resdc.cn/.
[26] 肖玉, 谢高地, 安凯. 青藏高原生态系统土壤保持功能及其价值[J]. 生态学报, 2003, 23(11):2367−2378. doi: 10.3321/j.issn:1000-0933.2003.11.021 Xiao Y, Xie G D, An K. The function and economic value of soil conservation of ecosystems in Qinghai-Tibet Plateau[J]. Acta Ecologica Sinica, 2003, 23(11): 2367−2378. doi: 10.3321/j.issn:1000-0933.2003.11.021
[27] 张静, 曹生奎, 曹广超, 等. 青海湖流域土壤保持量动态变化[J]. 水土保持通报, 2016, 36(2):326−331, 350. Zhang J, Cao S K, Cao G C, et al. Variation of soil conservation quantity in Qinghai Lake Basin[J]. Bulletin of Soil and Water Conservation, 2016, 36(2): 326−331, 350.
[28] 熊侣英, 师学义. 黄土山丘区土地利用变化对生态系统服务价值的影响: 以长河流域为例[J]. 水土保持研究, 2018, 25(2):335−340, 389. Xiong L Y, Shi X Y. Effects of Land Use Change on ecosystem service value in the loess hilly area: a case study of the Changhe River Basin[J]. Research of Soil and Water Conservation, 2018, 25(2): 335−340, 389.
[29] 吴琳娜, 杨胜天, 刘晓燕, 等. 1976年以来北洛河流域土地利用变化对人类活动程度的响应[J]. 地理学报, 2014, 69(1):54−63. doi: 10.11821/dlxb201401005 Wu L N, Yang S T, Liu X Y, et al. Response analysis of land use change to the degree of human activities in Beiluo River basin since 1976[J]. Acta Geographica Sinica, 2014, 69(1): 54−63. doi: 10.11821/dlxb201401005
[30] 谢高地, 鲁春霞, 冷允法, 等. 青藏高原生态资源的价值评估[J]. 自然资源学报, 2003, 18(2):189−196. doi: 10.3321/j.issn:1000-3037.2003.02.010 Xie G D, Lu C X, Leng Y F, et al. Ecological assets valuation of the Tibetan Plateau[J]. Journal of Natural Resources, 2003, 18(2): 189−196. doi: 10.3321/j.issn:1000-3037.2003.02.010
[31] Song W, Deng X Z. Land-use/land-cover change and ecosystem service provision in China[J]. Science of the Total Environment, 2017, 576: 705−719. doi: 10.1016/j.scitotenv.2016.07.078
[32] 成六三. 生态保护区生态服务价值对土地利用的响应−以重庆市武隆区为例[J]. 人民长江, 2018, 49(2):15−18, 55. Cheng L S. Responses of ecological services value to land use in ecological protection area: case of Wulong County, Chongqing[J]. Yangtze River, 2018, 49(2): 15−18, 55.
[33] 孙慧兰, 李卫红, 陈亚鹏, 等. 新疆伊犁河流域生态服务价值对土地利用变化的响应[J]. 生态学报, 2010, 30(4):887−894. Sun H L, Li W H, Chen Y P, et al. Response of ecosystem service value to land use changes in the Ili River Basin, Xinjiang, China[J]. Acta Ecologica Sinica, 2010, 30(4): 887−894.
[34] 魏晓旭, 赵军, 魏伟, 等. 基于县域单元的中国生态经济系统协调度及空间演化[J]. 地理科学进展, 2014, 33(11):1535−1545. doi: 10.11820/dlkxjz.2014.11.010 Wei X X, Zhao J, Wei W, et al. Coordinated development of ecological-economic system and spatial evolution based on county unit in China[J]. Progress in Geography, 2014, 33(11): 1535−1545. doi: 10.11820/dlkxjz.2014.11.010
-
期刊类型引用(2)
1. 谷国泽,宋魁彦. 水性清漆涂饰对皮影表面的装饰效果. 家具. 2025(01): 19-22 .  百度学术
百度学术
2. 钟成龙,侯贤锋,卓光武,高振忠,涂登云,胡传双. 重组竹表面涂饰工艺研究. 竹子学报. 2023(02): 41-47 . 百度学术
其他类型引用(2)


计量
- 文章访问数: 2376
- HTML全文浏览量: 884
- PDF下载量: 71
- 被引次数: 4
