
Construction of stand basal area and volume growth model for Quercus and Populus in Henan Province of central China
-
摘要:目的建立河南省栎类和杨树林分断面积和蓄积生长模型,为森林可持续经营提供基础数据。方法基于河南省最近3期一类森林资源清查数据,从9个具有生物学意义的备选模型中选出一个最优基础模型。以树种和立地等级作为哑变量,构建林分断面积和蓄积生长模型。结果利用全部样地数据拟合9个备选模型,断面积和蓄积最优生长模型都是Richards形式的模型,决定系数均在0.92以上。引入树种和立地等级作为哑变量后,与基础模型相比断面积和蓄积生长模型拟合精度都有所提高,其决定系数分别为0.98和0.94。结论带树种和立地等级的哑变量模型能同时反映河南省栎类和杨树林分断面积和蓄积生长规律,既减少了建模工作量,又提供了不同林分合并建模的方法。河南省栎类林分断面积和蓄积生长极限值高于杨树;相同林分密度条件下,栎类早期生长速率低于杨树,且栎类和杨树的生长速率均随着立地质量的下降而降低。
-
关键词:
- 断面积生长模型 /
- 蓄积生长模型 /
- 栎类 /
- 杨树 /
- Richards方程
Abstract:ObjectiveDeveloping the stand basal area and volume growth model for Quercus and Populus in Henan Province of central China was technical data support for forest sustainable management.MethodBased on the latest three data of national forest inventory in Henan Province, an optimal basic model was selected from 9 candidate models with biological significance. Taking account of the disturbance from species and site class, the stand basal area and volume growth model with dummy variable was constructed.ResultThe optimal models of 9 alternative models fitted to the total data were the form of Richards, whose coefficients of determination were all above 0.92. The fitting precision of the stand basal area and volume growth model with species and site class as dummy variable, whose coefficients of determination were 0.98, 0.94, respectively, was enhanced distinctly compared with basic model.ConclusionThe growth pattern of stand basal and volume for Quercus and Populus in Henan Province was described by the model with species and site class as dummy variable, which reduced the workload of computation, and also provided a method for integrating different forest stand. The limit values of stand basal area and volume for Quercus were higher than those for Populus, but were reversed in growth rate with the same stand density. Furthermore, the growth rates of stand basal area and volume with the same stand density for Quercus and Populus were both decreased with the decrease of site quality.-
Keywords:
- growth model of basal area /
- growth model of volume /
- Quercus /
- Populus /
- Richards equation
-
林分断面积和蓄积生长模型是林分生长和收获模型体系的重要组成部分[1],是研究森林生长规律的重要基础,在森林资源动态估测等方面有着重要应用价值,为森林经营提供基础的生长模型。众多研究或应用林分断面积或蓄积生长模型中,常用的模型形式有Richards和Schumacher[2−8]两大类。关于自变量的选择,应当包含年龄、密度和立地质量3个变量[9−10]。林分密度反映了林分对林地的利用程度,模型中主要使用的可变密度指标有单位面积林木株数和林分密度指数。大量实践结果表明模型中引入林分密度指数的拟合精度优于引入林木株数的拟合精度[7−9]。立地质量反映了林地的生产潜力,模型常采用立地指数或林分优势木平均高来表示立地质量[11−12]。
第8次全国森林资源清查结果显示,河南省森林面积为359.07万hm2,其中栎类(Quercus spp.)和杨树(Populus spp.)面积所占比例分别为30.97%和28.99%,在全省优势树种中位列前2名[13]。因此,开展这两个树种的断面积和蓄积生长模型研究,进而为评价立地质量提供了参考,为河南省森林资源经营决策提供了科学基础。
1. 数据与方法
1.1 研究区概况
河南省位于我国中东部、黄河中下游,地理坐标31°23′ ~ 36°22′N,112°21′ ~ 116°39′E,处于我国第2阶梯和第3阶梯的过渡地带,属暖温带−亚热带、湿润−半湿润季风气候。年均气温为12.8 ~ 15.5 ℃,年均降雨量为784.8 mm。土地总面积16.7万km2,其中林地面积504.98万hm2,森林覆盖率21.50%。森林植被类型以伏牛山主脉−淮河干流为界,南部属北亚热带常绿落叶阔叶林带,北部属南温带落叶阔叶林带。全省森林资源主要分布于太行山、伏牛山、桐柏山和大别山等山地和丘陵区,以天然阔叶林为主,主要发挥保持水土、涵养水源的生态功能;平原地区森林资源以杨树、泡桐(Paulownia spp.)等为主,主要分布于豫东黄淮海冲积平原和南阳盆地等区域[14]。
1.2 数据来源
本研究所用数据来源于河南省森林资源第6 ~ 8次(2003年、2008年和2013年)连续清查资料,样地形状为正方形,其面积为0.08 hm2。样地的调查因子主要有样地号、优势树种、起源、坡度、海拔、坡向、坡位、土壤(类型和厚度)、腐殖质层厚度、年龄、胸径、树高等以及样地的每木检尺数据。其中,乔木林的平均年龄则采用优势树种平均年龄,而平均树高的调查则是依据平均胸径大小,在主林层优势树种中选择3 ~ 5株平均样木,测定它们的树高,并利用算术平均法获取平均树高。密度指数采用Reineke密度指数,立地等级是根据立地条件划分成的5个等级。划分思路:在林分平均高生长模型中,约束与林分平均高生长过程相关性较高的立地因子(海拔、坡度、坡向、坡位、腐殖层厚度和土壤厚度)而进行树高分级[15]。详细划分方法见参考文献[16]。河南省栎类和杨树林分样地具体数据见表1。
表 1 河南省栎类和杨树样地数据统计Table 1. Summary statistics of sample plots of Quercus and Populus in Henan Province树种
Species调查年份
Survey year样地个数
Sample plot number林分年龄
Stand age林分密度指数
Stand density index林分断面积/(m2·hm− 2)
Stand basal area/(m2·ha− 1)林分蓄积/(m3·hm− 2)
Stand volume/(m3·ha− 1)栎类
Quercus spp.2003 442 5 ~ 110 42 ~ 1 597 0.82 ~ 49.05 2.68 ~ 298.34 2008 445 5 ~ 115 29 ~ 1 248 0.54 ~ 37.22 1.76 ~ 260.34 2013 484 5 ~ 120 29 ~ 1 401 0.56 ~ 39.89 1.85 ~ 279.04 杨树
Populus spp.2003 131 5 ~ 35 92 ~ 964 1.96 ~ 34.58 8.65 ~ 239.95 2008 355 5 ~ 33 45 ~ 959 0.96 ~ 28.42 4.16 ~ 189.70 2013 503 5 ~ 28 76 ~ 1 090 1.64 ~ 33.15 7.28 ~ 238.30 1.3 林分断面积和蓄积生长模型
在生长模型研究中,树木生长理论方程由于具有生物学意义而适用性广泛,主要分为Richards方程、Schumacher方程、Mitcherlich方程、Korf方程、Gompertz方程和Logistic方程等[17]。在自然环境中,林分生长极大程度上取决于林分年龄、林分拥挤程度和林地立地状况。由于林地立地状况比较复杂,因此在基础模型构建中,主要采用这些理论方程形式,建立林分断面积和蓄积与林分年龄和林分密度指数之间的关系。具体基础模型见表2。
表 2 林分断面积和蓄积生长基础模型Table 2. Basic growth model of stand basal area and volumn模型 Model 表达式 Expression Richards (M1) BA(V)=a(1−e−b(SS0)c⋅Age)d Schumacher (M2) BA(V)=ae−bAge(SS0)c Schumacher (M3) BA(V)=ea+bAge(SS0)c+dAge Hyperbola (M4) BA(V)=a⋅(Age⋅S)2(Age⋅S+b⋅Age+cS+d)2 Linear (M5) BA(V)=ea+b⋅Age+cS+d⋅Age⋅S Mitcherlich (M6) BA(V)=a(1−e−b(SS0)c⋅Age) Korf (M7) BA(V)=ae−b⋅Age−c(SS0)d Gompertz (M8) BA(V)=ae−be−c(SS0)d⋅Age Logistic (M9) BA(V)=a1+be−c(SS0)d⋅Age 注:BA、V、Age和S分别为林分断面积、蓄积、年龄和密度指数;a,b,c,d为模型参数,S0取2 000。Notes: BA, V, Age and S are basal area, volumn, age and density index of stand, respectively, and a, b, c, d are parameters of models. And the value of S0 is 2 000. 1.4 哑变量选择
哑变量又称为虚拟变量,常用于处理定性变量,将不能够定量处理的变量量化,达到一个模型同时反映多种情况的作用,对问题描述更简明[18]。在确定林分断面积和蓄积生长基础模型后,引入树种和立地等级作为哑变量,将栎类和杨树不同立地等级上的林分建立一个统一的模型。这样不仅减少了建模工作量,而且使得不同林分的生长模型具有统一形式。因此,引入0,1变量量化定性变量树种和立地等级。
δi={1当种树为栎类或立地等级为i0否则 i=1,2,⋯,5 1.5 模型评价
候选模型的评价指标有决定系数R2、误差偏差E、均方根误差RMSE和总相对误差TRE,计算公式如下:
R2=1−∑i(Vi−ˆVi)2/∑i(Vi−ˉV)2 (1) E=1n∑i(Vi−ˆVi) (2) RMSE=√∑i(Vi−ˆVi)2/n (3) {\rm{TRE}} = {{\displaystyle\sum\limits_i {({V_i} - {{\hat V}_i})} } \mathord{\; \left/ \; {\vphantom {{\displaystyle\sum\limits_i {({V_i} - {{\hat V}_i})} } {\sum\limits_i {{{\hat V}_i}} \times 100}}} \right. \kern-\nulldelimiterspace} {\displaystyle\sum\limits_i {{{\hat V}_i}} \times 100}} (4) 式中:
n 为样本总数,Vi 为第i 个样地林分蓄积(或断面积)实测值,ˆVi 为第i 个样地林分蓄积(或断面积)估计值,ˉV 为所有样地林分蓄积(或断面积)平均值。在评价和比较哑变量模型拟合精度方面,指标有赤池信息量(AIC)、贝叶斯信息量(BIC)、决定系数R2和均方根误差RMSE
AIC=−2lnl+2p (5) BIC=−2lnl+lnn⋅p (6) 式中:p为模型中参数个数,l表示模型极大似然函数值。
针对9个林分断面积和蓄积生长模型开展参数估计和模型拟合精度评价比较,以及考虑树种和立地等级的影响而引入哑变量模型。所有计算在R3.3.2的nls函数[19]和Forstat软件[20]上实现。
2. 结果与分析
2.1 林分断面积和蓄积生长基础模型选择
根据河南省一类清查数据,选择了1 372块栎类样地和989块杨树样地拟合了林分断面积和蓄积生长模型,统计各个模型的参数估计值和评价指标。断面积生长模型结果见表3,蓄积生长模型结果见表4(只列出决定系数R2最大的前3个模型)。
表 3 栎类和杨树林分断面积生长模型参数估计及评价指标Table 3. Parameter estimation and evaluation index for growth model of basal area in Quercus and Populus stand树种 Species 模型 Model 参数 Parameter 评价指标 Evaluation index a b c d E RMSE R2 TRE 栎类
Quercus spp.M1 46.78 0.078 5.514 0.186 0 0.013 9 1.009 0.982 0.557 M2 63.66 3.606 1.042 0.044 5 1.205 0.974 0.796 M3 4.27 − 6.576 1.139 − 2.276 0 − 0.018 1 1.148 0.977 0.722 杨树
Populus spp.M1 33.15 11.843 7.815 0.134 0 − 0.005 5 0.878 0.975 0.415 M2 69.82 1.109 1.040 − 0.009 3 0.906 0.973 0.442 M3 4.24 − 1.100 1.039 0.006 5 − 0.009 3 0.906 0.973 0.442 表 4 栎类和杨树林分蓄积生长模型参数估计及评价指标Table 4. Parameter estimation and evaluation index for growth model of volume in Quercus and Populus stand树种 Species 模型 Model 参数 Parameter 评价指标 Evaluation index a b c d E RMSE R2 TRE 栎类
Quercus spp.M1 396.58 0.015 2.513 0.426 3 0.234 4 11.821 0.925 3.092 M4 2 067 1 879 38.97 − 6 494 0.346 3 12.514 0.916 4.028 M7 396.45 4.168 0.663 0.730 4 − 0.136 7 12.149 0.921 3.761 杨树
Populus spp.M1 244.99 0.667 4.152 0.264 9 − 0.050 2 9.686 0.926 1.447 M2 495.11 2.238 1.078 − 0.077 1 9.940 0.922 1.542 M3 6.21 − 2.289 1.083 − 0.039 4 − 0.079 8 9.940 0.922 1.544 由表3可以看出:栎类和杨树林分断面积生长模型拟合效果整体上良好,决定系数R2都在0.973以上,最高达到0.982;Richards方程、Schumacher方程的两种形式拟合效果在9个模型中位列前3名;无论是栎类还是杨树,Richards方程拟合效果均最佳。由表4可以看出:栎类和杨树林分蓄积生长模型拟合效果良好,决定系数R2都在0.916以上,最高达到0.926;栎类林分蓄积生长模型中,Richards方程、Korf方程和Hyperbola方程拟合效果位列前3名,杨树林分蓄积生长模型拟合效果跟断面积一致,但拟合效果最好的都是Richards方程。从表3和表4结果得出:(1)林分断面积和蓄积生长模型以Richards方程形式最佳,选择模型M1作为基础模型;(2)林分断面积生长模型与蓄积生长模型可以使用相同模型形式。
2.2 哑变量模型构建
考虑树种对林分断面积和蓄积生长模型的影响,将树种作为哑变量,以模型M1为基础模型构建统一模型,分别将哑变量加入到参数a、b、c、d及其组合上。利用ForStat软件计算的结果见表5。
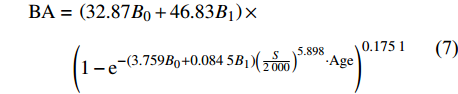
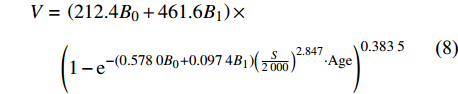
表 5 带树种哑变量模型的评价指标Table 5. Evaluation indices for the different alternatives of models with dummy in species哑变量 Dummy variable 断面积生长模型 Growth model of basal area 蓄积生长模型 Growth model of volume AIC BIC RMSE R2 AIC BIC RMSE R2 a, b, c, d 9 048 9 103 0.949 0.980 14 804 14 858 10.9 0.930 a, b, c 9 059 9 107 0.954 0.980 14 825 14 873 11.0 0.929 a, b 9 058 9 099 0.954 0.980 14 826 14 867 11.0 0.929 a 9 062 9 096 0.955 0.980 14 842 14 876 11.1 0.928 b 9 061 9 095 0.955 0.980 14 841 14 875 11.1 0.928 c 9 308 9 342 1.060 0.975 15 110 15 145 12.4 0.909 d 9 145 9 179 0.989 0.978 14 885 14 919 11.3 0.925 从表5可以得出:不同参数及其组合上哑变量模型拟合效果相当,断面积生长模型与蓄积生长模型表现效果一致;仅参数c或d上考虑哑变量效果较差,而全部参数引入哑变量效果最佳,但这时模型最复杂,并且R2并未有提升。从简化模型角度考虑,最终选择参数a、b上带哑变量的模型。断面积和蓄积生长模型分别为:
BA=(32.87B0+46.83B1)×(1−e−(3.759B0+0.0845B1)(S2000)5.898⋅Age)0.1751 (7) V=(212.4B0+461.6B1)×(1−e−(0.5780B0+0.0974B1)(S2000)2.847⋅Age)0.3835 (8) 式中:
B0=1 ,B1=0 ,表示优势树种为杨树;B0=0 ,B1=1 ,表示优势树种为栎类。在参数a、b上进一步引入立地等级作为哑变量,断面积和蓄积生长模型评价结果见表6。
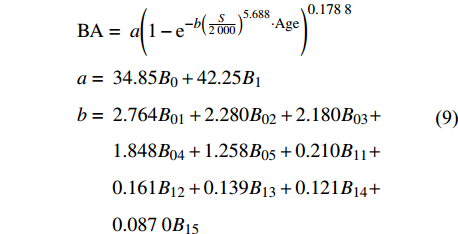
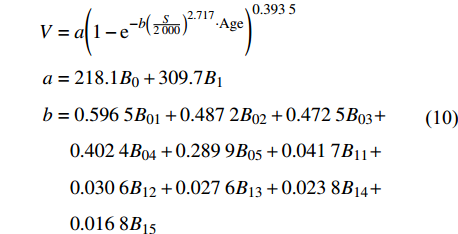
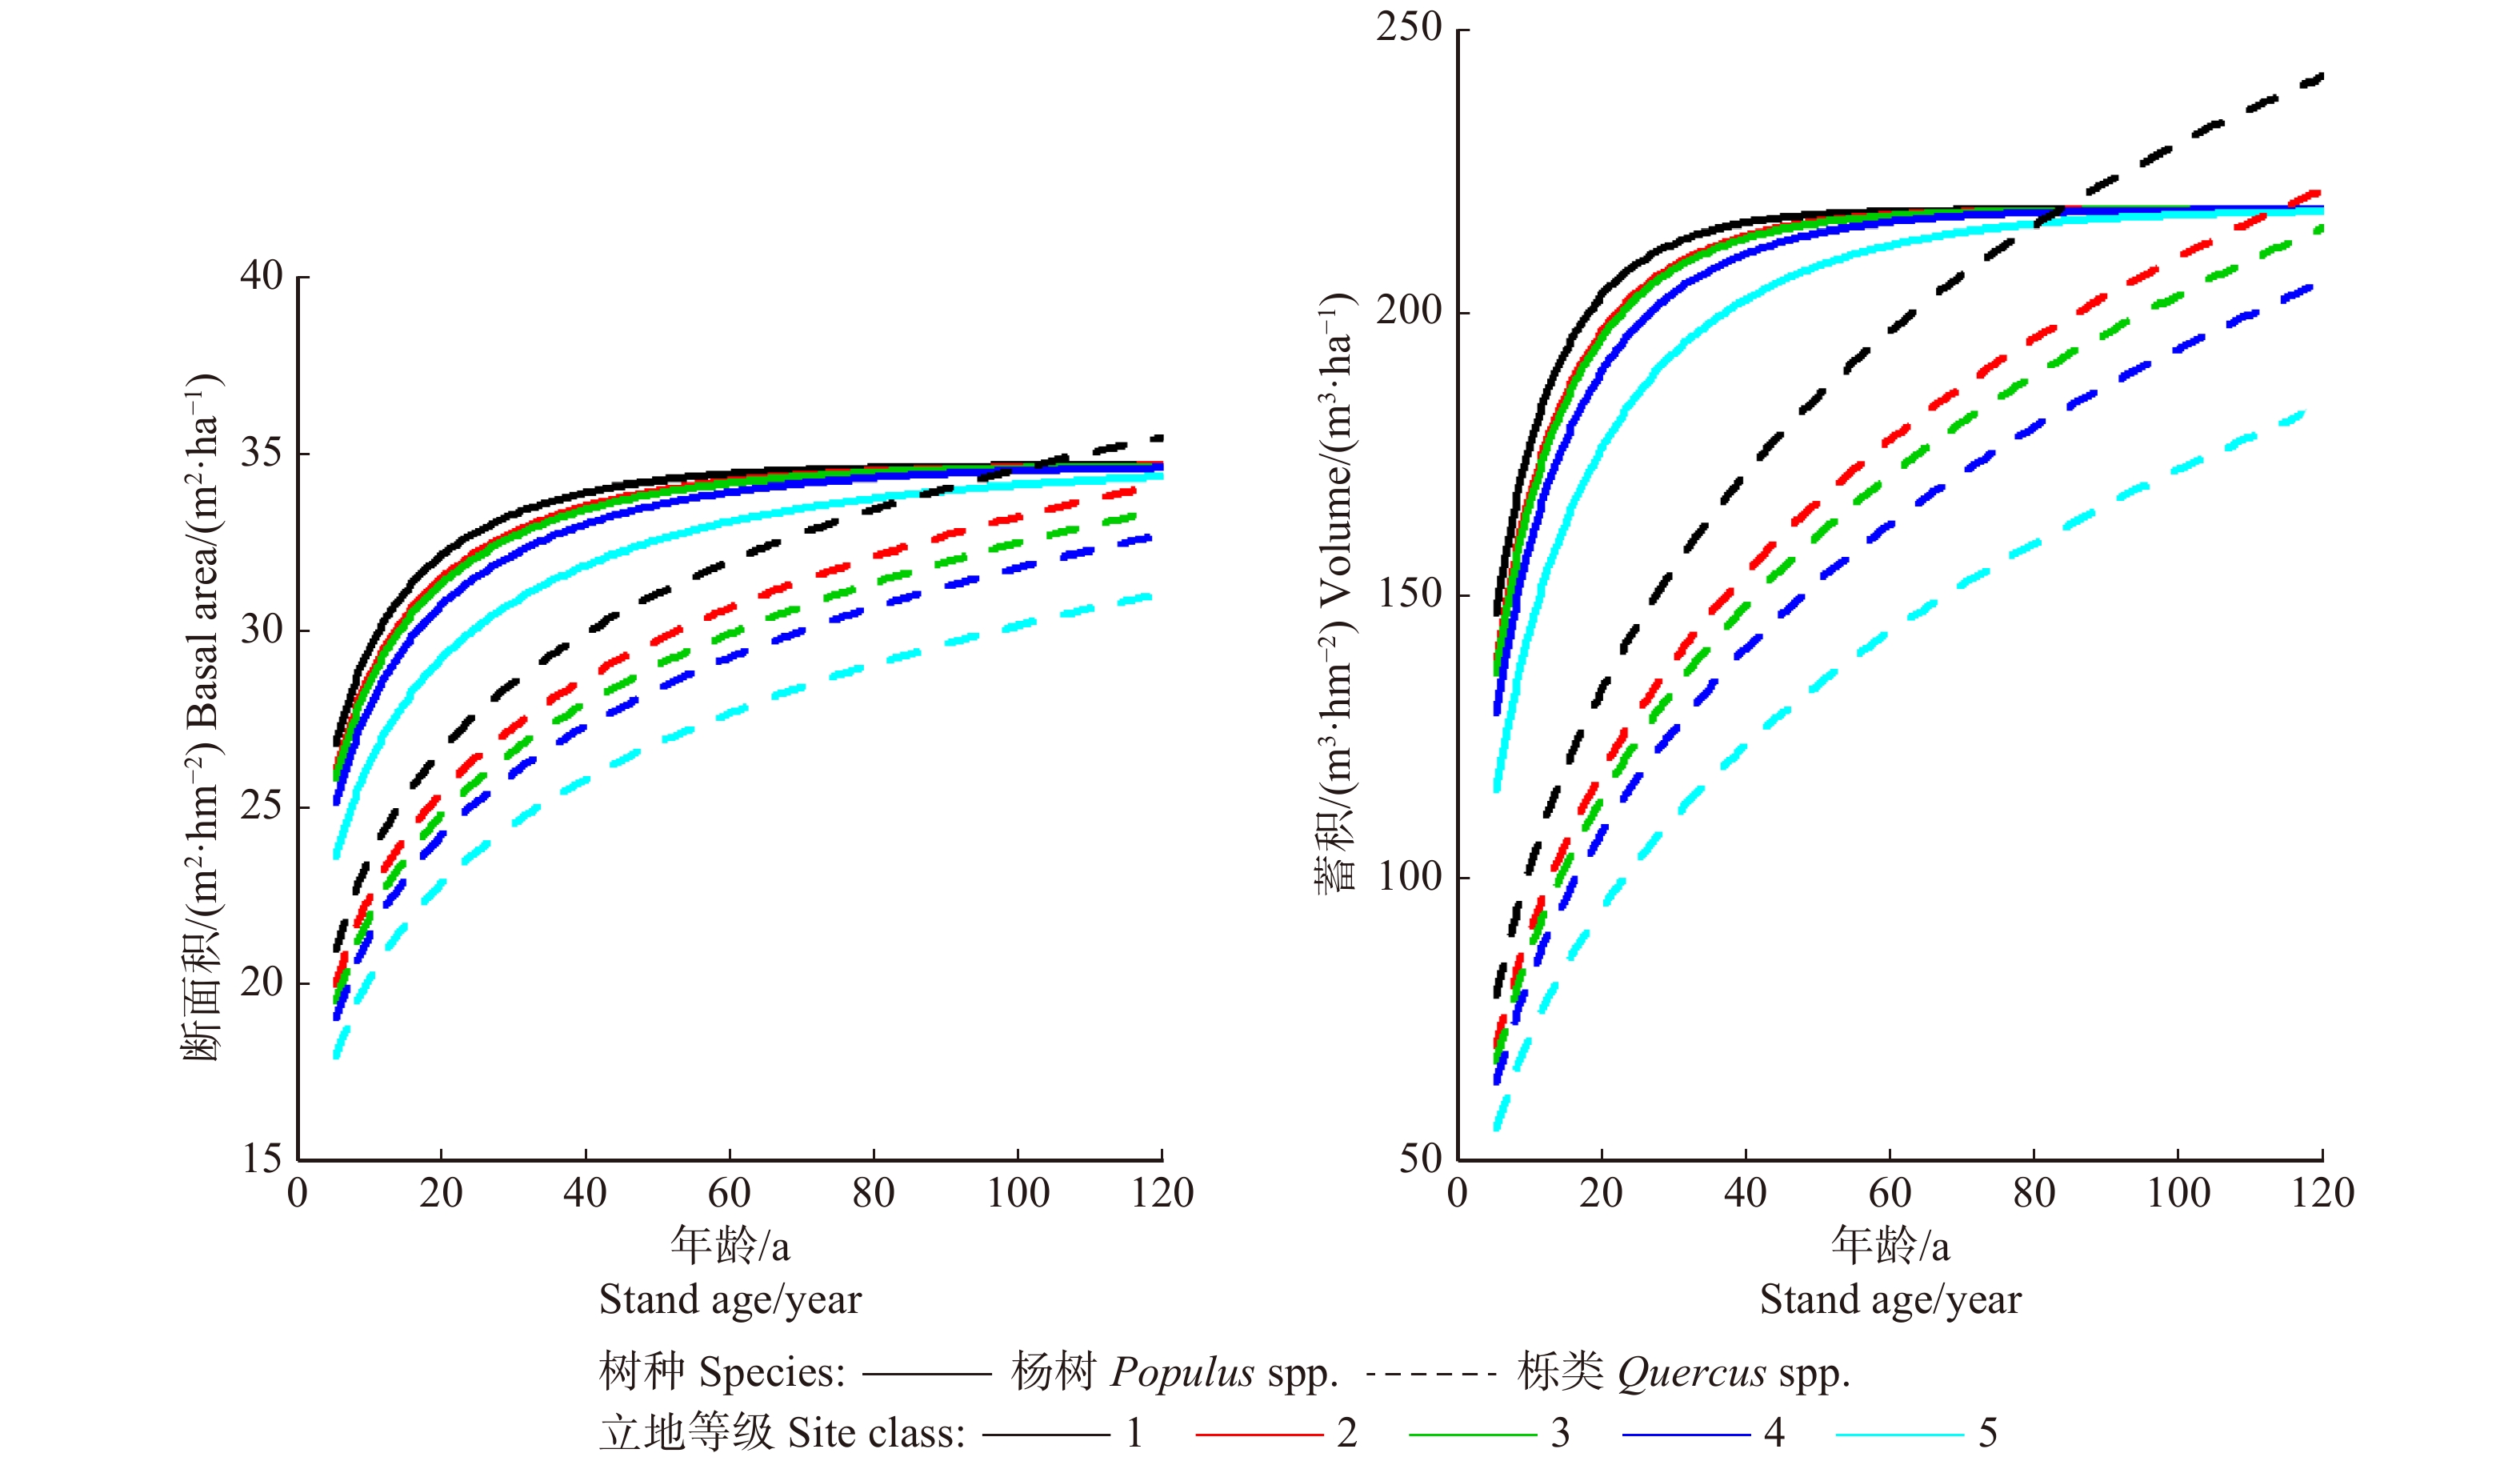
表 6 带树种和立地等级哑变量模型的评价指标Table 6. Evaluation indices for the different alternatives of models with dummy in species and site class哑变量 Dummy variable 断面积生长模型 Growth model of basal area 蓄积生长模型 Growth model of volume 树种 Species 立地等级 Site class AIC BIC RMSE R2 AIC BIC RMSE R2 a, b a, b 8 869 9 018 0.874 0.983 14 670 14 819 10.2 0.938 a a, b 8 891 8 986 0.885 0.983 14 681 14 775 10.3 0.937 a, b a 8 899 8 994 0.889 0.983 14 687 14 781 10.3 0.937 a b 8 893 8 954 0.888 0.983 b a 8 900 8 961 0.891 0.983 14 693 14 754 10.4 0.937 从表6得出:断面积和蓄积生长模型拟合效果较仅带树种的哑变量模型均有所提升;立地等级加到参数b上效果要好于参数a;参数a、b上同时带树种和立地等级效果最佳。但考虑到BIC以及模型的简化性,最终选择参数a上带树种、参数b上带树种和立地等级作为哑变量的模型(图1)。具体表达式如下:
![]() 图 1 栎类和杨树5个立地等级上林分断面积和蓄积生长模型曲线图(S取1 000)Figure 1. Curve graph of stand basal area and volume growth model for Quercus and Populus stand in five site levles (S equals to 1 000)
图 1 栎类和杨树5个立地等级上林分断面积和蓄积生长模型曲线图(S取1 000)Figure 1. Curve graph of stand basal area and volume growth model for Quercus and Populus stand in five site levles (S equals to 1 000)BA=a(1−e−b(S2000)5.688⋅Age)0.1788a=34.85B0+42.25B1b=2.764B01+2.280B02+2.180B03+1.848B04+1.258B05+0.210B11+0.161B12+0.139B13+0.121B14+0.0870B15 (9) V=a(1−e−b(S2000)2.717⋅Age)0.3935a=218.1B0+309.7B1b=0.5965B01+0.4872B02+0.4725B03+0.4024B04+0.2899B05+0.0417B11+0.0306B12+0.0276B13+0.0238B14+0.0168B15 (10) B0j={1树种为杨树,立地等级为j0否则 B1j={1树种为栎类,立地等级为j0否则 j=1,2,⋯,5 3. 结论与讨论
本文利用河南省森林一类清查数据,建立了栎类和杨树两个树种的林分断面积和蓄积生长模型。首先,在9个适用性强且具有明确生物学意义的备选模型中,利用决定系数R2、平均误差E和均方根误差RMSE指标综合选择拟合效果最佳的具Richards形式的M1模型作为基础模型,栎类林分断面积和蓄积生长模型的决定系数R2分别为0.982和0.925,杨树林分断面积和蓄积生长模型的决定系数R2分别为0.975和0.926;然后,引入树种作为哑变量,用统一的模型来表达断面积和蓄积生长规律,这样不仅减少了建模工作量,而且使不同林分的生长模型具有统一形式;最后,进一步考虑立地质量对模型的影响,同时引入树种和立地等级作为哑变量,断面积和蓄积生长模型精度进一步提高,决定系数R2分别为0.983和0.937。公式(9)和公式(10)可以用来描述河南省栎类和杨树林分断面积和蓄积生长过程,丰富了河南省森林经营的基础生长数据。
采用生长理论方程的优势是参数具有生物学意义,这里Richards方程中参数a表示渐进值,反映林分断面积或蓄积生长能够达到的上限值。从基础模型到带哑变量模型,通过参数a的估计值(断面积:杨树34.85,栎类42.25;蓄积:杨树218.1,栎类309.7)可知杨树林分每公顷断面积或蓄积极限值低于栎类林分。参数b反映林分断面积或蓄积的生长速率,同样通过这些模型参数b的估计值的比较,可知在相同林分密度情况下,早期杨树林分断面积或蓄积生长速率高于栎类林分(图1)。生长速率与立地质量关系密切,通过公式(9)和公式(10)可得出,随着立地等级下降,反映栎类和杨树林分生长速率的参数b也依次降低。事实上,根据样地实际情况,杨树林分平均年龄9年、林分平均密度指数434株/hm2,栎类林分平均年龄23年、林分平均密度指数444株/hm2,计算出杨树和栎类5个立地等级上断面积和蓄积的生长量(表7),发现这些生长量也随着立地等级下降而下降,与参数b表现的规律一致。这些规律与人们的直观经验是吻合的,说明所构建的林分断面积和蓄积生长模型客观上描述了河南省栎类和杨树的生长规律,并具有可靠性。
表 7 栎类和杨树林分断面积和蓄积生长量Table 7. Growth increment of stand basal area and volume in Quercus and Populus stand树种
Species项目
Item林分年龄/a
Stand age/year林分密度指数
Stand density index立地等级 Site class 1 2 3 4 5 杨树 Populus spp. 断面积 Basal area 9 434 0.259 0 0.251 0 0.249 0 0.242 0 0.226 0 蓄积 Volume 3.400 0 3.170 0 3.140 0 2.970 0 2.640 0 栎类 Quercus spp. 断面积 Basal area 23 444 0.094 1 0.089 8 0.087 5 0.085 3 0.080 4 蓄积 Volume 1.030 0 0.916 0 0.880 0 0.831 0 0.726 0 注:断面积和蓄积的单位分别是m2/hm2和m3/hm2。Note: units of basal area and volume are m2/ha and m3/ha, respectively. -
![]()
图 1 栎类和杨树5个立地等级上林分断面积和蓄积生长模型曲线图(S取1 000)
Figure 1. Curve graph of stand basal area and volume growth model for Quercus and Populus stand in five site levles (S equals to 1 000)
表 1 河南省栎类和杨树样地数据统计
Table 1 Summary statistics of sample plots of Quercus and Populus in Henan Province
树种
Species调查年份
Survey year样地个数
Sample plot number林分年龄
Stand age林分密度指数
Stand density index林分断面积/(m2·hm− 2)
Stand basal area/(m2·ha− 1)林分蓄积/(m3·hm− 2)
Stand volume/(m3·ha− 1)栎类
Quercus spp.2003 442 5 ~ 110 42 ~ 1 597 0.82 ~ 49.05 2.68 ~ 298.34 2008 445 5 ~ 115 29 ~ 1 248 0.54 ~ 37.22 1.76 ~ 260.34 2013 484 5 ~ 120 29 ~ 1 401 0.56 ~ 39.89 1.85 ~ 279.04 杨树
Populus spp.2003 131 5 ~ 35 92 ~ 964 1.96 ~ 34.58 8.65 ~ 239.95 2008 355 5 ~ 33 45 ~ 959 0.96 ~ 28.42 4.16 ~ 189.70 2013 503 5 ~ 28 76 ~ 1 090 1.64 ~ 33.15 7.28 ~ 238.30  下载: 导出CSV
表 2 林分断面积和蓄积生长基础模型
Table 2 Basic growth model of stand basal area and volumn
模型 Model 表达式 Expression Richards (M1) BA(V)=a(1−e−b(SS0)c⋅Age)d Schumacher (M2) BA(V)=ae−bAge(SS0)c Schumacher (M3) BA(V)=ea+bAge(SS0)c+dAge Hyperbola (M4) BA(V)=a⋅(Age⋅S)2(Age⋅S+b⋅Age+cS+d)2 Linear (M5) BA(V)=ea+b⋅Age+cS+d⋅Age⋅S Mitcherlich (M6) BA(V)=a(1−e−b(SS0)c⋅Age) Korf (M7) BA(V)=ae−b⋅Age−c(SS0)d Gompertz (M8) BA(V)=ae−be−c(SS0)d⋅Age Logistic (M9) BA(V)=a1+be−c(SS0)d⋅Age 注:BA、V、Age和S分别为林分断面积、蓄积、年龄和密度指数;a,b,c,d为模型参数,S0取2 000。Notes: BA, V, Age and S are basal area, volumn, age and density index of stand, respectively, and a, b, c, d are parameters of models. And the value of S0 is 2 000.
下载: 导出CSV
表 3 栎类和杨树林分断面积生长模型参数估计及评价指标
Table 3 Parameter estimation and evaluation index for growth model of basal area in Quercus and Populus stand
树种 Species 模型 Model 参数 Parameter 评价指标 Evaluation index a b c d E RMSE R2 TRE 栎类
Quercus spp.M1 46.78 0.078 5.514 0.186 0 0.013 9 1.009 0.982 0.557 M2 63.66 3.606 1.042 0.044 5 1.205 0.974 0.796 M3 4.27 − 6.576 1.139 − 2.276 0 − 0.018 1 1.148 0.977 0.722 杨树
Populus spp.M1 33.15 11.843 7.815 0.134 0 − 0.005 5 0.878 0.975 0.415 M2 69.82 1.109 1.040 − 0.009 3 0.906 0.973 0.442 M3 4.24 − 1.100 1.039 0.006 5 − 0.009 3 0.906 0.973 0.442
下载: 导出CSV
表 4 栎类和杨树林分蓄积生长模型参数估计及评价指标
Table 4 Parameter estimation and evaluation index for growth model of volume in Quercus and Populus stand
树种 Species 模型 Model 参数 Parameter 评价指标 Evaluation index a b c d E RMSE R2 TRE 栎类
Quercus spp.M1 396.58 0.015 2.513 0.426 3 0.234 4 11.821 0.925 3.092 M4 2 067 1 879 38.97 − 6 494 0.346 3 12.514 0.916 4.028 M7 396.45 4.168 0.663 0.730 4 − 0.136 7 12.149 0.921 3.761 杨树
Populus spp.M1 244.99 0.667 4.152 0.264 9 − 0.050 2 9.686 0.926 1.447 M2 495.11 2.238 1.078 − 0.077 1 9.940 0.922 1.542 M3 6.21 − 2.289 1.083 − 0.039 4 − 0.079 8 9.940 0.922 1.544
下载: 导出CSV
表 5 带树种哑变量模型的评价指标
Table 5 Evaluation indices for the different alternatives of models with dummy in species
哑变量 Dummy variable 断面积生长模型 Growth model of basal area 蓄积生长模型 Growth model of volume AIC BIC RMSE R2 AIC BIC RMSE R2 a, b, c, d 9 048 9 103 0.949 0.980 14 804 14 858 10.9 0.930 a, b, c 9 059 9 107 0.954 0.980 14 825 14 873 11.0 0.929 a, b 9 058 9 099 0.954 0.980 14 826 14 867 11.0 0.929 a 9 062 9 096 0.955 0.980 14 842 14 876 11.1 0.928 b 9 061 9 095 0.955 0.980 14 841 14 875 11.1 0.928 c 9 308 9 342 1.060 0.975 15 110 15 145 12.4 0.909 d 9 145 9 179 0.989 0.978 14 885 14 919 11.3 0.925
下载: 导出CSV
表 6 带树种和立地等级哑变量模型的评价指标
Table 6 Evaluation indices for the different alternatives of models with dummy in species and site class
哑变量 Dummy variable 断面积生长模型 Growth model of basal area 蓄积生长模型 Growth model of volume 树种 Species 立地等级 Site class AIC BIC RMSE R2 AIC BIC RMSE R2 a, b a, b 8 869 9 018 0.874 0.983 14 670 14 819 10.2 0.938 a a, b 8 891 8 986 0.885 0.983 14 681 14 775 10.3 0.937 a, b a 8 899 8 994 0.889 0.983 14 687 14 781 10.3 0.937 a b 8 893 8 954 0.888 0.983 b a 8 900 8 961 0.891 0.983 14 693 14 754 10.4 0.937
下载: 导出CSV
表 7 栎类和杨树林分断面积和蓄积生长量
Table 7 Growth increment of stand basal area and volume in Quercus and Populus stand
树种
Species项目
Item林分年龄/a
Stand age/year林分密度指数
Stand density index立地等级 Site class 1 2 3 4 5 杨树 Populus spp. 断面积 Basal area 9 434 0.259 0 0.251 0 0.249 0 0.242 0 0.226 0 蓄积 Volume 3.400 0 3.170 0 3.140 0 2.970 0 2.640 0 栎类 Quercus spp. 断面积 Basal area 23 444 0.094 1 0.089 8 0.087 5 0.085 3 0.080 4 蓄积 Volume 1.030 0 0.916 0 0.880 0 0.831 0 0.726 0 注:断面积和蓄积的单位分别是m2/hm2和m3/hm2。Note: units of basal area and volume are m2/ha and m3/ha, respectively.
下载: 导出CSV
-
[1] 杜纪山. 林木生长和收获预估模型的研究动态[J]. 世界林业研究, 1999, 12(4):19−22. Du J S. Research trends in trees growth and yield prediction models[J]. World Forestry Research, 1999, 12(4): 19−22.
[2] Fu L, Sharma R P, Zhu G, et al. A basal area increment-based approach of site productivity evaluation for multi-aged and mixed forests[J]. Forests, 2017, 8(4): 1−18.
[3] 王冬至, 张冬燕, 张志东, 等. 塞罕坝华北落叶松人工林断面积预测模型[J]. 北京林业大学学报, 2017, 39(7):10−17. Wang D Z, Zhang D Y, Zhang Z D, et al. Prediction model for basal area of Larix principis-rupprechtii plantation in Saihanba of Hebei Province, northern China[J]. Journal of Beijing Forestry University, 2017, 39(7): 10−17.
[4] Pienaar L V, Shiver B D. An analysis and models of basal area growth in 45-year-old unthinned and thinned slash pine plantation plots[J]. Forest Science, 1984, 30(4): 933−942.
[5] Matney T G, Sullivan A D. Compatible stand and stock tables for thinned and unthinned loblolly pine stands[J]. Forest Science, 1982, 28(1): 161−171.
[6] 姚丹丹, 雷相东, 张则路. 基于贝叶斯法的长白落叶松林分优势高生长模型研究[J]. 北京林业大学学报, 2015, 37(3):94−100. Yao D D, Lei X D, Zhang Z L. Bayesian parameter estimation of dominant height growth model for Changbai larch (Larix olgensis Henry) plantations[J]. Journal of Beijing Forestry University, 2015, 37(3): 94−100.
[7] 李春明. 利用非线性混合模型进行杉木林分断面积生长模拟研究[J]. 北京林业大学学报, 2009, 31(1):44−49. doi: 10.3321/j.issn:1000-1522.2009.01.008 Li C M. Simulating basal area growth of fir plantations using a nonlinear mixed modeling approach[J]. Journal of Beijing Forestry University, 2009, 31(1): 44−49. doi: 10.3321/j.issn:1000-1522.2009.01.008
[8] 李春明, 唐守正. 基于非线性混合模型的落叶松云冷杉林分断面积模型[J]. 林业科学, 2010, 46(7):106−113. Li C M, Tang S Z. The basal area model of mixed stands of larix olgensis, Abies nephrolepis and Picea jezoensis based on nonlinear mixed model[J]. Scientia Silvae Sinicae, 2010, 46(7): 106−113.
[9] 朱光玉, 胡松, 符利勇. 基于哑变量的湖南栎类天然林林分断面积生长模型[J]. 南京林业大学学报(自然科学版), 2018, 42(2):155−162. Zhu G Y, Hu S, Fu L Y. Basal area growth model for oak natural forest in Hunan Province based on dummy variable[J]. Journal of Nanjing Forestry University (Natural Sciences Edition), 2018, 42(2): 155−162.
[10] 杜纪山, 唐守正. 林分断面积生长模型研究评述[J]. 林业科学研究, 1997, 10(6):599−606. Du J S, Tang S Z. The review of studies on stand basal area growth model[J]. Forest Research, 1997, 10(6): 599−606.
[11] 郭艳荣, 吴保国, 刘洋, 等. 立地质量评价研究进展[J]. 世界林业研究, 2012, 25(5):47−52. Guo Y R, Wu B G, Liu Y, et al. Research progress of site quality evaluation[J]. World Forestry Research, 2012, 25(5): 47−52.
[12] Skovsgaard J P, Vanclay J K. Forest site productivity: a review of spatial and temporal variability in natural site conditions[J]. Forestry, 2013, 86(3): 305−315. doi: 10.1093/forestry/cpt010
[13] 国家林业局. 第八次全国森林资源清查结果[J]. 林业资源管理, 2014(1):1−2. State Forestry Bureau. The 8th national forest inventory[J]. Forest Resources Management, 2014(1): 1−2.
[14] 张振. 基于近自然经营理论的河南山区主要林分类型抚育经营技术研究[D]. 郑州: 河南农业大学, 2016. Zhang Z. Forest tending management techniques research of Henan mountainous main forest types based on the management theory of near naturalness[D]. Zhengzhou: Henan Agricultural University, 2016.
[15] 李海奎, 法蕾. 基于分级的全国主要树种树高−胸径曲线模型[J]. 林业科学, 2011, 47(10):83−90. doi: 10.11707/j.1001-7488.20111013 Li H K, Fa L. Height-diameter model for major tree species in China using the classified height method[J]. Scientia Silvae Sinicae, 2011, 47(10): 83−90. doi: 10.11707/j.1001-7488.20111013
[16] 雷相东, 符利勇, 李海奎, 等. 基于林分潜在生长量的立地质量评价方法与应用[J]. 林业科学, 2018, 54(12):116−126. doi: 10.11707/j.1001-7488.20181213 Lei X D, Fu L Y, Li H K, et al. Methodology and applications of site quality assessment based on potential mean annual increment[J]. Scientia Silvae Sinicae, 2018, 54(12): 116−126. doi: 10.11707/j.1001-7488.20181213
[17] 孟宪宇. 测树学[M]. 3版. 北京: 中国林业出版社, 2006. Meng X Y. Forest mensuration[M]. 3rd ed. Beijing: China Forestry Publishing House, 2006.
[18] 段光爽, 李学东, 冯岩, 等. 华北落叶松天然次生林树高曲线的混合效应模型[J]. 南京林业大学学报(自然科学版), 2018, 42(2):163−169. Duan G S, Li X D, Feng Y, et al. Developing a height-diameter relationship model with mixed random effects for Larix principis-rupprechtii natural secondary forests[J]. Journal of Nanjing Forestry University(Natural Sciences Edition), 2018, 42(2): 163−169.
[19] Pinheiro J C, Bates D M. Mixed-effects models in S and S-PLUS[M]. New York: Springer, 2000.
[20] 唐守正. 统计和生物数学模型计算[M]. 北京: 科学出版社, 2009. Tang S Z. Computation for statistics and biomathematical models[M]. Beijing: Science Press, 2009.
-
期刊类型引用(11)
1. 秦孝天,郭梦鸽,秦少华,陈瑞丹. 梅花新品种‘治章骨红重翠’跨品种群特性机制探究. 生物工程学报. 2024(01): 239-251 .  百度学术
百度学术
2. 周成宇,武怀燕,圣倩倩,曹福亮,祝遵凌. 33个观赏文冠果品系花瓣色彩的动态变化特征分析. 西部林业科学. 2023(05): 84-94 . 百度学术
3. 苏江硕,贾棣文,王思悦,张飞,蒋甲福,陈素梅,房伟民,陈发棣. 中国菊花遗传育种60年回顾与展望. 园艺学报. 2022(10): 2143-2162 . 百度学术
4. 付瀚森,张亚雯,赵阳阳,罗婷婷,邓慧杰,孟晨伟,王彩云. 菊花‘绿叮当’与毛华菊杂交后代花部性状杂种优势与混合遗传分析. 园艺学报. 2021(01): 96-106 . 百度学术
5. 周琦,赵峰,张慧会,祝遵凌. 香水莲花色素成分及含量的初步研究. 黑龙江农业科学. 2021(04): 72-78 . 百度学术
6. 侯瑞丽,武倩,闫星蓉,张芸香,郭晋平. 观赏型文冠果新品种花期颜色特征及其表型稳定性研究. 西北农业学报. 2021(01): 143-151 . 百度学术
7. 吴芳芳,原鑫,苏少文,贺丹,刘艺平,孔德政. 荷花品种的花器官表型性状及花色多样性分析. 河南农业大学学报. 2020(01): 24-29+37 . 百度学术
8. 赵晋陵,金玉,叶回春,黄文江,董莹莹,范玲玲,马慧琴,江静. 基于无人机多光谱影像的槟榔黄化病遥感监测. 农业工程学报. 2020(08): 54-61 . 百度学术
9. 丁苏芹,孙忆,李玺,唐东芹,史益敏. 小苍兰品种花色表型数量分类研究. 北方园艺. 2019(04): 85-91 . 百度学术
10. 袁培森,任守纲,翟肇裕,徐焕良. 基于半监督主动学习的菊花表型分类研究. 农业机械学报. 2018(09): 27-34 . 百度学术
11. 刘海英,高远,邢晨涛,甄俊琦,陆顺丽,王玉芝. 花青素苷提取专用菊种质及适宜采收期的筛选. 河南农业科学. 2018(09): 120-125 . 百度学术
其他类型引用(14)


计量
- 文章访问数: 2545
- HTML全文浏览量: 845
- PDF下载量: 112
- 被引次数: 25
