
Comparison in plant diversity in Haikou, Sanya and Wenchang cities of Hainan Province, southern China
-
摘要:目的通过对海南省3座城市的植物组成进行分析,探讨了各城市植物多样性形成差异的驱动因素,为今后城市植物多样性保护和布局等研究工作提供参考。方法以海南省的海口、文昌和三亚为研究对象,在城市规划区域内进行随机抽样的调查方法,调查内容包括样方内的物种、胸径、冠幅、株高、数量、植被覆盖面积等信息,应用β相异性指数研究群落和物种的组成差异,对各城市植物多样性在物种、功能和谱系层面进行显著性差异分析,通过对比探讨影响城市植物多样性差异的因素。结果(1)海口市规划区共统计了227种植物,归属于71科184属;三亚市规划区共统计了244种植物,归属于76科204属;文昌市规划区共统计了230种植物,归属于72科181属。(2)3座城市的乡土物种β相异性均高于外来物种,乔木层的物种β相异性比灌木层和草本层低。(3)3座城市的乔木层物种多样性指数无显著差异;文昌的灌木层物种多样性指数显著低于海口和三亚2个城市(P < 0.05);三亚和文昌草本层的Simpson指数和Shannon-Wiener指数均呈现显著差异(P < 0.05),且文昌的各多样性指数值较高。(4)文昌和另外2座城市之间灌木层的功能均匀度指数(FEve)和功能离散度指数(FDis)均呈现了显著差异,文昌的灌木层功能多样性指数显著低于海口和三亚(分别为P < 0.01和P < 0.001),与灌木层的物种多样性结果一致。(5)文昌乔木层的谱系多样性指数(PD)值显著高于海口,三亚灌木层的PD指数值显著高于文昌,文昌草本层的PD指数值显著高于海口和三亚(P < 0.01)。灌木层和草本层的谱系均匀度指数(PSE)结果与PD指数一致(分别为P < 0.001和P < 0.01),但在乔木层没有呈现显著差异(P = 0.690)。结论海南省3座城市的乡土物种组成差异性比外来物种更为明显,但整体植被种类未呈现出明显的同质性的特征。3座城市物种多样性、功能多样性和谱系多样性水平的高低趋势基本保持一致。未来研究中,分析城市中多个层面的植物多样性差异,可以更全面地对多样性格局的保护和控制提供决策依据。Abstract:ObjectiveThe driving factors of plant diversity differences among three cities in Hainan Province, southern China were discussed through the analysis of plant compositions. It provided a reference for future research on the protection and layout of urban plant diversity.MethodIn this research, Haikou City, Wenchang City and Sanya City were taken as research objects. A sample survey was conducted using random sampling in urban planning areas. We carried out surveys on the species list within the plot, the DBH, crown width, height and quantity of trees, as well as the vegetation coverage area in the plot, etc. The β-dissimilarity index was used to study the compositional differences of communities and species in different cities. We analyzed the differences in plant species diversity at the species, function, and phylogenetic levels, and factors which may influence urban plant diversity differences.Result(1) In the planning area of Haikou City, there were 227 plant species of 184 genera in 71 families. In the planning area of Sanya City, there were 244 plant species of 204 genera in 76 families. In the planning area of Wenchang City, there were 230 plant species of 181 genera in 72 families. (2) In the three cities, the β-dissimilarity index of the native species was higher than that of the exotic species, and the species β-dissimilarity of the arbor layer was lower than that of the shrub layer and the herb layer. (3) There was no significant difference in species diversity index values of the arbor layer. Diversity index value of shrub species in Wenchang City was significantly lower than those in Haikou and Sanya cities (P < 0.05). The herb layer diversity index values of Sanya and Wenchang showed significant differences (P < 0.05), and Wenchang’s diversity index value was higher. (4) The functional evenness index (FEve) and the functional dispersion index (FDis) of the shrub layer were significantly different, which were reflected between Wenchang City and the other two cities (P < 0.01 and P < 0.001, respectively). The diversity index value of Wenchang City was lower than that of Haikou and Sanya cities, which was consistent with the species diversity of the shrub layer. (5) The pedigree phylogenetic index (PD) of Wenchang City arbor layer was significantly higher than that of Haikou City (P < 0.01). The PD index of Sanya City shrub layer was significantly higher than that of Wenchang City. The PD index of Wenchang City herb layer was significantly higher than that of Haikou and Sanya cities (P < 0.01). The phylogenetic species evenness (PSE) results for the shrub and herb layers were consistent with the PD index (P < 0.001 and P < 0.01, respectively), but did not show significant differences in the arbor layer (P = 0.690).ConclusionThe vegetation types of the three cities in Hainan Province did not exhibit obvious homogeneity, while the differences in native species composition were more pronounced than those of exotic species. Species diversity, functional diversity and phylogenetic diversity levels in the three cities basically showed the same trend. In future studies, the analysis of plant diversity from multiple layers in cities could provide a more comprehensive decision-making basis for both the protection and the control of diversity patterns.
-
生物多样性为人类的生存发展提供了直接或间接的生态服务功能。在直接供给方面,生物多样性是人类各类食品的直接来源[1-2],并且丰富了民众的休闲娱乐内容[3];在间接服务功能方面,生物多样性与水文调节[4]、气候调节[5]、防控水土流失[6]等方面都有密不可分的联系。在全球环境快速演变中,生物多样性将持续为人类适宜生存生产环境的维持和发展提供重要的支撑[7]。
城市生物多样性保护的实质是对人居环境健康发展的保护[8-9],也是城市生态系统可持续性发展不可或缺的前提。植物多样性是生物多样性保护的重要组成部分[10],外来物种的引入、局部生境的改变和景观格局破碎化是城市植物多样性格局变化的重要成因[11]。研究表明,人为引入外来物种会促使城市植物多样性上升[12]。城市建设中大量使用混凝土造成的土壤板结,空气中的SO2和酸碱度升高,均会抑制乡土植物的正常传播和生长[13-14]。同时,在绿化管理过程中,为了维持具有景观美学特征的外来物种生存和繁殖,人为建造出了适合这些物种的局部生境,例如在草坪上灌溉、施肥、修剪、病虫害防治等。这些人为干扰使本来在自然生境中的物种演替和竞争机制被扰乱,乡土物种在其中往往处于不利地位[15-16]。生境改变、生物交互作用和景观格局异质性等城市特征都会影响生物在种类、功能和系统发育上的多样性[17-19]。人类为满足自身利益和发展需求而采取的城市资源配置方式对其植物多样性形成了诸多威胁。为此,全面掌握城市的植物多样性现状,才能更好地应对城市化对植物多样性产生的负面效应。本研究通过对海口、文昌和三亚3座城市植物样方的数据分析,旨在了解热带岛屿城市的植物多样性水平现状,以便为今后城市植物多样性的保护和植物多样性水平提升提供研究基础。
1. 研究区概况
本研究以海南省的海口市(110°07′ ~ 110°42′ E,19°31′ ~ 20°04′ N)、文昌市(108°21′ ~ 111°03′ E,19°20′ ~ 20°10′ N)和三亚市(108°56′30″ ~ 109°48′30″ E,18°09′36″ ~ 18°37′30″ N)3座城市为研究对象,它们地理纬度接近,且由于琼州海峡的阻隔,长期处在相对独立的环境下,形成较为相似的人文社会背景(图1)。研究中将每座城市视为一个整体样地,并在其中布设样方,分别调查之后对3座城市进行对比分析。
2. 研究方法
2.1 样方调查
为了保证城市边界选取的统一性,本研究根据海口市城市总体规划(2011—2020年)、文昌市城市总体规划(2004—2020年)和三亚市城市总体规划(2008—2020年)确定了以3座城市的规划区作为研究范围,利用ArcGIS10.0在各城市规划区的卫星影像上分别随机设置样方(图2)。城市中随机设置的样方(400 m2)数量在达到200个时,对植被的总体数量特征估计的相对标准差约为12%,因此,大于200个的样方数量对一个城市森林的实地调查是比较充分的[20]。考虑到实际情况中可能存在少量样方的落点位置无法进入,因此各城市的规划区中均设置了235个样方以保证至少获得200个有效的样方数据。在实地调查中,通过卫星影像和GPS定位样方中心,据此中心设立半径为12 m的圆形样方。对样方内的植被情况进行记录,包括:植物的种名,胸径 ≥ 3 cm的乔木的胸径、株数、株高、冠幅、健康状况等,灌木和草本的面积、高度;是否为乡土物种则根据《海南植物名录》[21]确认。
![]() 图 2 3座城市的规划区及样方分布图Figure 2. Maps of urban planning areas and locations of sampling plots
图 2 3座城市的规划区及样方分布图Figure 2. Maps of urban planning areas and locations of sampling plots2.2 数据分析
为量化城市之间物种组成的差异性,选用4个β相异性指数来反映各城市之间的物种差异程度。分别是基于有/无数据和基于多度数据的Jaccard指数、Bray-Curtis指数。分别采用所有种类、乡土种、外来种、乔木、灌木、草本6个类别对城市之间的物种组成进行比较。具体计算过程通过R语言vegan软件包中的vegdist函数完成。
为对比各城市的α多样性水平,本研究从物种多样性、功能多样性和谱系多样性3个层次进行多样性指数计算,并对各个指数进行单因素方差分析和Duncan多重比较。α多样性指数选择如下:
(1)物种多样性测度。研究中选取Shannon-Wiener指数和Simpson指数2种广泛使用的α多样性指数。物种多样性指数计算通过R语言vegan软件包中的diversity函数完成。
(2)功能多样性测度。研究选取功能均匀度指数(Functional evenness,FEve)和功能离散度指数(Functional dispersion,FDis)来度量研究区域内的群落功能多样性。功能多样性是通过选取与研究区内群落生态功能存在关联性的功能性状参数,结合指数公式计算得出的。植物的功能性状是指能够影响生态系统功能的一系列属性,它们反映了植被对环境变化的响应。考虑到功能指标参数获取的便利性和城市环境的特殊性,本研究选择了13种与城市环境相关的功能指标,指标选取主要参考了Williams[22]和Knapp[23]的城市植物功能性状研究,包括生活型、植物来源、花期、株高、种子扩散方式、传粉途径、叶质、种子体积、种子数量、茎干是否有刺、是否无性繁殖、是否常绿、植株是否有毒。
功能指标参数通过生命百科的TraitBank数据库(http://eol.org/traitbank)、德国马普生物地理化学所的TRY数据库(http://www.try-db.org)和美国农业部的Plants数据库(http://plants.sc.egov.usda.gov)获取。数据库中缺失的数据通过查找《中国植物志》[24]《海南植物志》[21]等相关植物志中对物种的描述信息进行补充。指数计算通过R语言FD软件包中的dbFD函数完成。
(3)谱系多样性测度。把调查数据中所涵盖的各类物种和与之相对应的科属信息按照APG Ⅲ(被子植物分类系统Ⅲ)输入到在线植物系统发育库Phylomatic v3中[25],导出对应的系统发育树文件。
研究中选取谱系多样性指数(Phylogenetic diversity, PD)和谱系均匀度指数(Phylogenetic species evenness, PSE)来度量研究区域内的群落谱系多样性。PD指数反映的是数据集中所有物种在系统发育进化树上的枝长之和[26],PD值越大表示所包含物种的系统发育信息越丰富。PSE指数是在考虑相对物种丰度信息的情况下,群落中所有物种共有的一个随机性状与谱系亲缘关系相关程度的量化[27]。PSE的值为1时,各个物种多度相等而且各个物种的谱系关系显著不相关(P < 0.05)。当PSE的值越接近0,说明物种多度差异性越来越大,或者系统发育关系的相关性越来越高。
3. 结果与分析
3.1 植物多样性概况
海口市样方调查中共统计到227种植物,归属于71科184属;三亚市样方调查中共统计到244种植物,归属于76科204属;文昌市样方调查中共统计到230种植物(表1),归属于72科181属。木本植物种数远高于草本植物。3座城市中禾本科、豆科和大戟科的植物种数均为前三。禾本科植物在海口、三亚、文昌的种数分别为22种、32种和32种;大戟科植物在海口、三亚、文昌的种数分别为18种、16种和13种;豆科植物在海口、三亚和文昌的种数分别为17种、22种和16种。3座城市样方调查结果中植物种类的数量接近,外来种的数量从高到低依次为海口、三亚和文昌。
表 1 城市规划区样方调查植物种类组成统计Table 1. Statistics of floristic composition in the urban planning area of the three cities类型 Type 海口 Haikou 三亚 Sanya 文昌 Wenchang 种数
Species number比例
Proportion/%种数
Species number比例
Proportion/%种数
Species number比例
Proportion/%乔木层 Tree layer 69 30.40 81 33.20 69 30.00 灌木层 Shrub layer 75 33.04 78 31.97 69 30.00 草本层 Grass layer 83 36.56 85 34.83 92 40.00 乡土种 Native species 111 48.90 134 54.92 140 60.87 外来种 Exotic species 116 51.10 110 45.08 90 39.13 总物种数 Total species number 227 244 230 3.2 物种组成差异性
Jaccard指数和Bray-Curtis指数反映出的结果是一致的,3座城市之间物种组成的总体差异较为接近,Jaccard相异性指数都在0.6 ~ 0.7之间,Bray-Curtis相异性指数都在0.4 ~ 0.5之间(表2)。各个城市间的乡土物种的差异性均高于外来种,各城市间乔木层的组成差异性比灌木层和草本层低。
表 2 各城市间的β相异性指数Table 2. β dissimilarity indices between any two cities城市
City组别
GroupJaccard相异性指数
Jaccard dissimilarity indexBray-Curtis相异性指数
Bray-Curtis dissimilarity index有/无数据
Presence/absence data多度数据
Abundant data有/无数据
Presence/absence data多度数据
Abundant data乔木层 Tree layer 0.484 0.647 0.319 0.478 灌木层 Shrub layer 0.703 0.811 0.542 0.683 海口&文昌
Haikou & Wenchang草本层 Grass layer 0.704 0.797 0.543 0.565 乡土种 Native species 0.694 0.532 外来种 Exotic species 0.576 0.405 总体 Total 0.644 0.475 乔木层 Tree layer 0.515 0.773 0.347 0.631 灌木层 Shrub layer 0.583 0.795 0.412 0.660 海口&三亚
Haikou & Sanya草本层 Grass layer 0.698 0.749 0.536 0.599 乡土种 Native species 0.659 0.492 外来种 Exotic species 0.552 0.381 总体 Total 0.607 0.435 乔木层 Tree layer 0.585 0.799 0.413 0.666 灌木层 Shrub layer 0.699 0.914 0.537 0.842 文昌&三亚
Wenchang & Sanya草本层 Grass layer 0.689 0.717 0.525 0.558 乡土种 Native species 0.692 0.529 外来种 Exotic species 0.616 0.446 总体 Total 0.661 0.494 注:有/无数据,仅采集判断样地中是否存在这一物种,对物种的多度、出现频率等信息不予考虑。Notes: presence /absence data, only the presence of species in the sample plot was collected, and information such as the abundance and frequency of occurrence of the species was not considered. 3.3 植物多样性比较
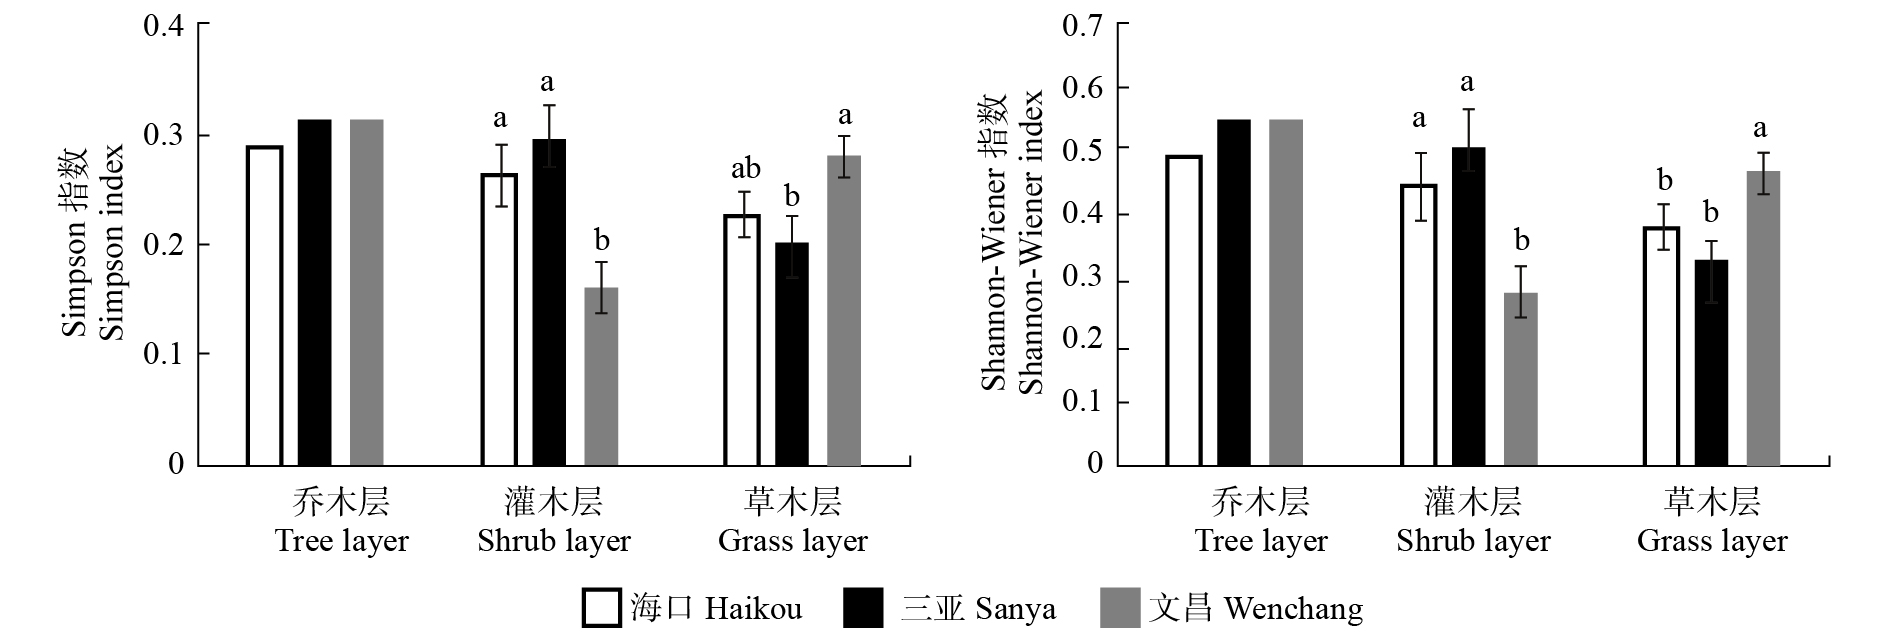
物种多样性指数的比较结果显示,3座城市乔木层的物种多样性指数均无显著差异(分别为P = 0.720,P = 0.491)(图3)。文昌的灌木层物种多样性指数显著低于海口和三亚2个城市(P < 0.05)。三亚和文昌的草本层均呈现显著差异(P < 0.05),且文昌的多样性指数值较高。在物种多样性指数方面,3座城市的差异体现在灌木层和草本层,尤其是在文昌和海口、文昌和三亚之间。
![]() 图 3 3座城市不同生活型的物种多样性指数不同小写字母代表差异显著。下同。Different lowercase letters indicate significant difference. The same below.Figure 3. Species diversity indices in different life types in the three cities
图 3 3座城市不同生活型的物种多样性指数不同小写字母代表差异显著。下同。Different lowercase letters indicate significant difference. The same below.Figure 3. Species diversity indices in different life types in the three cities功能多样性指数结果显示(图4),3座城市灌木层的功能均匀度指数(FEve)和功能离散度指数(FDis)呈现了显著差异,该差异同样也出现在文昌和海口、文昌和三亚之间(分别为P < 0.01和P < 0.001),文昌灌木层的功能多样性指数值低于海口和三亚,这与灌木层的物种多样性结果是一致的。
![]() 图 4 3座城市不同生活型的功能多样性指数Figure 4. Functional diversity indices in different life types in the three cities
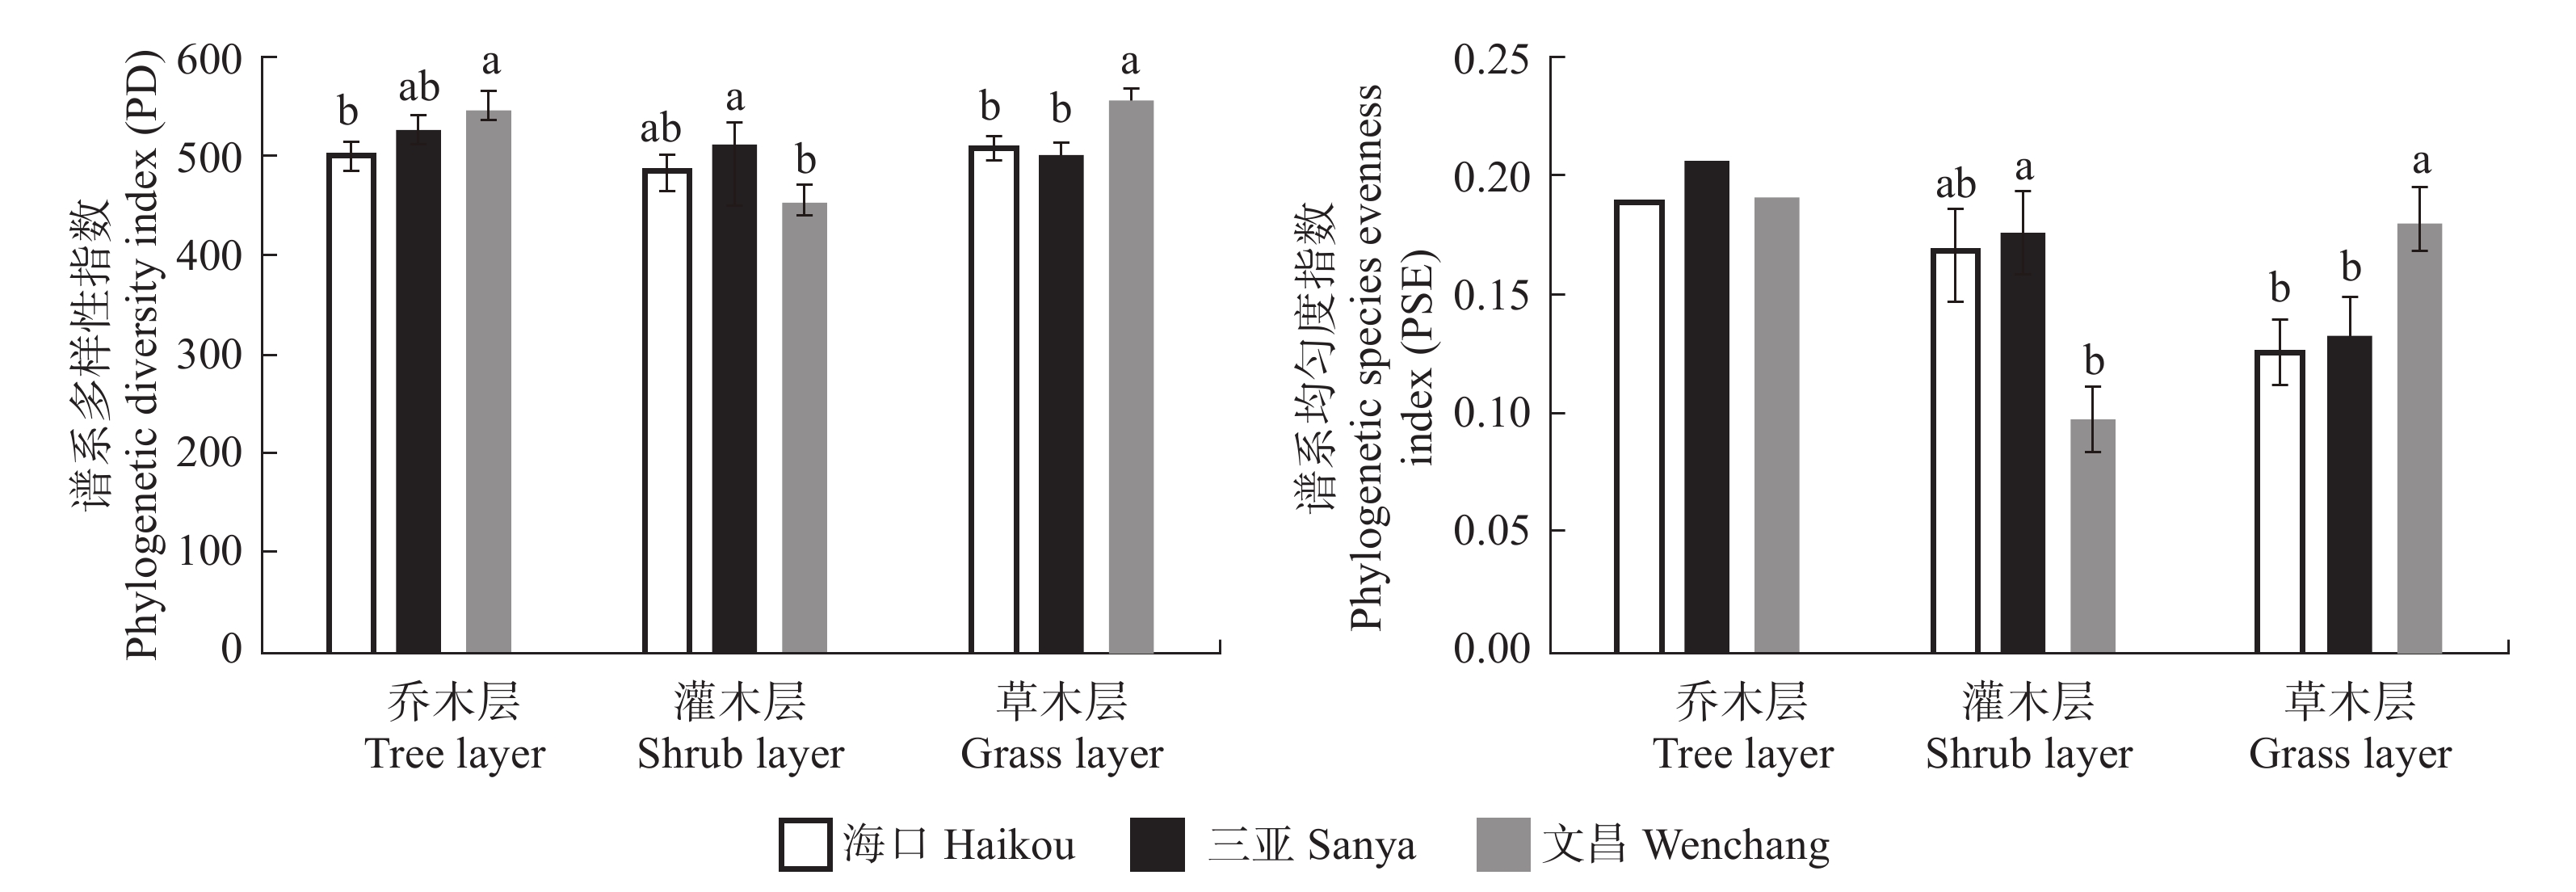
图 4 3座城市不同生活型的功能多样性指数Figure 4. Functional diversity indices in different life types in the three cities3座城市的谱系多样性(PD)指数在各个生活型中呈现了不同差异,文昌乔木层的PD指数值显著高于海口,三亚灌木层的PD指数值显著高于文昌,文昌草本层的PD指数值显著高于海口和三亚(P < 0.01)(图5)。灌木层和草本层的谱系均匀度(PSE)指数结果与PD指数一致(分别为P < 0.001和P < 0.01),但在乔木层没有呈现显著差异(P = 0.690)。
![]() 图 5 3座城市不同生活型的谱系多样性Figure 5. Phylogenetic diversity indices in different life types in the three cities
图 5 3座城市不同生活型的谱系多样性Figure 5. Phylogenetic diversity indices in different life types in the three cities4. 讨论与结论
城市物种的同质性已经成为全球面临的问题[18]。对中国城市树种的研究发现,树种组成的相似性大致呈现了纬度梯度的特性[28],其表现为:邻近城市往往会有较为相似的物种组成,对美国东南部8个城市中城市森林组成的研究结果也印证了这一观点[29]。但海口、三亚和文昌3座城市相互之间的相异性指数显示,物种组成差异较为明显。这表明除了纬度和地理位置因素之外,仍然存在诸如经济水平、人文偏好等方面的因素对城市植物物种的组成产生影响。有研究表明,植物多样性水平与社会经济活动呈显著的正相关性[30]。富裕的区域中通常具有更高的物种丰富度,且其中大部分为外来物种[31]。本研究中3座城市的GDP高低呈现为:海口(904.64亿元) > 三亚(373.21亿元) > 文昌(175.34亿元)[32],3座城市的外来物种数量和占比呈现了与GDP一致的趋势,表明社会经济水平对外来物种的引入趋势具有城市尺度上的普遍性。
本研究结果显示3座城市的乡土物种组成差异性比外来物种更为明显。植物配置是基于景观美学需要且可以从苗圃中获取的物种[33-34],因此周围苗圃的物种资源限制是导致城市外来物种差异性低的重要原因[35]。
尽管外来物种在引入初期可能会提升城市的植物丰富度,但是外来物种的大量使用和逐步归化会加剧城市森林中群落水平上的同质化现象[36]。在城市森林建设中选用外来物种主要是因为使用的成本效益等同于甚至优于乡土物种[37]。其次,城市建设常常使乡土物种处于生存劣势[38],而外来物种往往对城市生境都有较高的适应能力[16]。然而也有观点指出,乡土物种同样有助于提高城市森林的物种丰富度[39],而且可以有效缓解城市植物群落同质化现象。为此,营造更为丰富的地质环境对乡土植物的物种丰富度和整个植物区系物种丰富度的提升显得至关重要[39]。
本研究中基于多度数据计算的相异性指数值均高于有/无数据计算的结果,表明多度信息会加剧物种组成格局上的差异。多度信息的纳入可以为城市植物群落之间的组成差异提供更好的解释,同时可以提供已知生物多样性格局的生物关联性[29]。而在有无数据中,由于多度水平较高的物种和稀有种是被同等看待的,评估结果与实际情况可能会产生偏差[40]。在城市植物区系中采样,由于城市存在非常高的景观异质性,样本数据不足是一个普遍的问题[41],基于多度数据的β多样性指数可以校正样本数据不足产生的误差[40,42]。
物种多样性、功能多样性和谱系多样性指数反映出这3座城市乔木层均具有较高的多样性水平,且无显著差异;此外,城市间乔木层的组成差异性较低,说明这3座城市的乔木群落稳定度相似,在构建城市绿地景观时,采用相似的乔木进行景观配置。在灌木层上,文昌在这3类指标上显著低于海口和三亚。这是因为在城市森林建设初期,从经济效益角度出发,更加倾向于使用能够快速形成基础景观风貌、引人注意的物种,如高大乔木。文昌作为3座城市中发展相对滞后的城市,灌木使用量相对较少可能是导致3类指标低于海口和三亚的原因之一。功能多样性和物种多样性具有相关性[43],不同城市的相似环境状况,会促进有特定功能属性的物种发展[22,44]。3座城市乔、灌层物种多样性和功能多样性的一致性结果也支持了这一结论。此外,草本层物种多样性的差异与谱系多样性的差异结果也基本一致。说明在城市环境中物种多样性仍然保持着与功能多样性、谱系多样性的关联性。城市的人为干扰改变了这种关联性程度,但并未完全消除[45]。制定植物多样性保护规划策略时,有倾向性地提高功能多样性和谱系多样性可以促进城市中群落自我演替向更稳定的方向发展,从而保障群落生产力的有效发挥,同时也可以为更多不同营养级物种的共存提供可能性[46-48]。本研究为岛屿城市区系植物研究提供了数据基础,未来的研究中可以通过相同的监测分析方法长期研究城市中植物多样性在各个层面上的变化,以期更准确深入地理解城市发展对植物多样性产生的影响。
-
![]()
图 2 3座城市的规划区及样方分布图
Figure 2. Maps of urban planning areas and locations of sampling plots
![]()
图 3 3座城市不同生活型的物种多样性指数
不同小写字母代表差异显著。下同。Different lowercase letters indicate significant difference. The same below.
Figure 3. Species diversity indices in different life types in the three cities
![]()
图 4 3座城市不同生活型的功能多样性指数
Figure 4. Functional diversity indices in different life types in the three cities
![]()
图 5 3座城市不同生活型的谱系多样性
Figure 5. Phylogenetic diversity indices in different life types in the three cities
表 1 城市规划区样方调查植物种类组成统计
Table 1 Statistics of floristic composition in the urban planning area of the three cities
类型 Type 海口 Haikou 三亚 Sanya 文昌 Wenchang 种数
Species number比例
Proportion/%种数
Species number比例
Proportion/%种数
Species number比例
Proportion/%乔木层 Tree layer 69 30.40 81 33.20 69 30.00 灌木层 Shrub layer 75 33.04 78 31.97 69 30.00 草本层 Grass layer 83 36.56 85 34.83 92 40.00 乡土种 Native species 111 48.90 134 54.92 140 60.87 外来种 Exotic species 116 51.10 110 45.08 90 39.13 总物种数 Total species number 227 244 230  下载: 导出CSV
表 2 各城市间的β相异性指数
Table 2 β dissimilarity indices between any two cities
城市
City组别
GroupJaccard相异性指数
Jaccard dissimilarity indexBray-Curtis相异性指数
Bray-Curtis dissimilarity index有/无数据
Presence/absence data多度数据
Abundant data有/无数据
Presence/absence data多度数据
Abundant data乔木层 Tree layer 0.484 0.647 0.319 0.478 灌木层 Shrub layer 0.703 0.811 0.542 0.683 海口&文昌
Haikou & Wenchang草本层 Grass layer 0.704 0.797 0.543 0.565 乡土种 Native species 0.694 0.532 外来种 Exotic species 0.576 0.405 总体 Total 0.644 0.475 乔木层 Tree layer 0.515 0.773 0.347 0.631 灌木层 Shrub layer 0.583 0.795 0.412 0.660 海口&三亚
Haikou & Sanya草本层 Grass layer 0.698 0.749 0.536 0.599 乡土种 Native species 0.659 0.492 外来种 Exotic species 0.552 0.381 总体 Total 0.607 0.435 乔木层 Tree layer 0.585 0.799 0.413 0.666 灌木层 Shrub layer 0.699 0.914 0.537 0.842 文昌&三亚
Wenchang & Sanya草本层 Grass layer 0.689 0.717 0.525 0.558 乡土种 Native species 0.692 0.529 外来种 Exotic species 0.616 0.446 总体 Total 0.661 0.494 注:有/无数据,仅采集判断样地中是否存在这一物种,对物种的多度、出现频率等信息不予考虑。Notes: presence /absence data, only the presence of species in the sample plot was collected, and information such as the abundance and frequency of occurrence of the species was not considered.
下载: 导出CSV
-
[1] Singh A, Abhilash P C. Agricultural biodiversity for sustainable food production[J]. Journal of Cleaner Production, 2018, 172: 1368−1369. doi: 10.1016/j.jclepro.2017.10.279
[2] Heywood V H. Ethnopharmacology, food production, nutrition and biodiversity conservation: towards a sustainable future for indigenous peoples[J]. Journal of Ethnopharmacology, 2011, 137(1): 1−15. doi: 10.1016/j.jep.2011.05.027
[3] Farinha-Marques P, Lameiras J M, Fernandes C, et al. Urban biodiversity: a review of current concepts and contributions to multidisciplinary approaches[J]. Innovation: The European Journal of Social Science Research, 2011, 24(3): 247−271. doi: 10.1080/13511610.2011.592062
[4] Witte J P M, Meuleman J A M, Van der Schaaf S, et al. Eco-hydrology and biodiversity[J]. Unsaturated Zone Modelling: Progress, Challenges and Applications, 2004(6): 301−329.
[5] Marinidou E. Estimation of tree cover contribution to climate regulation and biodiversity conservation: a methodology design and application in Chiapas, México[M]. Turrialba: CATIE, 2009.
[6] Dobson A P. Soil conservation and biodiversity[M]. New York: W.H. Freeman and Co, 1996.
[7] 马克平, 钱迎倩. 生物多样性保护及其研究进展[J]. 应用与环境生物学报, 1998, 4(1):96−100. Ma K P, Qian Y Q. Biodiversity conservation and its research progress[J]. Chinese Journal of Applied and Environmental Biology, 1998, 4(1): 96−100.
[8] Malla U M. Biodiversity: living wealth of Nepal[J]. Nepal Geographical Society, 2011, 32: 1−24.
[9] Schmidt O, Bolger T, Creamer R, et al. The living soil: biodiversity and functions[J/OL]. The Soils of Ireland, 2018: 257−265[2018−12−30]. https://doi.org/10.1007/978-3-319-71189-8_18.
[10] 雷一东, 唐先华. 城市植物多样性应用及其实现途径[J]. 城市问题, 2007(3):32−35. doi: 10.3969/j.issn.1002-2031.2007.03.007 Lei Y D, Tang X H. Application of urban plant diversity and its realization[J]. Urban Problems, 2007(3): 32−35. doi: 10.3969/j.issn.1002-2031.2007.03.007
[11] Riley C B, Herms D A, Gardiner M M. Exotic trees contribute to urban forest diversity and ecosystem services in inner-city Cleveland, OH[J]. Urban Forestry & Urban Greening, 2018, 29: 367−376.
[12] Knapp S, Kühn I, Stolle J, et al. Changes in the functional composition of a Central European urban flora over three centuries[J]. Perspectives in Plant Ecology Evolution and Systematics, 2010, 12(3): 235−244. doi: 10.1016/j.ppees.2009.11.001
[13] Sukopp H. Human-caused impact on preserved vegetation[J]. Landscape & Urban Planning, 2004, 68(4): 347−355.
[14] Gilbert O L. The ecology of urban habitats[M]. New York: Chapman & Hall, 1989.
[15] Decandido R, Muir A A, Gargiullo M B. A first approximation of the historical and extant vascular flora of New York City: implications for native plant species conservation[J]. Journal of the Torrey Botanical Society, 2004, 131(3): 243−251. doi: 10.2307/4126954
[16] Mckinney M L. Urbanization as a major cause of biotic homogenization[J]. Biological Conservation, 2006, 127(3): 247−260. doi: 10.1016/j.biocon.2005.09.005
[17] Alberti M. Eco-evolutionary dynamics in an urbanizing planet[J]. Trends in Ecology & Evolution, 2015, 30(2): 114−126.
[18] 毛齐正, 马克明, 邬建国, 等. 城市生物多样性分布格局研究进展[J]. 生态学报, 2013, 33(4):1051−1064. Mao Q Z, Ma K M, Wu J G, et al. An overview of advances in distribution pattern of urban biodiversity[J]. Acta Ecologica Sinica, 2013, 33(4): 1051−1064.
[19] 王光美, 杨景成, 姜闯道, 等. 生物同质化研究透视[J]. 生物多样性, 2009, 17(2):117−126. Wang G M, Yang J C, Jiang C D, et al. A literature review on biotic homogenization[J]. Biodiversity Science, 2009, 17(2): 117−126.
[20] Nowak D J, Walton J T, Stevens J C, et al. Effect of plot and sample size on timing and precision of urban forest assessments[J]. Arboriculture and Urban Forestry, 2008, 34(6): 386−390.
[21] 杨小波, 海南植物名录[M]. 北京: 科学出版社. 2013. Yang X B. Hainan plant list[M]. Beijing: Science Press, 2013.
[22] Williams N S G, Hahs A K, Vesk P A. Urbanisation, plant traits and the composition of urban floras[J]. Perspectives in Plant Ecology, Evolution and Systematics, 2015, 17(1): 78−86. doi: 10.1016/j.ppees.2014.10.002
[23] Knapp S, Kühn, Bakker J P, et al. How species traits and affinity to urban land use control large-scale species frequency[J]. Diversity & Distributions, 2009, 15(3): 533−546.
[24] 中国科学院中国植物志编辑委员会. 中国植物志[M]. 北京: 科学出版社, 1993. China Botanical Editorial Committee of Chinese Academy of Sciences. Flora reipublicae popularis sinicae[M]. Beijing: Science Press, 1993.
[25] Webb C O, Donoghue M J. Phylomatic: tree assembly for applied phylogenetics[J]. Molecular Ecology Notes, 2005, 5(1): 181−183. doi: 10.1111/men.2005.5.issue-1
[26] Faith D P. Conservation evaluation and phylogenetic diversity[J]. Biological Conservation, 1992, 61(1): 1−10. doi: 10.1016/0006-3207(92)91201-3
[27] Helmus M R, Bland T J, Williams C K, et al. Phylogenetic measures of biodiversity[J]. The American Naturalist, 2007, 169(3): E68−E83. doi: 10.1086/511334
[28] Yan P, Yang J. Species diversity of urban forests in China[J]. Urban Forestry & Urban Greening, 2017, 28: 160−165.
[29] Yang J, La Sorte F A, Pysek P, et al. The compositional similarity of urban forests among the world’s cities is scale dependent[J]. Global Ecology and Biogeography, 2015, 24(12): 1413−1423. doi: 10.1111/geb.2015.24.issue-12
[30] Hope D, Gries C, Zhu W, et al. Socioeconomics drive urban plant diversity[J]. Proceedings of the National Academy of Sciences, 2003, 100(15): 8788−8792. doi: 10.1073/pnas.1537557100
[31] Lubbe C S, Siebert S J, Cilliers S S. Political legacy of South Africa affects the plant diversity patterns of urban domestic gardens along a socio-economic gradient[J]. Scientific Research and Essays, 2010, 5(19): 2900−2910.
[32] 中国知网. 中国经济社会发展统计数据库[DB/OL]. 2014[2018−10−01]. http://tongji.cnki.net/kns55/Publish/Area/xj21.html. China National Knowledge Infrastructure. China economic and social development statistics database[DB/OL]. 2014[2018−10−01]. http://tongji.cnki.net/kns55/Publish/Area/xj21.html.
[33] Walker J S, Grimm N B, Briggs J M, et al. Effects of urbanization on plant species diversity in central Arizona[J]. Frontiers in Ecology and the Environment, 2009, 7(9): 465−470. doi: 10.1890/080084
[34] Ignatieva M. Plant material for urban landscapes in the era of globalization: roots, challenges and innovative solutions[J]. Applied Urban Ecology: A Global Framework. Wiley-Blackwell, 2011: 139−151.
[35] Smith R M, Thompson K, Hodgson J G, et al. Urban domestic gardens (IX): composition and richness of the vascular plant flora, and implications for native biodiversity[J]. Biological Conservation, 2006, 129(3): 312−322. doi: 10.1016/j.biocon.2005.10.045
[36] Lososová Z, Chytry M, Lubomír T, et al. Biotic homogenization of Central European urban floras depends on residence time of alien species and habitat types[J]. Biological Conservation, 2012, 145(1): 179−184. doi: 10.1016/j.biocon.2011.11.003
[37] Dearborn D C, Kark S. Motivations for conserving urban biodiversity[J]. Conservation Biology the Journal of the Society for Conservation Biology, 2010, 24(2): 432−440. doi: 10.1111/cbi.2010.24.issue-2
[38] Byers J E. Impact of non-indigenous species on natives enhanced by anthropogenic alteration of selection regimes[J]. Oikos, 2002, 97(3): 449−458. doi: 10.1034/j.1600-0706.2002.970316.x
[39] Kühn I, Brandl R, Klotz S. The flora of German cities is naturally species rich[J]. Evolutionary Ecology Research, 2004, 6(5): 749−764.
[40] Chao A, Chazdon R L, Shen C T J. Abundance-based similarity indices and their estimation when there are unseen species in samples[J]. Biometrics, 2006, 62(2): 361−371. doi: 10.1111/j.1541-0420.2005.00489.x
[41] Zhao J, Ouyang Z, Xu W, et al. Sampling adequacy estimation for plant species composition by accumulation curves: a case study of urban vegetation in Beijing, China[J]. Landscape and Urban Planning, 2010, 95(3): 113−121. doi: 10.1016/j.landurbplan.2009.12.008
[42] Legendre P, De Cáceres M. Beta diversity as the variance of community data: dissimilarity coefficients and partitioning[J]. Ecology Letters, 2013, 16(8): 951−963. doi: 10.1111/ele.2013.16.issue-8
[43] Mouchet M A, Sébastien V, Mason N W H, et al. Functional diversity measures: an overview of their redundancy and their ability to discriminate community assembly rules[J]. Functional Ecology, 2010, 24(4): 867−876. doi: 10.1111/fec.2010.24.issue-4
[44] Duncan R P, Clemants S E, Corlett R T, et al. Plant traits and extinction in urban areas: a meta-analysis of 11 cities[J]. Global Ecology and Biogeography, 2011, 20(4): 509−519. doi: 10.1111/j.1466-8238.2010.00633.x
[45] 慈秀芹, 李捷. 系统发育多样性在植物区系研究与生物多样性保护中的应用[J]. 生物多样性, 2017, 25(2):175−181. Ci X Q, Li J. Phylogenetic diversity and its application in floristics and biodiversity conservation[J]. Biodiversity Science, 2017, 25(2): 175−181.
[46] Cadotte M W, Dinnage R, Tilman D. Phylogenetic diversity promotes ecosystem stability[J]. Ecology, 2012, 93(Suppl.8): S223−S233.
[47] Cadotte M W. Experimental evidence that evolutionarily diverse assemblages result in higher productivity[J]. Proceedings of the National Academy of Sciences, 2013, 110(22): 8996−9000. doi: 10.1073/pnas.1301685110
[48] 周晓果, 卢文科, 叶铎, 等. 基于系统发育和功能性状的森林群落构建机制[J]. 广西科学, 2014(5):525−533. doi: 10.3969/j.issn.1005-9164.2014.05.010 Zhou X G, Lu W K, Ye D, et al. Assembly mechanism of forest community based on phylogeny and functional traits[J]. Guangxi Sciences, 2014(5): 525−533. doi: 10.3969/j.issn.1005-9164.2014.05.010
-
期刊类型引用(8)
1. 张冬梅,罗玉兰,张浪,傅仁杰,有祥亮,尹丽娟. 几种城市绿地植物物种生物多样性调查方法研究——以上海为例. 园林. 2024(04): 4-10+51 .  百度学术
百度学术
2. 胡理乐,马俊丽,赵金满,刘长峰,赵婧文,闫伯前. 北京维管植物组成及其分布特征. 生态学杂志. 2023(12): 2903-2910 . 百度学术
3. 刘浩,崔岳铭,王磊,张丹棵,刘雪花,张钢民. 北京市城镇化地区植物多样性评价. 北京林业大学学报. 2022(08): 48-55 . 本站查看
4. 饶显龙,何田恬,王冰彦,刘华红,李上善,丁洲,黎家宏,李珏. 浙江舟山群岛彩化植物资源调查及其园林应用评价. 北京林业大学学报. 2022(09): 127-136 . 本站查看
5. 李明娟,赵娟娟,刘时彦,宋晨晨,江南. 山地城市公园植物群落功能多样性与物种多样性研究——以重庆市主城区为例. 中国园林. 2021(02): 124-129 . 百度学术
6. 陈强,张玉林,李桂荣,韩蕙琳,张鹏. 菏泽曹州牡丹园植物群落多样性研究. 山东建筑大学学报. 2020(01): 30-35+57 . 百度学术
7. 陈强,张玉林,李桂荣,韩蕙琳,张鹏. 菏泽市曹州牡丹园植物物种多样性研究. 陕西林业科技. 2020(01): 25-29 . 百度学术
8. 李妍,郭晋平. 基于植物多样性和观赏特性的太原市木本植物结构特征研究. 林业与生态科学. 2020(02): 218-226 . 百度学术
其他类型引用(6)


计量
- 文章访问数: 1313
- HTML全文浏览量: 1187
- PDF下载量: 54
- 被引次数: 14
