
Identification of new Populus varieties and screening of core primers based on SSR markers
-
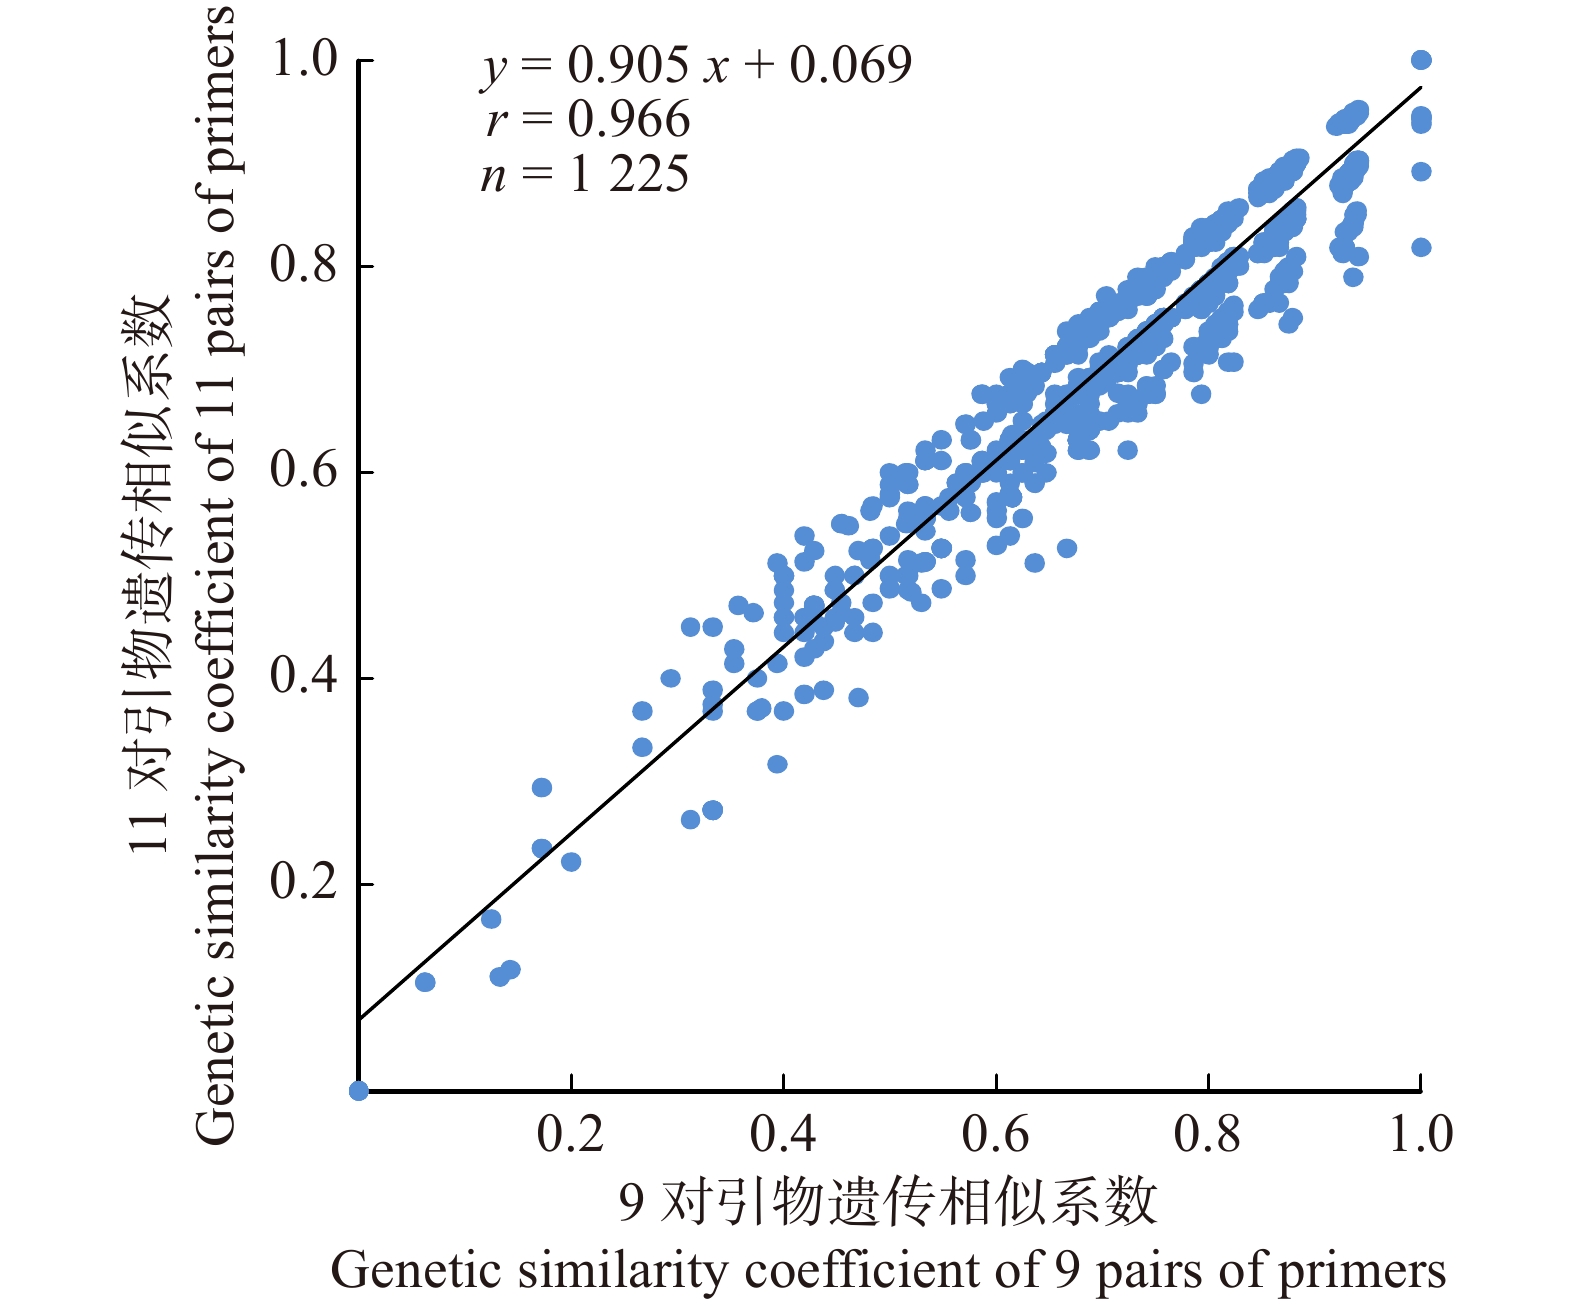
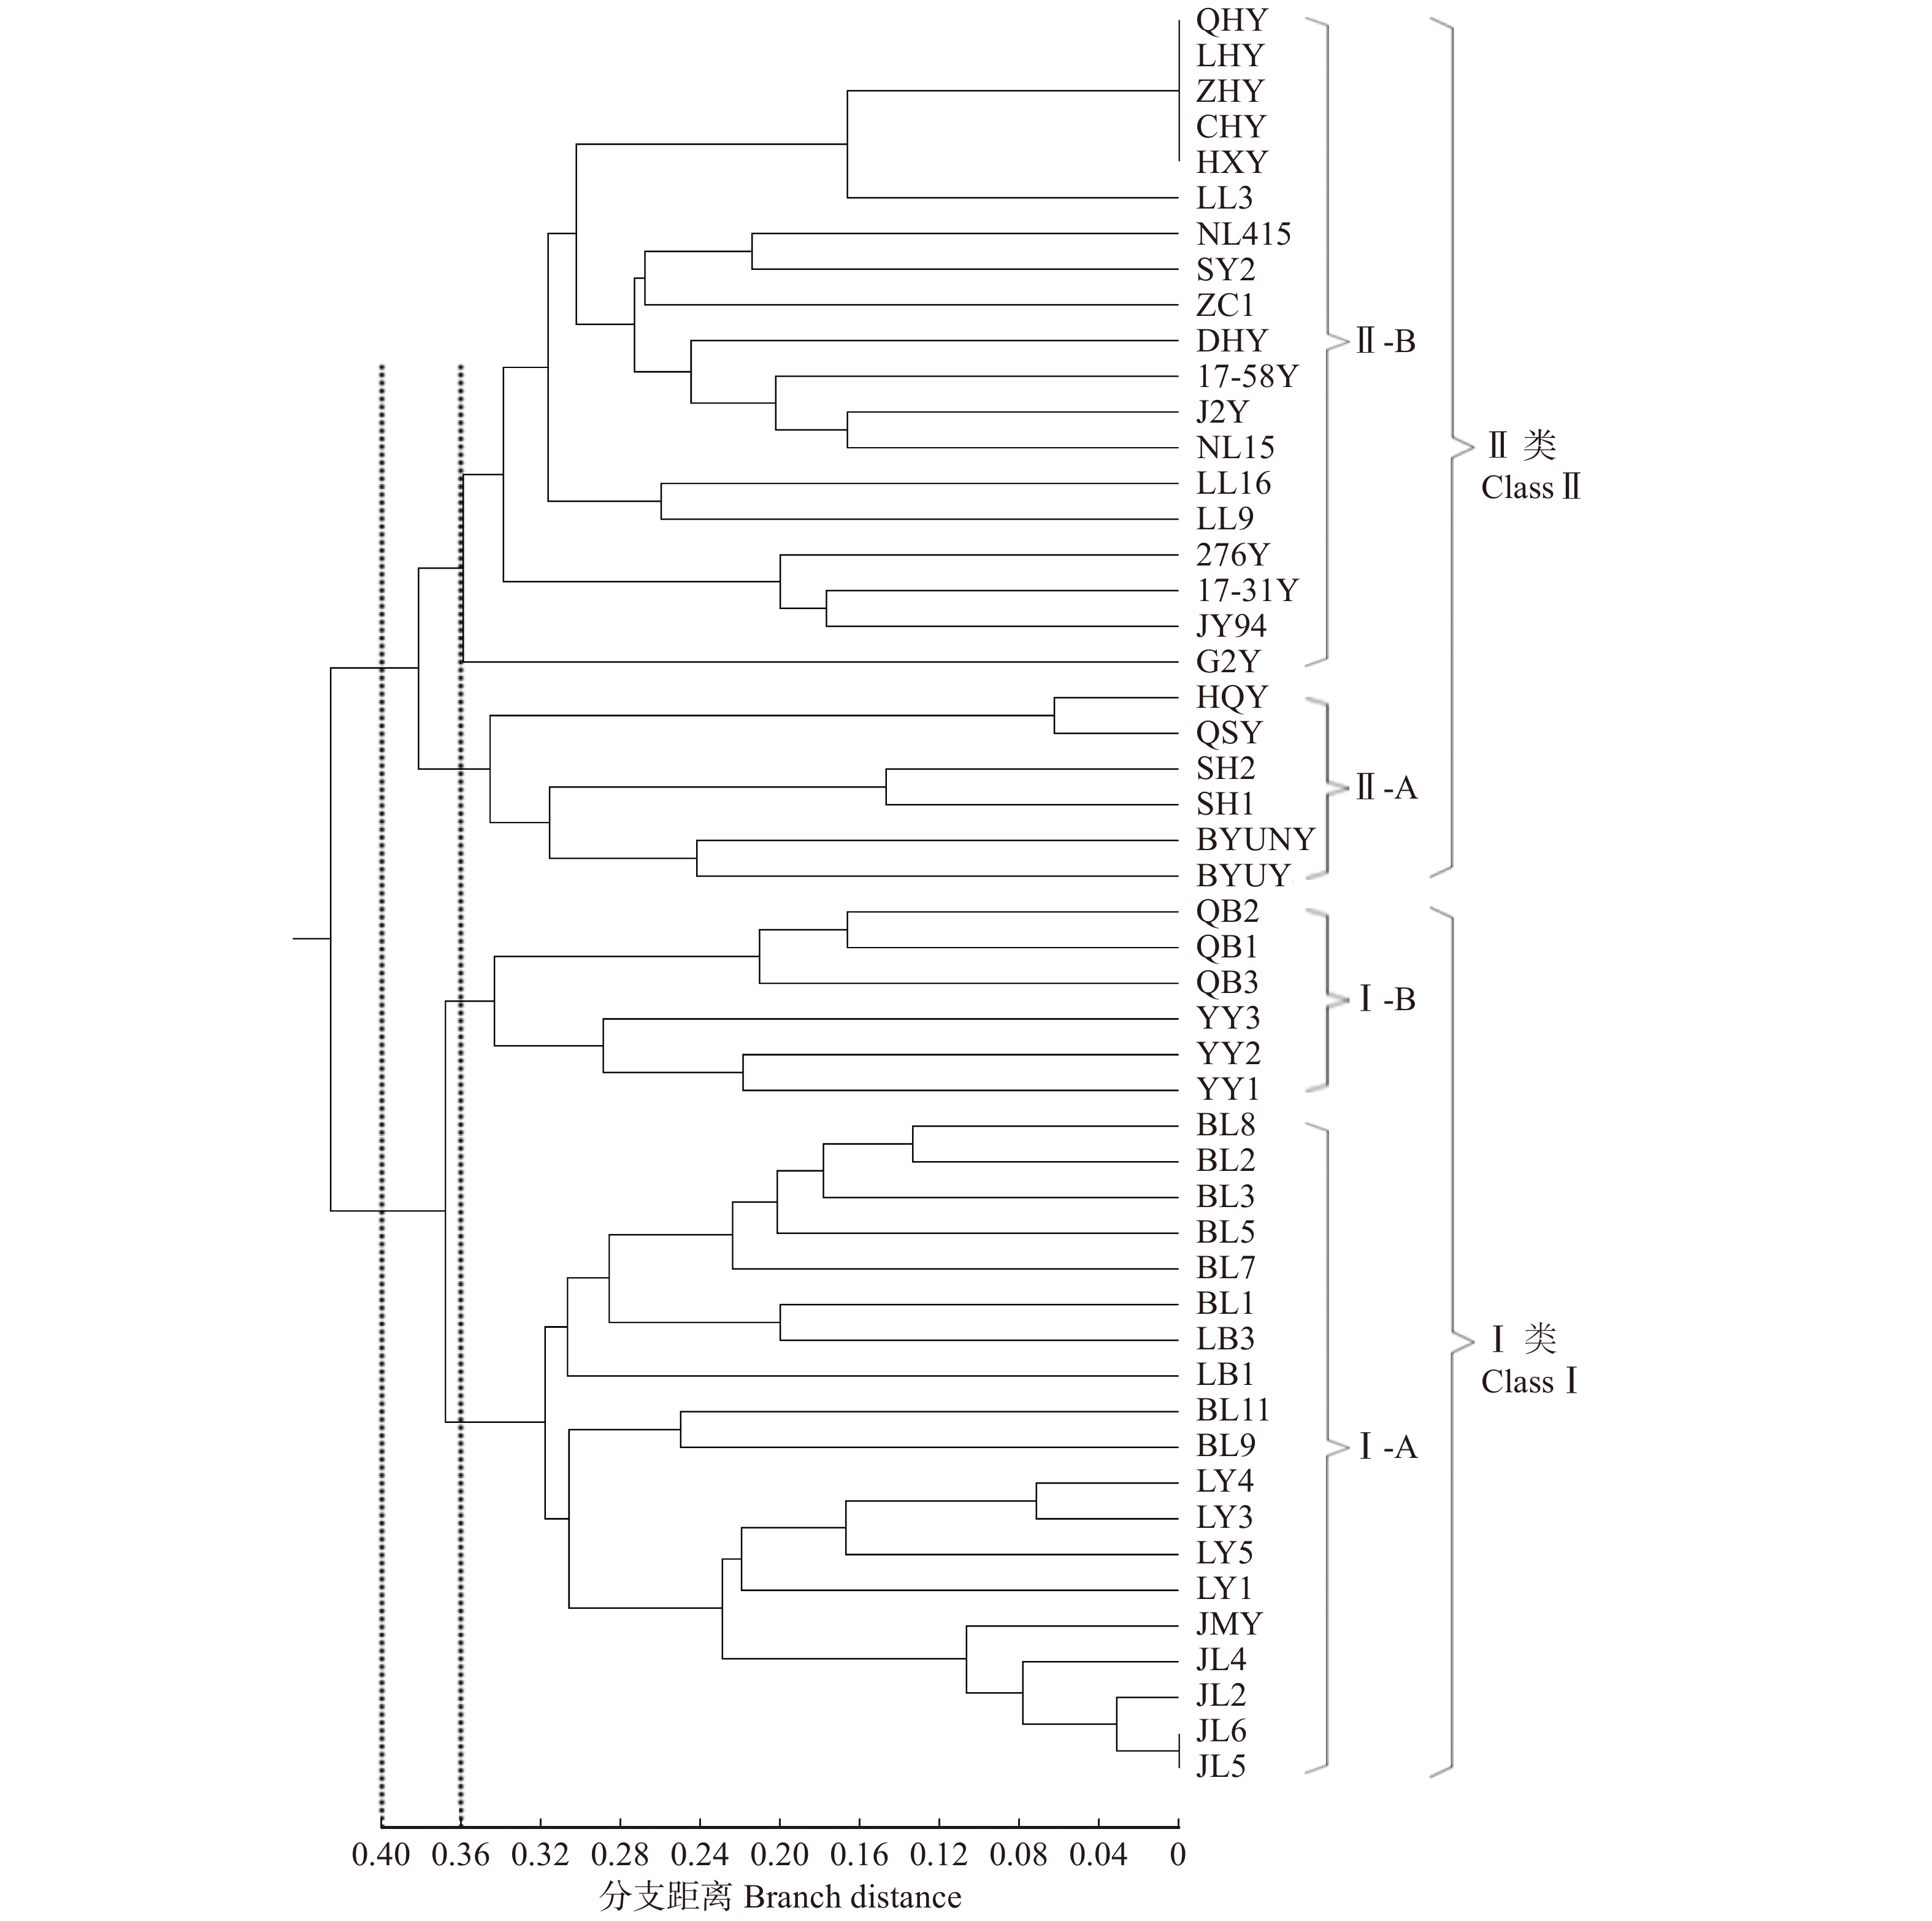
摘要:目的利用经过长期筛选的11对SSR引物对50份杨树新品种(系)进行扩增,探究11对引物的品种鉴定能力和核心引物的筛选依据,为杨树新品种的鉴定、育种工作和核心引物的筛选工作奠定基础。方法使用毛细管电泳技术对扩增结果进行检测,计算等位重复序列数、Shannon信息指数和引物多态性信息指数等。按0/1矩阵记录扩增条带的有无,并通过非加权组平均法(UPGMA)进行聚类分析。计算单个引物和11对引物组合的遗传相似系数,分析遗传相似系数之间的相关性,剔除相关性较低的引物,再对剩余的引物组合进行聚类分析。结果11对引物共扩增出122个DNA片段,平均每对引物扩增的等位重复序列数为11.091个;不同引物PIC值的变化范围是0.530 ~ 0.908,平均值为0.803。11对引物的聚类结果显示,当支距为0.40时,参试样品可以分为2个大类;当支距为0.37时,可分为4个亚类,聚类结果与品种(系)的谱系来源基本吻合。在11对现有引物的基础上,通过分析单个引物和11对引物的遗传相似系数之间的相关性,优化得到9对核心引物。相关性分析和聚类分析表明,优化后的9对引物具有高效鉴定能力和亲缘关系聚类效果。结论本研究证实SSR分子标记可以有效鉴定杨树新品种,并较好反映品种之间的亲缘关系;同时,利用遗传相似系数的相关性可优化现有的引物,为杨树的育种及核心引物的筛选工作提供了参考。Abstract:Objective Eleven pairs of SSR primers being screened for a long time were used to amplify 50 new Populus varieties (clone) in order to explore the cultivar identification ability of SSR markers and the screening basis of core primers, which lays a foundation for the identification, breeding and screening of core primers for new Populus varieties.Method Capillary electrophoresis was used to detect the amplified fragments. The number of allelic repeat sequences, Shannon information index, and primer polymorphism information index were calculated based on the electrophoresis. The 0/1 matrix which recorded the absence and the presence of the amplification bands was used for cluster analysis by the unweighted pair-group method with arithmetic means (UPGMA). The genetic similarity coefficients of a single primer and 11 pairs of primer combinations were calculated, and the correlation between the genetic similarity coefficients was analyzed. The primers with low correlation were removed, and then the remaining primers were clustered.Result The results showed that a total of 122 DNA fragments were amplified by 11 pairs of primers, and the average number of allelic repeat sequences amplified by each pair of primers was 11.091. The PIC of different primers varied from 0.530 to 0.908, with an average value of 0.803. The clustering results of 11 pairs of primers showed that when the branch distance was 0.40, the samples could be divided into 2 categories; when the branch distance was 0.37, it could be divided into 4 subcategories and the clustering results were basically consistent with the pedigree sources of the new varieties (clone). On the basis of the existing primers, 9 pairs of core primers were obtained by analyzing the correlation of the genetic similarity coefficients of individual primers and 11 pairs of primers, which has high-efficiency identification ability and clustering effect of genetic relationship.Conclusion This study confirmed that SSR molecular markers could effectively identify new poplar varieties and better reflect the relationship between varieties. Meanwhile, the existing primers could be optimized by the correlation of genetic similarity coefficient, which will provide a reference for poplar breeding and the selection of core primers.
-
Keywords:
- new Populus variety /
- SSR marker /
- core primers
-
森林作为最重要的陆地生态系统,具有消减洪峰、涵养水源等生态服务功能,通常被称为“森林水库”[1]。森林水源涵养的能力主要体现在其枯落物层和土壤层[2],是森林发挥水源涵养功能的主体部分[3]。枯落物是森林生态系统结构中重要的一环[4]。作为降水降落至地表面先于土壤接触到的部分,枯落物具有涵养水源、拦蓄降水与径流、维持土壤湿度等重要作用[5]。林地土壤层的水文效则通过自身蓄水能力和入渗特性所体现,对降水分配、水分循环和土壤流失等过程具有显著作用[6]。研究枯落物和土壤的水文特征,揭示枯落物和土壤与生态环境要素之间的定性与定量关系,对研究森林生态系统的水土保持能力,合理规划和利用水资源方面具有重要意义[7]。
国内外学者对不同区域、不同森林植被类型的枯落物和土壤水文效应进行了大量研究[8-10],不同林分枯落物及土壤水文效应随立地条件、树种配置以及林分结构的变化而产生显著差异。近年来对冀北地区林地水源涵养功能的研究也取得一定成果,但多以完全郁闭的成熟林为研究对象,重点集中在不同林分类型、林分密度的比较研究[11-12],相较于人工成熟林,人工幼龄林处于植被恢复的初期,也是目前人工抚育和经营管理的主要作业阶段,了解人工幼龄林的水源涵养能力,后期通过适宜的抚育方式和经营措施,优化林分结构,促进林木生长,抑制不利因素的发生,可为其发挥水源涵养主导功能提供支持,而目前对植被恢复下的不同人工幼龄林及其与灌木混交配置模式下的水源涵养功能研究甚少。
河北省崇礼区西沟流域植被稀少,大部分为荒山秃岭,且裸岩率较高[13],加上人为不合理开垦、放牧,使得该地区已有植被被破坏,水土流失问题严重,导致该地区植被水源涵养等生态服务功能难以充分发挥,严重制约区域社会和经济发展。为恢复和改善生态环境,西沟流域自2009年以来,先后通过人工营造、自然恢复等手段,建设了大面积的针叶纯林及其与灌木的乔灌混交林。由于地处崇礼区冬奥场馆周边,如何快速且充分发挥人工针叶幼龄林及乔灌混交林的水源涵养与水土保持功能,对于保障崇礼赛区冬奥场馆的正常运营、改善冬奥场馆周边小流域生态环境尤为重要。因此,亟需对人工针叶幼龄林及其不同混交配置模式的生态服务功能进行深入研究。为研究项目实施后冬奥周边小流域的林地水源涵养能力,以崇礼区西沟−羊草沟流域的5种典型配置模式的人工针叶幼龄林为研究对象,定量分析和比较其枯落物层及土壤层的水源涵养能力,为冬奥会崇礼赛区乃至整个冀北地区人工林的恢复、经营和水源涵养、水土保持功能的研究提供理论依据和科学参考。
1. 研究区概况
研究区位于河北省张家口市崇礼区驿马图乡的羊草沟流域(图1),地处冀北接坝山区,属于清水河支流−崇礼西沟流域,清水河(永定河水系上游)源头即起源于此,地理坐标为41°04′05″ ~ 41°08′30″N,114°58′30″ ~ 115°02′30″E,海拔在1 084 ~ 1 575 m之间,属温带大陆性季风气候,地形大部分为山地,地势东高西低、北高南低,受地形影响,结霜期较晚,年均降雨量456.8 mm,全年降雨集中在6—9月,降雨时空分布不均。土壤以山地褐土和栗钙土为主。
![]() 图 1 研究区地理位置图Ⅰ.落叶松纯林,Ⅱ.樟子松纯林,Ⅲ.落叶松柠条混交林,Ⅳ.樟子松柠条混交林,Ⅴ.樟子松落叶松柠条混交林。下同。Ⅰ, Larix gmelinii pure forest;Ⅱ, Pinus sylvestris pure forest;Ⅲ, Larix gmelinii and Caragana korshins mixed forest;Ⅳ, Pinus sylvestris and Caragana korshins mixed forest;Ⅴ, Pinus sylvestris, Larix gmelinii and Caragana korshins mixed forest. Same as below.Figure 1. Geographical location map of the study area
图 1 研究区地理位置图Ⅰ.落叶松纯林,Ⅱ.樟子松纯林,Ⅲ.落叶松柠条混交林,Ⅳ.樟子松柠条混交林,Ⅴ.樟子松落叶松柠条混交林。下同。Ⅰ, Larix gmelinii pure forest;Ⅱ, Pinus sylvestris pure forest;Ⅲ, Larix gmelinii and Caragana korshins mixed forest;Ⅳ, Pinus sylvestris and Caragana korshins mixed forest;Ⅴ, Pinus sylvestris, Larix gmelinii and Caragana korshins mixed forest. Same as below.Figure 1. Geographical location map of the study area2010年开始在荒山荒坡内实施封山育林和人工造林相结合的植被恢复与重建,坝头山地以营造水土保持林、防风固沙林和水源涵养林为主;阴坡、半阴坡土层较厚的坡面以落叶松(Larix gmelinii)、樟子松(Pinus sylvestris var. mongolica)为主;阳坡、半阳坡土层较薄,树种设计以樟子松、油松(Pinus tabuliformis)为主;沟壑设计栽植沙棘(Hippophae rhamnoides)、杨树(Populus simonii var. przewalskii),乔灌混交达到7∶3。混交方式以不规则块状混交和班间混交为主,现已形成华北落叶松(Larix gmelinii var. principis-rupprechtii)针叶纯林、樟子松针叶纯林、华北落叶松柠条(Caragana korshinskii)混交林、樟子松柠条混交林、华北落叶松樟子松柠条混交林5种主要人工林地。灌木林地主要有山杏(Armeniaca sibirica)、沙棘(Hippophae rhamnoides)等。
2. 研究方法
2.1 样地调查
于2021年5月初,在流域内选取了代表该区域管理后植被恢复都为12年的5块面积为20 m × 20 m的标准样地,包括Ⅰ落叶松纯林、Ⅱ樟子松纯林、Ⅲ落叶松柠条混交林、Ⅳ樟子松柠条混交林、Ⅴ樟子松落叶松柠条混交林(图1),并对5种不同配置模式的造林地进行了野外调查,包括GPS定位、每木检尺调查,并记录了海拔、坡向、坡度、郁闭度以及林分密度等,生长季初期林下无草本生长。表1记录了5个采样点的植物种类和地形信息。
表 1 样地类型和基本特征Table 1. Sample plot types and basic characteristics林分类型
Forest stand type海拔
Altitude/m坡度
Slope/(°)林龄/a
Stand age/year树高
Tree height/mDBH/cm 林分密度/(株·hm−2)
Forest density/(tree·ha−1)Ⅰ 1 521 20 12 2.35 3.75 950 Ⅱ 1 493 22 12 2.21 4.17 1 075 Ⅲ 1 286 22 12 3.24 3.55 1 250 Ⅳ 1 569 22 12 3.52 4.37 1 275 Ⅴ 1 249 23 12 2.68 3.86 1 125 2.2 枯落物调查
枯落物储量调查在每个样地内都选取3个(坡上、坡中、坡下)面积为0.2 m × 0.2 m的小样方,用钢尺分别测量未分解层和半分解层的厚度并记录,分层取样后装入牛皮纸袋中进行称鲜质量,然后带回放入烘箱在105 ℃下烘12 h后称干质量。
枯落物持水测定采用室内浸泡法[14]进行枯落物持水量和持水速率的测定。
枯落物有效拦蓄量计算通过枯落物持水、蓄积量以及自然含水率[15]进行推算,得到枯落物的有效拦蓄量。
2.3 土壤调查
土壤物理性质测定采用剖面法,在每块样地内选取3个样点挖取土壤剖面,由于该地区土层较薄,且多为砾石,加上每个样地土层深度不同,为保证所有样地取土层相同,所以仅在0 ~ 10 cm的土层取环刀土样,并用环刀法[16]测定土壤密度、孔隙度等物理性质。
土壤入渗测定采用原状土双环法[17]测定土壤入渗,在每块样地随机选取3个样点进行试验。
2.4 数据处理
采用Excel 2016和SPSS 22.0软件进行数据处理,使用ArcGIS 10.4.1和Origin 2021进行做图,采用单因素方差分析进行差异显著性分析(P < 0.05)。
3. 结果与分析
3.1 不同配置模式的枯落物蓄积量
由表2可知:5种配置模式的枯落物总厚度处于5.10 ~ 6.70 mm之间,总蓄积量处于2.55 ~ 4.50 t/hm2之间,其大小排序为樟子松纯林(4.50 t/hm2) > 樟子松落叶松柠条混交林(3.81 t/hm2) > 樟子松柠条混交林(3.76 t/hm2) > 落叶松纯林(3.64 t/hm2) > 落叶松柠条混交林(2.55 t/hm2)。5种配置模式枯落物的半分解层蓄积量及厚度均小于对应未分解层的蓄积量及厚度,半分解层枯落物的蓄积量大小排序为樟子松纯林 > 樟子松柠条混交林 > 落叶松纯林 > 樟子松落叶松柠条混交林 > 落叶松柠条混交林;未分解层枯落物的蓄积量大小排序为樟子松纯林 > 樟子松落叶松柠条混交林 > 樟子松柠条混交林 > 落叶松纯林 > 落叶松柠条混交林,落叶松柠条混交林与3种有樟子松的林地都表现为差异显著(P < 0.05)。
表 2 不同配置模式的枯落物厚度及持水情况Table 2. Litter thickness and water holding capacity of different configuration models林分类型
Stand type枯落物层
Litter layer枯落物蓄积量/(t·hm−2)
Litter volume/(t·ha−1)枯落物厚度
Litter thickness/mmⅠ 半分解层 Semi-decomposed layer 1.68 ± 0.15a 2.60 ± 0.34ab Ⅱ 2.03 ± 0.32a 2.90 ± 0.29a Ⅲ 1.08 ± 0.06b 2.30 ± 0.15b Ⅳ 1.69 ± 0.49a 2.80 ± 0.17a Ⅴ 1.61 ± 0.35ab 2.70 ± 0.14ab Ⅰ 未分解层 Undecomposed layer 1.96 ± 0.12ab 3.30 ± 0.11b Ⅱ 2.47 ± 0.15a 3.80 ± 0.06a Ⅲ 1.47 ± 0.11b 2.80 ± 0.09c Ⅳ 2.07 ± 0.63a 3.30 ± 0.26b Ⅴ 2.20 ± 0.08a 3.50 ± 0.05b 注:同列不同小写字母表示同一分解状态下各处理间差异显著(P < 0.05);表中数据为平均值 ± 标准差。下同。Notes: different lowercase letters in the same column indicate significant differences between treatments at the same decomposed layer(P < 0.05); the data in the table are mean ± standard deviation. The same below. 3.2 不同配置模式的枯落物持水能力
3.2.1 枯落物最大持水量和最大持水率
由表3可知:5种配置模式的枯落物总的最大持水率处于231.20% ~ 333.05%之间,其大小排序为樟子松落叶松柠条混交林 > 落叶松纯林 > 落叶松柠条混交林 > 樟子松柠条混交林 > 樟子松纯林。在半分解层和未分解层中,樟子松落叶松柠条混交林的枯落物最大持水率都为最大,分别是161.42%和171.63%,樟子松纯林的枯落物最大持水率都为最小,分别是126.70%和104.50%。
表 3 不同配置模式枯落物层的拦蓄能力Table 3. Interception capacity of litter layer of different configuration models林分类型
Stand type枯落物层 Litter layer 自然含水率
Natural moisture content/%最大持水率
Maximum water holding rate/%最大持水量/(t·hm−2)
Maximum water holding capacity/(t·ha−1)有效拦蓄率
Effective interception rate/%有效拦蓄量/(t·hm−2)
Effective interception capacity/(t·ha−1)Ⅰ 半分解层
Semi-decomposed layer15.09 ± 0.02ab 149.46 ± 40.02a 0.95 ± 0.32b 107.58 ± 40.33a 0.63 ± 0.04a Ⅱ 17.76 ± 0.03a 126.70 ± 33.18a 1.48 ± 0.34ab 92.60 ± 25.81a 0.70 ± 0.04a Ⅲ 15.09 ± 0.02ab 159.93 ± 50.38a 1.46 ± 0.35ab 123.52 ± 41.39a 0.71 ± 0.05a Ⅳ 17.76 ± 0.03a 151.23 ± 8.96a 1.30 ± 0.61a 123.59 ± 9.97a 0.68 ± 0.04a Ⅴ 11.01 ± 0.01b 161.42 ± 33.51a 1.33 ± 0.22ab 127.85 ± 27.67a 0.68 ± 0.05a Ⅰ 未分解层 Undecomposed layer 11.97 ± 0.04a 147.65 ± 27.28a 1.00 ± 0.07b 113.41 ± 25.04a 0.54 ± 0.02c Ⅱ 16.78 ± 0.06a 104.50 ± 11.61b 1.46 ± 0.41ab 74.56 ± 8.92b 0.71 ± 0.03b Ⅲ 11.97 ± 0.04a 120.11 ± 3.94b 1.17 ± 0.04ab 92.44 ± 2.58b 0.65 ± 0.03b Ⅳ 16.78 ± 0.06a 106.44 ± 5.14b 1.59 ± 0.33a 83.94 ± 3.93b 0.78 ± 0.04a Ⅴ 10.06 ± 0.02a 171.63 ± 9.42a 1.37 ± 0.16ab 137.33 ± 6.79a 0.69 ± 0.04b 枯落物总的最大持水量处于1.95 ~ 2.94 t/hm2之间,其大小排序为樟子松纯林 > 樟子松柠条混交林 > 樟子松落叶松柠条混交林 > 落叶松柠条混交林 > 落叶松纯林。在半分解层中,樟子松纯林的枯落物最大持水量最大,为1.48 t/hm2,而落叶松纯林最小,为0.95 t/hm2,5种配置模式之间无显著差异;在未分解层中,樟子松 柠条混交林的枯落物最大持水量最大,为1.59 t/hm2,而落叶松纯林最小,为1.00 t/hm2,樟子松柠条混交林和落叶松纯林差异显著(P < 0.05)。
3.2.2 枯落物有效拦蓄量
由表3可知:5种配置模式的有效拦蓄量处于1.17 ~ 1.46 t/hm2之间,其大小排序为樟子松柠条混交林 > 樟子松纯林 > 樟子松落叶松柠条混交林 > 落叶松柠条混交林 > 落叶松纯林。在半分解层中落叶松柠条混交林的枯落物有效拦蓄量最大,落叶松纯林的最小;在未分解层中樟子松柠条混交林的枯落物有效拦蓄量最大,落叶松纯林的最小。方差分析表明5种配置模式的有效拦蓄量在半分解层和未分解层的显著性与最大持水量一致,即5种配置模式在半分解层之间无显著差异,在未分解层樟子松纯林,落叶松柠条混交林和樟子松落叶松 柠条混交林之间无显著差异,但他们与另外两种配置模式之间差异显著(P < 0.05)。
3.2.3 枯落物持水过程
5种配置模式的枯落物半分解层和未分解层的持水过程变化趋势总体上大致相同(图2),在2 h内都快速上升,2 h后上升的速率逐渐减小,直到8 h后逐渐趋于稳定,在浸泡12 h时都已趋于饱和状态。对不同配置模式枯落物持水量和浸水时间进行统计分析,得出5种林分的关系式为(表4)Q = alnt + b,式中:Q为枯落物持水量(g/kg),t为枯落物浸水时间(h),a、b为方程系数[18]。
![]() 图 2 5种配置模式枯落物持水过程Figure 2. Water-holding process of litter in five configuration models表 4 不同配置模式枯落物层持水量、吸水速率与浸水时间的关系式Table 4. Relationship between water holding capacity, water absorption rate and immersion time ofdifferent configuration models in litter layers
图 2 5种配置模式枯落物持水过程Figure 2. Water-holding process of litter in five configuration models表 4 不同配置模式枯落物层持水量、吸水速率与浸水时间的关系式Table 4. Relationship between water holding capacity, water absorption rate and immersion time ofdifferent configuration models in litter layers林分类型
Stand type枯落物层
Litter layer持水过程
Water holding procedure吸水过程
Water absorption procedure回归方程
Regression equationR2 回归方程
Regression equationR2 Ⅰ 半分解层 Semi-decomposed layer Q = 138.28lnt + 1 087.4 0.989 4 V = 5 632.4t−1.822 0.951 1 Ⅱ Q = 137.38lnt + 883.7 0.964 1 V = 4 335.3t−1.770 0.947 1 Ⅲ Q = 96.27lnt + 1 310.4 0.980 1 V = 5 740.4t−1.758 0.944 5 Ⅳ Q = 121.49lnt + 1 051.0 0.979 1 V = 1 379.5t−0.935 0.999 7 Ⅴ Q = 191.92lnt + 1 185.7 0.951 3 V = 5 560.5t−1.837 0.948 5 Ⅰ 未分解层 Undecomposed layer Q = 133.70lnt + 1 100.7 0.976 6 V = 5 780.1t−1.829 0.948 7 Ⅱ Q = 107.70lnt + 745.9 0.971 9 V = 3 714.6t−1.786 0.946 0 Ⅲ Q = 88.59lnt + 920.2 0.958 7 V = 6 793.0t−1.840 0.953 6 Ⅳ Q = 86.81lnt + 824.8 0.977 2 V = 5 102.8t−1.887 0.957 3 Ⅴ Q = 153.35lnt + 1 286.5 0.970 5 V = 4 444.9t−1.862 0.951 9 3.2.4 枯落物吸水过程
由图3可知:5种配置模式的枯落物吸水速率变化规律基本一致,在2 h内最大且快速下降,2 h后吸水速率逐渐减慢,到6 h后逐渐趋于稳定,24 h时已经接近零。对不同配置模式枯落物吸水速率和浸水时间进行统计分析,得出5种配置模式的关系式为(表4)V = mtn,式中:V为枯落物吸水速率,g/(kg·h);t为枯落物浸水时间,h;m为方程系数;n为指数[19]。
![]() 图 3 枯落物层吸水速率与浸水时间的关系Figure 3. Relationship between water absorption rate and immersion time in litter layer
图 3 枯落物层吸水速率与浸水时间的关系Figure 3. Relationship between water absorption rate and immersion time in litter layer3.3 土壤水文物理性质
3.3.1 土壤物理性质及持水能力
由表5可知:5种配置模式的土壤密度大小排序为落叶松纯林 > 樟子松纯林 > 落叶松柠条混交林 > 樟子松柠条混交林 > 樟子松落叶松柠条混交林。5种配置模式的土壤总孔隙度大小排序为:樟子松落叶松柠条混交林 > 樟子松柠条混交林 > 落叶松柠条混交林 > 樟子松纯林 > 落叶松纯林。樟子松落叶松柠条混交林的非毛管孔隙度和毛管孔隙度都最大,分别为7.93%和33.16%,落叶松纯林的非毛管孔隙度和毛管孔隙度都最小,分别为3.25%和28.19%。
表 5 不同配置模式土壤层的土壤持水及物理性质Table 5. Soil water holding capacity and physical properties of soil layers in different configuration models林分类型
Stand type土壤密度
Soil density/
(g·cm−3)非毛管孔隙度
Non-capillary porosity/%毛管孔隙度
Capillary porosity/%总孔隙度
Total porosity/%最大持水量/(t·hm−2)
Maximum water holding capacity/(t·ha−1)毛管持水量/(t·hm−2)
Capillary water holding capacity/(t·ha−1)有效持水量/(t·hm−2)
Effective water holding capacity/(t·ha−1)Ⅰ 1.62 ± 0.07a 3.25 ± 0.26b 28.19 ± 0.46b 31.44 ± 0.63b 516.21 ± 6.04b 468.45 ± 2.54b 47.76 ± 4.60b Ⅱ 1.56 ± 0.12ab 3.58 ± 0.52b 28.33 ± 1.28b 31.91 ± 1.80b 529.40 ± 13.21ab 477.28 ± 13.79ab 52.12 ± 2.88b Ⅲ 1.44 ± 0.02bc 5.14 ± 0.28ab 28.51 ± 0.87b 34.11 ± 1.51ab 550.89 ± 20.75ab 474.45 ± 18.70ab 76.44 ± 2.05a Ⅳ 1.42 ± 0.02bc 5.60 ± 0.75ab 29.27 ± 0.54ab 34.42 ± 0.33ab 557.10 ± 7.57ab 475.87 ± 3.43ab 81.23 ± 4.18a Ⅴ 1.20 ± 0.03c 7.93 ± 0.38a 33.16 ± 0.44a 41.09 ± 0.63a 645.36 ± 10.07a 558.57 ± 6.99a 86.79 ± 6.10a 5种配置模式土壤的最大持水量处于516.21 ~ 645.36 t/hm2,其大小排序为:樟子松落叶松柠条混交林 > 樟子松柠条混交林 > 落叶松柠条混交林 > 樟子松纯林 > 落叶松纯林,这与土壤总孔隙度、毛管孔隙度和非毛管孔隙度的变化规律一致。林地内有效持水量处于47.76 ~ 86.79 t/hm2之间,其中樟子松落叶松柠条混交林的有效持水量最大,是落叶松纯林的有效持水量的1.82倍。
方差分析表明:整体上,樟子松落叶松柠条混交林和2种纯林配置模式的土壤水文物理性质差异显著(P < 0.05),混交配置模式表现为樟子松落叶松柠条混交林和其他2种混交林配置模式的土壤水文物理性质无显著差异。
3.3.2 土壤入渗
由表6可知:5种配置模式的初渗速率和稳渗速率分别处于9.60 ~ 16.57 mm/min和2.10 ~ 5.34 mm/min之间。5种配置模式初渗速率和稳渗速率的大小排序都为:樟子松落叶松柠条混交林(Ⅴ) > 樟子松柠条混交林(Ⅳ) > 落叶松柠条混交林(Ⅲ) > 樟子松纯林(Ⅱ) > 落叶松纯林(Ⅰ)。樟子松落叶松柠条混交林初渗速率和稳渗速率分别是落叶松纯林初渗速率和稳渗速率的1.73倍和2.54倍。方差分析表明2种纯林和3种混交林配置模式的初渗速率差异显著(P < 0.05),且3种混交林配置模式的初渗速率之间差异显著(P < 0.05),落叶松纯林的稳渗速率与3种混交林配置模式都存在显著性差异(P < 0.05)。对土壤入渗的时间和速率进行拟合,得出二者符合幂函数关系:y = at−b,式中:y为入渗速率(mm/min);a、b都为方程系数;t为入渗时间(min)。
表 6 不同配置模式的土壤渗透速率及模型Table 6. Soil infiltration rate and model of different configuration models林分类型
Stand type初渗速率
Initial infiltration rate/(mm·min−1)稳渗速率
Steady infiltration rate/(mm·min−1)回归方程
Regression equationR2 Ⅰ 9.60 ± 0.28d 2.10 ± 0.26c y = 8.97t−0.47 0.932 9 Ⅱ 10.04 ± 0.34d 3.39 ± 0.33bc y = 9.82t−0.31 0.929 1 Ⅲ 11.71 ± 0.36c 3.54 ± 0.31b y = 10.43t−0.35 0.955 3 Ⅳ 13.91 ± 0.42b 4.61 ± 0.39ab y = 10.65t−0.26 0.919 8 Ⅴ 16.57 ± 0.38a 5.34 ± 0.35a y = 11.65t−0.24 0.865 8 4. 讨 论
4.1 不同配置模式下枯落物的蓄积量
枯落物储量的大小受树种组成、林龄、水热环境、凋落量、分解速率、地表累积时间等要素的综合影响[20-21]。本研究中,5种配置模式的枯落物厚度和蓄积量各不相同,樟子松纯林由于自身结构较优且适应能力强,其厚度和蓄积量均为最大(表2);5种配置模式下,枯落物的半分解层厚度和蓄积量均小于未分解层,这可能是由于所有树种都处于幼龄林阶段且分解时间较短,加上研究区总体降水量较低(401.6 mm/a),平均气温偏冷(3.5 ℃),且处于高寒半干旱地区,特定的地理气候环境导致枯落物累积和分解速率均较慢,这也与公博等[12]的研究结果一致。
4.2 不同配置模式下枯落物层的水文特征
枯落物的持水能力受树种、枯落物组成、蓄积量和分解速率等多重影响[22]。本研究中,5种配置模式的枯落物最大持水量、最大持水率以及有效拦蓄量的变化规律并不一致,这与枯落物的生物量及其自身结构有关[9]。总体而言,不论乔灌混交林还是纯林,樟子松林的枯落物持水量均偏大(表5),这可能是由于同龄樟子松本身适应能力强,生长状况更好,加之同龄樟子松叶片轮廓均大于落叶松,使得樟子松的外型与枯落物厚度较之同龄的落叶松均更大;另外一个可能原因是,樟子松林地的林分密度较高(表1),受林内环境因素的影响,樟子松林地的持水量均普遍较大。尽管枯落物持水量和吸水速率都与浸水时间呈现出较好的函数关系,但樟子松和落叶松林地持水和吸水变化规律与邓继峰等[23]、孙拥康等[24]的研究结果不同,这种差异可能与树种的生长阶段不同直接相关,也可能是区域、树种生物学特性等差异的影响所导致。
4.3 不同配置模式下土壤层的水文特征
由于不同森林植被类型生态学特性的差异,同一区域相同生境内,不同配置模式的土壤层蓄水渗透性能也表现出差异[6]。本研究中,5种配置模式的土壤水文物理性质变化规律一致,即3种混交配置模式的土壤物理性质和入渗性能均优于纯林,其中,樟子松落叶松柠条混交林在5种配置模式中均为最优,可能是由于樟子松 落叶松柠条混交林相对于其他4种配置,其树种组成,土壤层的腐殖物质以及根系生物量更为复杂多样(本研究测得樟子松落叶松柠条混交林的平均根质量密度最大,为2.13 kg/m3,落叶松纯林的平均根质量密度最小,为1.93 kg/m3)。腐殖物质和根系对土壤的改良调控作用导致土壤理化性质和入渗性能的变化显著。一方面,说明与柠条混交的配置模式对于林地土壤密度、孔隙度等土壤物理性质的提升显著,另一方面,说明樟子松和落叶松的混交配置模式产生的枯落物及其分解过程对林地蓄水能力提升有一定改善,三者的相互耦合,使得林地土壤的蓄水能力得到显著提高,从而为混交林地中不同植被的生长生存提供了更有利的土壤水文条件。这也与廖军[25]、公博等[12]的研究结论一致,不同配置模式的土壤水文物理性质存在一定的差异,混交林配置模式由于树种、枯落物组成以及根系分布更加复杂,比人工纯林有更强的水源涵养能力,可以有效地延缓地表径流的产生,减少水土流失,改善生态质量[26]。
5. 结 论
综合来看,樟子松落叶松柠条混交林的枯落物层和土壤层的水文性能都高于其他林地,即该人工林的水源涵养能力最强,足以说明树种选择和配置方式在人工林重建和恢复过程中的重要性,可以作为该地区首选的植被恢复模式。恢复方式对于新营造的森林结构和功能至关重要[27],然而当前研究区人工林经营和抚育作业开展仍较少,大多以单次人工林营造为主,并且仍存在林分结构单一、不合理的现象。目前的恢复方式侧重于树种组成、结构、自然栖息地、生态系统过程和服务的恢复[28]。人工造林对生态系统服务功能的构建不仅与造林区域的气候与土壤有关[29],也与造林树种、造林密度和经营管理措施的差异有关[30]。森林结构的复杂性在调节森林生态系统功能方面起着至关重要的作用,并强烈影响生物多样性[31]。林分空间结构是林分特征的重要研究内容之一,而林分结构对森林功能的发挥有重要影响作用[32],混交林的林分结构相较于纯林更为复杂,物种更加丰富多样。因此,迫切需要加强人工林经营管理,根据不同的环境条件,充分考虑树种和配置模式,通过结构化森林经营技术[33-34],实施针叶纯林改造技术,改善林分状态,提高林分稳定性。
-
![]()
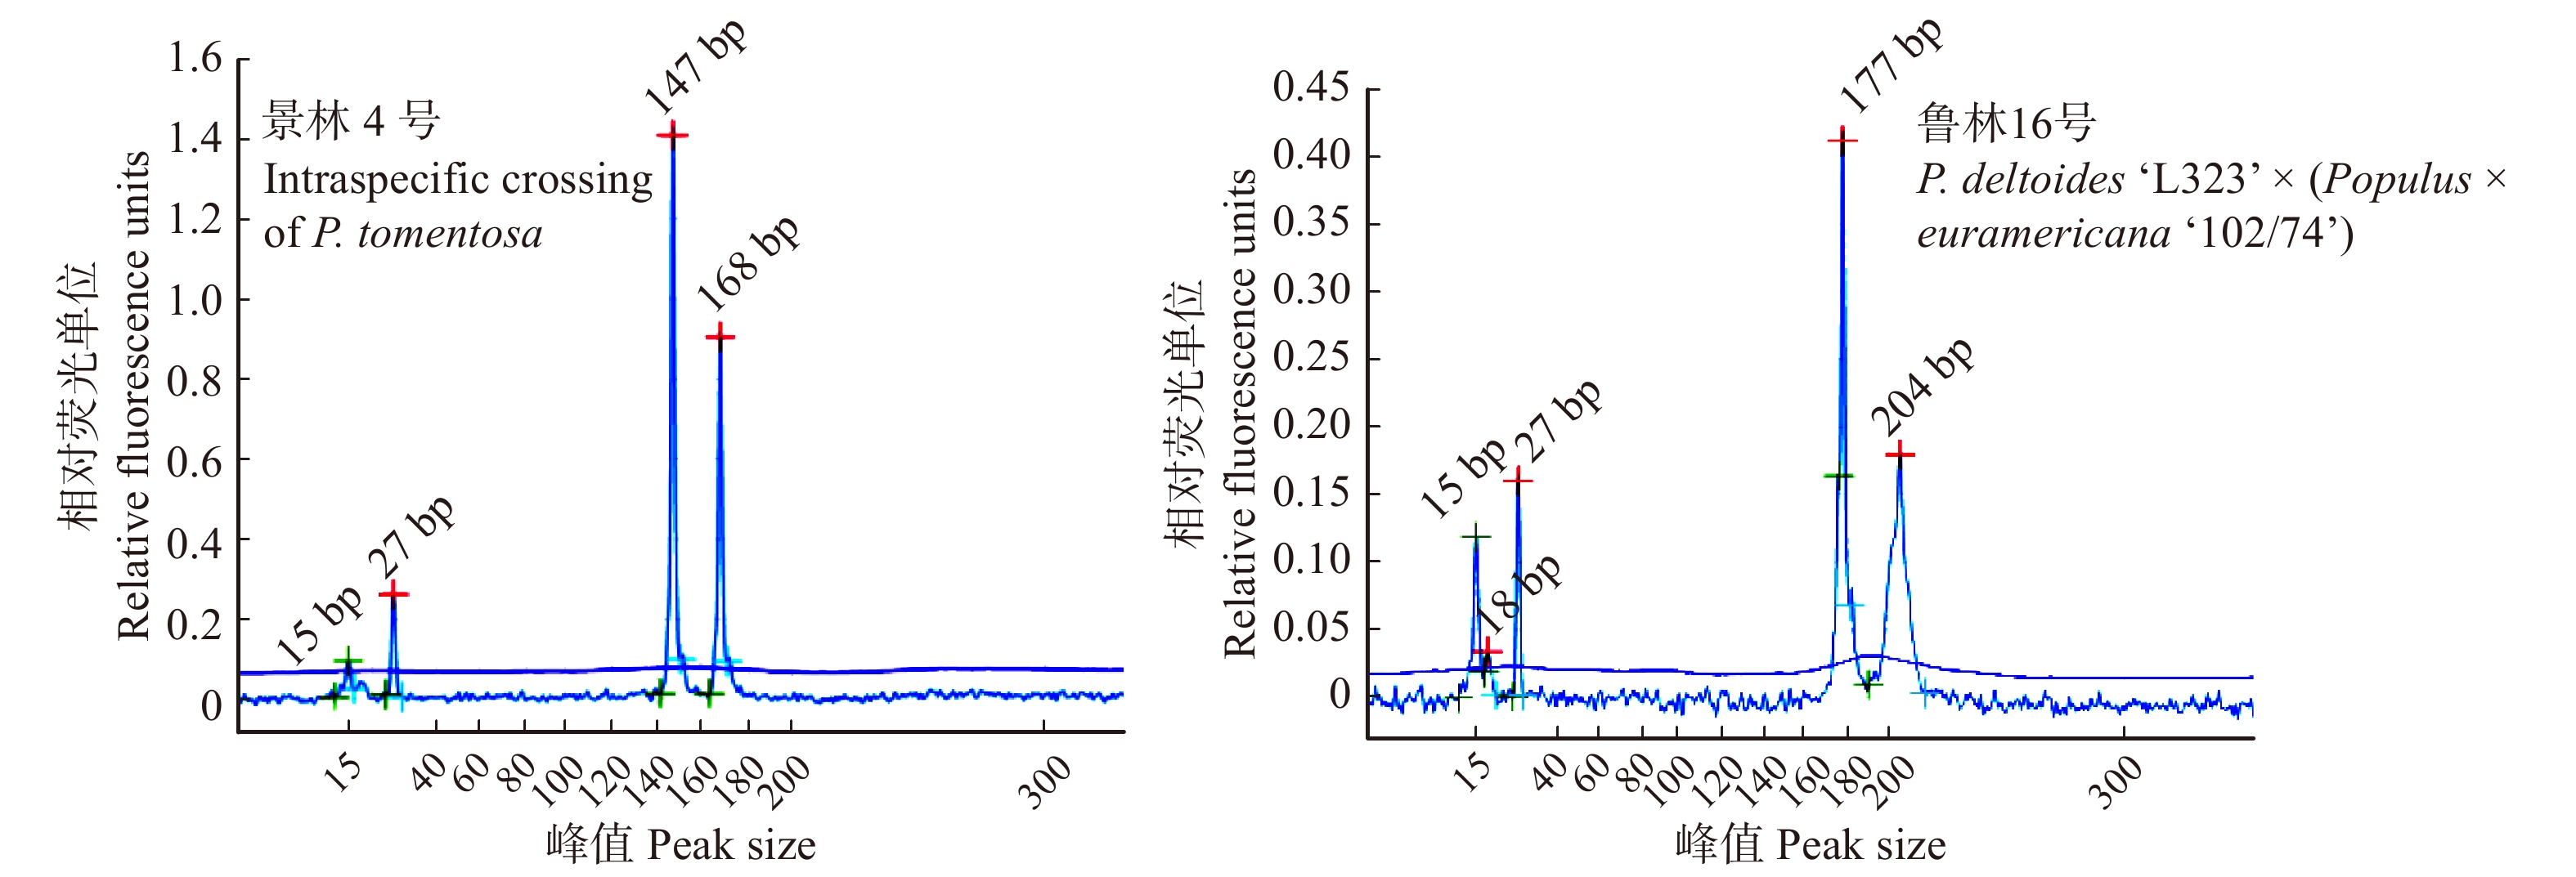
图 1 引物PMGC_2217在2个杨树品种中的电泳图谱
Figure 1. Electropherogram detected by PMGC_2217 for 2 poplar varieties
![]()
图 2 基于SSR结果的50份杨树品种(系)的聚类树状图
Figure 2. Dendrogram of 50 poplar varieties(clone)based on SSR results
表 1 试验材料信息
Table 1 Information of experimental materials
序号 No. 品种(系) Variety (Clone) 编码 Code 品种权号 Variety rights No. 1 毅杨1号(P. tomentosa × P. bolleana) × P. tomentosa ‘Truncata’ YY1 20120160 2 毅杨2号(P. tomentosa × P. bolleana) × P. tomentosa ‘Truncata’ YY2 20120161 3 毅杨3号(P. tomentosa × P. bolleana) × P. tomentosa ‘LM50’ YY3 20120162 4 景林2号Intraspecific crossing of P. tomentosa JL2 20160187 5 景林4号Intraspecific crossing of P. tomentosa JL4 20160189 6 景林5号Intraspecific crossing of P. tomentosa JL5 20160190 7 景林6号 P. tomentosa ×(P. alba × P. glandulosa) JL6 20160191 8 锦茂杨 P. tomentosa JMY 20150077 9 碧玉杨The hybrids of sect. Aigeiros and sect. Tacamahaca BYUY 20060001 10 碧云杨The hybrids of sect. Aigeiros and sect. Tacamahaca BYUNY 20060002 11 丹红杨 P. deltoides ‘55/65’ × P. deltoides ‘2KEN8’ DHY 20030003 12 鲁白杨1号(P. alba × P. glandulosa) × P. alba var. pyramidalis LB1 20150127 13 鲁白杨3号(P. alba × P. glandulosa) × P. alba var. pyramidalis LB3 20150129 14 红霞杨 P. deltoides ‘I-69/55’ × P. deltoides ‘Shan Hai Guan’ HXY 20120156 15 彩红杨 P. deltoides ‘I-69/55’ × P. deltoides ‘Shan Hai Guan’ CHY 20150163 16 中红杨 P. deltoides ‘I-69/55’ × P. deltoides ‘Shan Hai Guan’ ZHY 20060007 17 全红杨 P. deltoides ‘I-69/55’ × P. deltoides ‘Shan Hai Guan’ QHY 20110002 18 靓红杨 P. deltoides ‘I-69/55’ × P. deltoides ‘Shan Hai Guan’ LHY 20160180 19 林源1号 P. tomentosa ×(P. alba × P. glandulosa) LY1 20160192 20 林源3号 P. tomentosa ×(P. alba × P. glandulosa) LY3 20160193 21 林源4号 P. tomentosa ×(P. alba × P. glandulosa) LY4 20160194 22 林源5号 P. tomentosa ×(P. alba × P. glandulosa) LY5 20160195 23 青山杨 P. pseudo-cathayana × P. deltoides ‘Shan Hai Guan’ QSY — 24 黑青杨(Populus × euramericana ‘N3016’) × P. ussuriensis HQY 20130093 25 鲁林3号杨 P. deltoides ‘I-69/55’ × P. deltoides ‘PE-3-71’ LL3 20080031 26 鲁林9号杨 P. deltoides ‘L324’ × P. deltoides ‘S307-26’ LL9 20130122 27 鲁林16号杨 P. deltoides ‘L323’ ×(Populus × euramericana ‘102/74’) LL16 20130121 28 秦白杨1号 P. alba ×(P. alba × P. glandulosa) QB1 20160183 29 秦白杨2号 P. alba ×(P. alba × P. glandulosa) QB2 20160184 30 秦白杨3号 P. alba ×(P. alba × P. glandulosa) QB3 20160185 31 京2杨(P. deltoides ‘Shan Hai Guan’ × P. deltoides ‘I-63/51’) ×
[(Populus × euramericana ‘I-72/58’) × P. deltoides ‘Shan Hai Guan’]J2Y 20050033 32 南林415杨 P. deltoides ‘T120’ × P. deltoides ‘S3415’ NL415 20160166 33 南林15杨 P. deltoides ‘I-69/55’ × P. deltoides ‘S3244’ NL15 20160164 34 泗杨2号 P. deltoides ‘I-69/55’ × P. deltoides ‘S3239’ SY2 20160165 35 北林1号(P. tomentosa × P. bolleana) ×(P. alba × P. glandulosa) BL1 20090016 36 北林2号(P. tomentosa × P. bolleana) ×(P. alba × P. glandulosa) BL2 20090017 37 北林3号(P. alba × P. glandulosa) × P. tomentosa BL3 20090030 38 北林5号(P. alba × P. glandulosa) × P. tomentosa BL5 20090032 39 北林7号(P. alba × P. glandulosa) × P. tomentosa BL7 20090033 40 北林8号(P. alba × P. glandulosa) × P. tomentosa BL8 20090034 41 北林9号(P. alba × P. glandulosa) × P. tomentosa BL9 20090035 42 北林11号(P. alba × P. glandulosa) × P. tomentosa BL11 20090037 43 G2杨 G2 poplar G2Y — 44 森海1号 P. deltoides ‘55/56’ × P. cathayana SH1 20070014 45 森海2号 P. deltoides ‘55/56’ × P. cathayana SH2 20070015 46 健杨94 Populus × euramericana ‘Robusta 94’ JY94 20070022 47 17−31杨 17−31 poplar 17-31Y — 48 中成1号 P. deltoides ‘Danhong’ × P. deltoides ‘Nanyang’ ZC1 20130001 49 276杨 276 poplar 276Y — 50 17−58杨 17−58 poplar 17-58Y —  下载: 导出CSV
表 2 11对SSR引物信息
Table 2 11 pairs of SSR primer information
序号 No. 引物名称 Name of primer 引物序列 Primer sequence (5′−3′) 基序 Motif 退火温度 Annealing temperature/℃ 1 PMGC_2217 F:ATTAGCTTCTTCTAAAGCAGC
R:TGACTGACTGTCTGTCTTCGGA 55 2 PMGC_2607 F:TTAAAGGGTGGTCTGCAAGC
R:CTTCTTGCACCTCGTTTTGAGGA 55 3 PMGC_2885 F:CATGATCAAATTGGATTTGAATG
R:AAAGATGAACATGGCTAGCTCGA 62 4 GCPM_162 F:GCCCAAACTCTTATTTGATG
R:TGGTGGAGGCTAGGATAGTACTT 52 5 GCPM_1255 F:GAACCTTAAAACCAGAACCC
R:GAGCCACAGAAATACTGCTCAG 52 6 PMGC_649 F:CATCCATGATATCAAACCAAATTAG
R:TGTAATCCAAACATAAAATCCCAAGGA 50 7 PMGC_2525 F:CGAGTCACAAGCTCCCAATAG
R:GCAGGCTGTCCTATCTGCGGA 50 8 GCPM_1599 F:AACAAAACCACCACACAAAT
R:TGTAATGTTCCTACTCCGCTAG 50 9 PMGC_2020 F:TAAGGCTCTGTTTGTTAGTCAG
R:GAGATCTAATAAAGAAGGTCTTCGA 52 10 PMGC_2030 F:TCCACAACTCTTGGCTAACC
R:GGACTACAATGTGCGTGACCGA 52 11 ORPM_248 F:TGTGTGTTTTCGGTGATTATGA
R:CCAAAGCAAATGCCACATTATTGG 50
下载: 导出CSV
表 3 11对SSR引物多态性分析
Table 3 Analysis of 11 pairs of SSR primer polymorphisms
No. N Na Ng Ne I PIC 1 50 13 21 7.974 2.296 0.863 2 50 11 20 7.022 2.140 0.843 3 48 12 21 5.984 2.028 0.815 4 49 15 22 8.747 2.411 0.877 5 49 17 21 11.655 2.584 0.908 6 49 10 19 7.167 2.096 0.845 7 49 11 21 5.254 2.019 0.794 8 50 13 22 7.530 2.222 0.853 9 50 11 23 7.310 2.125 0.848 10 48 5 7 3.465 1.364 0.661 11 49 4 5 2.474 1.031 0.530 合计 Total 122 202 74.583 22.317 8.837 均值 Mean 11.091 18.364 6.780 2.029 0.803 注:N. 样本量;Na. 等位重复序列数;Ng. 基因型数;Ne. 有效等位重复序列数;I. Shannon信息指数;PIC. 多态信息指数。Notes: N, number of samples; Na, number of allelic repeat sequences; Ng, number of genotype; Ne, effective number of allelic repeat sequences; I, Shannon’s information index; PIC, polymorphic information content.
下载: 导出CSV
表 4 遗传相似系数相关性分析
Table 4 Correlation analysis of genetic similarity coefficient
引物序号 Primer No. 1 2 3 4 5 6 7 8 9 10 11 相关系数 Correlation coefficient 0.573** 0.369** 0.486** 0.473** 0.462** 0.466** 0.398** 0.403** 0.399** 0.292** 0.497** 注:**P < 0.01水平上相关性极显著;*P < 0.05水平上相关性显著。Notes: ** means the correlation was extremely significant at P < 0.01 level; * means the correlation was significant at P < 0.05 level.
下载: 导出CSV
-
[1] 张忠涛, 孙乐智. 我国的杨树资源与开发利用[J]. 林业建设, 2001(5):21−24. doi: 10.3969/j.issn.1006-6918.2001.05.007 Zhang Z T, Sun L Z. Poplar resource and utilization in China[J]. Forestry Construction, 2001(5): 21−24. doi: 10.3969/j.issn.1006-6918.2001.05.007
[2] 何承忠, 张志毅, 安新民, 等. 我国杨树育种现状及其展望[J]. 西南林学院学报, 2006, 26(4):86−89. He C Z, Zhang Z Y, An X M, et al. Present situation and prospect to poplar breeding in China[J]. Journal of Southwest Forestry College, 2006, 26(4): 86−89.
[3] 栾鹖慧, 苏晓华, 张冰玉. 杨属(Populus L.)种质资源遗传学评价研究进展[J]. 植物学报, 2011, 46(5):586−595. Luan H H, Su X H, Zhang B Y. Research progress in genetic evaluation of Populus L. germplasm resources[J]. Chinese Bulletin of Botany, 2011, 46(5): 586−595.
[4] 潘惠新. 杨树新品种选育研究[J]. 林业科技开发, 2002, 16(3):3−4. doi: 10.3969/j.issn.1000-8101.2002.03.001 Pan H X. Research on selective breeding of new cultivars for poplar[J]. Forest Research, 2002, 16(3): 3−4. doi: 10.3969/j.issn.1000-8101.2002.03.001
[5] 张鹤, 张文庆, 赵敬东. DNA分子标记在植物新品种保护中的应用现状及发展前景[J]. 安徽农业科学, 2009, 37(34):16897−16899. doi: 10.3969/j.issn.0517-6611.2009.34.022 Zhang H, Zhang W Q, Zhao J D. Application status and development of DNA molecular marker in protection of new plant variety[J]. Journal of Anhui Agricultural Sciences, 2009, 37(34): 16897−16899. doi: 10.3969/j.issn.0517-6611.2009.34.022
[6] 张德强, 张志毅, 杨凯. 杨树分子标记研究进展[J]. 北京林业大学学报, 2000, 22(6):79−84. doi: 10.3321/j.issn:1000-1522.2000.06.020 Zhang D Q, Zhang Z Y, Yang K. Advances of molecular marker researches in poplar[J]. Journal of Beijing Forestry University, 2000, 22(6): 79−84. doi: 10.3321/j.issn:1000-1522.2000.06.020
[7] 王和勇, 乔爱民, 陈敏, 等. 植物遗传标记的发展及应用[J]. 仲恺农业技术学院学报, 2000, 13(4):58−64. Wang H Y, Qiao A M, Chen M, et al. The development and application of plant genetic markers[J]. Journal of Zhongkai Agrotechnical College, 2000, 13(4): 58−64.
[8] 李柱刚, 崔崇士, 马荣才, 等. 遗传标记在植物上的发展与应用[J]. 东北农业大学学报, 2001, 32(4):396−401. doi: 10.3969/j.issn.1005-9369.2001.04.013 Li Z G, Cui C S, Ma R C, et al. Development and application of genetic markers in plants[J]. Journal of Northeast Agricultural University, 2001, 32(4): 396−401. doi: 10.3969/j.issn.1005-9369.2001.04.013
[9] Castiglione S, Wang G, Damiani G, et al. RAPD fingerprints for identification and for taxonomic studies of elite poplar (Populus spp.) clones[J]. Theoretical & Applied Genetics, 1993, 87(1−2): 54−59.
[10] 尹佟明, 孙晔, 易能君, 等. 美洲黑杨无性系AFLP指纹分析[J]. 植物学报, 1998, 40(8):778−780. doi: 10.3321/j.issn:1672-9072.1998.08.015 Yin T M, Sun Y, Yi N J, et al. Genome fingerprinting analysis in Populus deltoids[J]. Acta Botanica Sinica, 1998, 40(8): 778−780. doi: 10.3321/j.issn:1672-9072.1998.08.015
[11] 崔国惠, 倪中福, 刘志勇, 等. 小麦杂种优势群研究Ⅲ普通小麦和斯卑尔脱小麦微卫星分子标记遗传差异的研究[J]. 农业生物技术学报, 1999, 7(4):333−338. doi: 10.3969/j.issn.1674-7968.1999.04.007 Cui G H, Ni Z F, Liu Z Y, et al. Study on wheat heterotic group Ⅲ genetic diversity revealed by microsatellite marker in wheat (Triticum aestivum L.) and spelt (Triticum spelta L.)[J]. Journal of Agricultural Biotechnology, 1999, 7(4): 333−338. doi: 10.3969/j.issn.1674-7968.1999.04.007
[12] 卫尊征, 张金凤, 张德强, 等. 白、青杨派间杂交幼胚培养及杂种子代的分子鉴定[J]. 北京林业大学学报, 2008, 30(5):73−77. doi: 10.3321/j.issn:1000-1522.2008.05.012 Wei Z Z, Zhang J F, Zhang D Q, et al. Immature ovule culture of inter-sectional hybrids between (Populus tomentosa × P. bolleana) and P. simonii and molecular identification of the hybrid filial generation[J]. Journal of Beijing Forestry University, 2008, 30(5): 73−77. doi: 10.3321/j.issn:1000-1522.2008.05.012
[13] 姚俊修, 毛秀红, 李善文, 等. 基于荧光SSR标记的白杨派种质资源遗传多样性研究[J]. 北京林业大学学报, 2018, 40(6):92−100. Yao J X, Mao X H, Li S W, et al. Genetic diversity of germplasm resources of Leuce based on SSR fluorescent marker[J]. Journal of Beijing Forestry University, 2018, 40(6): 92−100.
[14] 韩志校, 张军, 左力辉, 等. 基于SSR和ITS标记的杨树多态性及聚类分析[J]. 中国农业科技导报, 2017, 19(7):36−43. Han Z X, Zhang J, Zuo L H, et al. Populus polymorphism and cluster analysis based on SSR and ITS markers[J]. Journal of Agricultural Science and Technology, 2017, 19(7): 36−43.
[15] 梁海永, 刘彩霞, 杨敏生, 等. 杨树品种的SSR分析及鉴定[J]. 河北农业大学学报, 2005, 28(4):27−31. doi: 10.3969/j.issn.1000-1573.2005.04.007 Liang H Y, Liu C X, Yang M S, et al. Simple sequence repeat (SSR) analysis and identify of different cultivars in Populus L.[J]. Journal of Agricultural University of Hebei, 2005, 28(4): 27−31. doi: 10.3969/j.issn.1000-1573.2005.04.007
[16] 王辉, 杨敏生, 朱建峰. 利用SSR对杨属部分种及杂种的分析鉴定[J]. 东北林业大学学报, 2008, 36(12):4−6. doi: 10.3969/j.issn.1000-5382.2008.12.002 Wang H, Yang M S, Zhu J F. SSR analysis of some species and hybrids in Populus[J]. Journal of Northeast Agricultural University, 2008, 36(12): 4−6. doi: 10.3969/j.issn.1000-5382.2008.12.002
[17] 赵双菁, 刘莹莹, 魏敏静, 等. 标记引物数量对白桦遗传多样性的影响[J]. 防护林科技, 2016(4):6−10, 26. Zhao S J, Liu Y Y, Wei M J, et al. Effects of number of labeling primers on genetic diversity of Betula platyphylla[J]. Protection Forest Science and Technology, 2016(4): 6−10, 26.
[18] 苏龙, 徐志健, 乔卫华, 等. 广西药用野生稻遗传多样性分析及SSR引物数量对遗传多样性结果的影响研究[J]. 植物遗传资源学报, 2017, 18(4):603−610. Su L, Xu Z J, Qiao W H, et al. Study on genetic diversity of Oryza officinalis in Guangxi Province and the effect of the number of SSR primers on genetic diversity analysis[J]. Journal of Plant Genetic Resources, 2017, 18(4): 603−610.
[19] Allen G C, Flores-Vergara M A, Krasynanski S, et al. A modified protocol for rapid DNA isolation from plant tissues using cetyltrimethylammonium bromide[J]. Nature Protocols, 2006, 1(5): 2320−2325. doi: 10.1038/nprot.2006.384
[20] Peakall R, Smouse P E. GenAlEx 6.5: genetic analysis in Excel. population genetic software for teaching and research: an update[J]. Bioinformatics, 2012, 28(28): 2537−2539.
[21] Kalinowski S T, Taper M L, Marshall T C. Revising how the computer program cervus accommodates genotyping error increases success in paternity assignment[J]. Molecular Ecology, 2010, 16(5): 1099−1106.
[22] 李亚玲, 韩国民, 何沙娥, 等. 基于DNA分子标记数据构建系统进化树的新策略[J]. 生物信息学, 2008, 6(4):168−170. doi: 10.3969/j.issn.1672-5565.2008.04.007 Li Y L, Han G M, He S E, et al. A new strategy for construction of phylogenetic tree based on DNA molecular mark data[J]. China Journal of Bioinformatics, 2008, 6(4): 168−170. doi: 10.3969/j.issn.1672-5565.2008.04.007
[23] Botstein D. A theory of modular evolution for bacteriophages[J]. Annals of the New York Academy of Sciences, 2010, 354(1): 484−491.
[24] 刘峰, 冯雪梅, 钟文, 等. 适合棉花品种鉴定的SSR核心引物的筛选[J]. 分子植物育种, 2009, 7(6):1160−1168. Liu F, Feng X M, Zhong W, et al. Screening of SSR core primer pairs for identificating cotton cultivar[J]. Molecular Plant Breeding, 2009, 7(6): 1160−1168.
[25] 贾会霞, 姬慧娟, 胡建军, 等. 杨树新品种的SSR指纹图谱构建和倍性检测[J]. 林业科学, 2015, 51(2):69−79. Jia H X, Ji H J, Hu J J, et al. Fingerprints of SSR markers and ploidy detection for new Populus varieties[J]. Scientia Silvae Sinicae, 2015, 51(2): 69−79.
[26] 高伟, 王坤波, 刘方, 等. SSR引物及多态性位点数对陆地棉野生种系聚类结果的影响[J]. 植物遗传资源学报, 2013, 14(2):237−242. doi: 10.3969/j.issn.1672-1810.2013.02.008 Gao W, Wang K B, Liu F, et al. Effection of the quantity of SSR primer and allele on cluster analysis of Gossypium hirsutum Linn races[J]. Journal of Plant Genetic Resources, 2013, 14(2): 237−242. doi: 10.3969/j.issn.1672-1810.2013.02.008
[27] 王彪, 常汝镇, 陶莉, 等. 分析中国栽培大豆遗传多样性所需SSR引物的数目[J]. 分子植物育种, 2003, 1(1):82−88. doi: 10.3969/j.issn.1672-416X.2003.01.012 Wang B, Chang R Z, Tao L, et al. Identification of SSR primer numbers for analyzing genetic diversity of chinese soybean cultivated soybean[J]. Molecular Plant Breeding, 2003, 1(1): 82−88. doi: 10.3969/j.issn.1672-416X.2003.01.012
[28] 李瑾. 基于两种毛细管电泳系统检测呼吸道病毒的多重PCR技术的建立及应用[D]. 北京: 中国疾病预防控制中心, 2012. Li J. Development of two novel multiplex RT-PCR assays for simultaneous detection of 16 human respiratory virus types/subtypes based on capillary electrophoresis[D]. Beijing: Chinese Center for Disease Control and Prevention, 2012.
[29] 肖璐. 7种猪病毒性疫病QIAxcel及Bio-Plex检测方法的建立与初步应用[D]. 成都: 四川农业大学, 2017. Xiao L. Simultaneous typing of seven porcine virus pathogens by QIAxcel and Bio-Plex and its preliminary application[D]. Chengdu: Sichuan Agricultural University, 2017.


计量
- 文章访问数: 2880
- HTML全文浏览量: 1106
- PDF下载量: 73
