
Prediction of miRNA target genes in poplar and the expression analysis under low nitrogen stress
-
摘要:目的鉴定杨树受低氮胁迫后miRNA的靶基因,分析靶基因在氮胁迫后的差异表达并探讨其功能,为揭示杨树低氮胁迫下miRNA的调控功能提供参考,并为树木低氮营养高效利用育种提供重要的候选基因。方法根据miRNA的保守性及与靶基因的严谨互补配对关系,以杨树miRNA为探针利用靶基因预测软件psRNATarget,通过与毛白杨转录组的基因序列进行比对鉴定靶基因,进一步开展毛白杨受低氮胁迫后靶基因的差异表达分析及功能注释。结果获得了131个miRNA家族的242个miRNA成员对应的3 024个靶基因,分别参与了植物激素信号转导、次生代谢产物的生物合成、氨基酸合成代谢、碳代谢和RNA运输等通路。57个靶基因在低氮胁迫处理后发生显著变化,其中受到诱导(29个)和抑制(28个)的基因数目相当。14个低氮胁迫响应的miRNA,其对应的11个靶基因也发生了显著的差异表达变化,其中miRNA和靶基因表达量发生相反变化的有8个miRNA。本研究发现参与植物激素信号转导的靶基因(2个)及参与代谢途径的靶基因(6个)发生了差异表达。miR162的靶基因编码ABC转运蛋白,miR393运用于靶基因KAT2调节Na+和K+动态平衡,miR399的靶基因PIF3编码光敏色素互作因子PIFs蛋白,这些miRNA及靶基因可能在杨树响应低氮胁迫中发挥重要作用。结论本文鉴定到了毛白杨中一批低氮胁迫响应miRNA的靶基因,可调控杨树对氮逆境胁迫信号的反应。这些miRNA及靶基因为进一步揭示miRNA及靶基因在低氮胁迫下的调控功能提供了研究线索,为树木氮营养的高效利用改良提供了重要候选基因。Abstract:ObjectiveThe target genes of miRNAs under low nitrogen stress were identified, and the differential expression of target genes after nitrogen stress was analyzed and their functions were annotated. This investigation provides a reference for the revealing of the functions of miRNAs under low nitrogen stress. It also provides important candidate genes for the molecular improvement of low nitrogen nutrition utilization efficiency in trees.MethodBased on the conservation of miRNAs and the perfect complementary pairing between miRNAs and target genes, this investigation uses the target gene prediction software psRNATarget to compare the gene sequence of Populus tomentosa transcriptome to identify target genes with the miRNAs of poplar as a probe. Further analysis and functional annotation of target genes in P. tomentosa under low nitrogen stress were carried out.Result3 024 target genes corresponding to 242 miRNA members of 131 miRNA families were obtained, which were involved in pathways such as plant hormone signal transduction, biosynthesis of secondary metabolites, amino acid anabolism, carbon metabolism and RNA transport. 57 target genes changed significantly in P. tomentosa treated with low nitrogen stress, and the number of genes induced (29) and inhibited (28) was almost the same. There were also significant differential expression changes in the 11 target genes corresponding to 14 low-nitrogen-responsive miRNAs, among which, the opposite expression change was found between 8 miRNAs and the corresponding target genes.This investigation found that target genes involved in plant hormone signaling (2) or involved in metabolic pathways (6) were differentially expressed. The target gene of miR162 encodes the ABC transporter, miR393 acts on the target gene KAT2, which could regulate the dynamic balance of Na+ and K+. The target gene PIF3 of miR399 encodes the phytochrome interaction factor PIFs protein. These miRNAs and target genes might play important roles in the response of poplar to low nitrogen stress.ConclusionIn this investigation, we identified some low-nitrogen-stress-responsive miRNA target genes in P. tomentosa, which should regulate the response of poplar to nitrogen stress signals. The identification of these miRNAs and target genes should provide useful research clues for the further elucidation of the regulatory functions of miRNAs and targets involved in low nitrogen stress response and could be important candidate genes for the improvement of low nitrogen utilization efficiency in trees.
-
Keywords:
- Populus tomentosa /
- low nitrogen stress /
- miRNAs /
- target genes /
- differential expression
-
林分状态是指林分在自然条件下的状况,表征林分的自然属性[1]。林分状态的优劣决定森林生态系统的稳定性,关系到森林经营的必要性和紧迫性。林分状态各指标直接影响林分状态优劣的评估与判断,对各指标的恰当表达与指标值的准确计算是正确评估林分状态的关键。林分状态由林分结构和林分活力组成,林分长势指林分生长优劣的态势,是林分活力的直接体现[1]。林分长势可用林分疏密度和林分空间优势度表达[2]。在此涉及到两个重要概念——林分断面积和最大断面积。林分断面积是林内所有林木胸高断面积之和,林分平均断面积为林分断面积与林木株数之比,反映林分整体的大小优势程度,也是表达林分密度的指标之一[3];最大断面积反映该林分的潜在生产力,其值越大林分越有优势[2]。林分疏密度是林分断面积与标准林分断面积之比。求算疏密度的关键在于标准断面积的求算。标准林分被定义为“最完善和最大地利用了所占空间的林分”[4],只进行了定性的描述,没有量化的指标,实际应用中存在难以把握和判别何为标准林分的问题。对于人工纯林,尽管部分树种有编制的标准表可供参照,但标准表的编制工作需在大量踏查的基础上筛选出标准林分,再进行标准表编制,编制过程耗费大量人力物力,因此大多数地区只针对主要栽植树种进行标准表的编制,不能涵盖所有树种。天然林多为混交林,树种组成复杂,对此杜纪山和李悦黎[5]提出了分树种计算混交林标准断面积的方法,但鉴于部分树种无标准表,此方法在应用方面仍存在一定困难。为此,惠刚盈等[1]提出潜在疏密度的概念,以替代疏密度。潜在疏密度用林分断面积与潜在最大断面积之比表示,同样地,求潜在疏密度的关键在于求潜在最大断面积。林分中的最大林木个体反映了该林分在此立地条件该年龄阶段林木个体的潜在大小。因此,林分中所有林木株数与最大个体的断面积的积为林分在此立地条件下此年龄阶段的潜在最大断面积[2]。虽然林分中最大个体在一定程度上能代表该林分内林木个体所能达到的大小,但林分整体在实际生长中不是所有林木个体都能达到最大个体的大小,且在混交林中,不同树种生长速率不同,相同年龄阶段的不同树种,其优势木个体大小也有差异[6]。故以单个树种优势个体大小推算林分潜在最大断面积只能代表一种理想值。在实际生产中,以林分中部分较大个体断面积的均值替代林分中最大林木个体的断面积,其与林木总株数的积表示林分潜在最大断面积更符合林分现实生长状况。因此,惠刚盈等[1]将林分潜在最大断面积定义为林分中50%较大林木个体的平均断面积与林木总株数的乘积,以此计算潜在疏密度[1]。此处50%仅是经验性数值,用于林分之间长势的相对比较无可争议,但在林分状态的评价中,指标值的大小直接影响林分整体状态值的大小,进而影响林分整体状态的评估和林分经营策略的制定,故有必要对林分潜在最大断面积、潜在疏密度的值进一步准确计算。本文以杉木人工林为例,以标准表作为参照,探索林分潜在最大断面积与林分断面积之间的关系,寻求计算林分潜在最大断面积的方法,以求算潜在疏密度来描述林分长势。
1. 研究区概况与研究方法
1.1 研究区概况
研究选择人工林和天然林两种森林类型,分别为江西分宜县大岗山杉木(Cunninghamia lanceolata)人工林,东北蛟河地区红松(Pinus koraiensis)阔叶混交林、西北小陇山栎类针阔混交林和栎类阔叶混交林3种不同类型的天然林。
杉木试验林分经营数表齐全,有杉木密度试验的连续监测数据[7-9]且有已完成编制的林分断面积、蓄积标准表[10]可作为参照。该林分于1981年采用裸根苗营造,共设置了5种不同密度,分别为1 667株/hm2(A)、3 333株/hm2(B)、5 000株/hm2(C)、6 667株/hm2(D)和10 000株/hm2(E)。试验林分位于大岗山(114°30′ ~ 114°45′E,27°30′ ~ 27°50′N),为低山地区,海拔250 m,年平均气温16.8 ℃,年平均降水量1 656 mm,蒸发量1 503 mm,属南亚热带季风气候区。
红松阔叶混交林位于吉林省蛟河林业实验区管理局东大坡经营区内(127°35′ ~ 127°51′E,43°51′ ~ 44°05′N)。地势较为平坦。该区气候属于温带大陆性季风山地气候,夏季温热多雨,冬季寒冷,年平均气温3.5 ℃。年平均降水量700 ~ 800 mm。林分为以红松为主要树种的针阔混交林,阔叶树种主要有色木槭(Acer mono)、白牛槭(Acer mandshuricum)、千金榆(Carpinus cordata)、胡桃楸(Juglans mandshurica)、水曲柳(Fraxinus mandschurica )、椴树(Tilia tuan)等。西北针阔混交林、阔叶混交天然林位于甘肃小陇山(104°22′ ~ 106°43′E,33°30′ ~ 34°49′N),海拔1 446 ~ 1 472 m,年平均气温7 ~ 12 ℃,年平均降水量600 ~ 900 mm,属暖温湿润−中温半湿润大陆性季风气候类型。以针叶为主的混交林为分别以油松(Pinus tabuliformis)、华山松(Pinus armandii)为优势树种的针阔混交林,阔叶树种主要有青麸杨(Rhus potaninii)、锐齿栎(Quercus aliena var. acuteserrata)等;阔叶混交林以锐齿栎、鹅耳枥(Carpinus turczaninowii)、小叶鹅耳枥(Carpinus turczaninowii)、领春木(Euptelea pleiospermum)、三桠乌药(Lindera obtusiloba)、光叶泡花树(Meliosma cuneifolia var. glabriuscula)为主要树种。3种天然林的基本概况见表1。
表 1 天然林林分基本概况Table 1. Basic situation of natural forest样地
Sample plot天然林类型
Natural forest type平均胸径
Average DBH/cm林分密度/(株·hm− 2)
Stand density (tree·ha− 1)坡度
Slope degree/(°)坡向
Slope aspect森林面积
Forest area/m2a 红松阔叶混交林
Pinus koraiensis-broadleaf mixed forest18.11 1 186 17 西北 Northwest 100 × 100 b 22.46 800 9 西北 Northwest 100 × 100 c 21.81 748 11 北 North 100 × 100 d 20.78 824 12 北 North 100 × 100 h 栎类针阔混交林
Conifer-broadleaf forest dominated by Quercus spp.17.03 1 266 21 东 East 30 × 30 i 16.15 1 833 31 南 South 70 × 70 j 栎类阔叶混交林
Broadleaf mixed forest dominated by Quercus spp.13.81 1 478 32 西南 Southwest 70 × 70 k 17.05 1 336 37 东北 Northeast 60 × 60 1.2 研究方法
在一定的立地条件下,林分密度增加到一定程度后总收获量遵循最终产量恒定法则,即林地的生产力是有限的[6,11]。在既定立地条件下,林分在某个年龄阶段所能达到的最大断面积为林分在该年龄段的潜在最大断面积。类比标准断面积的概念,潜在最大断面积是指该林分在当前状态下断面积生长所能达到的最大值。
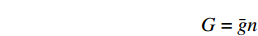
林分断面积:
G=ˉgn 式中:
ˉg 为林木平均断面积,n为林木株数。当林分内林木株数一定时,断面积达到理想值是林木个体平均断面积增大的结果。
以林分内一定比例较大林木个体的平均断面积为林分潜在平均断面积,林分潜在最大断面积为潜在平均断面积与林木总株数的积。
林分潜在最大断面积:
Gmax=ˉgXn 式中:
ˉgX 为一定比例较大个体平均断面积,n为林木株数。以标准表为参照,求使潜在最大断面积与标准断面积差值最小时X的值,以此作为林分潜在最大断面积对应林分较大个体的比例。标准林分是在既定地位指数和一定作业条件下,就某一树种能获得平均最大收获的林分[4,12-13],即林分断面积或蓄积达到最大。标准断面积指标准林分的断面积,潜在最大断面积的意义与标准断面积相似,都表示林分的最大断面积,是对林分生产潜力的一种估计,表示林分断面积在当下的年龄和既定的立地条件下能达到的理想值。其主要区别在于标准断面积以标准林分为参照,潜在最大断面积以各林分自身为参照。疏密度是林分实际断面积与标准林分断面积之比,比值大小反映现实林分与理想状态林分长势之差。潜在疏密度的表达形式与疏密度相似。
疏密度(B):
B=¯G/G 式中:
¯G 为林分断面积,G为林分标准断面积。潜在疏密度(B0):
B0=¯G/Gmax 式中:Gmax为林分的潜在最大断面积[1]。
标准表以回归经验式为依据,采用平移提高法编制[7]。求算潜在最大断面积是以一定比例较大个体平均胸径作为林分潜在的平均胸径,该比例下较大林木的平均断面积与总株数的积作为潜在最大断面积,即在种群数量(一定面积上的林分株数)不变的情况下将其个体大小均值提高。求X的值时,选取密度适当,对林地利用程度高的试验林分。在5种密度的林分中,根据生长状况与株数密度的变化,选取最大株数密度、不同年龄阶段的林分。
以不同的X值计算潜在最大断面积,并与查表获得的标准断面积比较,偏差率最小所对应的X值即为所求。偏差率公式如下:
D=(Gmax−G)/G×100% 式中:D为偏差率,G为标准断面积,Gmax为潜在最大断面积。
计算潜在疏密度与疏密度的偏差率,公式如下:
DB=(B0−B)/B×100% 式中:DB为偏差率。
天然林组分复杂,树种、年龄各不相同,对其标准断面积的求算比较困难。以人工林中潜在最大断面积的求算方法为基础,探究天然林林分断面积与潜在最大断面积之间是否存在线性关系,验证潜在最大断面积在天然林中的适用性。
2. 结果与分析
2.1 潜在最大断面积与标准断面积偏差率的变化
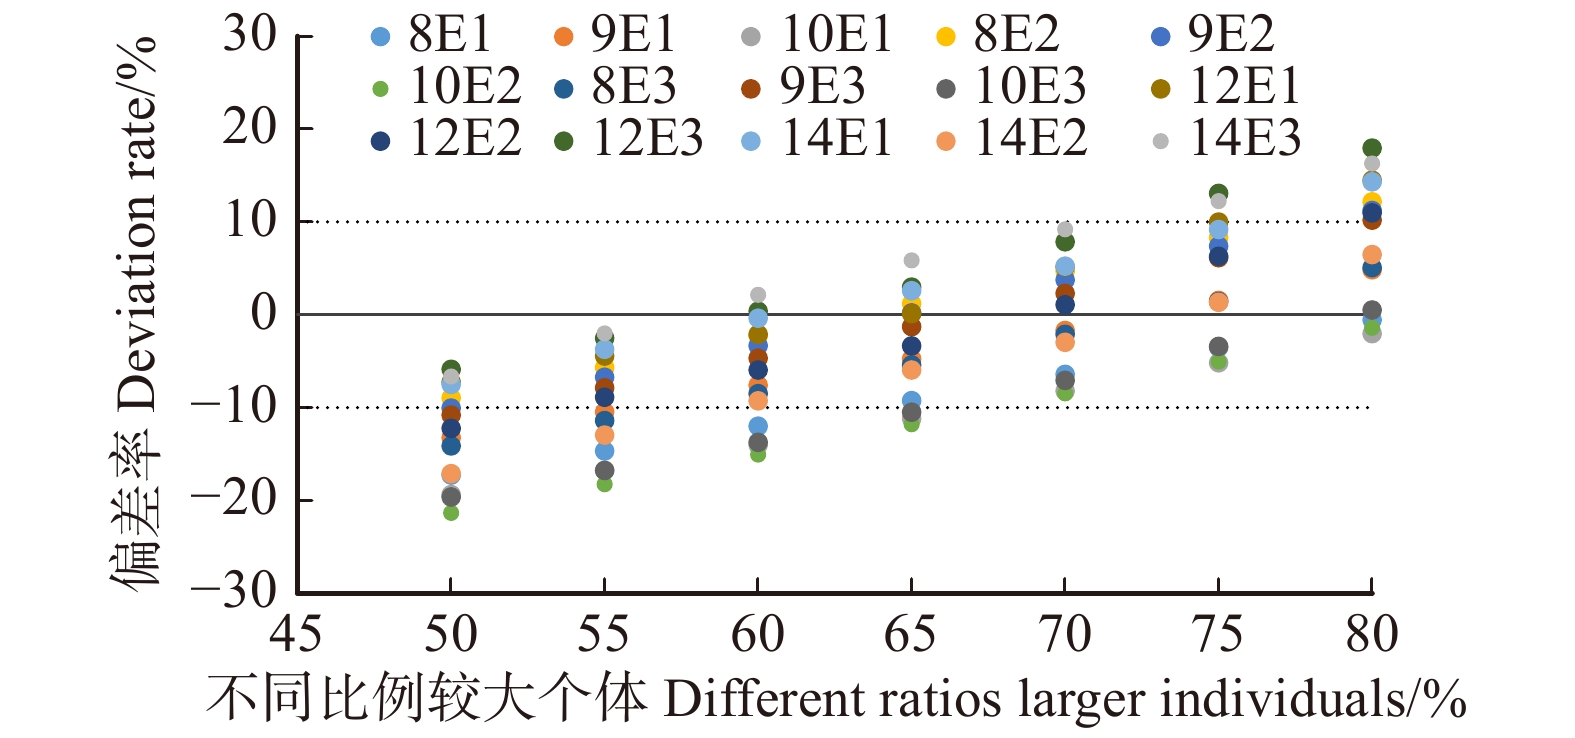
由不同年龄阶段林分15组试验杉木人工林断面积与潜在最大断面积的偏差率随选取较大林木比例变化的情况(图1)可以看出,偏差率的绝对值随X的取值的增大先减小后增大,当较大个体的比例为50%时,偏差率为正,即潜在最大断面积大于标准断面积;随着X的增加,潜在最大断面积与标准断面积的偏差逐渐减小,当较大个体比例约为70%时,整体上全部试验样地的潜在疏密度与疏密度的偏差最小,大部分都在10%以内,以0为中心集聚。当较大个体比例大于70%,偏差率绝对值随着较大个体比例的增加又逐渐增大。说明以较大个体比例为70%所求潜在最大断面积可以替代标准断面积。
![]() 图 1 潜在最大断面积与标准断面积的偏差率E1、E2、E3表示E密度的3次重复,E代表密度为10 000株/hm2;8 ~ 14代表林分年龄。下同。E1, E2, E3 represent three repetitions under “E” density; E indicates the density is 10 000 trees/ha; 8−14 indicate the stand’s age. The same below.Figure 1. Deviation rate between potential maximum basal area and standard basal area
图 1 潜在最大断面积与标准断面积的偏差率E1、E2、E3表示E密度的3次重复,E代表密度为10 000株/hm2;8 ~ 14代表林分年龄。下同。E1, E2, E3 represent three repetitions under “E” density; E indicates the density is 10 000 trees/ha; 8−14 indicate the stand’s age. The same below.Figure 1. Deviation rate between potential maximum basal area and standard basal area2.2 潜在疏密度与疏密度偏差率的变化
由潜在疏密度与疏密度之间的大小变化关系(图2)可以看出,当选取70%较大林木个体时,潜在疏密度与疏密度的偏差率最小,都在10%以内,非常接近。因此,以70%较大个体林木的平均断面积为潜在平均断面积,其与林木总株数之积作为林分潜在最大断面积,所求潜在疏密度与疏密度也最相近。
![]() 图 2 潜在疏密度与疏密度的偏差率Figure 2. Deviation rate between potential density of stocking and density of stocking
图 2 潜在疏密度与疏密度的偏差率Figure 2. Deviation rate between potential density of stocking and density of stocking以70%较大个体断面积之和作为林分潜在最大断面积,计算不同天然林潜在疏密度。结果见表2。
表 2 不同天然林样地潜在疏密度Table 2. Potential density of stocking of different natural forests样地
Sample plot断面积/(m2·hm− 2)
Basal area/(m2·ha− 1)潜在最大断
面积/(m2·hm− 2)
Potential maximum
basal area/(m2·ha− 1)潜在疏密度
Potential density
of stockinga 30.57 43.62 0.70 b 31.68 44.12 0.72 c 27.95 38.81 0.72 d 27.95 38.76 0.72 h 34.79 48.51 0.72 i 30.27 41.84 0.72 j 27.48 36.36 0.76 k 28.66 35.78 0.80 2.3 潜在最大断面积在天然林中的应用
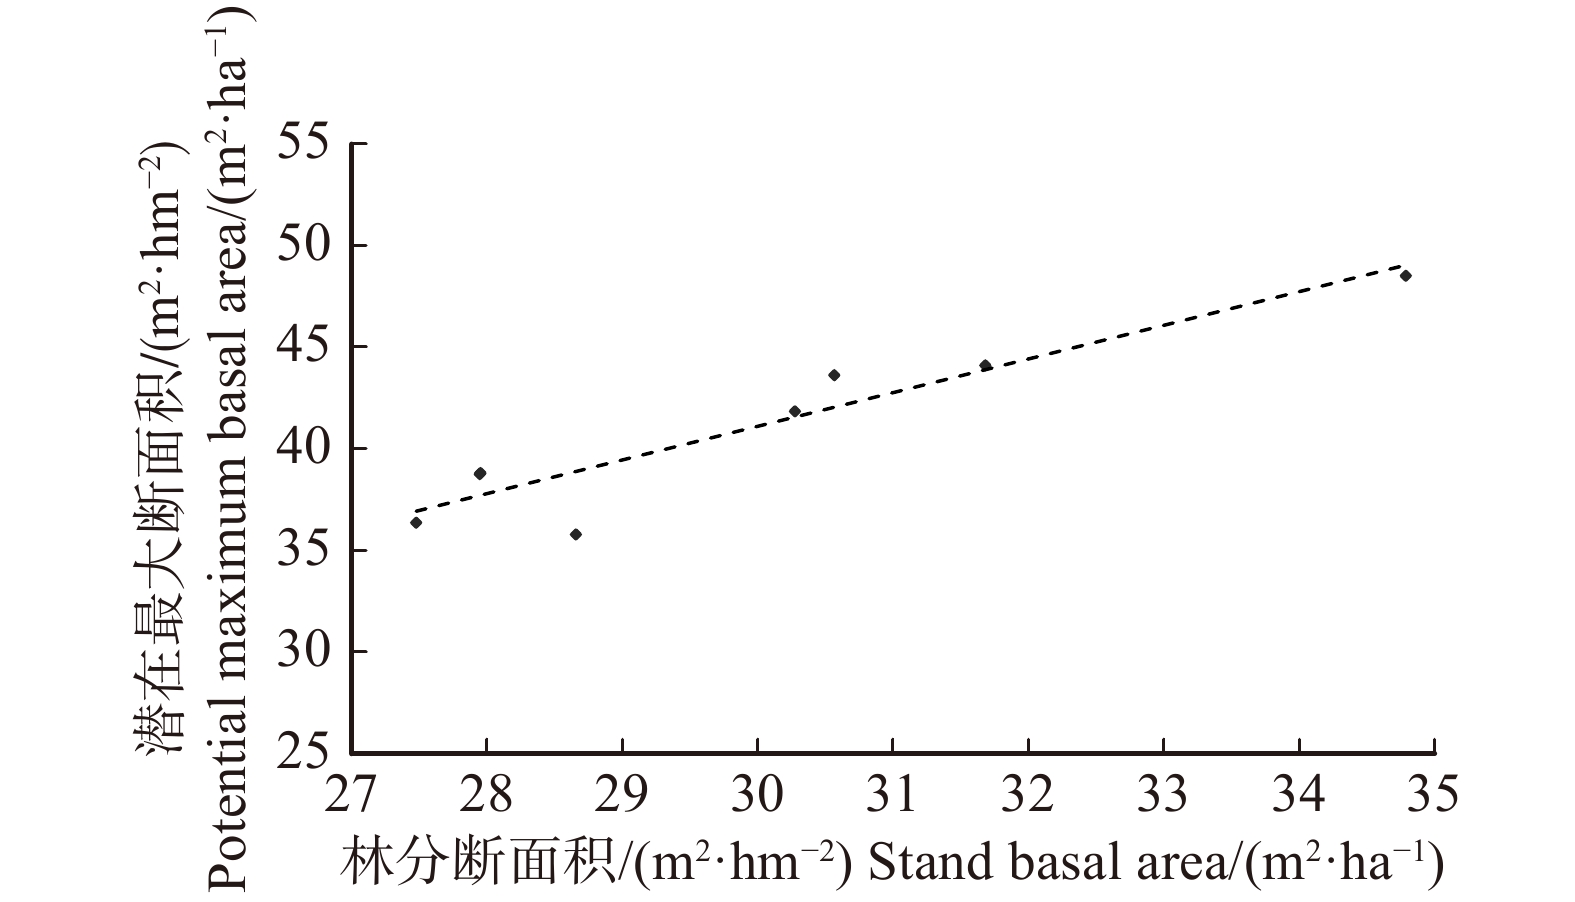
林分的断面积反映林分目前的长势[14],潜在最大断面积表示该林分目前所具有的生产潜力,二者在一定程度上具有一致趋势,即长势表现良好的林分其生产潜力也大。对不同天然林试验林分断面积与潜在最大断面积作回归分析发现二者呈显著线性关系,R2 = 0.89(图3),且将人工林所得70%的值,应用于天然林对应求得的潜在疏密度的范围为0.7 ~ 0.8,属一般林分合理的疏密度区间。故认为所得值70%也适用于天然林。
![]() 图 3 林分断面积与潜在最大断面积的回归分析Figure 3. Regression analysis of stand basal area and potential maximum basal area
图 3 林分断面积与潜在最大断面积的回归分析Figure 3. Regression analysis of stand basal area and potential maximum basal area3. 结论与讨论
3.1 结 论
以林分中部分较大个体平均断面积表示林分潜在平均断面积,其与林木总株数的乘积代表林分生长所能达到的理想断面积符合现实林分生长状况,是一种合理的方法。通过比较较大林木株数比例为50% ~ 80%时,潜在最大断面积与标准断面积、潜在疏密度与疏密度的偏差率大小,当选取的较大个体比例为70%时,整体偏差率值最小,得出潜在最大断面积为70%较大个体平均胸径对应断面积与林分林木总株数之积。在天然林中,70%较大个体对应潜在疏密度与一般林分疏密度取值范围相同,且用于林分长势评价时,其值能够适当反映现实林分生长状态的优劣。因此,该求算潜在疏密度的方法在天然林中也适用。本研究将提出的经验值进一步准确化,用于林分状态评价时其整体取值更加协调、合理。
3.2 讨 论
编制标准表需要投入大量的调查与计算,常以气候区等森林区域为研究单位,其结果亦是针对整个区域的森林进行估计[7],若具体到某个林分小班,由于立地条件等差异导致其精确度降低。使用本文提出的方法求算潜在最大断面积的优越性在于以林分自身为参照,可以避免以标准林分(其他林分)为参照时因立地条件差异所引起的误差;以优势木平均胸径及冠径确定标准断面积的方法,求标准断面积需知优势木胸径与冠径,但冠幅的测量往往误差比较大,准确性差;潜在最大断面积法求算过程只需胸径,胸径调查易操作且测量准确度高,结果可达到较高的准确度。以较少数优势木代表林分[15],用较多的林木能更好地代表整个林分的状况;同时,研究表明优势木平均胸径及冠径确定标准断面积法所求标准断面积对针叶树种所求接近全部生长期生长潜力,对阔叶树种,更贴近现实生长过程表[15],说明其适用于针叶林,对阔叶林和针阔混交林适用性差。分树种分别计算的混交林疏密度的计算方法[5]依赖于知道主要混交种的标准表的情况,对于没有标准表的树种,无法求得疏密度。应用较大个体平均断面积法以林分自身为参照,不分具体树种,只需林木个体胸径,可直接求算潜在最大断面积及疏密度。研究所得采用70%较大林木个体时,求得潜在最大断面积接近标准断面积。根据克拉夫特林木分级法,70%比例正好也是一般林分内优势木、亚优势木、与中等木所占比例之总和。健康、稳定、优质、高效是森林生长的理想状态,这也在一定程度上说明以生长状态优良个体的平均断面积与总林木株数求算潜在最大断面积是一种合理的方法。
-
![]()
图 1 靶基因数量分布图(靶基因数量 ≥ 40)
Figure 1. Distribution map of target gene number(more than 40)
![]()
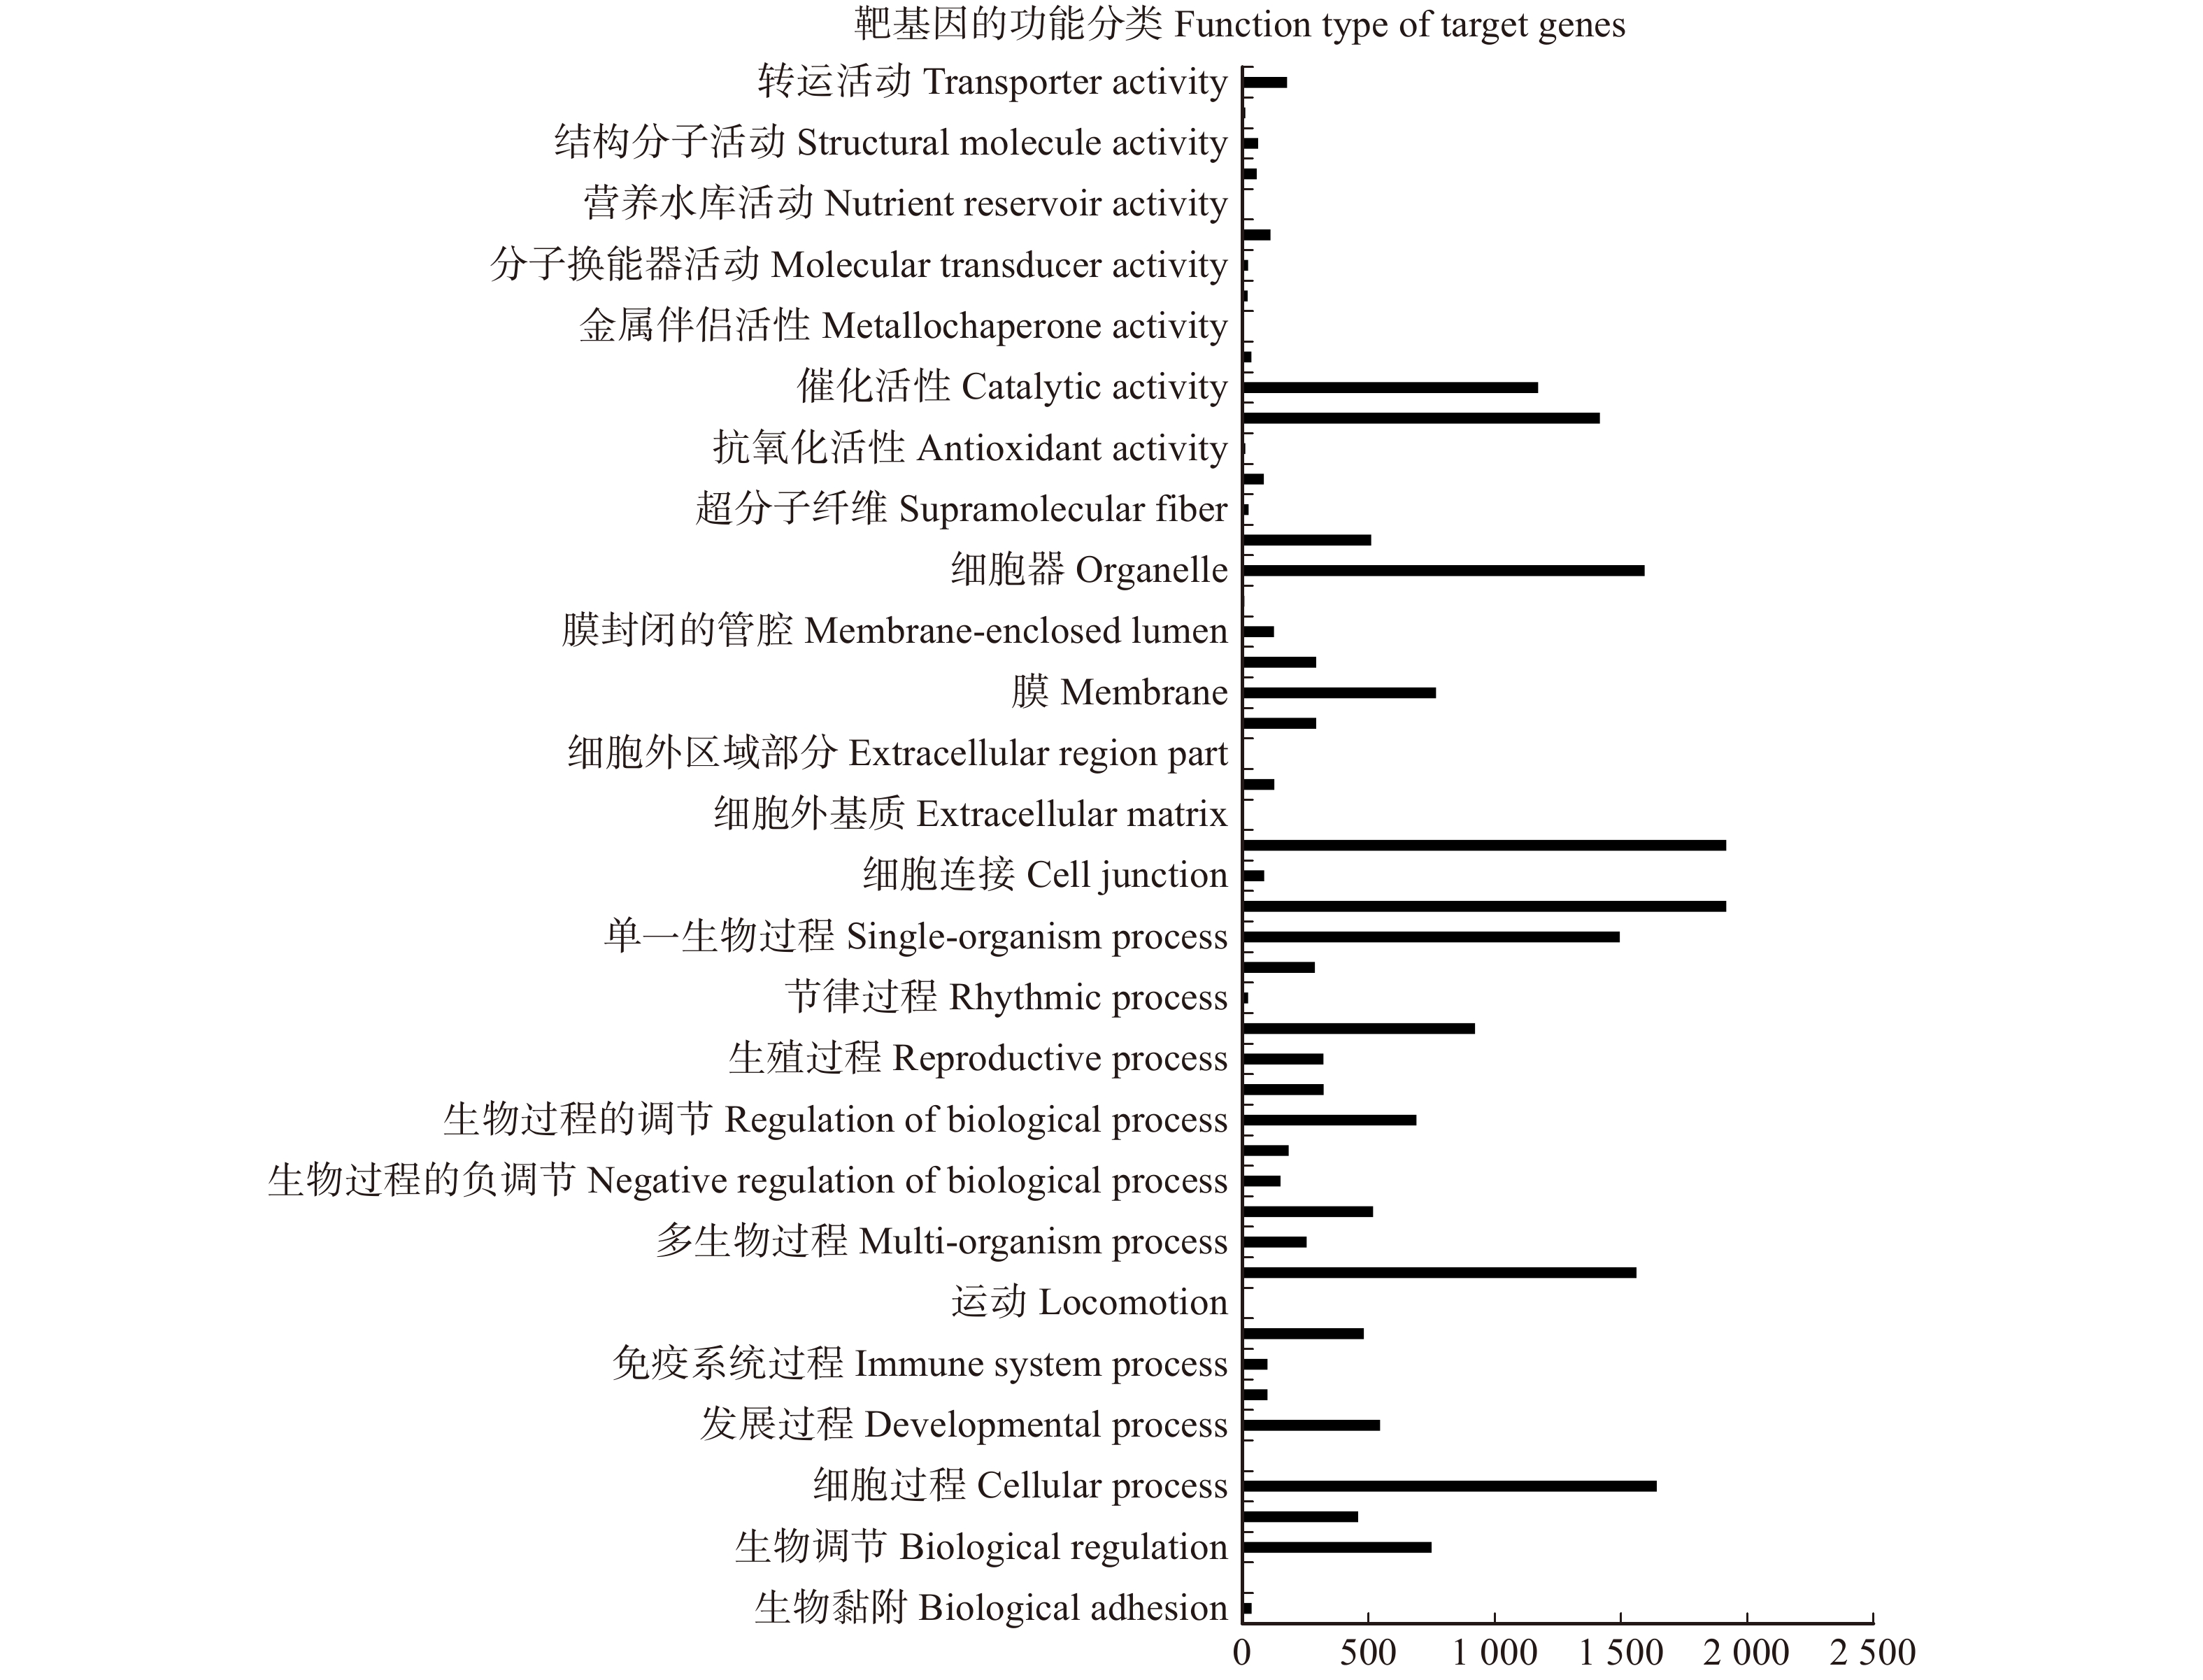
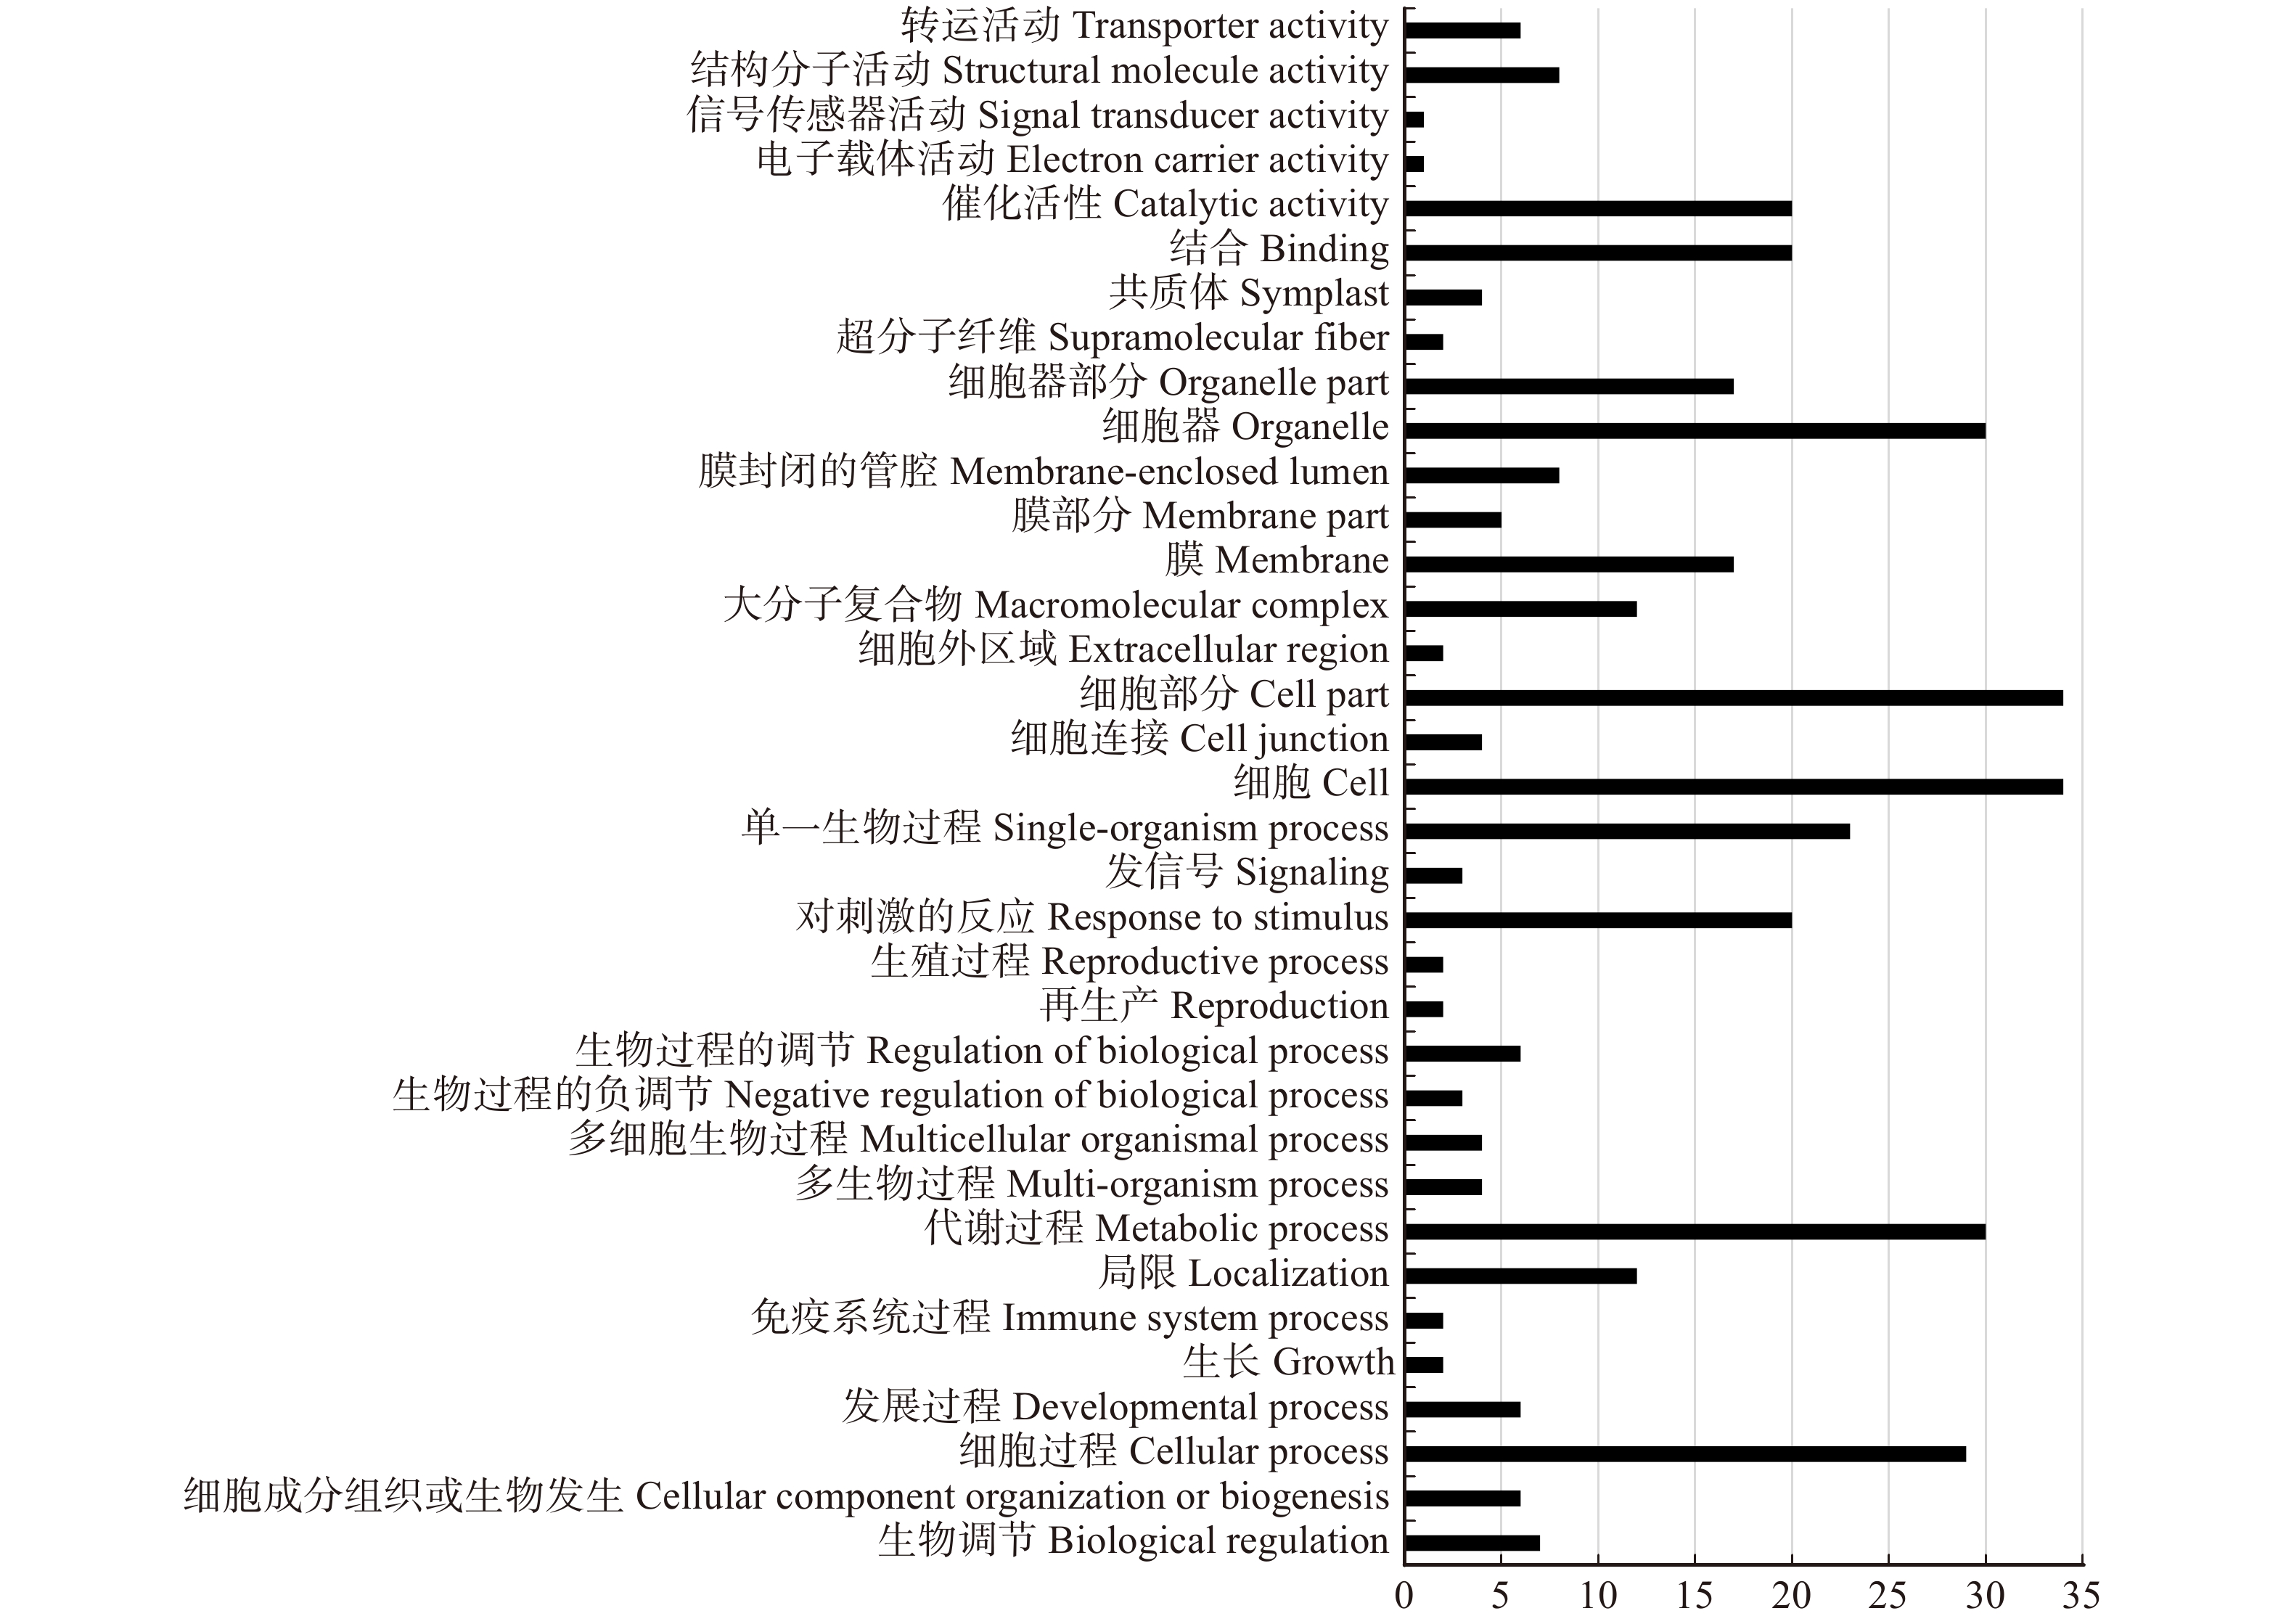
图 3 差异表达靶基因功能分类
Figure 3. Functional classification of the target genes with differential expression
![]()
图 4 miR162、miR396与靶基因互补位点图
Figure 4. The complementary sites of miR162, miR396 and the corresponding target genes
表 1 前10显著富集的KEGG通路
Table 1 Top 10 significantly enriched KEGG pathways
KEGG通路
KEGG pathway差异表达基因数目
Number of differentially expressed genes全部基因数目
Total number of genes植物激素信号转导 Plant hormone signal transduction 85 (5.34%) 1131 (3.87%) 植物−病原体相互作用 Plant-pathogen interaction 83 (5.21%) 1233 (4.22%) RNA转运 RNA transport 57 (3.58%) 849 (2.91%) 剪接 Spliceosome 51 (3.2%) 886 (3.03%) 内质网中的蛋白质加工 Protein processing in endoplasmic reticulum 37 (2.32%) 854 (2.92%) 核糖体 Ribosome 75 (4.71%) 1650 (5.65%) 次生代谢物的生物合成 Biosynthesis of secondary metabolites 158 (9.92%) 3446 (11.79%) 碳代谢 Carbon metabolism 27 (1.69%) 863 (2.95%) 代谢途径 Metabolic pathways 287 (18.02%) 6238 (21.35%) 氨基酸的生物合成 Biosynthesis of amino acids 19 (1.19%) 699 (2.39%)  下载: 导出CSV
表 2 差异表达靶基因相关KEGG通路
Table 2 Differentially expressed target genes associated with the KEGG pathway
通路ID
Pathway IDKEGG通路
KEGG pathway差异表达基因数量
Number of differentially expressed genes差异表达基因
Differentially expressed genesko03022 基础转录因子
Basal transcription factors2 (6.25%) CL570.Contig1_All, CL570.Contig3_All ko04120 泛素介导的蛋白水解
Ubiquitin mediated proteolysis3 (9.38%) CL3618.Contig2_All, CL8020.Contig1_All, CL8020.Contig2_All ko00430 牛磺酸和亚牛磺酸代谢
Taurine and hypotaurine metabolism1 (3.13%) CL1398.Contig4_All ko03040 剪接
Spliceosome3 (9.38%) CL4501.Contig2_All, CL68.Contig2_All, Unigene22460_All ko00563 糖基磷脂酰肌醇 (GPI)-锚生物合成
Glycosylphosphatidylinositol (GPI)-anchor biosynthesis1 (3.13%) CL4201.Contig2_All ko00130 泛醌和其他萜类化合物−醌生物合成
Ubiquinone and other terpenoid-quinone biosynthesis1 (3.13%) Unigene20018_All ko00510 N-聚糖生物合成
N-Glycan biosynthesis1 (3.13%) Unigene3286_All ko04712 昼夜节律−植物
Circadian rhythm-plant1 (3.13%) CL3618.Contig2_All ko03013 RNA转运
RNA transport2 (6.25%) Unigene13760_All, Unigene38123_All ko00630 乙醛酸和二羧酸代谢
Glyoxylate and dicarboxylate metabolism1 (3.13%) CL10733.Contig3_All ko04141 内质网中的蛋白质加工
Protein processing in endoplasmic reticulum2 (6.25%) Unigene3286_All, Unigene34173_All ko00620 丙酮酸代谢
Pyruvate metabolism1 (3.13%) CL10733.Contig3_All ko04075 植物激素信号转导
Plant hormone signal transduction2 (6.25%) CL1120.Contig2_All, CL1130.Contig3_All ko03018 RNA降解
RNA degradation1 (3.13%) Unigene38123_All ko04626 植物−病原体相互作用
Plant-pathogen interaction2 (6.25%) CL4959.Contig2_All, Unigene36128_All ko03015 mRNA监测途径
mRNA surveillance pathway1 (3.13%) Unigene38123_All ko00240 嘧啶代谢
Pyrimidine metabolism1 (3.13%) CL6853.Contig2_All ko00230 嘌呤代谢
Purine metabolism1 (3.13%) CL6853.Contig2_All ko01200 碳代谢
Carbon metabolism1 (3.13%) CL10733.Contig3_All ko01100 代谢途径
Metabolic pathways6 (18.75%) CL10733.Contig3_All, CL1398.Contig4_All, CL4201.Contig2_All, CL6853.Contig2_All, Unigene20018_All, Unigene3286_All ko01110 次生代谢物的生物合成
Biosynthesis of secondary metabolites3 (9.38%) CL10733.Contig3_All, CL6853.Contig2_All, Unigene20018_All ko03010 核糖体
Ribosome1 (3.13%) Unigene24651_All
下载: 导出CSV
表 3 参与代谢途径通路的靶基因
Table 3 Target genes involved in metabolic pathways
基因编号
Gene IDmiRNA
miRNA同源基因
Homologous gene基因名称
Gene name基因功能
Gene functionCL10733.Contig3_All miR7838 ATCG01180.1 RRN23S.2 叶绿体编码的23S核糖体
RNA chloroplast-encoded 23S ribosomal RNACL1398.Contig4_All miR1445 AT5G12200.1 PYD2 编码具有二氢嘧啶酰胺水解酶活性的蛋白质
Encodes a protein with dihydropyrimidine amidohydrolase activityCL6853.Contig2_All miR393a-3p
miR393b-3pAT3G27250.1 AITR1 假设蛋白质
Hypothetical proteinCL4201.Contig2_All miR399a AT1G66430.1 FRK3 含有无菌α基序结构域的蛋白质
Sterile alpha motif domain-containing proteinUnigene20018_All miR156g-j AT5G54320.1 假设蛋白(DUF295)
hypothetical protein (DUF295)Unigene3286_All miR399i AT1G09530.1 PAP3 转录因子与光感受器phyA和phyB相互作用
Transcription factor interacting with photoreceptors phyA and phyB
下载: 导出CSV
表 4 参与植物激素信号传导的靶基因
Table 4 Target genes involved in plant hormone signaling pathways
miRNA miRNA 靶基因编号 Target gene No. 同源基因 Homologous gene 基因功能 Gene function ptc-miR530a CL1120.Contig2_All Potri.006G272400.1 剪接因子 RSZp22(RSZP22)
Splicing factor RSZp22 (RSZP22)ptc-miR396a,b CL1130.Contig3_All Potri.001G215800.1 DNAJ 热休克N-末端结构域蛋白
DNAJ heat shock N-terminal domain-containing protein
下载: 导出CSV
表 5 低氮胁迫下差异表达的杨树miRNA和靶基因
Table 5 Differentially expressed miRNAs and target genes
miRNA miRNA 上调/下调* Up/down regulation 差异倍数 Fold change 靶基因编号 Target gene No. 上调/下调 Up/down regulation miR482c-3p ↓ 0.67 Unigene31509_All ↑ miR482c-5p ↓ 0.67 Unigene30684_All ↑ miR168a-5p ↓ 0.58 Unigene13760_All ↑ miR168b-5p miR162a ↓ 0.65 Unigene18608_All ↑ miR162b miR393a-3p ↑ 2.56 CL6853.Contig2_All ↑ miR393b-3p miR399a ↓ 0.49 CL4201.Contig2_All ↓ miR6445a ↓ 0.54 Unigene37079_All ↓ miR6445b miR396a ↑ 1.7 CL1130.Contig3_All ↓ miR396b miR6445a ↓ 0.54 CL8486.Contig3_All ↓ miR6445b miR6427-3p ↓ 0.54 CL4139.Contig1_All ↓ miR6427-3p ↓ 0.54 Unigene24651_All ↓ 注:* miRNA在毛白杨受低氮胁迫后的差异表达结果参考本实验室前期研究结果[37]。Note: * means miRNA differentially expressed results of Populus tomentosa under low nitrogen stress referring to the research results of our laboratory in the early stage[37].
下载: 导出CSV
表 6 miRNA和靶基因变化趋势呈负相关的预测结果
Table 6 Prediction of negative correlation between miRNA and target gene change trends
miRNA
miRNA靶基因编号
Target gene No.同源基因(拟南芥)
Homologous gene (Arabidopsis thaliana)功能
FunctionmiR482c-3p Unigene31509_All AT5G56670.1 核糖体蛋白S30家族蛋白
Ribosomal protein S30 family proteinmiR482c-5p Unigene30684_All AT3G52105.1 miR168a-5p,b-5p Unigene13760_All miR162a,b Unigene18608_All AT1G70610.1 (TAP1) 与抗原加工蛋白相关的转运蛋白1
Transporter associated with antigen processing protein 1miR396a,b CL1130.Contig3_All AT5G22080.1 伴随DnaJ结构域超家族蛋白
Chaperone DnaJ-domain superfamily protein
下载: 导出CSV
-
[1] Bartel D P. MicroRNAs: Genomics, biogenesis, mechanism, and function[J]. Cell, 2004, 116(2): 281−297. doi: 10.1016/S0092-8674(04)00045-5
[2] Barozai M Y K, Ye Z, Sangireddy S R, et al. Bioinformatics profiling and expressional studies of microRNAs in root, stem and leaf of the bioenergy plant switchgrass (Panicum virgatum L.) under drought stress[J]. Agri Gene, 2018, 8: 1−8. doi: 10.1016/j.aggene.2018.02.001
[3] Meng Y, Chen M D, Ping W, et al. MicroRNA-mediated signaling involved in plant root development[J]. Biochemical & Biophysical Research Communications, 2010, 393(3): 345−349.
[4] Islam W, Qasim M, Noman A, et al. Plant microRNAs: front line players against invading pathogens[J]. Microbial Pathogenesis, 2018, 7(118): 9−17.
[5] Stark A, Brennecke J, Russell R B, et al. Identification of drosophila microRNA targets[J]. PLoS Biology, 2003, 1(3): E60. doi: 10.1371/journal.pbio.0000060
[6] Rajewsky N, Socci N D. Computational identification of microRNA targets[J]. Developmental Biology, 2004, 267(2): 529−535. doi: 10.1016/j.ydbio.2003.12.003
[7] Enright A J, John B, Gaul U, et al. MicroRNA targets in Drosophila[J]. Genome Biology, 2003, 5: R1. doi: 10.1186/gb-2003-5-1-r1
[8] Lewis B P, Shih I H, Jonesrhoades M W, et al. Prediction of mammalian microRNA targets[J]. Cell, 2003, 115(7): 787−798. doi: 10.1016/S0092-8674(03)01018-3
[9] Kiriakidou M, Nelson PT, Kouranov A, et al. A combined computational-experimental approach predicts human microRNA targets[J]. Genes & Development, 2004, 18(10): 1165−1178.
[10] Rehmsmeier M, Steffen P, Hochsmann M, et al. Fast and effective prediction of microRNA/target duplexes[J]. RNA, 2004, 10(10): 1507−1517. doi: 10.1261/rna.5248604
[11] Dsouza M, Larsen N, Overbeek R. Searching for patterns in genomic data[J]. Trends Genet, 1997, 13(12): 497−498.
[12] Fahlgren N, Howell M D, Kasschau K D, et al. High-throughput sequencing of Arabidopsis microRNAs: evidence for frequent birth and death of MIRNA genes[J]. PLoS One, 2007, 2(2): e219. doi: 10.1371/journal.pone.0000219
[13] Dai X, Zhuang Z, Zhao P X. psRNATarget: a plant small RNA target analysis server (2017 release)[J/OL]. Nucleic Acids Research, 2018, 46(W1): W49−54 [2018−12−12]. https://www.ncbi.nlm.nih.gov/pubmed/29718424.
[14] Xie F L, Huang S Q, Guo K, et al. Computational identification of novel microRNAs and targets in Brassica napus[J]. FEBS Letters, 2007, 581(7): 1464−1474. doi: 10.1016/j.febslet.2007.02.074
[15] 印莉萍, 黄勤妮, 吴平. 植物营养分子生物学及信号转导[M]. 北京: 科学出版社, 2006. Yin L P, Huang Q N, Wu P. Molecular biology of plant nutrition and signal transduction[M]. Beijing: Science Press, 2006..
[16] 胡霭堂, 陆景陵. 植物营养学[M]. 2版. 北京: 中国农业大学出版社, 2003. Hu A T, Lu J L. Plant nutrition[M]. 2nd ed. Beijing: China Agricultural University Press, 2003.
[17] Yinbo G, Sophie F, Azizur R, et al. Nutritional regulation of ANR1 and other root-expressed MADS-box genes in Arabidopsis thaliana[J]. Planta, 2005, 222(4): 730−742. doi: 10.1007/s00425-005-0020-3
[18] Zhang H, Forde B G. An Arabidopsis MADS box gene that controls nutrient-induced changes in root architecture[J]. Science, 1998, 279: 407−409. doi: 10.1126/science.279.5349.407
[19] Forde B G, Walch-Liu P I A. Nitrate and glutamate as environmental cues for behavioural responses in plant roots[J]. Plant Cell and Environment, 2009, 32(6): 682−693. doi: 10.1111/pce.2009.32.issue-6
[20] Zhang H, Jennings A, Barlow P W, et al. Dual pathways for regulation of root branching by nitrate[J]. Proceedings of the National Academy of Sciences of the United States of America, 1999, 96(11): 6529−6534. doi: 10.1073/pnas.96.11.6529
[21] Filleur S, Walchliu P, Gan Y, et al. Nitrate and glutamate sensing by plant roots[J]. Biochemical Society Transactions, 2005, 33(1): 283−286. doi: 10.1042/BST0330283
[22] 潘丽峰. 提高Dof1表达水平改善烟草氮素利用率的研究[D]. 昆明: 昆明理工大学, 2007. Pan L F. Study on improving Dof1 expression to improve the nitrogen use efficiency of tobacco[D]. Kunming: Kunming University of Science and Technology, 2007
[23] Oliveira I C. Overexpression of cytosolic glutamine synthetase: relation to nitrogen, light, and photorespiration[J]. Plant Physiology, 2002, 129(3): 1170−1180. doi: 10.1104/pp.020013
[24] 张雪. 拟南芥AtDOF1基因的克隆及其转基因玉米的功能验证[D]. 长春: 吉林农业大学, 2016. Zhang X. Cloning of AtDOF1 gene from Arabidopsis thaliana and functional verification of transgenic maize[D]. Changchun: Jilin Agricultural University, 2016
[25] Vidal E A, Estelle M. Nitrate-responsive miR393/AFB3 regulatory module controls root system architecture in Arabidopsis thaliana[J]. Proceedings of the National Academy of Sciences of the United States of America, 2010, 107(9): 4477−4482. doi: 10.1073/pnas.0909571107
[26] 余超. 水稻对白叶枯病菌侵染和低氮胁迫反应的共调控因子鉴定[D]. 北京: 中国农业科学院, 2014. Yu C. Identification of co-regulatory factors in rice response to bacterial blight pathogen infestation and low nitrogen stress[D]. Beijing: Chinese Academy of Agricultural Sciences, 2014.
[27] Gifford M L, Dean A, Gutierrez R A, et al. Cell-specific nitrogen responses mediate developmental plasticity[J]. Proceedings of the National Academy of Sciences of the United States of America, 2008, 105(2): 803−808. doi: 10.1073/pnas.0709559105
[28] Mallory A C, Bartel D P, Bartel B. MicroRNA-directed regulation of Arabidopsis AUXIN RESPONSE FACTOR17 is essential for proper development and modulates expression of early auxin response gene[J]. Plant Cell, 2005, 17(5): 1360−1375. doi: 10.1105/tpc.105.031716
[29] Sinha S K, Srinivasan R, Mandal P K. MicroRNA-based approach to improve nitrogen use efficiency in crop plants[J/OL]. Nutrient Use Efficiency: From Basics to Advances, 2015: 221−235 [2018−12−10]. https://doi.org/10.1007/978-81-322-2169-2_15.
[30] Fischer J J, Beatty P H, Good A G, et al. Manipulation of microRNA expression to improve nitrogen use efficiency[J]. Plant Science, 2013, 210(9): 70−81.
[31] Kinoshita N, Wang H, Kasahara H, et al. IAA-Ala Resistant3, an evolutionarily conserved target of miR167, mediates arabidopsis root architecture changes during high osmotic stress[J]. Plant Cell, 2012, 24(9): 3590−3602. doi: 10.1105/tpc.112.097006
[32] Pant B D, Musialaklange M, Nuc P, et al. Identification of nutrient-responsive Arabidopsis and rapeseed MicroRNAs by comprehensive real-time polymerase chain reaction profiling and small RNA sequencing[J]. Plant Physiology, 2009, 150(3): 1541−1555. doi: 10.1104/pp.109.139139
[33] Combier J P, Frugier F, de Billy F, et al. MtHAP2-1 is a key transcriptional regulator of symbiotic nodule development regulated by microRNA169 in Medicago truncatula[J]. Genes Development, 2006, 20(22): 3084−3088. doi: 10.1101/gad.402806
[34] Dai X, Zhao P X. psRNATarget: a plant small RNA target analysis server[J/OL]. Nucleic Acids Research, 2011 [2018−12−06]. https://academic.oup.com/nar/article/46/W1/W49/4990032.
[35] Hou J, Wu Q, Zuo T, et al. Genome-wide transcriptomic profiles reveal multiple regulatory responses of poplar to Lonsdalea quercina infection[J]. Trees-Structure and Function, 2016, 30(4): 1389−1402. doi: 10.1007/s00468-016-1376-7
[36] Ren Y, Sun F, Hou J, et al. Differential profiling analysis of miRNAs reveals a regulatory role in low N stress response of Populus[J]. Functional & Integrative Genomics, 2015, 15(1): 1−13.
[37] 翟俊森, 奕雨时, 崔娟娟. miRNA396基因家族的进化及功能分析[J]. 植物研究, 2013, 33(4):421−428. doi: 10.7525/j.issn.1673-5102.2013.04.007 Zhai J S, Yi Y S, Cui J J. Evolution and functional analysis of the miRNA396 gene family[J]. Plant Research, 2013, 33(4): 421−428. doi: 10.7525/j.issn.1673-5102.2013.04.007
[38] Pilot G, Lacombe B, Gaymard F, et al. Guard cell inward K+ channel activity in Arabidopsis involves expression of the twin channel subunits KAT1 and KAT2[J]. Journal of Biological Chemistry, 2001, 276(5): 3215−3221. doi: 10.1074/jbc.M007303200
[39] Treutter D. Significance of flavonoids in plant resistance: a review[J]. Environmental Chemistry Letters, 2006, 4(3): 147−157. doi: 10.1007/s10311-006-0068-8
[40] Stewart A J, Chapman W, Jenkins G I, et al. The effect of nitrogen and phosphorus deficiency on flavonol accumulation in plant tissue[J]. Plant Cell & Environment, 2010, 24(11): 1189−1197.
[41] Leser C, Treutter D. Effects of nitrogen supply on growth, contents of phenolic compounds and pathogen registance of apple trees[J]. Physiologia Plantarum, 2005, 123: 49−56. doi: 10.1111/ppl.2005.123.issue-1
[42] Strissel T, Halbwirth H, Hoyer U, et al. Growth-promoting nitrogen nutrition affects flavonoid biosynthesis in young apple (Malus domestica Borkh) leaves[J]. Plant Biology, 2005, 7(6): 677−685. doi: 10.1055/s-2005-872989
[43] 陈慧勇, 珍芳. BF、DRB、DQB、TAP1和IFN-γ基因作为猪抗病育种分子标记的可行性初步分析[J]. 生物技术通报, 2009(1):103−106. Chen H Y, Zhen F. Preliminary feasibility analysis of BF, DRB, DQB, TAP1, and IFN-γ genes as molecular markers for pig disease resistance breeding[J]. Biotechnology Bulletin, 2009(1): 103−106.
[44] 杨剑飞, 王宇, 杨琳, 等. 光敏色素互作因子PIFs是整合多种信号调控植物生长发育的核心元件[J]. 植物生理学报, 2014(8):1109−1118. Yang J F, Wang Y, Yang L, et al. Phytochrome interaction factors PIFs are the core elements that integrate various signals to regulate plant growth and development[J]. Journal of Plant Physiology, 2014(8): 1109−1118.
[45] Lau O S, Deng X W. Plant hormone signaling lightens up: integrators of light and hormones[J]. Current Opinion in Plant Biology, 2010, 13(5): 571−577. doi: 10.1016/j.pbi.2010.07.001
-
期刊类型引用(2)
1. 魏红洋,张一帆,董灵波,刘兆刚,陈莹. 帽儿山主要林分类型空间结构状态综合评价. 中南林业科技大学学报. 2021(10): 131-139 .  百度学术
百度学术
2. 刘文桢,袁一超,张连金,赵中华. 基于林分内部状态与邻域环境的油松林稳定性评价. 林业科学. 2021(09): 76-86 . 百度学术
其他类型引用(3)


计量
- 文章访问数: 2835
- HTML全文浏览量: 1768
- PDF下载量: 86
- 被引次数: 5
