
Effects of stand age and climate change on the volume of Pinus massoniana forests in the Three Gorges Reservoir Area of central China
-
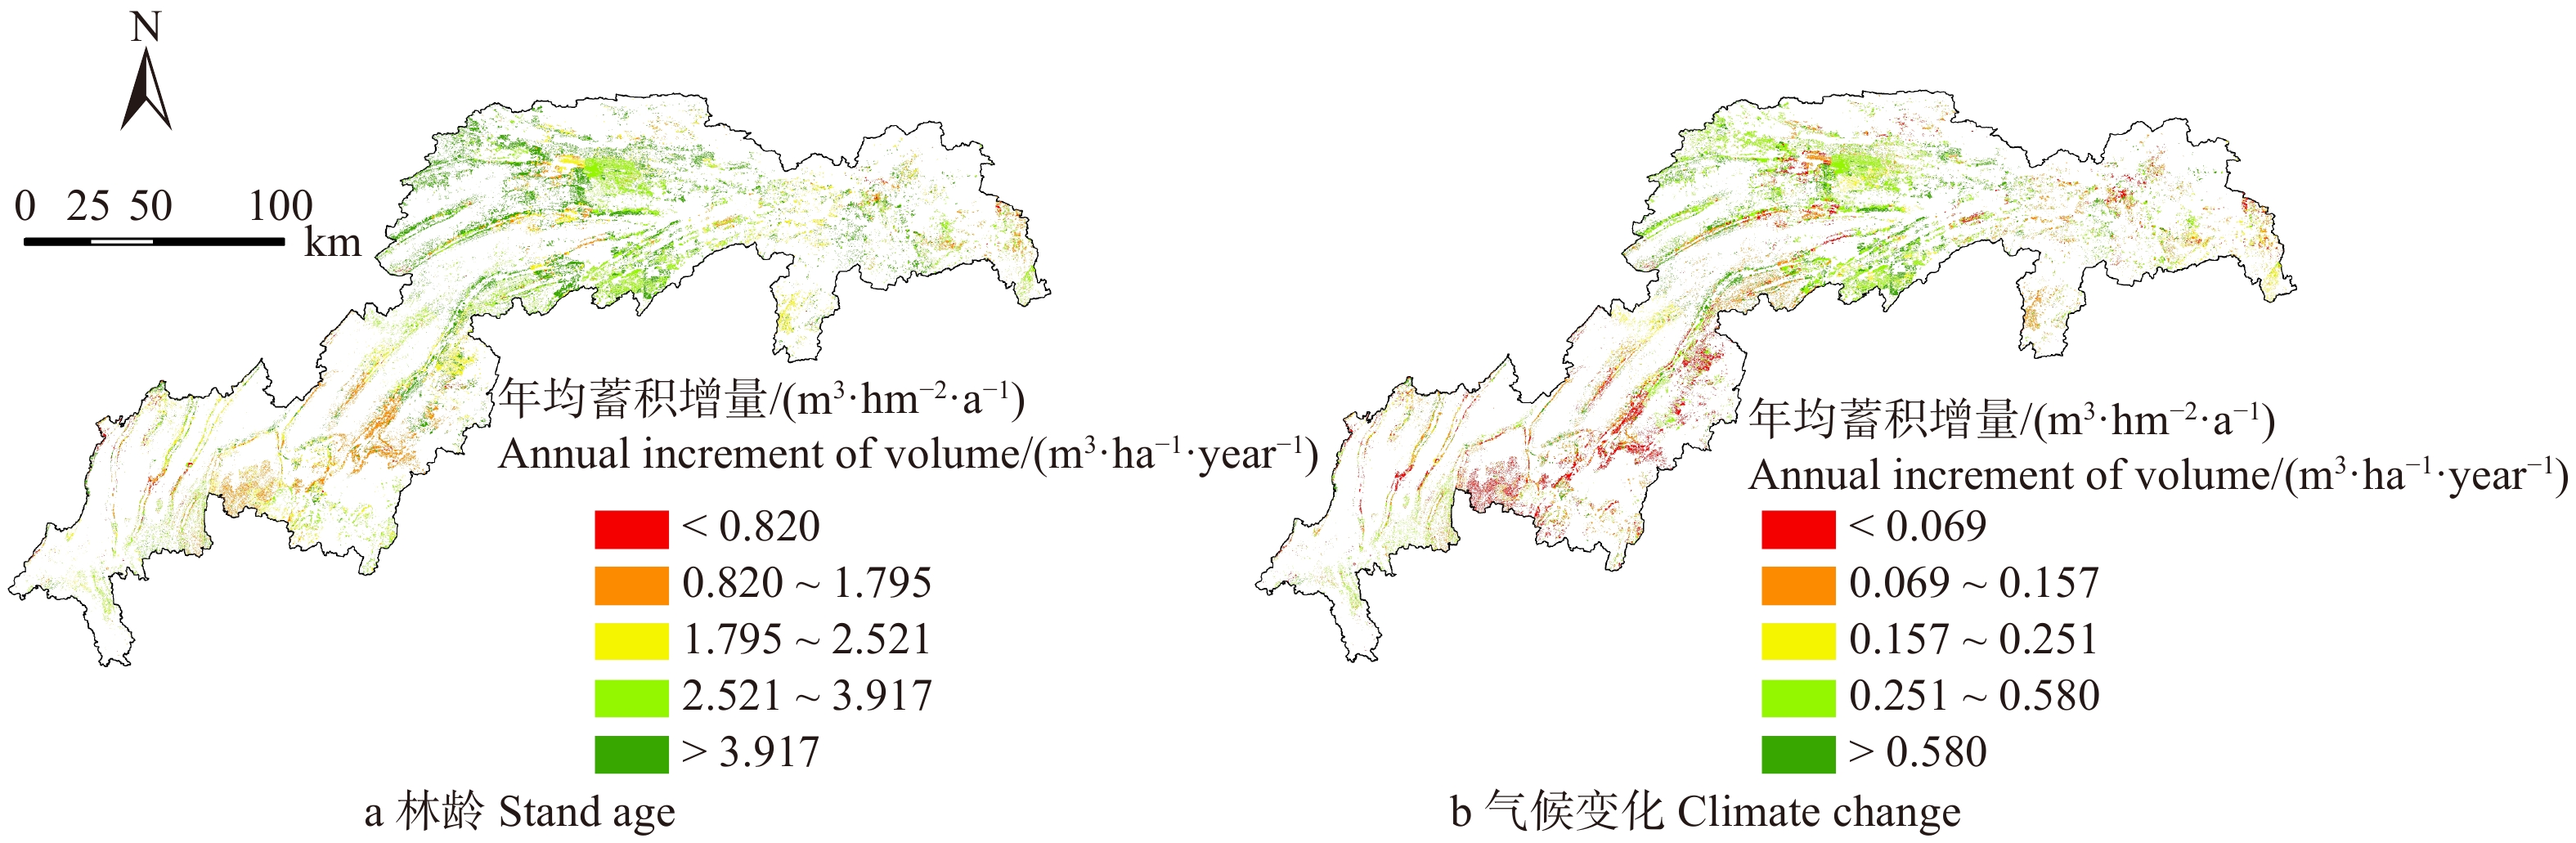
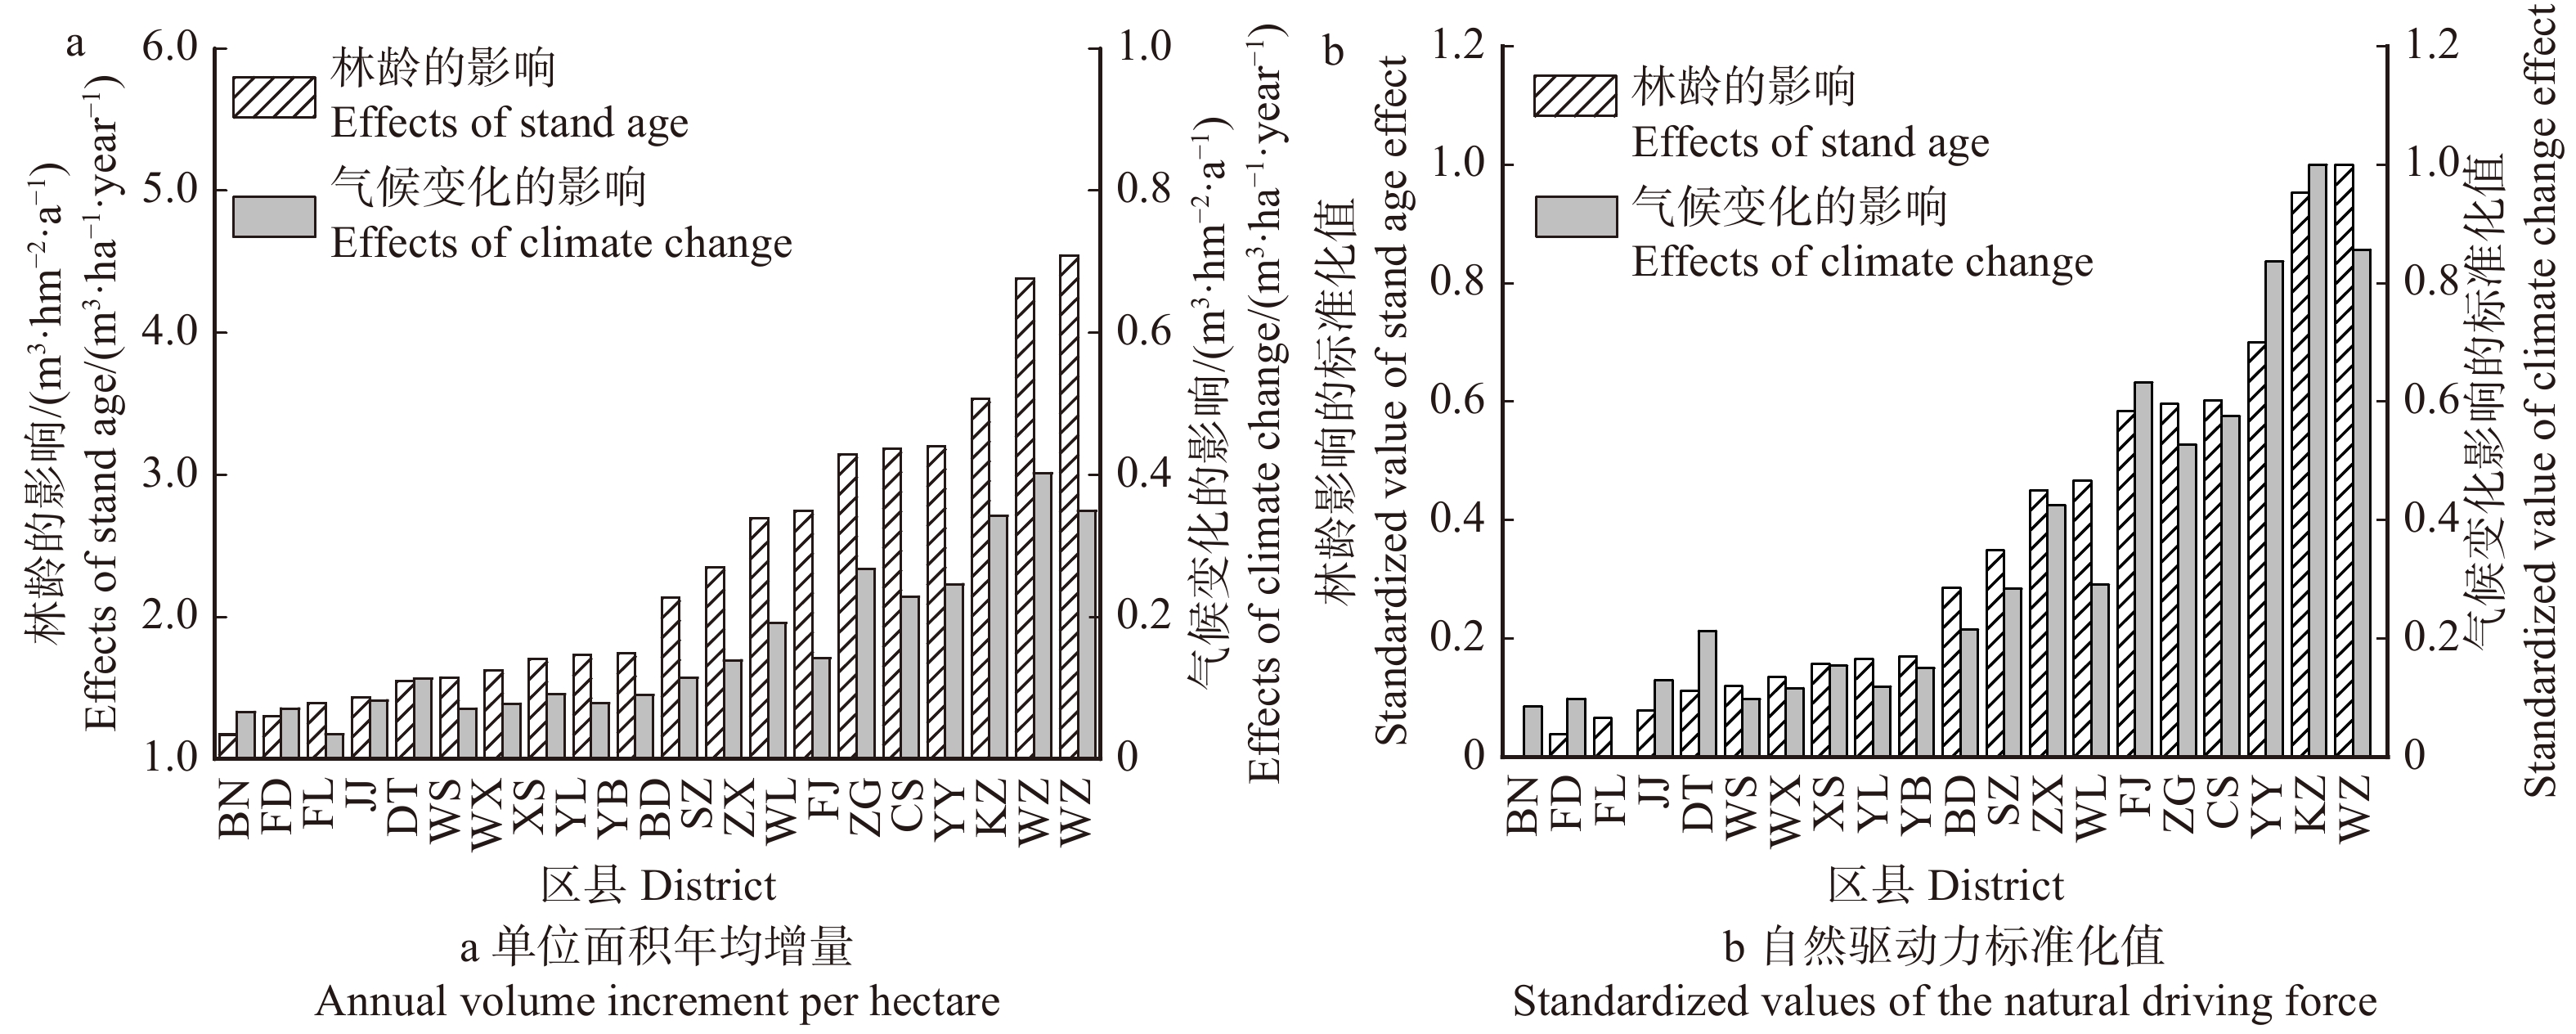
摘要:目的林龄增长和气候变化是影响森林蓄积量变化的关键因素,研究这两种因素对区域尺度森林蓄积的影响具有重要意义。方法本文基于生态过程模型(3-PG)、森林资源规划设计调查数据及3种未来气候情景(BS、RCP4.5和RCP8.5),量化了林龄和气候变化对三峡库区马尾松林蓄积的影响。结果2009—2050年林龄促使三峡库区马尾松林蓄积年均增长2.60 × 10⁶ m3/a或2.60 m3/(hm2·a);而气候变化对蓄积生长的促进作用较小,年均增量为1.70 × 105 ~ 2.00 × 10⁵ m3/a或0.17 ~ 0.20 m3/(hm2·a),相当于林龄影响的6.55% ~ 7.67%。林龄和气候变化对马尾松林蓄积生长的促进作用在三峡库区中部最强,而在库区南部最弱。林龄促进马尾松林单位面积蓄积年均增长最高和最低的地区分别是万州区和巴南区,对应值为4.54 和1.17 m3/(hm2·a)。气候变化对开州区单位面积蓄积年均增长的促进作用最高,为0.40 m3/(hm2·a),而对涪陵区的促进作用最低,为0.03 m3/(hm2·a)。结论林龄和气候变化均促进马尾松林蓄积生长,其共同作用将使万州区和开州区马尾松林单位面积蓄积年均增量最高,而使巴南区蓄积年均增量最低。未来需重点关注巴南区马尾松林生长,通过加强抚育管理、调整林龄结构以维持区域森林资源增长。Abstract:ObjectiveBoth stand age and climate change are crucial factors influencing forest volume dynamics, and it is important to investigate their effects on forest volume on a regional scale.MethodBased on an ecological process model (3-PG), data from a forest resource planning and design survey and three future climate scenarios (BS, RCP4.5, and RCP8.5), this study quantified the effects of stand age and climate change on the volume growth of Pinus massoniana forests in the Three Gorges Reservoir Area (TGRA) of central China.ResultStand age was predicted to increase the annual average volume of the Pinus massoniana forests by 2.60 × 10⁶ m3/year or 2.60 m3/(ha·year) in the TGRA during 2009 to 2050. While the effect of climate change was less pronounced than that of stand age, an annual volume increment of 1.70 × 10⁵−2.00 × 10⁵ m3/year or 0.17−0.20 m3/(ha·year) only accounted for 6.55%−7.67% of the effect of stand age. The effects of both stand age and climate change on volume growth in Pinus massoniana forests were predicted to be the strongest in the central part and the weakest in the southern part of the TGRA. The Wanzhou District was predicted to present the highest annual average increment of volume per hectare (4.54 m3/(ha·year)) owing to stand age; while Banan District, the lowest value (1.17 m3/(ha·year)). The promoting effects of climate change on volume growth were predicted to be the highest in Kaizhou District (0.40 m3/(ha·year)); the lowest in Fuling District (0.03 m3/(ha·year)).ConclusionBoth stand age and climate change are predicted to enhance the volume growth of the Pinus massoniana forests, and their combined effects would most increase the annual average volume increment per hectare in Wanzhou and Kaizhou Districts and least in Banan District. Studies are required to focus on the growth of Pinus massoniana forests in Banan District in the future through strengthening of forest management and adjustment of the forest age structure to maintain the development of regional forest resources.
-
Keywords:
- stand age /
- Pinus massoniana forests /
- natural driving force /
- climate change
-
我国野生动物种类繁多,分布广泛,其中国家一级保护动物约97种,二级保护动物约320种,野生动物资源已经成为我国重要的战略资源。对野生动物进行监测是野生动物保护管理工作的重要组成,利用红外自动感应相机、无线遥感等技术[1-3]对野生动物进行图像监测是当前最有效的手段之一。这种方法可以提供野生动物的种群分布、物种多样性等信息,但是存在着人工识别效率低,监测周期长的问题。因此,采用机器学习技术对野生动物图像进行自动检测与识别成为当前的研究热点。
曾陈颖[4]提出了一种基于BP神经网络的大熊猫(Ailuropoda melanoleuca)识别方法。Okafor[5]等提出一种基于深层学习与视觉词汇袋的野生动物识别方法,该方法使用灰度、颜色信息和不同的空间汇集方法来完成训练过程。但是利用红外自动感应相机监测野生动物时,由于相机布设在野外,拍摄时易受到动物本身的行为、周围环境和气候的影响,成像条件较差,导致识别的准确率低,因此学者们开始专注于解决由复杂环境背景导致的低识别率的问题。Villa等[6]在文章中指出:图像包含的复杂背景信息对于识别的效果存在一定的影响,需要依靠准确的分割算法来提高识别准确率。Yu等[7]将动物体从待训练图像中手动提取出来,这使得其对自建数据库的识别准确率提高到82%。近些年,深度学习理论的成熟与大数据的积累,为深度学习的应用提供了实践基础[8]。在此基础上,通过应用深度学习理论构建了多种深度学习网络,并在ImageNet数据集上取得了极高的识别准确率。这些深度网络模型包括AlexNet[9]、VGG Net[10]、GoogleNet[11]、Deep Residual Net[12]和DenseNet[13]等,与此同时,这些网络模型也被用于大熊猫、长颈鹿(Giraffa camelopardalis)等野生动物[14]的图像识别。
就目前而言,深度神经网络已在动物图像的识别上广泛应用,Chen等[15]使用自动图形切割算法分割野生动物区域,再使用深度卷积神经网络对20种野生动物进行识别,得到较好的识别精度。相比其他深度网络,近年兴起的DCNN(深度卷积神经网络)直接由数据本身得到特征和表达关系的自我学习,对图像具有极强的数据特征抽象能力,因此可以适应环境变化下的对象识别。目前,DCNN已在手写字符识别[16]、行为识别[17]以及农作物识别[18-19]等方面获得了较好的效果,但是针对红外相机监测图像的检测与识别的研究仍面临着准确率低的问题。
针对以上问题,本研究提出一种基于目标检测与卷积神经网络(ROI-CNN)的野生动物监测图像的自动识别方法,通过基于回归算法的目标检测方法将野生动物所在区域从红外监测图像中分割出来,建立ROI图像数据库;将原始图像和ROI图像输入双通道卷积神经网络进行基于全局-局部的自动识别,最终实现高准确率的野生动物物种识别。
1. 材料与方法
1.1 野外环境下野生动物监测图像数据库的建立
2010—2016年间,项目组在内蒙古赛罕乌拉国家级自然保护区,利用红外感应触发相机对野生动物进行图像监测,获得了上千张野生动物监测图像,构建了野生动物监测图像数据库。监测图像均为24位RGB真彩色图像,分辨率为2 560 × 1 920。本研究从中选择了5种常见的国家级陆生保护动物[20]为研究对象,包括马鹿(Cervus elaphus)、斑羚(Naemorhedus goral)、狍(Capreolus capreolus)、猞猁(Lynx lynx)和野猪(Sus scrofa)。表 1为图像数据库中5种动物的图像数量。
表 1 野生动物图像样本数据库Table 1. Wildlife image sample database图像数量
Image number马鹿
Red deer斑羚
Goral狍
Roe deer猞猁
Lynx野猪
Boar白天
Day time542 574 498 186 69 黑夜
Night time322 75 267 50 85 总图像
Total images864 649 765 236 154 红外自动感应相机在野外捕捉到的野生动物图像鲜有如图 1a所示的理想状况,监测图像通常会受到环境、动物行为和相机硬件的影响,存在如图 1b所示的遮挡问题,如图 1c、d所示的曝光以及动物颜色与背景难区分等问题,这些问题都会给图像监测中野生动物的检测与识别带来困难。
除此之外,红外自动感应相机也会因其他因素影响导致误触发拍摄大量无效图像,在训练中过大的数据量会导致检测与识别的效率低下。基于以上问题,本研究提出将ROI提取技术加入到野生动物图像的检测与识别中,减少复杂背景对动物识别的影响,同时提高模型训练的效率。
1.2 基于目标检测技术的野生动物区域自动检测分割
针对复杂背景对野生动物图像中动物的检测识别带来的影响,本研究采用一种基于回归算法的目标检测技术对图像中野生动物所在区域进行检测与分割。
回归检测算法网络DarkNet-19由19个卷积层、5个最大值池化层构成,首先将图像尺寸修改为448×448,输入网络进行预测,网络输出为S×S×(B×5+C)的张量,其中S为划分网格数,B为网络预测边框数,C为类别个数。然后将整幅图像划分为S×S个网格(grid cell),每个网格预测B个检测边界框(bounding boxes),以及每个框的置信度(confidence),每个检测边界框包含5个参数(x、y、w、h和confidence)。(x, y)代表检测边界框的中心相对其母网格的位置,(w, h)为检测边界框的宽和高。置信度confidence计算公式如下:
confidence=Pr( Object )×IOU (1) IOU=area(BBdt∩BBgt)area(BBdt∪BBgt) (2) 式中:Pr(Object)为边界框包含目标物体的概率;IOU为检测框与标准框的交并比值;BBgt为基于训练标签的参考标准框;BBdt为检测边界框;area()表示面积。
本文中使用的S=7,即将输入图像首先分为49个网格,每个网格预测2个检测边界框,在算法中每个框包含x、y、w、h、confindence这5个数值,此处仅做野生动物区域回归,不做物种的具体类别预测,因此C取1,最后的输出是7×7×(2×5+1)的张量。采用误差平方和作为损失函数(loss):
loss=λ coord S2∑i=0B∑j=0Iobjij[(xi−ˆxi)2+(yi−ˆyi)2]+λ coord S2∑i=0B∑j=0Iobjij[(√wi−√ˆwi)2+(√hi−√hi)2] (3) 式中:λcoord为定位误差的权重;xi、yi、wi、hi是第i个网格的位置以及宽和高;ˆxi,ˆyi,ˆwi,ˆhi是参考标准框的参数值。Iijobj表示第i个网格中第j个负责预测的预测值(predictor)。
在每一张图像中,会存在很多并不包含物体的网格,这些网格的置信度为0,它们的训练梯度远大于包含物体中心的部分网格,很可能会覆盖掉它们的梯度更新,使得模型不稳定,导致网络的发散。针对这个问题,本研究给定位误差更大的权重,使λcoord=5,同时减小不包含物体中心网格的置信度误差的权重,包含物体中心网格的置信度误差则保持不变。
按照检测得到的野生动物所在区域的坐标(包含左上角坐标[x1, y1]和右下角坐标[x2, y2])对图像(图 2a)进行切割,输出如图 2b的目标区域图像,建立ROI图像库,为下一步的野生动物的自动识别提供数据基础。为了更精确地提取目标物种的特征,本研究需要目标检测算法的准确率达到90%以上才可进行后续的模型训练。
1.3 基于VGG16的训练网络
VGGNet是DCNN的典型代表,其3×3小卷积核的设计思想使得网络的参数更少,且在具有1 000个分类的大规模图像数据集ImageNet[21]的分类和定位上的适用性已得到了充分的验证,因此本研究以此为基础设计针对野生动物监测图像的识别网络。图 3为16个权重层的网络结构。
![]() 图 3 VGG16网络架构注:COV3-64表示卷积核大小为3 × 3,通道数为64的卷积层;COV3-128表示卷积核大小为3 × 3,通道数为128的卷积层;COV3-256表示卷积核大小为3 × 3,通道数为256的卷积层;COV3-512表示卷积核大小为3 × 3,通道数为512的卷积层;MAXPOOL表示采用最大值池化;FC-4096表示通道数为4096的全连接层;FC-1000表示通道数为1000的全连接层;分类层采用softmax函数。Figure 3. VGG16 network architectureNotes: COV3-64 represents a convolution layer with a convolutional kernel of 3×3 and a convolutional layer with 64 channels. COV3-128 represents a convolution layer with a convolutional kernel of 3×3 and a convolutional layer with 128 channels. COV3-256 represents a convolution layer with a convolutional kernel of 3×3 and a convolutional layer with 256 channels. COV3-512 represents a convolution layer with a convolutional kernel of 3×3 and a convolutional layer with 512 channels. MAXPOOL indicates that the maximum pool is used.FC-4096 denotes a fully connected layer with a channel number of 4096. FC-1000 denotes a fully connected layer with a channel number of 1000;the classification layer uses softmax function.
图 3 VGG16网络架构注:COV3-64表示卷积核大小为3 × 3,通道数为64的卷积层;COV3-128表示卷积核大小为3 × 3,通道数为128的卷积层;COV3-256表示卷积核大小为3 × 3,通道数为256的卷积层;COV3-512表示卷积核大小为3 × 3,通道数为512的卷积层;MAXPOOL表示采用最大值池化;FC-4096表示通道数为4096的全连接层;FC-1000表示通道数为1000的全连接层;分类层采用softmax函数。Figure 3. VGG16 network architectureNotes: COV3-64 represents a convolution layer with a convolutional kernel of 3×3 and a convolutional layer with 64 channels. COV3-128 represents a convolution layer with a convolutional kernel of 3×3 and a convolutional layer with 128 channels. COV3-256 represents a convolution layer with a convolutional kernel of 3×3 and a convolutional layer with 256 channels. COV3-512 represents a convolution layer with a convolutional kernel of 3×3 and a convolutional layer with 512 channels. MAXPOOL indicates that the maximum pool is used.FC-4096 denotes a fully connected layer with a channel number of 4096. FC-1000 denotes a fully connected layer with a channel number of 1000;the classification layer uses softmax function.VGGNet的输入为224×224的RGB图像,图像经过网络的处理,输出其属于每个类别的概率。VGGNet架构的核心由卷积层和池化层交替构成。其中前5部分分别由多个卷积核大小为3×3的卷积层构成,第6部分为3个全连接(fully-connected, FC)层。卷积层的主要作用是提取特征[22],即包含一组经数据驱动进行自主学习的卷积核,又称特征提取器。针对不同的特征提取密集度,卷积核用固定大小的卷积步幅与输入做卷积运算,经由激活函数变换后构成卷积特征图,代表对输入图像特征的响应。输出的特征图通常表示为:
aln=f(∑∀m(al−1m×klm,n)+bln) (4) 式中:anl为第l层(当前层)的第n个特征图,aml-1为第(l-1)层(上一层)的第m个特征图,km, nl表示作用于2个特征图之间的卷积核,f(x)为激活函数,bnl代表偏置项。
池化层用于特征映射和降维,本研究中采用最大值池化,对卷积特征图进行下采样后构成池化特征图,通常表示为:
aln=f(rln×1s2∑s×sal−1n+bln) (5) 式中:s是选取的下采样模板,rnl为模板的权值。
经过多层级联后,全连接层对最后一个池化层输出的特征图作矢量变换,构成特征向量输送到分类层。
2. 基于全局-局部的双通道VGG16野生动物自动识别
基于上文提到的技术与方法,提出一种基于ROI-CNN的野生动物监测图像自动识别方法,首先采用基于回归算法的目标检测技术对图像中野生动物所在的区域进行检测,实现自动的分割与裁剪,得到以动物为主体的图像集(ROI图像);提出一种双通道模型,将未经感兴趣区域提取的图像和ROI图像同时导入VGGNet进行训练,基于ImageNet数据库进行微调,最后接入分类器输出最终的识别结果。图 4为算法流程图。
图 5所示为构建的基于VGG16的双通道网络模型,其中包括网络通道G1与网络通道G2。将未经感兴趣区域提取的图像数据库与经感兴趣区域提取后的ROI图像数据库作为训练样本,分别输入G1与G2,以softmax作为分类器,分别输出预测概率矩阵PG1与PG2:
\boldsymbol{P}_{\mathrm{G} 1}=\left[P_{1\_1}, P_{1\_2}, P_{1\_3}, P_{1\_4}, P_{1\_5} \right] (6) \boldsymbol{P}_{\mathrm{G} 2}=\left[P_{2\_1}, P_{2\_2}, P_{2\_3}, P_{2\_4}, P_{2\_5}\right] (7) 式中:Pi_j表示网络输出的预测概率,i∈{1,2},分别对应网络通道G1与G2;j∈{1,2,3,4,5},分别对应5种被预测的物种。PG1与PG2为n=5的行向量,概率矩阵满足各类预测概率之和为1,即满足:
\sum\limits_{j=1}^{5} P_{i j}=1 (8) 最后通过分类概率融合将概率矩阵PG1与PG2相加取平均值,得到最终的识别概率矩阵Q,并输出矩阵中概率最大值所对应的物种作为识别的结果。
Q=\frac{\boldsymbol{P}_{\mathrm{G} 1}+\boldsymbol{P}_{\mathrm{C} 2}}{2} (9) 3. 实验和结果分析
本研究的硬件平台为E5-2620 CPU,两块GTX 1080ti GPU的工作站,软件为Ubuntu16.04操作系统、Python2.7的编程环境、Tensorflow1.3.0的深度学习框架。
3.1 野生动物目标检测器训练
首先采用1.2节介绍的基于回归的目标检测技术训练野生动物目标检测器。从样本库中随机选择每类野生动物图片的80%作为训练样本,使用labelImg作为图像标定软件,对训练集图像中的野生动物区域进行人工标定。以Darknet-19作为特征提取网络,采用随机梯度下降法(SGD)为优化函数,初始学习率为0.001,冲量(momentum)为0.9,训练批次(batch size)为8。训练过程迭代次数为1 200次,图 6为训练准确率的变化图。训练集准确率在训练迭代1 200次后达到97%以上,将数据库中其余20%的样本作为验证集,最终验证集准确率为96.6%。这说明野生动物目标检测器满足90%的准确率要求,可以用来提取监测图像中野生动物所在区域。
3.2 双通道卷积神经网络模型训练
训练VGG16网络模型时,采用随机梯度下降(stochastic gradient descent, SGD)算法进行优化实验,学习率采用步进阶梯调节策略step。网络模型训练参数如表 2所示。
表 2 网络模型训练参数Table 2. Training parameters of the network model参数类型
Parameter type批量数据
Batch data优化算法
Optimization algorithm初始学习率
Initial learning rate迭代次数
Epochs损失函数
Loss function值或方法Value or method 64 随机梯度下降
Stochastic gradient descent0.001 50 交叉熵函数Cross entropy function 为了丰富图像训练集,更好地提取图像特征,提高模型泛化能力,本研究在训练过程中采用仿射变换和裁剪等方式对样本图像进行数据扩充,将原有训练样本数据扩充5倍。将图像数据库中的每类野生动物图像分成训练集、测试集和验证集。其中训练集和测试集分别占每类动物图像总数的70%和30%,随机从图像数据库中产生20%作为验证集。
选定平均识别精度的平均值MAP[23](mean average precision)来评价识别模型的好坏,MAP的计算公式如式(10):
\operatorname{MAP}=\frac{\sum\limits_{q=1}^{5} \operatorname{Ave} P(q)}{5} (10) 式中:q为野生动物物种的编号,P(q)为野生动物监测图像中第q类物种的识别精度,AveP(q)为第q类物种的平均识别精度(average precision,AP),MAP为5种物种的平均识别精度的均值。
3.3 不同CNN网络结构的对比实验
本研究算法中采用的网络结构是VGG16,为了验证不同网络结构对算法识别效果的影响,用VGG19结构代替VGG16进行训练识别,将两种结构下的训练效果进行对比。
图 7所示为两种结构下的模型在训练时损失函数值和准确率随迭代次数的变化,两种模型的训练均在40次迭代之后开始趋于稳定。对5种野生动物的识别效果以及训练的MAP值和验证时最大MAP值的对比如表 3所示。
![]() 图 7 损失函数值(a)和准确率(b)随迭代次数的变化Figure 7. Variations of loss fuction values (a) and accuracy (b)with epoch changing表 3 不同物种的AP值与不同模型的MAP值Table 3. AP value of different species and MAP value of varied models
图 7 损失函数值(a)和准确率(b)随迭代次数的变化Figure 7. Variations of loss fuction values (a) and accuracy (b)with epoch changing表 3 不同物种的AP值与不同模型的MAP值Table 3. AP value of different species and MAP value of varied models算法类别
Algorithm classAP MAP(测试)
MAP(test)最大MAP(验证)
Max. MAP(validation)马鹿
Red deer斑羚
Goral狍
Roe deer猞猁
Lynx野猪
BoarVGG19 0.87 0.82 0.82 0.83 0.81 0.83 0.87 本研究算法Algorithm in this research 0.94 0.91 0.91 0.88 0.92 0.91 0.94 注:AP代表平均识别精度,MAP代表平均识别精度的均值。Notes: AP is average identification precision, and MAP is mean AP. 表 3中,2~6列为不同物种测试集的平均识别精度AP,第7列为测试集5种物种的平均识别精度的均值MAP,第8列为训练过程中,验证集的最大MAP值。综合分析图 7和表 3可得:1)无论采用哪种结构,验证时的最大MAP值和测试时的MAP值相差较小,说明模型没有产生欠拟合或者过拟合的问题;2)训练时,相比于VGG19结构,VGG16结构下的损失函数值下降更快,稳定后的损失函数值更低,训练效率较高;3)两种结构下的测试准确率差值较小,但是VGG16结构下的测试准确率始终高于VGG19;4)针对研究中这5种野生动物,VGG16结构下的模型识别效果均优于VGG19,且最高的准确率差值达到11%;5)验证时,VGG16结构的最大MAP值为0.94,而VGG19结构的最大MAP值仅为0.87。
VGG19网络相较于VGG16虽然具有更深的网络层数,但网络层数越深,网络反向传播的梯度相关性越差,造成梯度弥散现象,所以并非网络层数越深,识别效果越优。综上所述,本研究采用VGG16结构的模型,使得训练效果更优,训练效率更高,能够得到更高的MAP值,更加适合于红外自动感应相机下野生动物监测图像的物种识别。
3.4 算法性能评估实验
R-CNN、Fast R-CNN[24]是DCNN初期应用算法中的主流方法,其思想也影响了目前大量的检测模型网络。R-CNN的核心思想是从输入图像中选出上千个候选框,对每个候选框做卷积运算以及特征提取,再使用分类器判别其类别;而Fast R-CNN则是只对输入图像做一次卷积运算得到特征图,找到每个候选框在特征图上的映射,再提取出特征输入分类器进行判别。这两种算法都是在输入图像上划分出大量的候选框进行处理,本研究算法则是对输入图像进行处理,分割出目标所在的区域,再进行之后的模型训练以及识别分类。为了证明本研究提出算法的有效性,在野生动物监测图像集上,分别利用4种算法对5种野生动物进行物种识别,图 8所示为不同算法准确率的对比,其MAP值的对比如表 4所示。
![]() 图 8 4种模型下的5种野生动物测试准确率Figure 8. Test accuracy of five kinds of wildlife under four models表 4 不同算法的MAPTable 4. MAP of different algorithms
图 8 4种模型下的5种野生动物测试准确率Figure 8. Test accuracy of five kinds of wildlife under four models表 4 不同算法的MAPTable 4. MAP of different algorithms算法类别
Algorithm classVGG16 R-CNN Fast R-CNN 本研究算法
Algorithm in this research最大MAP(验证)
Max.MAP(validation)0.672 0.803 0.895 0.931 MAP(测试)
MAP(test)0.656 0.762 0.856 0.912 综合分析图 8、表 4可得:1)训练时,针对5种野生动物,本研究算法的训练效果相比于VGG16、R-CNN与Fast R-CNN均为最佳,测试时MAP的值也最高;2)与单独的VGG16结构相比,本研究算法对5种野生动物的测试准确率均高出20%以上,验证时的最大MAP值高出0.259,证明对图像进行ROI提取能够降低复杂背景信息对图像识别的影响,得到更好的识别效果;3)对于狍的准确率,本研究算法比R-CNN的准确率高出18%,狍的图像质量较差,动物本身与背景经常难以区分,说明本研究算法比R-CNN更好地减少了背景对图像识别的影响;4)与Fast R-CNN的表现相比,由于马鹿图像质量较好,大多比较清晰、辨识度高,受背景影响较小,本研究算法在马鹿的识别上仅高出2%,相比之下,背景更为复杂的猞猁、野猪、斑羚和狍图像的识别上,本研究算法的准确率就比Fast R-CNN提高了8%、5%、6%、7%,也说明了本研究算法在处理背景复杂的图像上优于Fast R-CNN,能够达到更高的识别准确率;5)验证时,本研究算法的最大MAP值最大,VGG16的最小,与识别效果的比较关系相对应,且对于4种算法,验证时的最大MAP值和测试时的MAP值的差值均较小,再次证明训练没有产生过拟合的问题。
综上所述,与VGG16、R-CNN与Fast R-CNN相比,本研究算法在马鹿、猞猁、野猪、斑羚和狍的红外相机监测图像的检测与识别上具有更高的精度,图像初期的检测分割处理减少了无效背景的影响,对于树木遮挡、光线变化有较好的鲁棒性,更加满足野生动物监测图像识别的要求。
4. 结论
针对红外自动感应相机在野外环境下拍摄的野生动物监测图像,提出一种基于ROI-CNN的图像自动识别方法,利用基于回归算法的目标检测与全局-局部的双通道卷积神经网络,有效克服复杂背景信息对野生动物监测图像物种识别的干扰。通过实验分析,采用VGG16作为卷积网络的测试准确率最高,对内蒙古赛罕乌拉国家级自然保护区内5种陆生野生动物的平均识别率均可达到90%左右。为了验证本研究算法的有效性,设计了与VGG16、R-CNN、Fast R-CNN算法的对比试验,与5种野生动物的测试准确率和MAP值进行对比,实验结果表明:针对全部5种野生动物,本研究提出算法的测试准确率最高,达到更高的测试MAP值,识别效果最优。
-
![]()
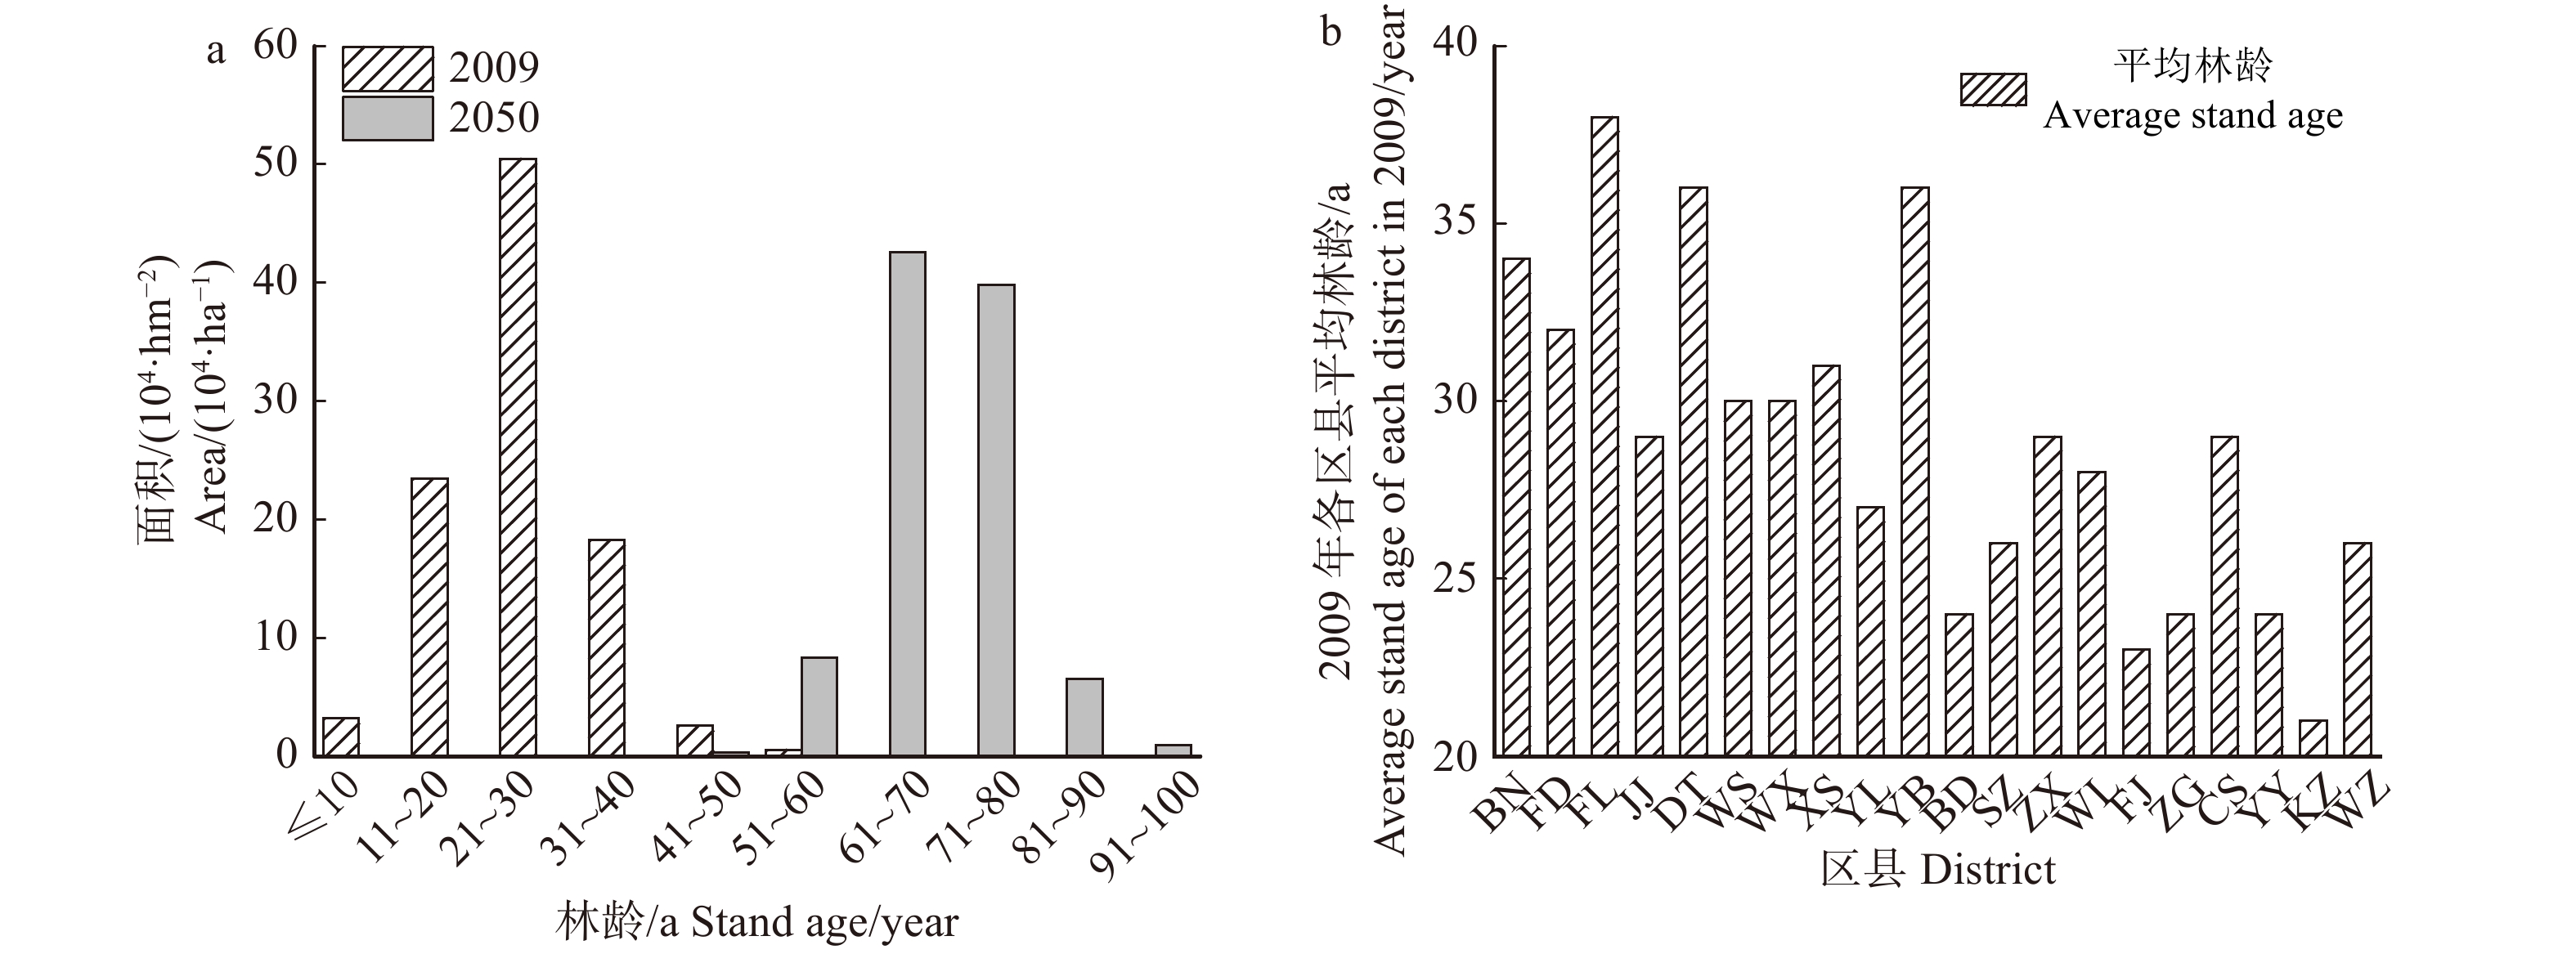
图 2 三峡库区马尾松林的林龄结构
BN. 巴南区;FD. 丰都县;FL. 涪陵区;JJ. 江津区;DT. 主城区;WS. 巫山县;WX. 巫溪县;XS. 兴山县;YL. 夷陵区;YB. 渝北区;BD. 巴东县;SZ. 石柱土家族自治县;ZX. 忠县;WL. 武隆区;FJ. 奉节县;ZG. 秭归县;CS. 长寿区;YY. 云阳县;KZ. 开州区;WZ. 万州区。下同。BN, Banan District; FD, Fengdu County; FL, Fuling District; JJ, Jiangjin District; DT, Downtown; WS, Wushan County; WX, Wuxi County; XS, Xingshan County; YL, Yiling District; YB, Yubei District; BD, Dadong County; SZ, Shizhu Tujia Autonomous County; ZX, Zhongxian County; WL, Wulong District; FJ, Fengjie County; ZG, Zigui County; CS, Changshou District; YY, Yunyang County; KZ, Kaizhou District; WZ, Wanzhou District. Same as below.
Figure 2. Stand age structure of Pinus massoniana forests in the TGRA
![]()
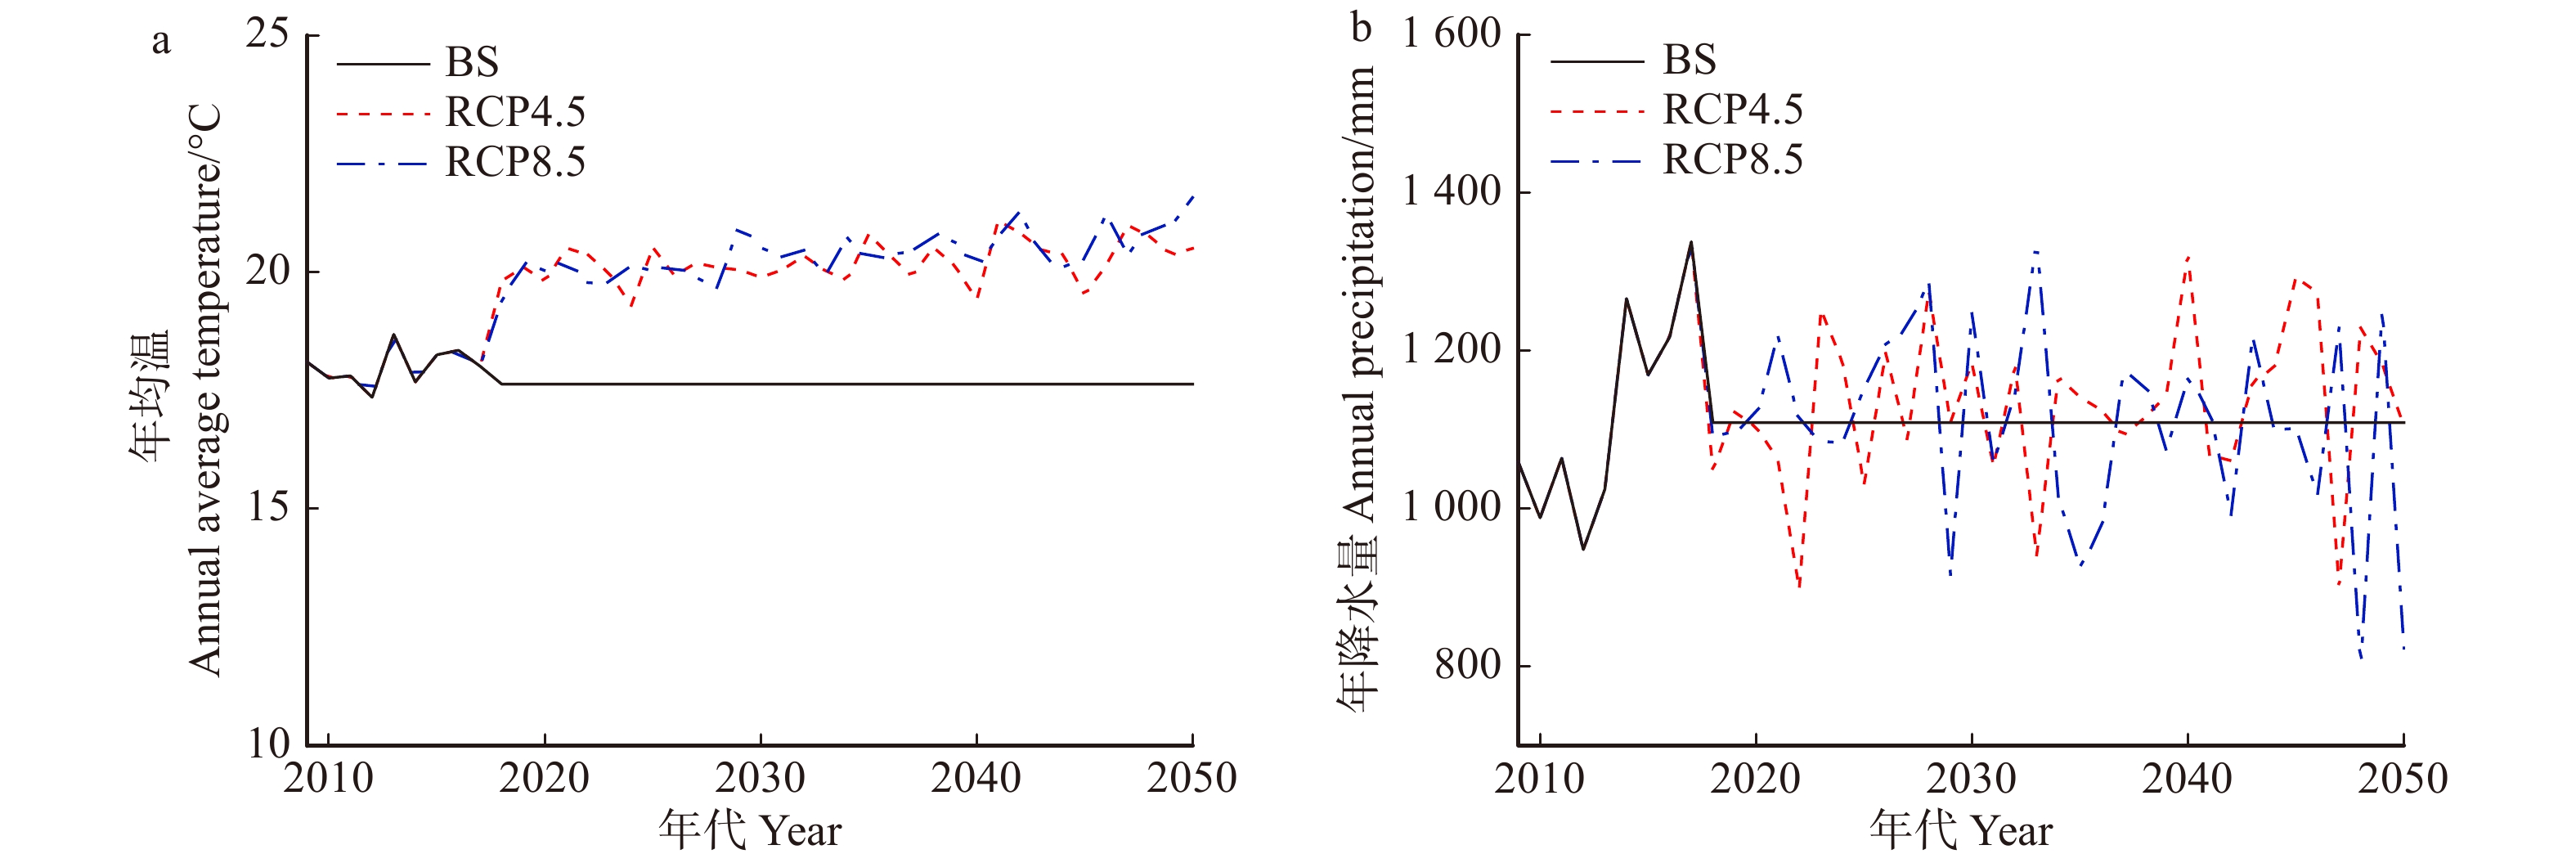
图 3 2009—2050年三峡库区3种未来情景气候特征
BS为基线情景;RCP4.5为中低浓度情景;RCP8.5为高浓度情景。BS, baseline scenario; RCP4.5, medium-low concentration scenario; RCP8.5, high concentration scenario.
Figure 3. Climate characteristics of 3 future scenarios in the TGRA during 2009 to 2050
![]()
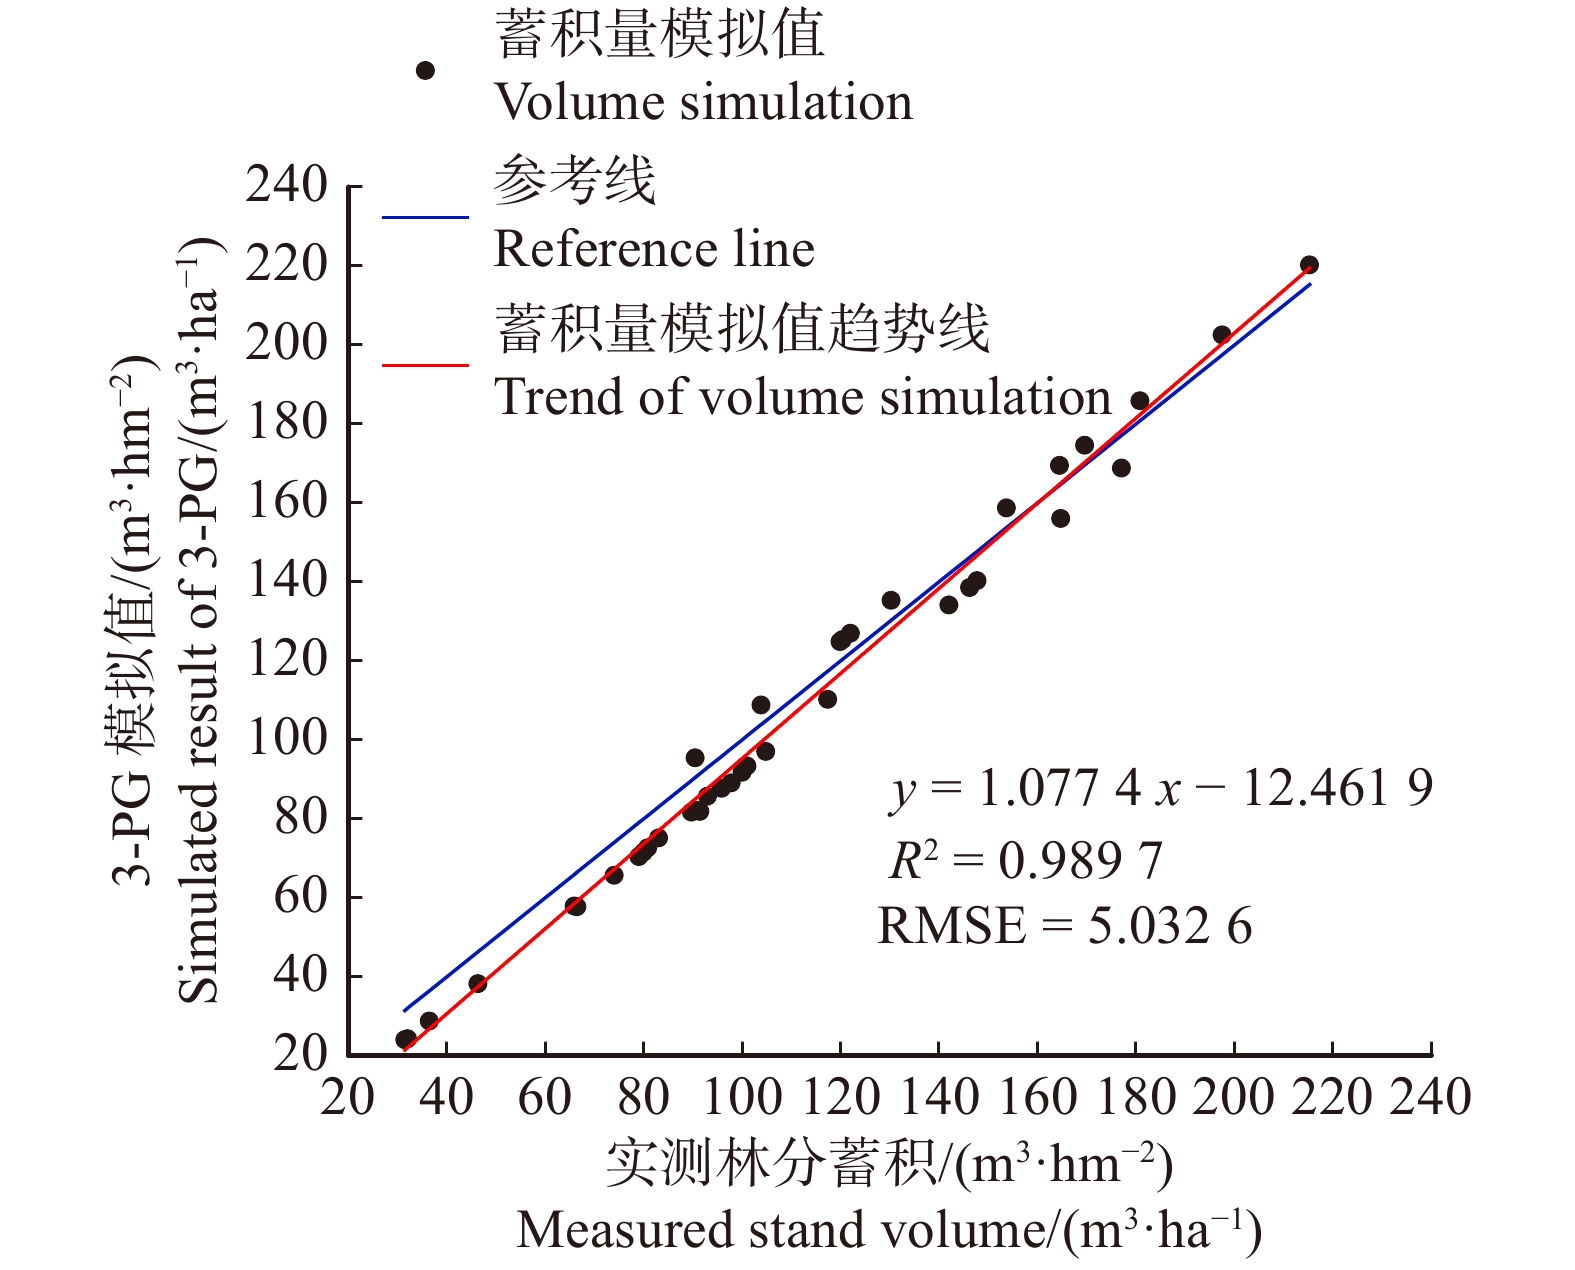
图 4 3-PG模拟值与样地实测蓄积的比较
Figure 4. Comparison between 3-PG model simulated volume and the plot measurement volume
![]()
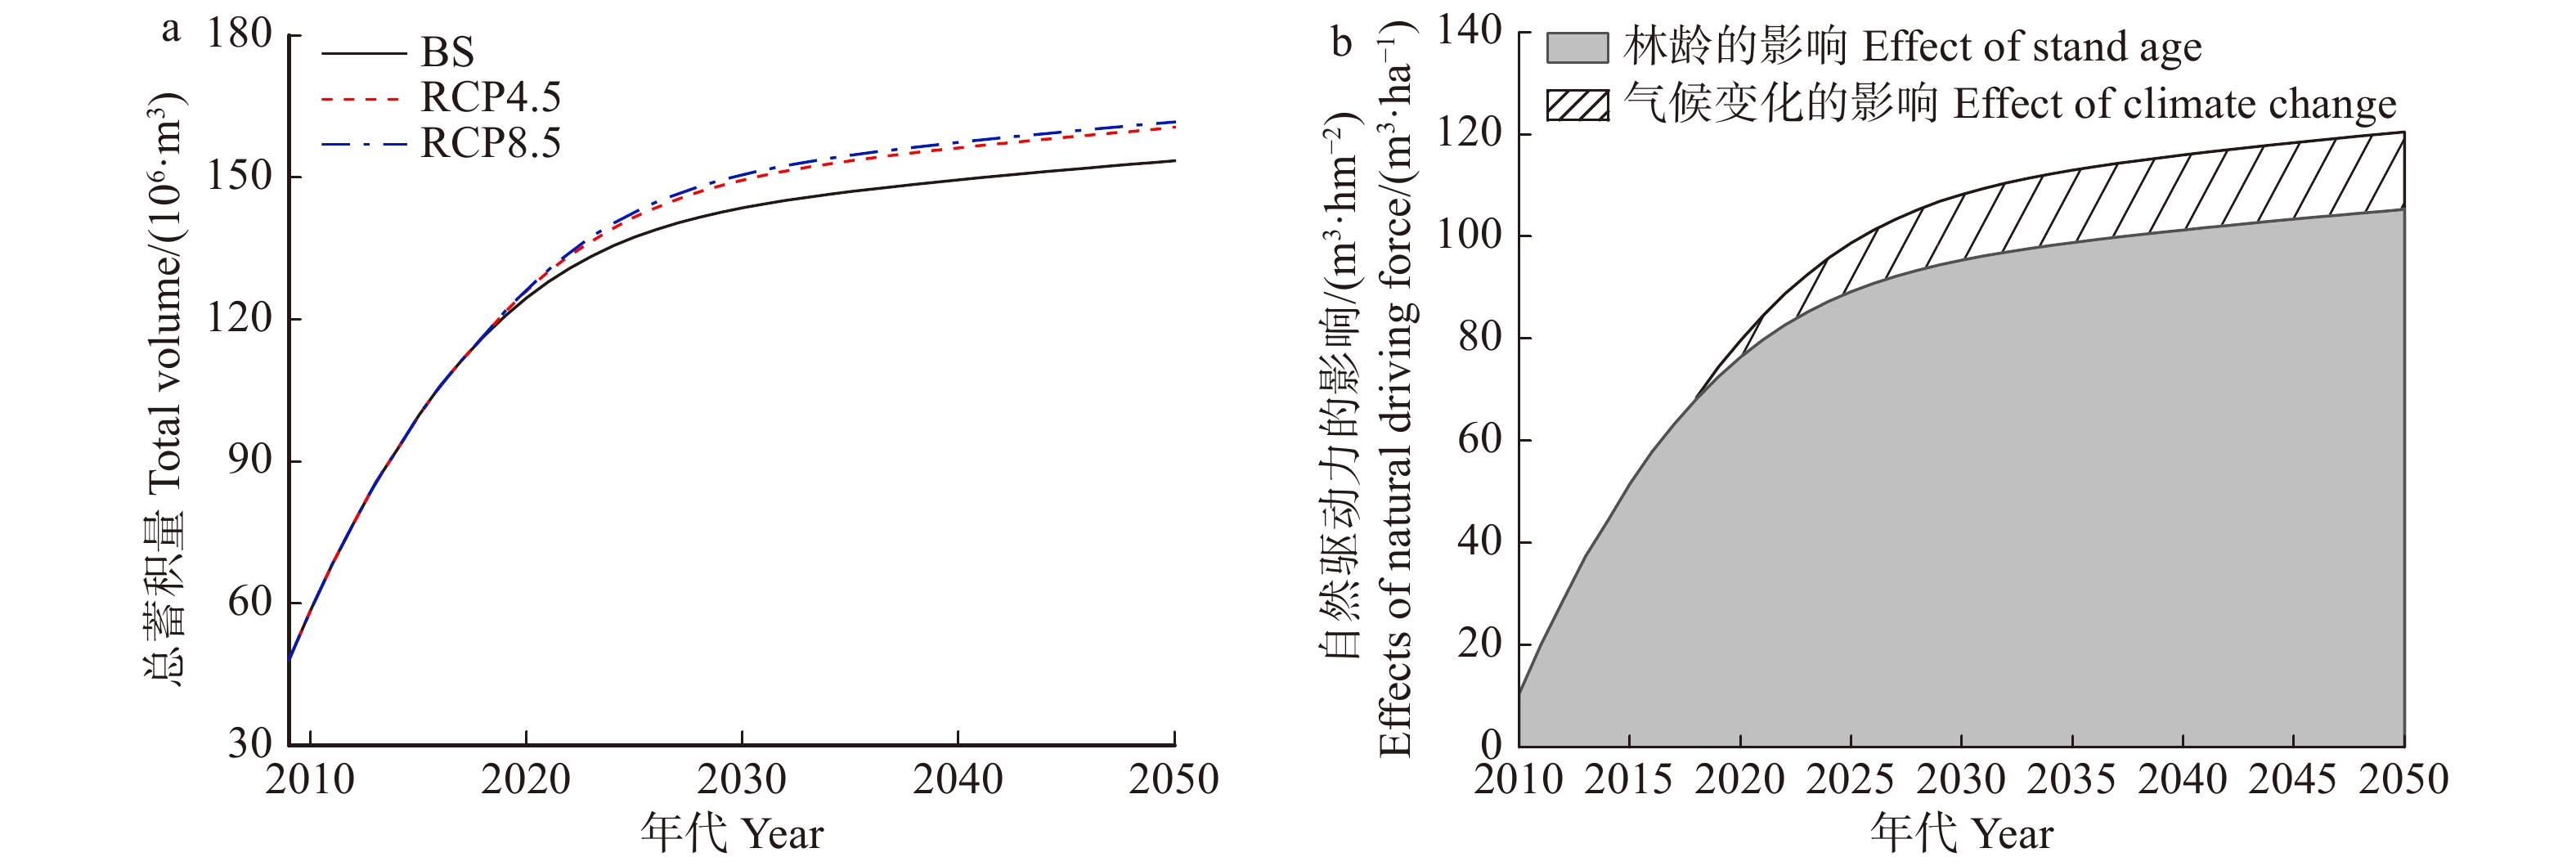
图 5 2009—2050年三峡库区马尾松林蓄积动态及自然驱动力的影响
Figure 5. Dynamics and the impacts of natural driving force on the volume of Pinus massoniana forests in the TGRA during 2009 to 2050
![]()
图 6 自然驱动力对马尾松林蓄积影响的空间分布格局
Figure 6. Spatial distribution patterns of the effects of natural driving force on the Pinus massoniana forest volume
![]()
图 7 自然驱动力对不同区县马尾松林蓄积的影响
Figure 7. Effects of natural driving force on the Pinus massoniana forest volume in different districts
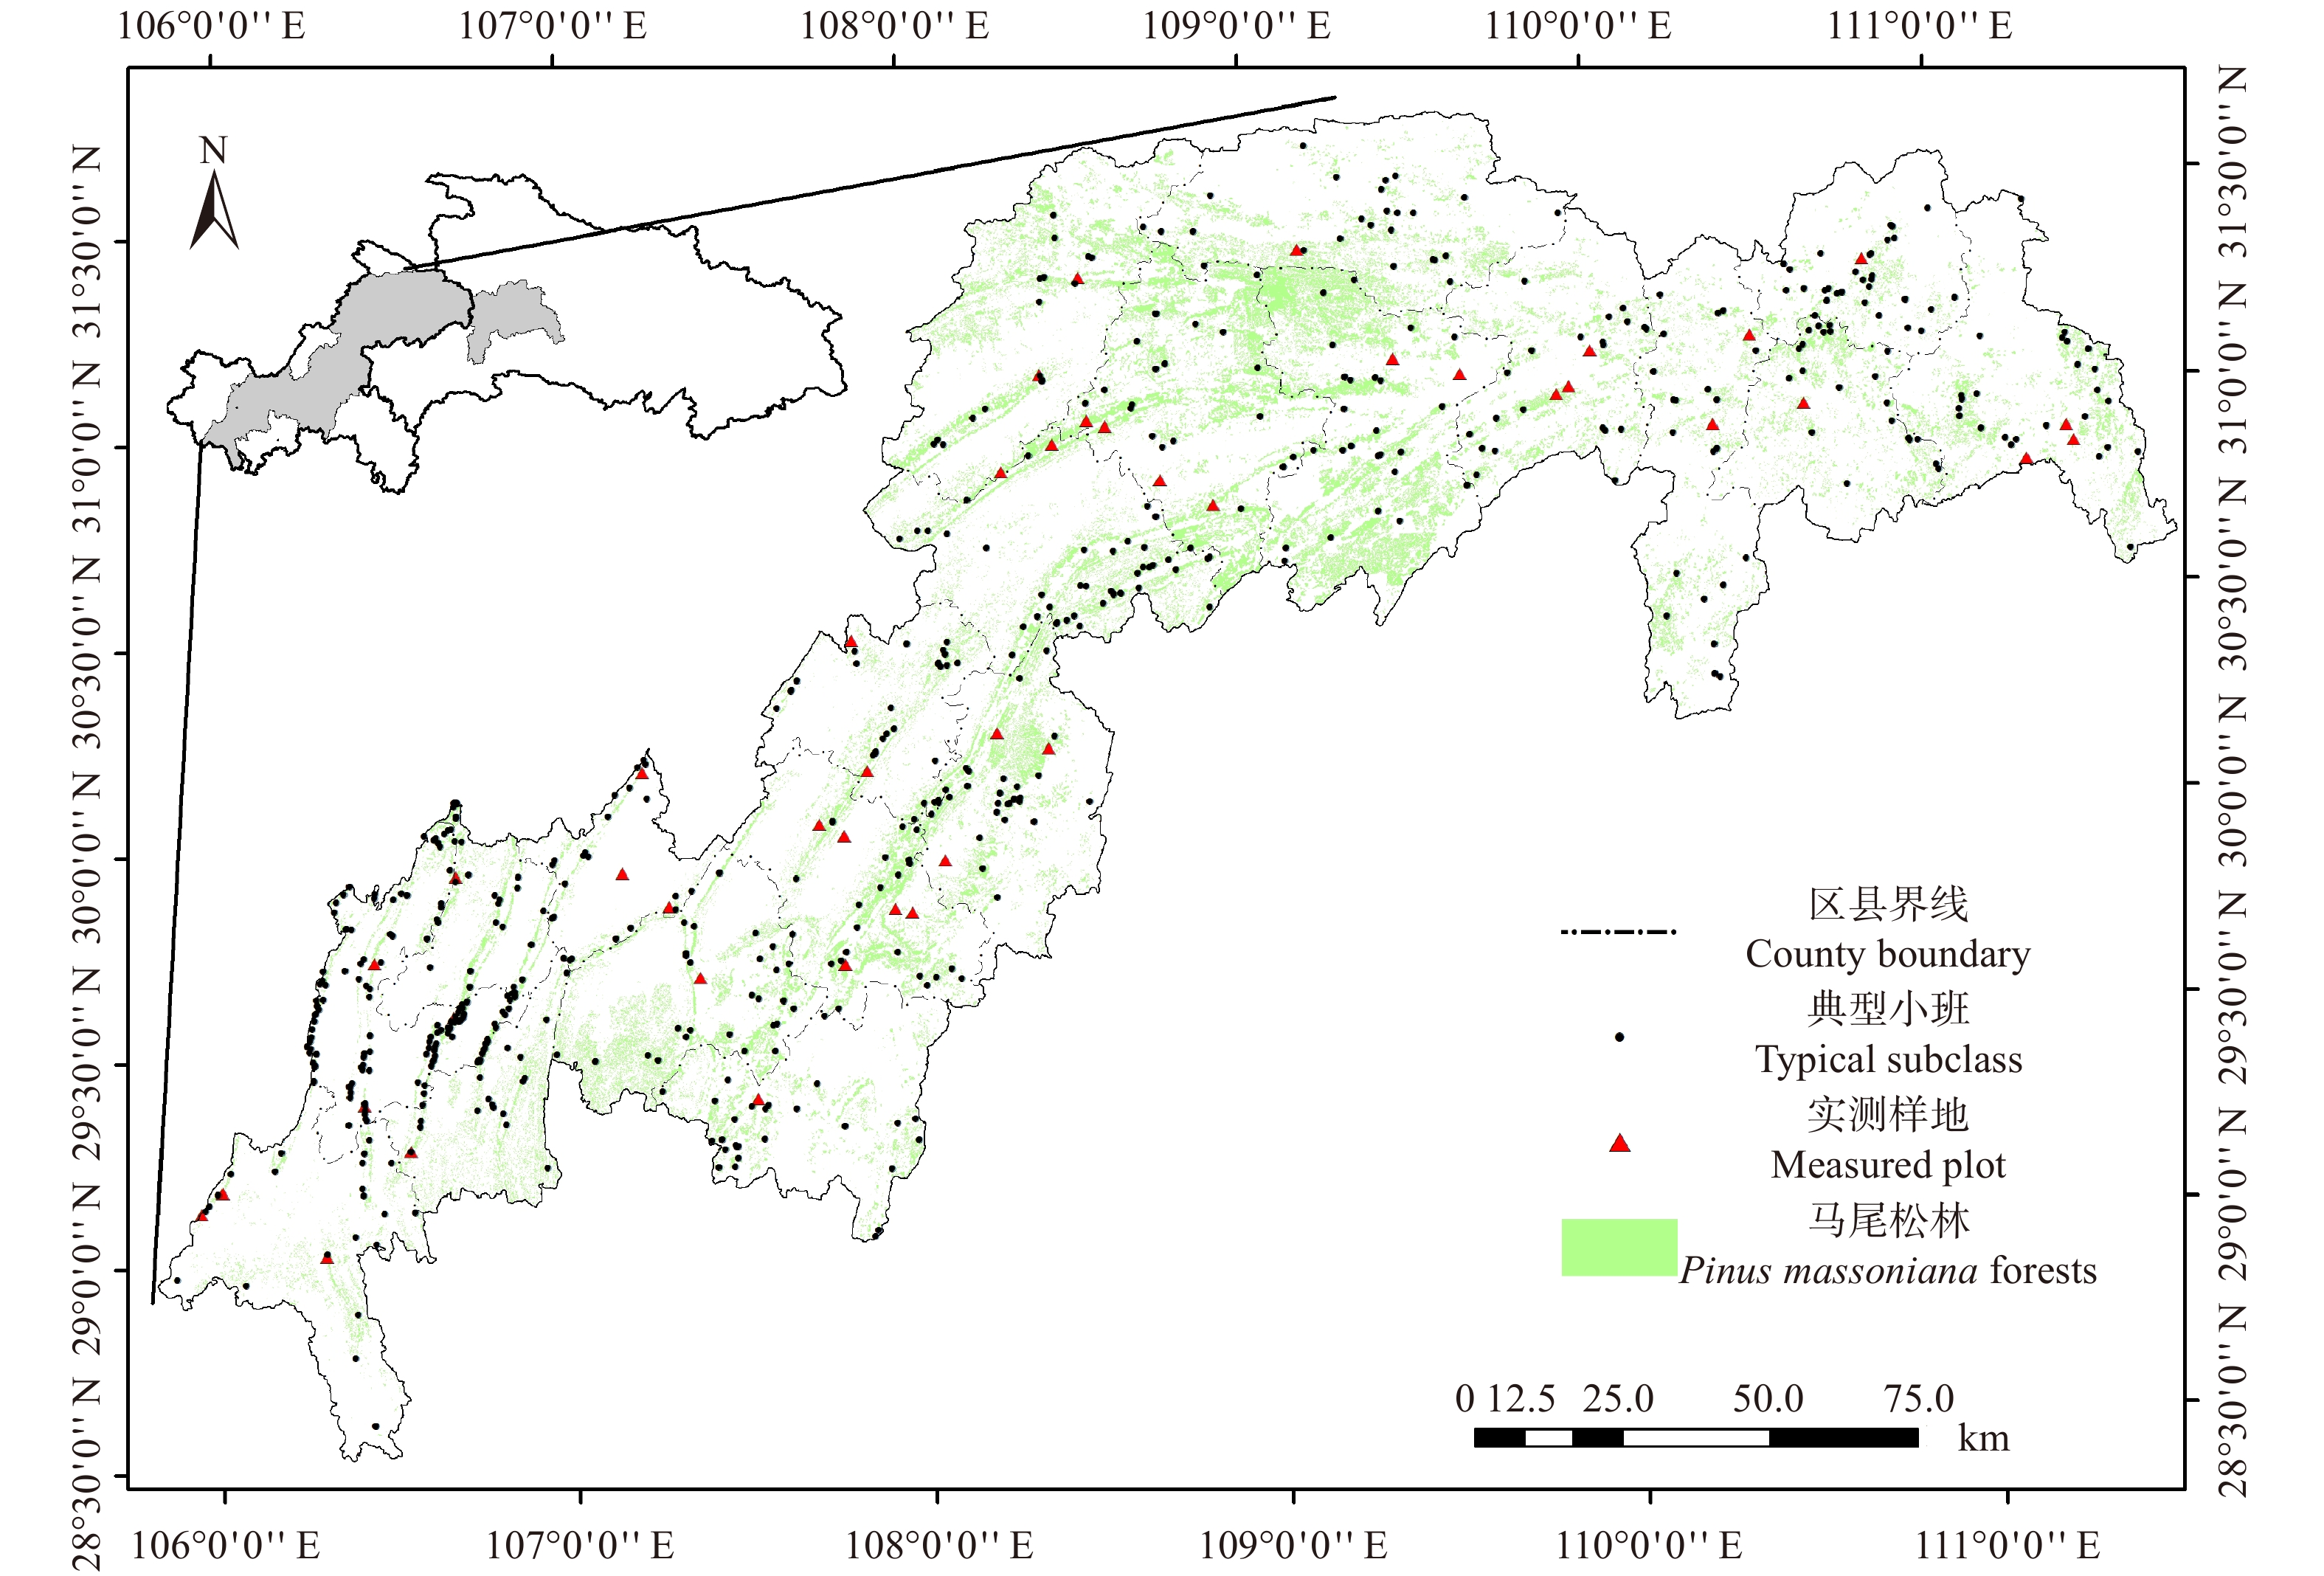
表 1 三峡库区马尾松林概况
Table 1 Description of Pinus massoniana forests in the TGRA
不同尺度
Different scale胸径范围
DBH range/cm树高范围
Tree height range/m林龄范围
Stand age range/a林分密度/(株·hm−2)
Stand density/(tree·ha−1)面积/hm2
Area/ha蓄积
Volume/m3个数
Number三峡库区马尾松林
Pinus massoniana forests
in the TGRA5.0 ~ 46.6 1.9 ~ 18.8 2 ~ 66 84 ~ 3 675 9.86 × 10⁵ 8.09 × 10⁷ 21 073 典型小班
Typical subclass5.0 ~ 46.6 1.9 ~ 18.8 2 ~ 66 105 ~ 3 214 0.03 ~ 36 17.0 ~ 494.6 566 实测样地
Measured plot6.1 ~ 23.0 5.1 ~ 20.0 15 ~ 52 975 ~ 3 475 0.04 ~ 0.06 31.4 ~ 366.4 41  下载: 导出CSV
表 2 3-PG模型参数修正值
Table 2 Modified 3-PG model parameters
参数 Parameter 值 Value 来源 Source 胸径2 cm时树叶与树干分配比 Foliage:stem partitioning ratio with DBH = 2 cm 0.346 9 F 胸径20 cm时树叶与树干分配比 Foliage:stem partitioning ratio with DBH = 20 cm 0.064 7 F 干生物量与胸径关系的常数值 Constant in the relation of stem mass and DBH 0.137 9 F 干生物量与胸径关系的幂值 Power in the relation of stem mass and DBH 2.343 6 F 净初级生产量分配给根的最大比例 Maximum fraction of NPP to roots 0.35 F 净初级生产量分配给根的最小比例 Minimum fraction of NPP to roots 0.25 [22] 生长最低气温 Minimum temperature for growth/℃ 0 [18] 生长最适气温 Optimum temperature for growth/℃ 17.5 [18] 生长最高气温 Maximum temperature for growth/℃ 40 [18] fq = 0.5时的水分亏缺比 Moisture ratio deficit for fq = 0.5 0.5 [18] 水分亏缺比的幂值 Power of moisture ratio deficit 9 D 大树的死亡速率 /(%·a− 1)Mortality rate for large tree/(%·year− 1) 1 D 死亡响应模型 Shape of mortality response 1 D 林分密度为1 000株/hm2时最大立木树干生物量/(kg·株− 1)
Max. stem mass per tree when stand density was 1 000 tree/ha/(kg·tree− 1)300 D 自疏函数中的幂值 Power in self-thinning rule 1.5 D 每株死木叶生物量损失比例 Fraction mean single-tree foliage biomass lost per dead tree 0 [18] 每株死木根生物量损失比例 Fraction mean single-tree root biomass lost per dead tree 0.2 [16] 每株死木干生物量损失比例 Fraction mean single-tree stem biomass lost per dead tree 0.2 [16] 林龄为0时的比叶面积 Specific leaf area at stand age was 0 6.4 [23] 成熟叶的比叶面积 Specific leaf area for mature leaves/(m2·kg− 1) 3.7 [23] 比叶面积为(SLA0 + SLA1)/2时的林龄/a Stand age at which specific leaf area was (SLA0 + SLA1)/2/year 3 [23] 消光系数 Extinction coefficient for absorption of PAR by canopy 0.5 D 冠层量子效率 Canopy quantum efficiency/(mol·mol− 1) 0.033 [18] 净初级生产力/总初级生产力 Ratio of NPP/GPP 0.47 D 最小冠层导度 Minimum canopy conductance/(m·s− 1) 0 [14] 最大冠层导度 Maximum canopy conductance/(m·s− 1) 0.02 [14] 最大冠层导度的LAI LAI for maximum canopy conductance 3 [18] 定义气孔对饱和水汽压差的响应 Defines stomatal response to VPD/(1·mBar− 1) 0.05 [18] 冠层边界层导度 Canopy boundary layer conductance/(m·s− 1) 0.2 [24] 树干材积关系中常数值 Constant in the stem volume relationship 0.000 181 4 F 树干材积关系中胸径的幂值 Power of DBH in the stem volume relationship 2.352 F 树干材积关系中材积的幂值 Power of stocking in the stem volume relationship 1 F 注:F为拟合参数;D为默认参数。 Notes: F means fitting parameters; D means default parameters.
下载: 导出CSV
表 3 2009—2050年3种气候情景的三峡库区马尾松林蓄积
Table 3 Volumes of Pinus massoniana forests under 3 climate scenarios in the TGRA during 2009 to 2050
情景
Scenario蓄积 Volume/(106·m3) 单位面积蓄积/(m3·hm− 2) Volume per hectare/(m3·ha− 1) 2009 2050 平均值
Mean年均增量
Annual average increment2009 2050 平均值
Mean年均增量
Annual average incrementBS 48.22 153.51 130.26 2.60 48.89 155.65 132.08 2.60 RCP4.5 160.50 134.52 2.78 162.74 136.40 3.97 RCP8.5 161.71 135.33 2.81 163.96 137.21 4.00
下载: 导出CSV
表 4 林龄及气候变化对三峡库区马尾松林蓄积的影响
Table 4 Effects of stand age and climate change on Pinus massoniana forest volume in the TGRA
效应
Effect蓄积 Volume/(106·m3) 单位面积蓄积/(m3·hm− 2) Volume per hectare/(m3·ha− 1) 林龄的影响
Effect of stand age气候变化影响
Effect of climate change林龄的影响
Effect of stand age气候变化影响
Effect of climate change2009—2050期间总效应
Total effects during 2009 to 2050105.29 6.99 ~ 8.19 106.76 7.09 ~ 8.31 2009—2050期间年均效应
Annual average effects during 2009 to 20502.60 0.17 ~ 0.20 2.60 0.17 ~ 0.20
下载: 导出CSV
-
[1] 雷相东, 符利勇, 李海奎, 等. 基于林分潜在生长量的立地质量评价方法与应用[J]. 林业科学, 2018, 54(12):116−126. doi: 10.11707/j.1001-7488.20181213 Lei X D, Fu L Y, Li H K, et al. Methodology and applications of site quality assessment based on potential mean annual increment[J]. Scientia Silvae Sinicae, 2018, 54(12): 116−126. doi: 10.11707/j.1001-7488.20181213
[2] Gschwantner T, Alberdi I, Balázs A, et al. Harmonisation of stem volume estimates in European National Forest Inventories[J]. Annals of Forest Science, 2019, 76(1): 24. doi: 10.1007/s13595-019-0800-8
[3] Kotivuori E, Maltamo M, Korhonen l, et al. Calibration of nationwide airborne laser scanning based stem volume models[J]. Remote Sensing of Environment, 2018, 210: 179−192. doi: 10.1016/j.rse.2018.02.069
[4] Lafortezza R, Giannico V. Combining high-resolution images and LiDAR data to model ecosystem services perception in compact urban systems[J]. Ecological Indicators, 2019, 96: 87−98. doi: 10.1016/j.ecolind.2017.05.014
[5] 赵匡记, 王利东, 王立军, 等. 华北落叶松蓄积量及生产力研究[J]. 北京林业大学学报, 2015, 37(2):24−31. Zhao K J, Wang L D, Wang L J, et al. Stock volume and productivity of Larix principis-rupprechtii in northern and northwestern China[J]. Journal of Beijing Forestry University, 2015, 37(2): 24−31.
[6] Chrysafis I, Mallinis G, Tsakiri M, et al. Evaluation of single-date and multi-seasonal spatial and spectral information of Sentinel-2 imagery to assess growing stock volume of a Mediterranean forest[J]. International Journal of Applied Earth Observation and Geoinformation, 2019, 77: 1−14. doi: 10.1016/j.jag.2018.12.004
[7] Mund M, Kummetz E, Hein M, et al. Growth and carbon stocks of a spruce forest chronosequence in central Europe[J]. Forest Ecology and Management, 2002, 171(3): 275−296. doi: 10.1016/S0378-1127(01)00788-5
[8] Pretzsch H, Biber P, Schütze G, et al. Forest stand growth dynamics in Central Europe have accelerated since 1870[J]. Nature Communications, 2014, 5: 4967. doi: 10.1038/ncomms5967
[9] Sampson D A, Wynne R H, Seiler J R. Edaphic and climate effects on forest stand development, net primary production, and net ecosystem productivity simulated for Coastal Plain loblolly pine in Virginia[J/OL]. Journal of Geophysical Research Biogeosciences, 2008, 113: G01003 [2019−03−15]. https://doi.org/10.1029/2006JG000270.
[10] 周蕾, 王绍强, 周涛, 等. 1901— 2010年中国森林碳收支动态: 林龄的重要性[J]. 科学通报, 2016, 61(18):2064−2073. Zhou L, Wang S Q, Zhou T, et al. Carbon dynamics of China’s forests during 1901−2010: the importance of forest age[J]. Chinese Science Bulletin, 2016, 61(18): 2064−2073.
[11] 王少杰, 邓华锋, 向玮, 等. 基于混合模型的油松林分蓄积量预测模型的建立[J]. 西北农林科技大学学报(自然科学版), 2018, 46(2):29−38. Wang S J, Deng H F, Xiang W, et al. Establishment of predicting models for Pinus tabulaeformis stands volume based on mixed models[J]. Journal of Northwest A&F University (Natural Science Edition), 2018, 46(2): 29−38.
[12] 王海宾, 彭道黎, 高秀会, 等. 基于GF-1 PMS影像和k-NN方法的延庆区森林蓄积量估测[J]. 浙江农林大学学报, 2018, 35(6):87−95. Wang H B, Peng D L, Gao X H, et al. Forest stock volume estimates in Yanqing District based on GF-1 PMS images and k-NN method[J]. Journal of Zhejiang A&F University, 2018, 35(6): 87−95.
[13] Landsberg J J, Waring R H. A generalized model of forest productivity using simplified concepts of radiation-use efficiency, carbon balance and partitioning[J]. Forest Ecology and Management, 1997, 95(3): 209−228. doi: 10.1016/S0378-1127(97)00026-1
[14] López-Serrano F R, Martínez-García E, Dadi T, et al. Biomass growth simulations in a natural mixed forest stand under different thinning intensities by 3-PG process-based model[J]. European Journal of Forest Research, 2015, 134(1): 167−185. doi: 10.1007/s10342-014-0841-3
[15] Meyer G, Black T A, Jassal R S, et al. Measurements and simulations using the 3-PG model of the water balance and water use efficiency of a lodgepole pine stand following mountain pine beetle attack[J]. Forest Ecology and Management, 2017, 393: 89−104. doi: 10.1016/j.foreco.2017.03.019
[16] Xie Y L, Wang H Y, Lei X D. Application of the 3-PG model to predict growth of Larix olgensis plantations in northeastern China[J]. Forest Ecology and Management, 2017, 406: 208−218. doi: 10.1016/j.foreco.2017.10.018
[17] Zeng L X, He W, Teng M J, et al. Effects of mixed leaf litter from predominant afforestation tree species on decomposition rates in the Three Gorges Reservoir, China[J]. Science of the Total Environment, 2018, 639: 679−686. doi: 10.1016/j.scitotenv.2018.05.208
[18] Zhao M F, Xiang W H, Peng C H, et al. Simulating age-related changes in carbon storage and allocation in a Chinese fir plantation growing in southern China using the 3-PG model[J]. Forest Ecology and Management, 2009, 257: 1520−1531. doi: 10.1016/j.foreco.2008.12.025
[19] 冯源, 肖文发, 黄志霖, 等. 未来气候变化情景下三峡库区马尾松林生物量固碳动态与空间分异[J/OL]. 生态学杂志, 2019, 38(12) [2019−10−25]. https://doi.org/10.13292/j.1000-4890.201912.019. Feng Y, Xiao W F, Huang Z L, et al. Dynamics and spatial differentiation of biomass carbon sequestration of Pinus massoniana forests in the Three Gorges Reservoir Area under future climate change scenarios[J/OL]. Chinese Journal of Ecology, 2019, 38(12) [2019−10−25]. https://doi.org/10.13292/j.1000-4890.201912.019.
[20] Wang W F, Peng C H, Zhang S Y, et al. Development of TRIPLEX-management model for simulating the response of forest growth to pre-commercial thinning[J]. Ecological Modelling, 2011, 222(14): 2249−2261. doi: 10.1016/j.ecolmodel.2010.09.019
[21] Räty O, Räisänen J, Ylhäisi J S. Evaluation of delta change and bias correction methods for future daily precipitation: intermodel cross-validation using ENSEMBLES simulations[J]. Climate Dynamics, 2014, 42(9−10): 2287−2303. doi: 10.1007/s00382-014-2130-8
[22] 花利忠, 江希钿, 贺秀斌. 3-PG模型在华南尾叶桉人工林的应用研究[J]. 北京林业大学学报, 2007, 29(2):100−104. doi: 10.3321/j.issn:1000-1522.2007.02.017 Hua L Z, Jiang X D, He X B. Application of 3-PG model in Eucalyptus urophylla plantations of southern China[J]. Journal of Beijing Forestry University, 2007, 29(2): 100−104. doi: 10.3321/j.issn:1000-1522.2007.02.017
[23] 李轩然, 刘琪璟, 蔡哲, 等. 千烟洲针叶林的比叶面积及叶面积指数[J]. 植物生态学报, 2007, 31(1):93−101. doi: 10.3321/j.issn:1005-264X.2007.01.012 Li X R, Liu Q J, Cai Z, et al. Specific leaf area and leaf area index of conifer plantations in Qianyanzhou Station of subtropical China[J]. Journal of Plant Ecology (Chinese Version), 2007, 31(1): 93−101. doi: 10.3321/j.issn:1005-264X.2007.01.012
[24] Gonzalez-Benecke C A, Teskey R O, Martin T A, et al. Regional validation and improved parameterization of the 3-PG model for Pinus taeda stands[J]. Forest Ecology and Management, 2016, 361: 237−256. doi: 10.1016/j.foreco.2015.11.025
[25] 解雅麟, 王海燕, 雷相东. 基于过程模型的气候变化对长白落叶松人工林净初级生产力的影响[J]. 植物生态学报, 2017, 41(8):826−839. doi: 10.17521/cjpe.2016.0382 Xie Y L, Wang H Y, Lei X D. Effects of climate change on net primary productivity in Larix olgensis plantations based on process modeling[J]. Chinese Journal of Plant Ecology, 2017, 41(8): 826−839. doi: 10.17521/cjpe.2016.0382
[26] 徐雨晴, 周波涛, 於琍, 等. 气候变化背景下中国未来森林生态系统服务价值的时空特征[J]. 生态学报, 2018, 38(6):1952−1963. Xu Y Q, Zhou B T, Yu L, et al. Temporal-spatial dynamic pattern of forest ecosystem service value affected by climate change in the future in China[J]. Acta Ecologica Sinica, 2018, 38(6): 1952−1963.
[27] Zhao M F, Xiang W H, Deng X W, et al. Application of TRIPLEX model for predicting Cunninghamia lanceolata, and Pinus massoniana, forest stand production in Hunan Province, southern China[J]. Ecological Modelling, 2013, 250: 58−71. doi: 10.1016/j.ecolmodel.2012.10.011
[28] 方精云, 朱江玲, 石岳. 生态系统对全球变暖的响应[J]. 科学通报, 2018, 63(2):136−140. Fang J Y, Zhu J L, Shi Y. The responses of ecosystems to global warming[J]. Chinese Science Bulletin, 2018, 63(2): 136−140.
[29] Alfaro-Sánchez R, Jump A S, Pino J, et al. Land use legacies drive higher growth, lower wood density and enhanced climatic sensitivity in recently established forests[J]. Agricultural and Forest Meteorology, 2019, 276−277: 107630. doi: 10.1016/j.agrformet.2019.107630
[30] 郭晓娜, 苏维词, 李强, 等. 三峡库区(重庆段)地表起伏度及其对生态系统服务价值的影响[J]. 生态与农村环境学报, 2016, 32(6):887−894. doi: 10.11934/j.issn.1673-4831.2016.06.004 Guo X N, Su W C, Li Q, et al. Surface relief degree and its effects on ecosystem service value in the Chongqing section of the Three Gorges Reservoir Region, China[J]. Journal of Ecology and Rural Environment, 2016, 32(6): 887−894. doi: 10.11934/j.issn.1673-4831.2016.06.004
[31] 张强, 万素琴, 毛以伟, 等. 三峡库区复杂地形下的气温变化特征[J]. 气候变化研究进展, 2005, 1(4):164−167. doi: 10.3969/j.issn.1673-1719.2005.04.005 Zhang Q, Wan S Q, Mao Y W, et al. Characteristics of temperature changes around the Three Gorges with complex topography[J]. Advances in Climate Change Research, 2005, 1(4): 164−167. doi: 10.3969/j.issn.1673-1719.2005.04.005
[32] 岳天祥, 范泽孟. 典型陆地生态系统对气候变化响应的定量研究[J]. 科学通报, 2014, 59(3):217−231. Yue T X, Fan Z M. A review of responses of typical terrestrial ecosystems to climate change[J]. Chinese Science Bulletin, 2014, 59(3): 217−231.
[33] 赵志江. 川西亚高山岷江冷杉与紫果云杉对气候的响应[D]. 北京: 北京林业大学, 2013. Zhao Z J. The response of Abies faxoniana and Picea purpurea to climate factors in subalpine of western Sichuan Province, China[D]. Beijing: Beijing Forestry University, 2013.
[34] 郭灵辉, 郝成元, 吴绍洪, 等. 21世纪上半叶内蒙古草地植被净初级生产力变化趋势[J]. 应用生态学报, 2016, 27(3):803−814. Guo L H, Hao C Y, Wu S H, et al. Projected changes in vegetation net primary productivity of grassland in Inner Mongolia, China during 2011−2050[J]. Chinese Journal of Applied Ecology, 2016, 27(3): 803−814.
[35] Agne M C, Beedlow P A, Shaw D C, et al. Interactions of predominant insects and diseases with climate change in Douglas-fir forests of western Oregon and Washington, U. S. A.[J]. Forest Ecology and Management, 2018, 409: 317−332. doi: 10.1016/j.foreco.2017.11.004
[36] Wu J S, Wang T, Pan K Y, et al. Assessment of forest damage caused by an ice storm using multi-temporal remote-sensing images: a case study from Guangdong Province[J]. International Journal of Remote Sensing, 2016, 37(13): 3125−3142. doi: 10.1080/01431161.2016.1194544
[37] Nunery J S, Keeton W S. Forest carbon storage in the northeastern United States: net effects of harvesting frequency, post-harvest retention, and wood products[J]. Forest Ecology and Management, 2010, 259(8): 1363−1375. doi: 10.1016/j.foreco.2009.12.029
[38] Augustynczik A L D, Hartig F, Minunno F, et al. Productivity of Fagus sylvatica under climate change: a Bayesian analysis of risk and uncertainty using the model 3-PG[J]. Forest Ecology and Management, 2017, 401: 192−206. doi: 10.1016/j.foreco.2017.06.061
[39] Schurman J S, Babst F, Björklund J, et al. The climatic drivers of primary Picea forest growth along the Carpathian are changing under rising temperatures[J]. Global Change Biology, 2019, 25(9): 3136−3150. doi: 10.1111/gcb.14721
[40] Büntgen U, Krusic P J, Piermattei A, et al. Limited capacity of tree growth to mitigate the global greenhouse effect under predicted warming[J]. Nature Communications, 2019, 10(1): 2171. doi: 10.1038/s41467-019-10174-4
-
期刊类型引用(13)
1. 柯澳,王宇聪,胡博宇,林琦,李勇,双丰. 基于图像的野生动物检测与识别综述. 计算机系统应用. 2024(01): 22-36 .  百度学术
百度学术
2. 陈明,王善勤. 基于改进YOLOv5s算法和自适应决策的野猪检测方法. 湖南工业职业技术学院学报. 2024(04): 19-24 . 百度学术
3. 杨帆. 基于人工智能下的野生动物识别研究与应用. 中国高新科技. 2024(16): 72-74 . 百度学术
4. 杨拂晓,费龙,闫泰辰. 基于深度学习的野生动物图像识别研究综述. 北京测绘. 2024(09): 1237-1242 . 百度学术
5. 戴天虹,刘超. 基于改进EfficientDet的雪豹红外相机图像检测方法. 哈尔滨理工大学学报. 2023(02): 108-116 . 百度学术
6. 杨雪珂,蒙金超,冯悦恒,林婷婷,王兆君,刘辉. 基于残差卷积神经网络模型的勺嘴鹬动作识别. 热带生物学报. 2023(05): 481-489 . 百度学术
7. 齐建东,马鐘添,张德怀,田赟. 基于BS-ResNeXt-50的密云地区野生动物图像识别. 林业科学. 2023(08): 112-122 . 百度学术
8. 杨琴,安见才让. 遮挡条件下的动物目标检测方法研究进展. 信息技术与信息化. 2023(12): 189-192 . 百度学术
9. 王翰霖,文帅,白俊,李东睿,罗概,林玉成. 红外相机监测目标物种的一种自动化检测方法:以绿尾虹雉为例. 四川动物. 2022(04): 361-369 . 百度学术
10. 李艳杰,召玉龙. 自然保护区亚洲象活动行为监测方法研究. 绿色科技. 2021(22): 63-64+79 . 百度学术
11. 陈建促,王越,朱小飞,李章宇,林志航. 融合多特征图的野生动物视频目标检测方法. 计算机工程与应用. 2020(07): 221-227 . 百度学术
12. 谢将剑,杨俊,邢照亮,张卓,陈新. 多特征融合的鸟类物种识别方法. 应用声学. 2020(02): 199-206 . 百度学术
13. 宫一男,谭孟雨,王震,赵国静,蒋沛林,蒋仕铭,张鼎基,葛剑平,冯利民. 基于深度学习的红外相机动物影像人工智能识别:以东北虎豹国家公园为例. 兽类学报. 2019(04): 458-465 . 百度学术
其他类型引用(20)


计量
- 文章访问数: 2166
- HTML全文浏览量: 852
- PDF下载量: 132
- 被引次数: 33
